스크립트에서 "ma cross"에 대해 찾기

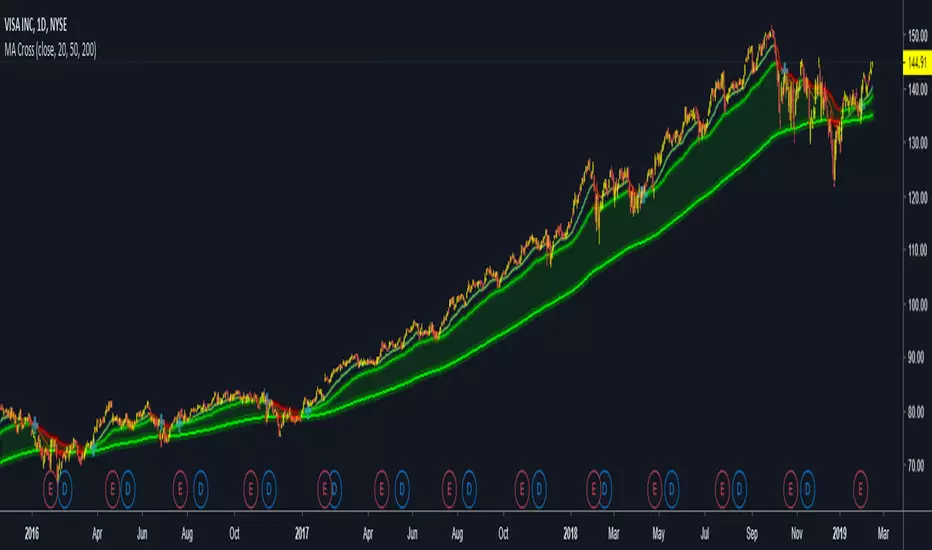
MA Crossover20 Ema
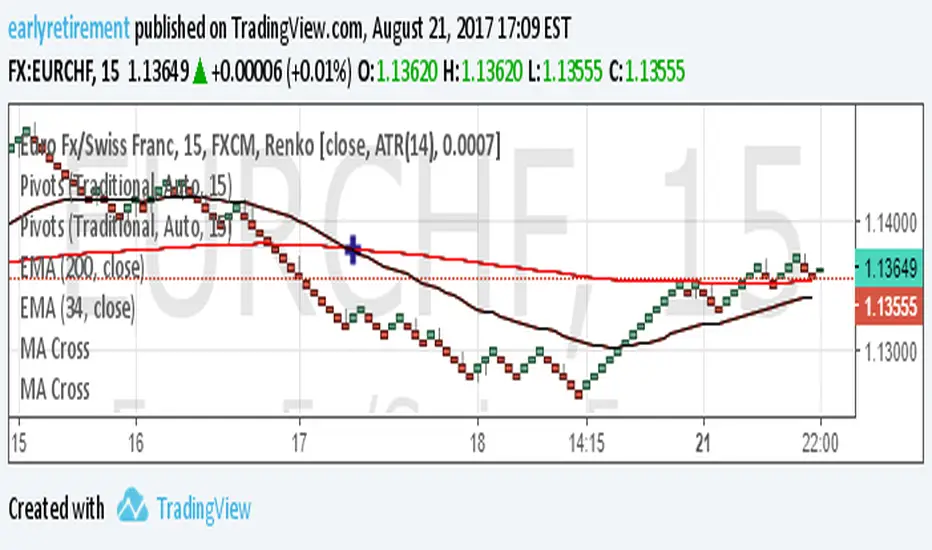
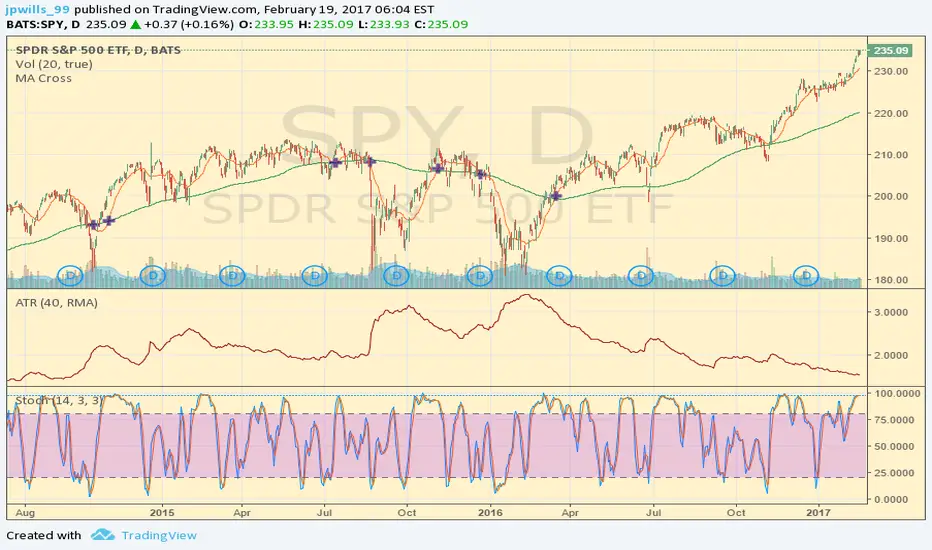
200 Day Crossover
Marks Death and Golden Cross
Useful for longterm time frames and finding trends.
Can be used for intraday scalping but advised to be used with price action and other indicators like Williams %R or VWAP.

MA CrossesMy first build,
Very simple In its design and goal,
8, 21, 50 MAs, simple.
Ind will print a box when MAs are crossed, both bullish and or bearish
Enjoy,
Kurt Hennig
29, 10, 22 build
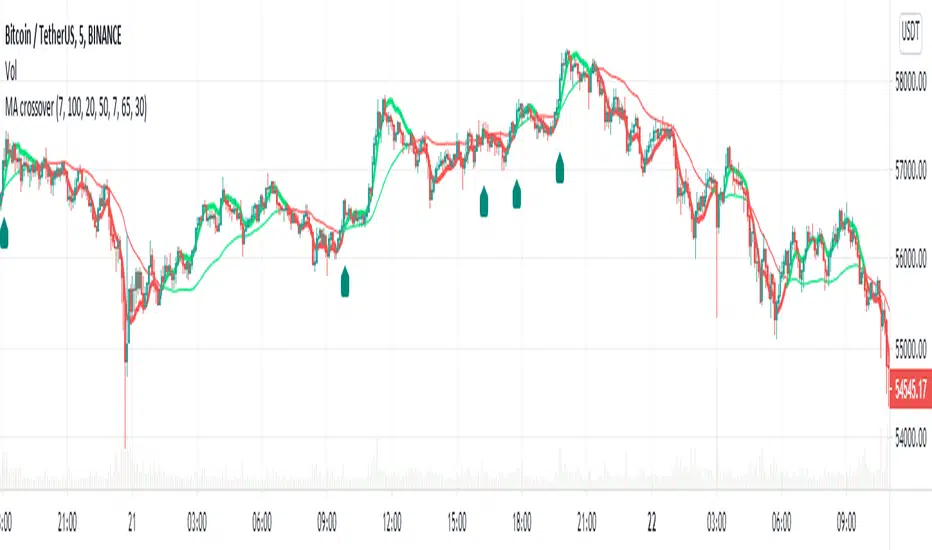
MA Cross + KillzonesCombines oscarvs' BTC Killzones with four EMAs and the trader's 13/49 golden cross as well as the investor's 50/200 golden cross. Note that the killzones highlight the first two hours of market action in each of the three main crypto markets, so this time period will have to be adjusted for daylight savings time in April and in November.

MA Cross + Trend Stats (Probabilistic)Short description (one-liner)
A MA-regime framework with historical regime stats + forward performance + optional trend/noise filters for trending context.
________________________________________
Full description (TradingView-ready)
Overview
This indicator turns a classic Moving Average Cross into a regime-based trend dashboard. Instead of treating a cross as a standalone “buy/sell” event, it measures what historically happened after similar regime shifts on the current symbol and timeframe, and displays the results in a compact table.
It supports:
• EMA or SMA
• Custom fast/slow lengths (including .5 lengths via floor/ceil averaging)
• Optional trend quality filters for trending decisions:
o Slope filter (Slow MA slope)
o Market noise filter using Efficiency Ratio (ER) in real time
________________________________________
What the table shows (how to read it)
The table has two rows: Bull (Fast > Slow) and Bear (Slow > Fast). Metrics are computed on completed regimes (historical segments that already ended).
N
Number of completed regimes measured. More samples generally means more stable estimates.
μ Δ% / Med Δ%
Average and median regime return from regime start to regime end. Median helps reduce the impact of outliers.
⏱ Bars
Average regime duration (in bars). Useful to calibrate realistic holding expectations for trending.
⬆ MFE% / ⬇ MAE%
• MFE (Maximum Favorable Excursion): max move in favor during the regime
• MAE (Maximum Adverse Excursion): max move against during the regime
These are context metrics for typical run-up and typical heat.
ER μ | Hit
Trend-quality proxy:
• ER μ: average Efficiency Ratio during regimes (0–1, higher = more directional / less noisy)
• Hit: % of regimes with ER above the historical threshold you set
Forward performance (+H μ|Hit)
For two user-defined horizons (e.g., +10 / +20 bars):
• μ: average forward return after the cross
• Hit: probability (%) that the forward return was positive
This is designed to provide probabilistic context, not certainty.
________________________________________
“Trending” decision filters (optional)
These filters apply to signals/alerts/markers, not to the raw regime statistics:
1. Slope filter (Slow MA):
Only allow Bull signals if the Slow MA slope is positive (and Bear signals if negative).
2. Market noise filter (ER realtime):
Only allow signals when current ER exceeds your chosen threshold (helps avoid choppy conditions).
________________________________________
Suggested usage (educational)
• Treat Bull/Bear as a regime label (state), not a prediction.
• Use Forward Hit% as an estimate of historical frequency, not a guarantee.
• If ER realtime is below threshold, consider it a noisier environment (higher whipsaw risk).
• Combine with your own risk rules and confirmation (structure, volatility, volume, HTF context, etc.).
________________________________________
Notes
• Results depend on symbol, timeframe, and loaded history.
• Statistics are historical summaries and can change as more data becomes available.
• This tool is intended for research and decision support, not as standalone trade advice.
________________________________________
Disclaimer
This script is for educational and informational purposes only and does not constitute financial, investment, or trading advice. Trading involves risk. You are responsible for your own decisions and risk management.

MA Cross 15/150Simple trend following system. Go long (short) when MA15 crosses above (below) MA150.
MA Crossover StrategyIt is very simple strategy, in this you will will whenever MA 7 crossover MA 30 you will get the Buy and Sell signal. Best time frame to test this strategy is 4 hour and 1 day. Also you can try 1 hour and 15 min time frame

MA Crossover Alerts for Small Quick Profits on 3commas/DCA botDear fellow 3commas users,
This is a the most basic Moving Average crossover technique generating Buy Alerts.
This is especially written for those of you who want to link this basic crossover strategy with your 3commas DCA bot .
Buy Alerts
Moving averages available:
- Simple Moving Average (SMA)
- Exponential Moving Average (EMA)
- Weighted Moving Average (WMA)
- Hull Moving Average (HullMA)
- Volume Weighted Moving Average (VMWA)
- Running Moving Average (RMA)
- Triple Exponential Moving Average (TEMA)
Recommended settings for using with 3commas DCA bot:
Interval:
3m to 15m
3commas bot setup:
- TP/TTP: 0.3%/0.1%,
- Base Order: Your choice ,
- Safety Order: 1.2 * Base order
- Safety Order Volume Scale: 1.2,
- Safety Order Step Scale: 1.5,
- Max Active Deals: Your choice ,
- Price Deviation to Open Safety Order (% from initial order): 0.2%,
- Max Safety Trades Count: 7,
- Simulatenous Deals per Same Pair: 3
> Create Alert with Buy Alert and link it to your bot "Message for deal start signal"
MA Crossover [Alerts]This is a Moving Average Crossover study .
The study comes with all alerts (Long, Short, Take Profit, and Stop Loss).
A few visuals like Exit Loss and Profit/Loss Boxes have been added as well.
The following Moving Averages are supported:
SMA
EMA
DEMA
TEMA
WMA
VWMA
SMMA
HullMA
LSMA
ALMA
SSMA
TMA
ZLEMA
If you’d like to automate this script you can do that by using AutoView, ProfitView, ProfitTrailer, CryptoHopper etc.
Feel free to leave a comment and share it with your friends. Enjoy!


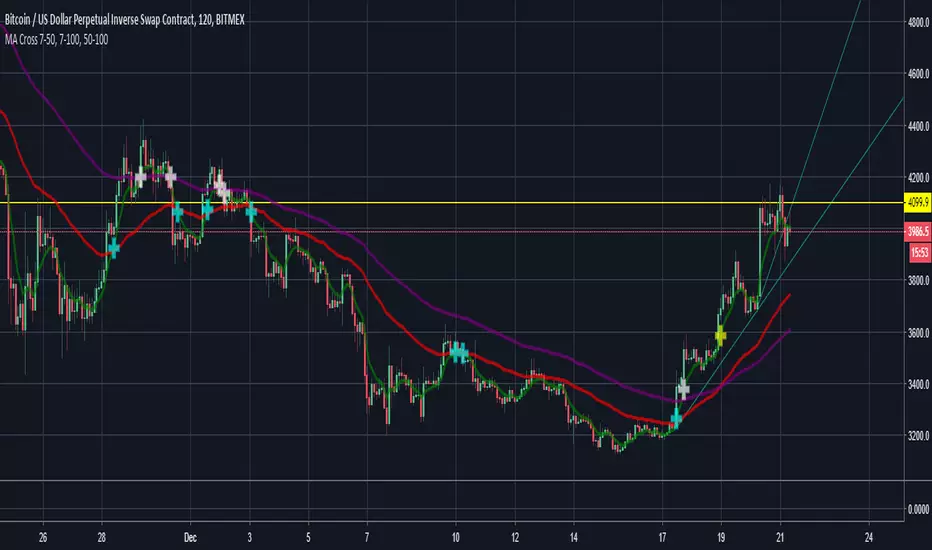
MA Cross 50/200 - Moving Averageindicates short-term 50-day moving average AND long-term 200-day moving average CROSS
@GateTicker


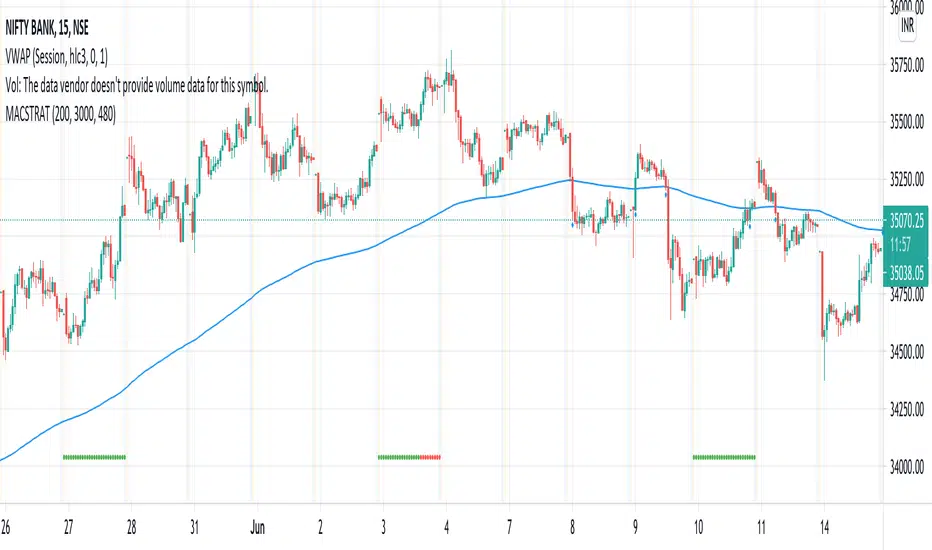
MA Cross Weekly Options ExpiryWorks best with Nifty and Bank Nifty Options. Use this to see red or green signals on weekly contract expiry when price moves beyond or within a configured range
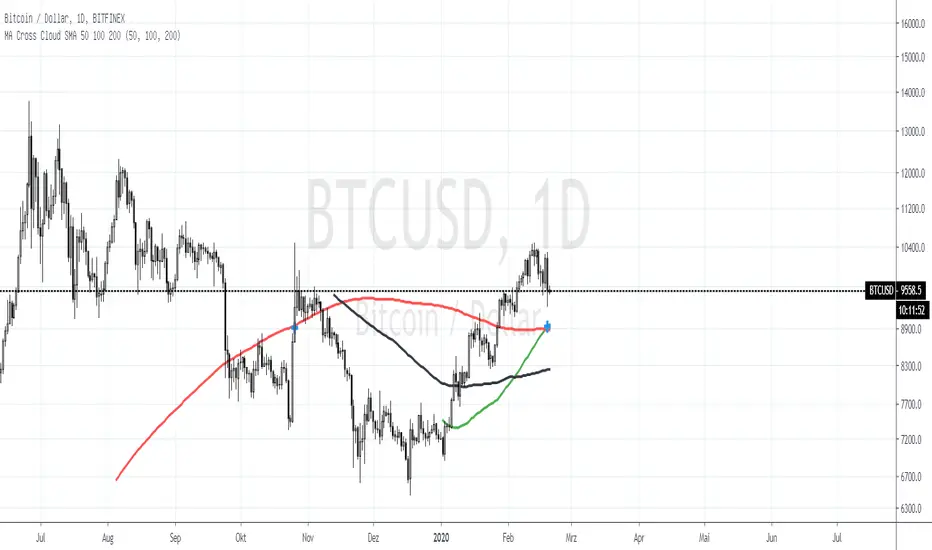
MA Cross Cloud SMA 50 100 200Added a SMA Cloud
Trend direction is better to see.
You can see the colored space between the SMA's. So you can see the strenth of the Trend.
You can see witch cadels in Math.
You can keep the Chart clear, because there is no dirt in the past ;)
Especial if you are leraning it is interesting to see witch Candels are used for math.
Fave fun :) and give me a like :)