LVN Smart Liquidity📊 LVN SMART LIQUIDITY
═════════════════════════════════════════════════════════════
─────────────────────────────────────────────────────────────
🎯 OVERVIEW
LVN Smart Liquidity is an advanced Market Profile-based indicator that automatically identifies Low Volume Nodes (LVN) across multiple timeframes. Unlike traditional volume-based indicators, this tool uses TPO (Time Price Opportunity) calculations to detect price levels where minimal trading activity occurred, revealing potential breakout zones and rapid price movement areas.
These LVN zones often behave similarly to Fair Value Gaps (FVG) in Smart Money Concepts, representing "thin air" areas where price tends to move quickly with minimal resistance. The indicator provides dynamic zone management with an immunity period system to prevent premature zone closure.
─────────────────────────────────────────────────────────────
🔬 HOW IT WORKS
MARKET PROFILE TPO METHODOLOGY:
The indicator analyzes each higher timeframe period by:
1. Dividing the price range into 20 equal levels
2. Counting how many bars touched each level (TPO count)
3. Identifying levels with TPO counts below the threshold (default 30% of maximum)
4. Creating horizontal zones that extend until price touches them
MULTI-TIMEFRAME ANALYSIS:
• Supports up to 5 independent timeframes simultaneously
• Each timeframe generates its own LVN zones with unique colors
• Auto-timeframe mode adapts to your chart period
• Zones project from historical sessions onto current price action
SMART ZONE MANAGEMENT:
• Immunity Period: New zones are protected for N bars after creation (default 20)
• This prevents zones from disappearing immediately when price is already within them
• Zones extend right until price touches them, then stop extending
• Historical zones remain visible for reference (optional)
─────────────────────────────────────────────────────────────
💡 WHY LVN ZONES MATTER
Low Volume Nodes represent price levels where:
✓ Price spent minimal time (rejection zones)
✓ Few market participants were active
✓ Inefficient price discovery occurred
✓ Similar to Fair Value Gaps in ICT/SMC methodology
TRADING APPLICATIONS:
• Breakout Acceleration: Price moves rapidly through LVN zones
• Profit Targets: Place targets beyond LVN zones where momentum slows
• Stop Loss Placement: Avoid placing stops inside LVN zones (price likely to continue)
• Confluence with FVG: LVN zones often align with Fair Value Gaps
• Retest Opportunities: When price revisits LVN, expect quick moves
─────────────────────────────────────────────────────────────
⚙️ KEY FEATURES
TIMEFRAME FLEXIBILITY:
• 5 independent timeframe slots with enable/disable toggles
• Auto-mode intelligently selects higher timeframes
• Preset options: 5m, 15m, 30m, 1H, 2H, 4H, D, W, 2W, M, 3M, 6M, 12M
VISUAL CUSTOMIZATION:
• Individual color settings for each timeframe
• Adjustable box transparency and border width
• Toggle timeframe labels and period dates on/off
• Four text size options: tiny, small, normal, large
ADVANCED CONTROLS:
• LVN Threshold: 0-50% (default 30%) - lower = fewer, stronger zones
• Immunity Period: 0-50 bars (default 20) - prevents premature closure
• Show/Hide old boxes for clean chart appearance
• Maximum 500 boxes supported per timeframe
PROFESSIONAL DISPLAY:
• Zones show timeframe label (5m, 1H, D, etc.)
• Optional period dates (dd.MM-dd.MM format)
• Boxes extend right dynamically until price touch
• Clean visual hierarchy with bordered zones
─────────────────────────────────────────────────────────────
📈 HOW TO USE
SETUP:
1. Add indicator to chart
2. Enable desired timeframes (TF1, TF2, etc.)
3. Adjust LVN threshold based on your trading style:
• 20-25% = Very selective (only thinnest zones)
• 30-35% = Balanced (recommended for most markets)
• 40-50% = More zones (higher sensitivity)
INTERPRETATION:
• RED/DARK ZONES = Low trading activity occurred here
• Price tends to move THROUGH these zones quickly
• Similar behavior to Fair Value Gaps (FVG) in Smart Money theory
• Expect acceleration when price enters LVN zones
TRADING STRATEGIES:
1. BREAKOUT TRADING:
- Wait for price to approach LVN zone
- Enter when price breaks into the zone
- Expect rapid movement through the zone
- Target next support/resistance beyond LVN
2. CONFLUENCE ANALYSIS:
- Combine with other SMC concepts (Order Blocks, FVG, Liquidity)
- LVN + FVG overlap = high-probability acceleration zone
- Use higher timeframe LVN as directional bias
3. MULTI-TIMEFRAME:
- Daily LVN = major breakout zones
- 4H LVN = intraday momentum areas
- 15m LVN = scalping opportunities
─────────────────────────────────────────────────────────────
⚠️ IMPORTANT NOTES
WHAT THIS INDICATOR IS:
✓ Market Profile TPO-based LVN detector
✓ Multi-timeframe zone identification tool
✓ Visual representation of low trading activity areas
✓ Complementary to Smart Money Concepts (SMC/ICT)
WHAT THIS INDICATOR IS NOT:
✗ Not a standalone trading system
✗ Not a guaranteed profit generator
✗ Not financial advice
✗ Requires confirmation from price action and other tools
LIMITATIONS:
• Works best on liquid markets with reliable data
• Lower timeframes may produce excessive zones
• Requires understanding of Market Profile concepts
• Performance depends on proper threshold calibration
BEST PRACTICES:
• Start with 1-2 timeframes, add more as needed
• Use higher timeframes for swing trading
• Combine with support/resistance, trendlines, order blocks
• Backtest on your specific instrument before live trading
• Adjust immunity period based on market volatility
─────────────────────────────────────────────────────────────
🔧 SETTINGS GUIDE
TIMEFRAME GROUPS (1-5):
Each group contains:
• Enable toggle - Turn timeframe on/off
• Timeframe selector - Choose period or Auto
• Box color - Zone fill color
• Border color - Zone outline color
GENERAL SETTINGS:
• LVN Threshold (%) - Percentage of max TPO to qualify as LVN
• Show Old LVN Boxes - Keep historical zones visible
• Box Border Width - Visual thickness (1-4)
• Immunity Period - Protection bars for new zones
• Show Timeframe - Display TF label in boxes
• Show Period - Display date range in boxes
• Text Size - Label size adjustment
─────────────────────────────────────────────────────────────
📊 ORIGINALITY & UNIQUENESS
This indicator is original because:
1. TPO-BASED CALCULATION: Uses Market Profile Time-Price-Opportunity methodology instead of traditional volume analysis, making it work on all markets including those without real volume data (Forex, some indices).
2. IMMUNITY SYSTEM: Unique protection mechanism prevents zones from disappearing immediately when price is already within zone boundaries at creation time.
3. TRUE MULTI-TIMEFRAME: Independent calculation for each timeframe with separate zone management, not simple higher timeframe projection.
4. SMART ZONE LIFECYCLE: Zones dynamically extend until price touch, then become static historical references.
5. FVG-LIKE BEHAVIOR: Bridges traditional Market Profile analysis with modern Smart Money Concepts by identifying zones that behave similarly to Fair Value Gaps.
Unlike existing LVN indicators that rely on volume data, this tool uses time-based analysis, making it universal across all market types and compatible with brokers that don't provide accurate volume information.
─────────────────────────────────────────────────────────────
📚 TECHNICAL BACKGROUND
MARKET PROFILE THEORY:
Developed by J. Peter Steidlmayer in the 1980s, Market Profile analyzes market behavior by examining price and time relationships. Low Volume Nodes in traditional profile represent areas where market participants showed minimal interest.
TPO (TIME PRICE OPPORTUNITY):
Instead of counting volume, TPO counts how many time periods (bars) touched each price level. This approach:
• Works on all markets regardless of volume data quality
• Reflects actual time-based market acceptance/rejection
• Reveals psychological price levels through time distribution
CONNECTION TO SMART MONEY CONCEPTS:
Fair Value Gaps (FVG) in ICT methodology represent similar inefficiencies:
• Areas where price moved too quickly
• Imbalances in buying/selling pressure
• Zones that price may revisit or accelerate through
• LVN zones often overlap with FVG locations
─────────────────────────────────────────────────────────────
🎓 RECOMMENDED RESOURCES
To maximize this indicator's effectiveness, study:
• Market Profile fundamentals (TPO, POC, Value Area)
• Smart Money Concepts (FVG, Order Blocks, Liquidity)
• Multi-timeframe analysis techniques
• Volume Profile comparison (understand the difference)
COMPANION INDICATOR:
Consider using "HVN Smart Liquidity" (opposite concept) to identify both high and low volume zones for complete Market Profile analysis.
─────────────────────────────────────────────────────────────
💬 SUPPORT & FEEDBACK
Questions or suggestions? Feel free to comment below or send a private message.
If you find this indicator useful, please boost and share with other traders!
⚠️ DISCLAIMER: This indicator is for educational purposes only. Trading involves risk. Always do your own research and use proper risk management.
스크립트에서 "liquidity"에 대해 찾기

Opening Range & Session Liquidity [LTS]“Opening Range & Session Liquidity ” is an intraday planning tool that combines a configurable Opening Range box with session highs/lows and previous-day reference levels. It is designed to help you visualize where liquidity is likely to build up around the cash open and major global sessions, without making any forecasts or performance promises. It is designed with our signature attention to user customization and accessibility.
Opening Range & Bias
The script builds a configurable Opening Range (OR) in New York time (default 08:00–08:15 on a 15-minute basis), regardless of your chart timeframe (up to 1-hour). The high, low, and midline of this window are drawn as a transparent box and dashed midline that extend forward so you can see how the session trades around that range.
At a user-defined Bias Check Time (default 09:30–09:31 NY), the script classifies the OR as:
Bullish if price is above the OR high
Bearish if price is below the OR low
Neutral if price is still trading inside the OR
The box color updates to reflect the current bias if bias mode is enabled. All OR parameters (formation window, bias check, colors, maximum number of zones, etc.) are adjustable.
Entry Signal Logic
The indicator can optionally generate non-repainting visual signals when price interacts with the OR midline.
1. 9:30 Bias mode (trend-following)
A directional bias is locked in at the bias check time.
Signals trigger only when price trades through the OR midline inside the box, aligned with that bias:
Bullish bias → long signal when price touches the midline from below and closes inside the range.
Bearish bias → short signal when price touches the midline from above and closes inside the range.
Each “episode” can fire only once; signals are confirmed on the bar where the conditions first become true.
2. Entry Direction mode (reaction to first touch)
Instead of using a fixed 9:30 bias, the script detects from which side price first enters the OR (from above or from below).
That “entry direction” stays active until price fully exits and closes outside the OR again.
When price later touches the midline while the entry direction is defined, a single long or short signal is triggered based on the stored direction of entry.
In both modes, historical signals are plotted without using future data; only the real-time bar can change state until it closes.
Optional TP/SL Visualization
When a long or short signal appears, the script can draw simple take-profit/stop-loss boxes to illustrate a basic one-trade idea:
Stop-loss distance can be defined as:
A fixed number of points beyond the OR high/low, or
A percentage of ATR (configurable length and percent).
Take-profit is automatically placed at a user-defined risk-to-reward multiple of that stop distance.
The boxes extend forward bar by bar and stop updating once either TP or SL is touched, or when a new OR session resets the context.
These boxes are for visualization only and do not place or manage orders.
Session Liquidity & PDH/PDL
To help you map where liquidity frequently builds up, the script tracks three configurable intraday sessions in New York time:
Asian session (default 18:00–02:00)
London session (default 03:00–08:00)
New York session (default 09:30–16:00)
For each completed session, the indicator records the session high and low, then:
Draws solid horizontal lines and labels (e.g., “Asia Hi/Lo”, “London Hi/Lo”, “NY Hi/Lo”).
Extends these solid lines to the right as long as they remain untouched by price.
When price first trades through a level, the solid line is cut at that bar and replaced by a dashed line that extends only until the next session of the same type begins.
Older sessions are automatically removed according to the “Max Sessions to Display” setting to reduce chart clutter.
In addition, the indicator plots:
Previous Day High (PDH) & Previous Day Low (PDL)
Previous Day Point of Control (PDPoC) – an approximate volume-weighted price computed from intraday data using a simple binning approach on a user-chosen lower timeframe.
Like the session levels, PDH/PDL/PDPoC start as solid lines. After the first touch, each level switches to a dashed style and continues only until the following trading day, at which point the previous day’s dashed lines are stopped and new levels are created.
Info Table & Multi-Timeframe Logic
An optional on-chart info table summarizes the most recent Opening Range:
OR high, low, and midline
Current OR range in points
Active mode (9:30 Bias vs. Entry Direction)
Current bias or entry-direction status
Whether a signal is “Waiting”, “Armed”, or “Triggered”
Whether the OR was built from the chart timeframe or from a 15-minute higher-timeframe feed
If your chart timeframe is higher than the OR calculation timeframe, the script automatically uses multi-timeframe data to build a consistent OR, while enforcing a maximum chart timeframe of 1-hour for reliability.
How to Use This Tool
Use the OR box and bias to define your primary intraday context around the cash open.
Use session highs/lows and PDH/PDL/PDPoC as objective reference levels for where price may react or where stops and liquidity might cluster.
Treat the signal markers and TP/SL boxes as visual guides only. They can help you structure trade ideas, but they are not a trading system by themselves.
Always confirm levels and signals with your own analysis, risk management, and execution rules.
Limitations & Notes
The script is intended for intraday charts up to 1-hour. By the nature of the information being displayed, any time frame above that may result is undesirable visual clutter.
The POC calculation is an approximation based on lower timeframe bar-level volume and binning; it is not a tick-by-tick volume profile.
Signals and levels update in real time on the current forming bar. Once a bar closes, completed historical signals do not repaint, but the last live bar can change until it closes.
The indicator does not use lookahead or offset plotting into the past; it is not designed to predict the future or guarantee any particular trading result.
Always test settings on a demo environment first and manage risk according to your own plan.

Market Structure Pro + (@JP7FX)Market Structure Pro Plus (JP7FX)
Market Structure Pro Plus identifies swing highs and swing lows using a three candle confirmation method. It highlights liquidity behaviour and market structure shifts without manual marking.
Swing Point Detection
The indicator marks swing highs and lows when the middle candle in a three candle sequence forms the highest high or lowest low.
This approach reacts to local price behaviour and does not rely on a large lookback period.
Liquidity Grab Signals
The indicator highlights when price trades beyond a previous swing high or swing low and then returns.
These events help users review how liquidity is taken around prior highs and lows.
Break of Structure Signals
The indicator marks a break of structure when a candle closes beyond a previous swing point.
Bullish structure change signals occur when price closes above a prior swing high.
Bearish structure change signals occur when price closes below a prior swing low.
Deviation Stats and Projections
The script tracks how far price extends beyond the last confirmed swing high or swing low, in pips, after liquidity is taken.
It keeps a rolling history of these extensions and calculates an average combined extension for recent moves.
This average is shown in a small stats table as “Avg SD High/Low”.
Using this value, the indicator projects two reference levels from the latest confirmed swing:
• a “Deviation High” line projected from the last swing high
• a “Deviation Low” line projected from the last swing low
These projection lines are drawn as dotted levels with labels and can be used as reference zones based on recent extension behaviour.
Features
• Automatic swing high and swing low detection
• Liquidity grab marking
• Break of structure marking
• Deviation stats table with average extension value
• Projection lines for Deviation High and Deviation Low
• Alerts for liquidity grabs and structure changes
• Market type setting for forex, stock, crypto, commodity and futures
• Customisable colours, line styles and visibility options
• Works across all timeframes and assets
Use Cases
Useful for traders who study market structure, track trend shifts, or review liquidity and extension behaviour around highs and lows.
The indicator reduces manual chart work by highlighting swing points, structure changes and typical extension zones in real time.

QuantMotions - Smart Money BlocksSmart Money Blocks – Clean Edition is a minimalistic, high-precision Smart Money Concepts (SMC) tool designed for traders who want clean and reliable market structure signals without chart clutter.
This script detects and visualizes Order Blocks, Fair Value Gaps (FVGs), and Liquidity Levels using a strictly filtered, volume-based institutional logic.
Unlike many SMC indicators that overload the chart with noise, this version is built to stay fast, clean, and accurate — ideal for both scalpers and higher-timeframe traders.
🔍 Features
✔ Institutional Order Block Detection
• Identifies bullish and bearish order blocks
• Uses high-volume + price-displacement confirmation
• OBs extend forward and deactivate when broken
• Includes volume + tick range info-box
✔ Fair Value Gaps (FVG)
• Auto-detects bullish and bearish FVGs
• Marks imbalance zones until they are fully filled
• Clean, non-intrusive visualization
✔ Liquidity Levels
• Smart swing-high/swing-low liquidity detection
• Tracks touches to distinguish strong vs weak levels
• Marks support/resistance liquidity with labels only (no chart clutter)
⚙️ Clean & Minimal Design
This script is optimized for a clean workflow:
• No volume profile
• No BOS/CHOCH spam
• No unused SMC elements
• Only high-value SMC signals
• Clean color theme for dark charts
The goal is to provide only what matters, nothing more.
📈 Use Cases
• Smart Money / ICT style trading
• Scalping (1s – 1m)
• Intraday / London & New York session trading
• Swing trading
• Market structure analysis
• Liquidity and imbalance mapping
Whether you're identifying points of interest (POIs), building a bias, or mapping high-probability reaction zones — this tool helps you see structure clearly.
🔔 Alerts Included
• Order Block creation
• FVG creation
• Price touching an active Order Block
• Volume surge
• Institutional candle detection
• Structure break detection
Great for automation or bias confirmation.
🧠 Why This Script?
Many SMC indicators try to do everything — which often results in clutter, lag, and unreliable signals.
This edition focuses on precision, clarity, and real usability.
The logic is light, efficient, and suited for real-time execution on very fast charts.
📌 Note
This tool does not generate trade signals by itself.
It is designed as a market structure map for traders who already understand Smart Money principles such as:
• Displacement
• Imbalance
• Institutional candles
• OB mitigation
• Liquidity sweeps
Use it as part of your confluence system.

Gabbie - LiquidityGabbie – Liquidity identifies high-probability liquidity pools on your current trading timeframe. It detects swing highs/lows that fail to meaningfully break prior highs/lows, marking areas where liquidity is most likely resting.
It also plots:
Asia Session High / Low as a key liquidity and mean-reversion zone
Support & Resistance zones derived from recent swing behavior on the active timeframe
This indicator is designed to support discretionary traders who model liquidity, sessions, and structure.
Settings
Adjust the font size of the liquidity labels ($$$).
All other features are optimized to work on default settings.
Limitations / reminder
Liquidity levels are probabilistic. Use alongside confirmation tools and always apply your own risk management.

WaveLab GOLD Study**Description**
`WaveLab GOLD Study – Liquidity & Structure` is an educational chart study that visualizes market structure, liquidity context and confluence.
It is not a trading system and does not generate trade instructions or orders.
**Main Components**
* **Liquidity Engine** – Builds demand/supply-style boxes around strong breaks of structure, high-volume candles and optional FVG conditions.
When price revisits a strong box, the study can plot bar markers:
`B` below the bar for bullish context, `S` above the bar for bearish context.
* **Trend & LR / MTF Context** – Optional EMAs, Donchian, VWAP and a Linear Regression slope with simple angle classification (`strong up / flat / strong down`), plus multi-timeframe RSI to show broader directional background.
* **Price Action Layer** – Detects a small set of classic bar patterns (engulfing, hammer / shooting star, inside / outside bar) and summarizes them into a qualitative bias (bullish, bearish, inside, outside, neutral).
* **Dashboard** – Compact table that displays price, short-term momentum, trend state, PA status, liquidity context and the current B/S confluence marker.
**How to Use (Educational)**
1. Start from liquidity boxes to see where reactions cluster.
2. Add trend, LR and MTF context to understand whether price is moving with or against the broader environment.
3. Use B/S markers and the dashboard only as visual summaries to review bars and build a discretionary framework; they are not entry or exit signals.
**Disclaimer**
This script is for educational and illustrative purposes only.
It does not provide financial advice or recommendations, and any trading decisions remain entirely the user’s responsibility.

ICT Sessions Ranges [SwissAlgo]ICT Session Ranges - ICT Liquidity Zones & Market Structure
OVERVIEW
This indicator identifies and visualizes key intraday trading sessions and liquidity zones based on Inner Circle Trader (ICT) methodology (AM, NY Lunch Raid, PM Session, London Raid). It tracks 'higher high' and 'lower low' price levels during specific time periods that may represent areas where market participants have placed orders (liquidity).
PURPOSE
The indicator helps traders observe:
Session-based price ranges during different market hours
Opening range gaps between market close and next day's open
Potential areas where liquidity may be concentrated and trigger price action
SESSIONS TRACKED
1. London Session (02:00-05:00 ET): Tracks price range during early London trading hours
2. AM Session (09:30-12:00 ET): Tracks price range during the morning New York session
3. NY Lunch Session (12:00-13:30 ET): Tracks price range during typical low-volume lunch period
4. PM Session (13:30-16:00 ET): Tracks price range during the afternoon New York session
CALCULATIONS
Session High/Low: The highest high and lowest low recorded during each active session period
Opening Range Gap: Calculated as the difference between the previous day's 16:00 close and the current day's 09:30 open
Gap Mitigation: A gap is considered mitigated when the price reaches 50% of the gap range
All times are based on America/New_York timezone (ET)
BACKGROUND INDICATORS
NY Trading Hours (09:30-16:00 ET): Optional gray background overlay
Asian Session (20:00-23:59 ET): Optional purple background overlay
VISUAL ELEMENTS
Horizontal lines mark session highs and lows
Subtle background boxes highlight each session range
Labels identify each session type
Orange shaded boxes indicate unmitigated opening range gaps
Dotted line at 50% gap level shows mitigation threshold
FEATURES
Toggle visibility for each session independently
Customizable colors for each session type
Automatic removal of mitigated gaps
All drawing objects use transparent backgrounds for chart clarity
ICT CONCEPTS
This tool relates to concepts discussed by Inner Circle Trader regarding liquidity pools, session-based analysis, and gap theory. The indicator assumes that session highs and lows may represent areas where liquidity is concentrated, and that opening range gaps may attract price until mitigated.
USAGE NOTES
Best used on intraday timeframes (1-15 minute charts)
All sessions are calculated based on actual price movement during specified time periods
Historical session data is preserved as new sessions develop
Gap detection only triggers at 09:30 ET market open
DISCLAIMER
This indicator is for educational and informational purposes only. It displays historical price levels and time-based calculations. Past performance of price levels is not indicative of future results. The identification of "liquidity zones" is a theoretical concept and does not guarantee that orders exist at these levels or that prices will react to them. Trading involves substantial risk of loss. Users should conduct their own analysis and risk assessment before making any trading decisions.
TIME ZONE
Set your timezone to: America/New_York (UTC-5)

Session Liquidity Levels – Indicator for Smart Day Traders🧭 Session Liquidity Levels – Indicator for Smart Day Traders
Identify Key Market Liquidity Zones with Precision
The Session Liquidity Levels indicator automatically plots the most important market levels every day — giving you a clear view of where liquidity is building and where potential reversals or breakouts can occur.
This tool is designed for traders who rely on session structure and clean market levels rather than noise or lagging indicators.
⚙️ Features
✅ Asia Session High & Low – See the overnight range where liquidity starts building.
✅ London Session High & Low – Track the major volatility window and identify sweeps or fakeouts.
✅ Previous Day High & Low – Key reference points for continuation or reversal plays.
✅ Custom Colors & Styling – Personalize line colors and styles to fit your chart theme.
✅ Lightweight & Fast – Built in Pine Script v5 for smooth performance on all assets.
📊 How It Helps
Quickly visualize session highs/lows to plan liquidity grabs or breakout entries.
Mark daily structure without manually drawing lines.
Combine with your existing strategy to refine entry and exit timing.
Works on Forex, Indices, and Metals across all intraday timeframes.
⚡ Best For
Day traders who use session-based strategies (like Asia → London → New York transitions).
Traders studying liquidity sweeps, breakouts, or market structure shifts.
Anyone who wants a clean, automatic way to see session boundaries and key highs/lows.
🕌 Ethical Note
This indicator is 100% original, independently coded, and inspired by common trading concepts such as session ranges and daily structure.
It is not affiliated with or copied from any other paid indicators.
💰 Access
Available as an Invite-Only Script on TradingView.
Once purchased, you’ll receive access within 24 hours.
📩 Support
If you have any issues or want custom modifications (extra sessions, alerts, etc.), contact me directly — I’ll help you set it up.
Trade smarter. Stay disciplined. Let your levels guide you.

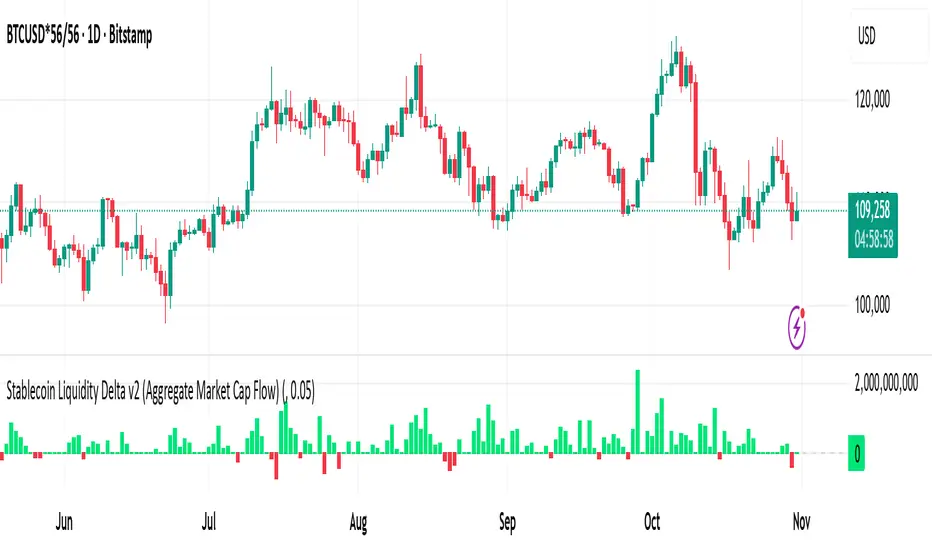
Stablecoin Liquidity Delta v2 (Aggregate Market Cap Flow)Updated version of Stablecoin Liquidity Delta (Aggregate Market Cap Flow).
Hi All,
This indicator visualizes the bar-to-bar change in the aggregate market capitalization of major stablecoins, including USDT, USDC, DAI, and others. It serves as a proxy for monitoring on-chain liquidity and measuring capital inflows or outflows across the crypto market.
Stablecoins are the primary liquidity layer of the crypto economy. Their combined market capitalization acts as a mirror of the available fiat-denominated liquidity in digital markets:
🟩 An increase in the total stablecoin market capitalization indicates new issuance (capital entering the market).
🟥 A decrease reflects redemption or burning (liquidity exiting the system).
Tracking these flows helps anticipate macro-level liquidity trends that often lead overall market direction, providing context for broader price movements.
All values are derived from TradingView’s public CRYPTOCAP tickers, which represent the market capitalization of each stablecoin. While minor deviations can occur due to small price fluctuations around the $1 peg, these figures serve as a proxy for circulating supply and net issuance across the stablecoin ecosystem.
Stablecoin Liquidity Delta (Aggregate Market Cap Flow)Hi All,
This indicator visualizes the bar-to-bar change in the aggregate market capitalization of major stablecoins, including USDT, USDC, DAI, and others. It serves as a proxy for monitoring on-chain liquidity and measuring capital inflows or outflows across the crypto market.
Stablecoins are the primary liquidity layer of the crypto economy. Their combined market capitalization acts as a mirror of the available fiat-denominated liquidity in digital markets:
🟩 An increase in the total stablecoin market capitalization indicates new issuance (capital entering the market).
🟥 A decrease reflects redemption or burning (liquidity exiting the system).
Tracking these flows helps anticipate macro-level liquidity trends that often lead overall market direction, providing context for broader price movements.
All values are derived from TradingView’s public CRYPTOCAP tickers, which represent the market capitalization of each stablecoin. While minor deviations can occur due to small price fluctuations around the $1 peg, these figures serve as a proxy for circulating supply and net issuance across the stablecoin ecosystem.

Simulated Liquidity Zone Heatmap (SLZH) v5 (Stable)# 📈 Simulated Liquidity Zone Heatmap (SLZH) v5 - Order Flow Proxy & Adaptive VWAP
## 💡 Overview
The **Simulated Liquidity Zone Heatmap (SLZH)** is an advanced, stable Pine Script indicator designed to give traders an edge by visualizing **structural market liquidity** and **institutional order flow**. It acts as a powerful proxy for structural zones (like average cost basis) that are often missed by traditional technical analysis.
SLZH achieves this by combining two highly effective components:
1. **Volume-Based Liquidity Zones (VBLZ):** A dynamic, adaptive heatmap based on **Volume-Weighted Average Price (VWAP)** and Standard Deviation.
2. **Order Block (OB) Signals:** Stable, high-conviction signals marking the origin of strong impulsive moves.
---
## 📊 Key Features & Interpretation
### 1. Volume-Based Liquidity Zones (VBLZ) - The Adaptive Heatmap
The VBLZ dynamically paints a three-tiered support/resistance system, representing the market's average cost basis and conviction. This is primarily used as a **mean-reversion tool**.
| Component | Interpretation | Trading Action |
| :--- | :--- | :--- |
| **VWAP Center** (White Line) | The **Center of Liquidity**. Price is often attracted back to this line. | Use as a **Primary Target** when trading from the outer zones. |
| **Strong VBLZ** (Darkest Color) | **Highest Volume Concentration** (1 StdDev). Primary structural support/resistance. | Look for **Reversals** when price enters this zone. |
| **Mid/Weak VBLZ** (Lighter Colors) | Secondary areas of interest. | Use as **Secondary Targets** or to confirm an extended move. |
### 2. Order Block (OB) Signals - Structural Support/Resistance
The OB signals mark the last counter-trend candle before a strong, sustained move, indicating a potential institutional supply or demand zone. These are displayed as stable triangles on the chart.
* **Bullish OB** (Green Triangle Up): Marks a potential **Demand Zone**. Look for high-probability **long entries** when price returns to the area of this signal.
* **Bearish OB** (Red Triangle Down): Marks a potential **Supply Zone**. Look for high-probability **short entries** when price returns to the area of this signal.
---
## 🎯 High-Conviction Trading Strategy
The most effective way to use SLZH is to look for **confluence** between the dynamic VBLZ and the static OB signals. This combination creates the highest probability trade setups.
| Trade Setup | VBLZ Condition | OB Signal Condition | Action | Rationale |
| :--- | :--- | :--- | :--- | :--- |
| **High-Conviction Long** | Price is near or entering the **Strong VBLZ** from above. | A **Bullish OB Signal** is present in the same area. | **Enter Long** | Strong alignment between the market's average cost basis (VBLZ) and a structural demand zone (OB). |
| **High-Conviction Short** | Price is near or entering the **Strong VBLZ** from below. | A **Bearish OB Signal** is present in the same area. | **Enter Short** | Strong alignment between the market's average cost basis (VBLZ) and a structural supply zone (OB). |
### Setting Up Alerts
The script is equipped with three critical alert conditions for automated monitoring:
1. **Price in Strong VBLZ:** Notifies you when price enters the highest conviction heatmap zone.
2. **Bullish OB Signal:** Notifies you when a new Demand Zone is established.
3. **Bearish OB Signal:** Notifies you when a new Supply Zone is established.
---
## ⚙️ Customization (Inputs)
Adjust the indicator's sensitivity via the settings menu:
* **VBLZ Lookback Length:** Controls the recency of the heatmap calculation. **Higher values** create a smoother, longer-term zone.
* **OB Min Price Move (ATR Multiplier):** Filters the Order Blocks. **Increase this value** to show only the highest-conviction zones that led to the most powerful price moves.
---
**Note on Stability:** This is **v5**, a highly stable version optimized to avoid common Pine Script runtime errors. It uses stable `plotshape` signals instead of persistent boxes for the Order Blocks to ensure reliable performance on all charts.

Swing Points & Liquidity — ENHANCED PRO (Dark/Light Mode)This indicator — “Swing Points & Liquidity — ENHANCED PRO (Dark/Light Mode)” — automatically detects and visualizes swing highs, swing lows, and liquidity levels on the chart with rich analytics and customizable visuals.
🔍 Core Features
Smart Swing Detection: Identifies pivot highs/lows based on adjustable left/right bar settings.
Liquidity Visualization: Draws dynamic boxes and lines for liquidity pools and swing zones.
Volume & OI Integration: Filters and colors levels using volume and Open Interest Δ (change).
Strength Meter: Highlights strong liquidity levels with color gradients based on OI + volume intensity.
Automatic Trendlines: Connects swing points with selectable style and width.
Fibonacci Mapping: Automatically projects fib retracements (23.6%, 38.2%, 50%, 61.8%, 78.6%) from swing-to-swing for confluence zones.
Statistics Panel: Displays live metrics — total levels, active/filled count, success rate, and average strength.
Alerts System: Alerts for new swing formations and when price touches or breaks a level.
Multi-Timeframe Option: Analyze swing structures from higher timeframes on any chart.
Dual Theme Mode: Fully optimized for both Dark and Light interface preferences.
⚙️ Advanced Options
Adjustable lookback range
Hide or extend filled levels
Configurable volume and OI thresholds
Supports multiple OI data sources (Binance, BitMEX, Kraken)
Fully dynamic text, color, and label alignment settings
💡 Use Case
Perfect for Smart Money Concept (SMC) and ICT-style analysis, liquidity sweeps, and swing-based trading.
Traders can quickly visualize where liquidity sits, track how it gets filled, and monitor structure shifts in real time.

Estimated Manipulation Movement Signal [AlgoPoint]Follow the Footprints of Whale Movements That Drive the Market
Overview
The market is not always driven by natural supply and demand. Large players—often called "whales" or institutions—can create artificial price movements to trigger stop-losses, induce panic or FOMO, and build their large positions at favorable prices. These events are known as "stop hunts" or "liquidity grabs."
The EMMS indicator is a specialized tool designed to detect these specific moments of potential market manipulation. It does not follow trends in a traditional sense; instead, it identifies high-probability reversal points created by the calculated actions of Smart Money trapping other market participants.
How It Works: The 3-Module Logic
The indicator uses a multi-stage confirmation process to identify a potential stop hunt:
1. Anomaly Detection: The engine first scans the chart for "Anomaly Candles." These are candles with unusually high volume and a very long wick relative to their body. This combination signals a sudden, forceful, and potentially unnatural price push.
2. Liquidity Zone Detection: The indicator automatically identifies and tracks recent significant swing highs and lows. These levels are considered "Liquidity Zones" because they are areas where a large number of stop-loss orders are likely clustered. These are the "hunting grounds" for whales.
3. The Stop Hunt Signal: A final signal is generated only when these two events align in a specific sequence:
An Anomaly Candle (high volume, long wick) spikes through a previously identified Liquidity Zone.
The same candle then reverses, closing back inside the previous price range.
This sequence confirms that the move was likely a "trap" designed to engineer liquidity, and a reversal in the opposite direction is now highly probable.
How to Interpret & Use This Indicator
BUY Signal: A BUY signal appears after a sharp price drop that pierces a recent swing low (taking out the stops of long positions) and then aggressively reverses to close higher. This suggests that Smart Money has absorbed the panic selling they just induced. The signal indicates a potential move UP.
SELL Signal: A SELL signal appears after a sharp price spike that pierces a recent swing high (taking out the stops of short positions) and then aggressively reverses to close lower. This suggests that Smart Money has sold into the FOMO buying they just created. The signal indicates a potential move DOWN.
This indicator is best used as a high-probability confirmation tool, ideally in conjunction with your understanding of the overall market trend and structure.

[Shoshi] Liquidity SuiteChatGPT řekl:
Přemýšlení po dobu 24s
Liquidity Suite
A powerful, modular toolkit for liquidity-based trading — now with level merging, per-TF/global label offsets, and a master Liquidity toggle.
• Highs/Lows from Custom, 4H, D, W, M, Y
• Previous/Current candle anchoring (wick-anchored)
• Per-TF horizontal offsets + a global right-edge offset for tidy columns
• Optional “Merging levels” with % tolerance (e.g., 0.03%) — clusters nearby levels into one label (Y / pM / …) using the highest-TF color
• Custom line style/width/color and label mode (name/price/both), auto visibility by chart TF
• Buyside/Sellside inducements and FVG/Voids (visible count cap)
• NEW: Global “Show Liquidity” switch — instantly hides and clears all liquidity graphics regardless of other settings
• Asia, London, NY, Custom sessions
• Top/Mid/Bottom + open markers/labels
• Horizontal zones and optional vertical markers (Start/Start+End), extendable lines/background
• Killzones/Day/Week/Month opens
• Optional vertical shading; configurable line + label
• Daily/Weekly/Monthly VWAP with styles Line/Step/Area/Circles/Cross
• Right-edge labels (name/price/both), theme-aware colors
• Dark/White theme
• Separate configs per session/VWAP, per-TF level offsets, and merge tolerance
• Optimized for performance with object limits (lines/labels/boxes)
• Clean, uncluttered visuals for focused execution

NDOG & NWOG - Liquidity + Sunday Box rroielDescription:
This script combines NDOG & NWOG liquidity levels with a Sunday Box framework to provide traders with structured levels for weekly bias, liquidity mapping, and potential entry/exit zones.
Features:
• Automatic plotting of NDOG & NWOG liquidity zones.
• Sunday Box (weekly open range) drawn to define structure and bias.
• Highlights liquidity sweeps and retests for trade confirmation.
• Configurable settings for box time, liquidity range, and display options.
• Built to support ROI/EL strategies by aligning liquidity with weekly key levels.
Use Case:
Helps traders identify where price is likely to react by combining liquidity-based zones with the Sunday box framework. Designed for clarity, confluence, and efficiency in execution.

SMC - Institutional Confidence Oscillator [PhenLabs]📊 Institutional Confidence Oscillator
Version: PineScript™v6
📌 Description
The Institutional Confidence Oscillator (ICO) revolutionizes market analysis by automatically detecting and evaluating institutional activity at key support and resistance levels using our own in-house detection system. This sophisticated indicator combines volume analysis, volatility measurements, and mathematical confidence algorithms to provide real-time readings of institutional sentiment and zone strength.
Using our advanced thin liquidity detection, the ICO identifies high-volume, narrow-range bars that signal institutional zone formation, then tracks how these zones perform under market pressure. The result is a dual-wave confidence oscillator that shows traders when institutions are actively defending price levels versus when they’re abandoning positions.
The indicator transforms complex institutional behavior patterns into clear, actionable confidence percentiles, helping traders align with smart money movements and avoid common retail trading pitfalls.
🚀 Points of Innovation
Automated thin liquidity zone detection using volume threshold multipliers and zone size filtering
Dual-sided confidence tracking for both support and resistance levels simultaneously
Sigmoid function processing for enhanced mathematical accuracy in confidence calculations
Real-time institutional defense pattern analysis through complete test cycles
Advanced visual smoothing options with multiple algorithmic methods (EMA, SMA, WMA, ALMA)
Integrated momentum indicators and gradient visualization for enhanced signal clarity
🔧 Core Components
Volume Threshold System: Analyzes volume ratios against baseline averages to identify institutional activity spikes
Zone Detection Algorithm: Automatically identifies thin liquidity zones based on customizable volume and size parameters
Confidence Lifecycle Engine: Tracks institutional defense patterns through complete observation windows
Mathematical Processing Core: Uses sigmoid functions to convert raw market data into normalized confidence percentiles
Visual Enhancement Suite: Provides multiple smoothing methods and customizable display options for optimal chart interpretation
🔥 Key Features
Auto-Detection Technology: Automatically scans for institutional zones without manual intervention, saving analysis time
Dual Confidence Tracking: Simultaneously monitors both support and resistance institutional activity for comprehensive market view
Smart Zone Validation: Evaluates zone strength through volume analysis, adverse excursion measurement, and defense success rates
Customizable Parameters: Extensive input options for volume thresholds, observation windows, and visual preferences
Real-Time Updates: Continuously processes market data to provide current institutional confidence readings
Enhanced Visualization: Features gradient fills, momentum indicators, and information panels for clear signal interpretation
🎨 Visualization
Dual Oscillator Lines: Support confidence (cyan) and resistance confidence (red) plotted as percentage values 0-100%
Gradient Fill Areas: Color-coded regions showing confidence dominance and strength levels
Reference Grid Lines: Horizontal markers at 25%, 50%, and 75% levels for easy interpretation
Information Panel: Real-time display of current confidence percentiles with color-coded dominance indicators
Momentum Indicators: Rate of change visualization for confidence trends
Background Highlights: Extreme confidence level alerts when readings exceed 80%
📖 Usage Guidelines
Auto-Detection Settings
Use Auto-Detection
Default: true
Description: Enables automatic thin liquidity zone identification based on volume and size criteria
Volume Threshold Multiplier
Default: 6.0, Range: 1.0+
Description: Controls sensitivity of volume spike detection for zone identification, higher values require more significant volume increases
Volume MA Length
Default: 15, Range: 1+
Description: Period for volume moving average baseline calculation, affects volume spike sensitivity
Max Zone Height %
Default: 0.5%, Range: 0.05%+
Description: Filters out wide price bars, keeping only thin liquidity zones as percentage of current price
Confidence Logic Settings
Test Observation Window
Default: 20 bars, Range: 2+
Description: Number of bars to monitor zone tests for confidence calculation, longer windows provide more stable readings
Clean Break Threshold
Default: 1.5 ATR, Range: 0.1+
Description: ATR multiple required for zone invalidation, higher values make zones more persistent
Visual Settings
Smoothing Method
Default: EMA, Options: SMA/EMA/WMA/ALMA
Description: Algorithm for signal smoothing, EMA responds faster while SMA provides more stability
Smoothing Length
Default: 5, Range: 1-50
Description: Period for smoothing calculation, higher values create smoother lines with more lag
✅ Best Use Cases
Trending market analysis where institutional zones provide reliable support/resistance levels
Breakout confirmation by validating zone strength before position entry
Divergence analysis when confidence shifts between support and resistance levels
Risk management through identification of high-confidence institutional backing
Market structure analysis for understanding institutional sentiment changes
⚠️ Limitations
Performs best in liquid markets with clear institutional participation
May produce false signals during low-volume or holiday trading periods
Requires sufficient price history for accurate confidence calculations
Confidence readings can fluctuate rapidly during high-impact news events
Manual fallback zones may not reflect actual institutional activity
💡 What Makes This Unique
Automated Detection: First Pine Script indicator to automatically identify thin liquidity zones using sophisticated volume analysis
Dual-Sided Analysis: Simultaneously tracks institutional confidence for both support and resistance levels
Mathematical Precision: Uses sigmoid functions for enhanced accuracy in confidence percentage calculations
Real-Time Processing: Continuously evaluates institutional defense patterns as market conditions change
Visual Innovation: Advanced smoothing options and gradient visualization for superior chart clarity
🔬 How It Works
1. Zone Identification Process:
Scans for high-volume bars that exceed the volume threshold multiplier
Filters bars by maximum zone height percentage to identify thin liquidity conditions
Stores qualified zones with proximity threshold filtering for relevance
2. Confidence Calculation Process:
Monitors price interaction with identified zones during observation windows
Measures volume ratios and adverse excursions during zone tests
Applies sigmoid function processing to normalize raw data into confidence percentiles
3. Real-Time Analysis Process:
Continuously updates confidence readings as new market data becomes available
Tracks institutional defense success rates and zone validation patterns
Provides visual and numerical feedback through the oscillator display
💡 Note:
The ICO works best when combined with traditional technical analysis and proper risk management. Higher confidence readings indicate stronger institutional backing but should be confirmed with price action and volume analysis. Consider using multiple timeframes for comprehensive market structure understanding.

[c3s] CWS - M2 Global Liquidity Index & BTC Correlation CWS - M2 Global Liquidity Index with Offset BTC Correlation
This custom indicator visualizes and analyzes the relationship between the global M2 money supply and Bitcoin (BTC) price movements. It calculates the correlation between these two variables to provide insights into how changes in global liquidity may impact Bitcoin’s price over time.
Key Features:
Global M2 Liquidity Index Calculation:
Fetches M2 money supply data from multiple economies (China, US, EU, Japan, UK) and normalizes using currency exchange rates (e.g., CNY/USD, EUR/USD).
Combines all M2 data points and normalizes by dividing by 1 trillion (1e12) for easier visualization.
Offset for M2 Data:
The offset parameter allows users to shift the M2 data by a specified number of days, helping track the influence of past global liquidity on Bitcoin.
BTC Price Correlation:
Computes the correlation between shifted global M2 liquidity and Bitcoin (BTC) price, using a 52-day lookback period by default.
Correlation Quality Display:
Categorizes correlation quality as:
Excellent : Correlation >= 0.8
Good : Correlation >= 0.6 and < 0.8
Weak : Correlation >= 0.4 and < 0.6
Very Weak : Correlation < 0.4
Displays correlation quality as a label on the chart for easy assessment.
Visual Enhancements:
Labels : Displays dynamic labels on the chart with metrics like M2 value and correlation.
Plot Shapes : Uses shapes to indicate data availability for global M2 and correlation.
Data Table : Optionally shows a data table in the top-right corner summarizing:
Global M2 value (in trillions)
The correlation between global M2 and BTC
The correlation quality
Optional Debugging:
Debug plots help identify when data is missing for M2 or correlation, ensuring transparency and accurate functionality.
Inputs:
Offset: Shift the M2 data (in days) to see past liquidity effects on Bitcoin.
Lookback Period: Number of periods (default 52) used to calculate the correlation.
Show Labels: Toggle to show or hide labels for M2 and correlation values.
Show Table: Toggle to show or hide the data table in the top-right corner.
Usage:
Ideal for traders and analysts seeking to understand the relationship between global liquidity and Bitcoin price. The offset and lookback period can be adjusted to explore different timeframes and correlation strengths, aiding more informed trading decisions.

Real-Time Swing High/Low Detector with liquidity sweepThis script identifies the most important market structure points (swing highs/lows) and liquidity sweeps in a configurable and timeframe-adaptive manner.
By default:
It shows 5 recent swing highs and lows to keep your charts readable.
It detects and illustrates up to 3 Liquidity Sweeps (very close new highs/lows to earlier extremes).
It automatically adjusts how tight the sweep detection is based on your chart’s timeframe to balance precision and noise.
You can tweak all these numbers via the input settings panel to customize the indicator to your personal trading style and chart preferences
Configurable Parameters
Pivot Length (pivot_length)
What it does: Determines how many bars to the left and right the script looks at when identifying swing highs and lows.
Effect: Increasing this value results in fewer, more significant swings; decreasing it makes the indicator more sensitive and detects more swings.
Default: 5
Suggested: Adjust based on your trading timeframe and style to balance sensitivity and noise.
Show Labels (show_labels)
What it does: Toggles the display of swing labels such as HH, HL, LH, LL on the chart.
Effect: If enabled, the script marks swing points with their corresponding label for easier visual reference.
Default: true
Use: Turn off if you prefer a cleaner chart without textual swing indicators.
Show Current Levels (show_current_levels)
What it does: Toggles horizontal lines extending from the latest swing highs and lows.
Effect: Provides visual support/resistance zones on the chart.
Default: true
Use: Helpful for visualizing major price levels based on recent swings.
Max Swing Points (max_swings)
What it does: Limits the number of swing points stored and displayed.
Effect: Prevents chart clutter and performance issues by controlling history length.
Default: 20
Use: Increase for longer history; decrease for lighter charts.
Liquidity Sweep Threshold (liq_sweep_threshold_pc)
What it does: Defines the maximum percentage price difference allowed to consider a new high/low "very close" to the previous one, detecting a Liquidity Sweep.
Effect: Controls how sensitively the script detects these sweep points.
Default: Automatically set based on chart timeframe:
For timeframes below 1 hour: 0.05% (stricter, less tolerant)
For 1 hour and above: 0.1% (more tolerant)
Use: This dynamic setting ensures relevance of Liquidity Sweeps across different timeframes.
Liquidity Sweep Label Transparency (liq_sweep_alpha)
What it does: Controls the opacity of "Liquidity Sweep" labels, with 0 being fully opaque and 255 fully transparent.
Default: 10 (mostly opaque but slightly transparent)
Use: You can increase this value if you want the labels to be more subtle.

CHoCH + BOS + LQ Sweep v6.3.8 PRO+The CHoCH + BOS + LQ Sweep PRO indicator is a comprehensive Smart Money Concepts (SMC) tool designed to identify market structure shifts, liquidity sweeps, and key supply-demand zones across multiple timeframes. It helps traders visualize crucial price action patterns like Change of Character (CHoCH), Break of Structure (BOS), and liquidity grabs that often precede significant market reversals or continuations.
This tool is especially suited for traders applying multi-timeframe analysis and liquidity-based trading strategies on Forex, crypto, indices, or commodities.
1. Liquidity Sweeps (LQ Sweeps)
Identifies when price sweeps previous highs/lows (stop hunts/liquidity grabs).
Configurable strength setting to filter minor vs. major sweeps.
Optional stop at wick or stop at close logic for more precise entries.
Old sweeps can be displayed or hidden, with user-defined limits for historical sweeps.
2. Multi-Timeframe (HTF) Sweeps
Displays liquidity sweeps from higher timeframes (M15, H1, H4, D1, W1).
Individual checkboxes allow flexible combinations (e.g., show only H1 & H4 sweeps).
Unique colors for each timeframe to differentiate visually on the chart.
3. Supply/Demand Zones
Automatically plots zones around swing highs and lows.
Zones are dynamically updated and locked once price interacts with them.
Configurable view: Show both bullish/bearish zones or filter for one side only.
Option to display/hide old zones and limit the number of zones shown.
4. Historical Sweep Management
Stores up to 5000 sweeps internally, while adhering to TradingView’s rendering limits (max 500 drawn).
Ensures chart clarity by prioritizing the most recent sweeps.

Time-based LiquidityThis TradingView indicator identifies key liquidity zones based on previous highs and lows across multiple timeframes:
Monthly High/Low: Shows the previous month’s high and low levels, often acting as strong liquidity points where price may reverse or sweep before continuation.
Weekly High/Low: Highlights the previous week’s high and low, useful for short- to medium-term traders tracking breakout or fakeout zones.
Daily High/Low: Marks the high and low of the previous day, commonly targeted during intraday moves or liquidity grabs.
Session Zones (London & New York): Plots real-time highs and lows during the London and New York trading sessions. These zones are critical for identifying short-term liquidity sweeps and intraday volatility.
Traders use this tool to spot potential liquidity grabs, displacement entries, and reversal or continuation setups around institutional levels.

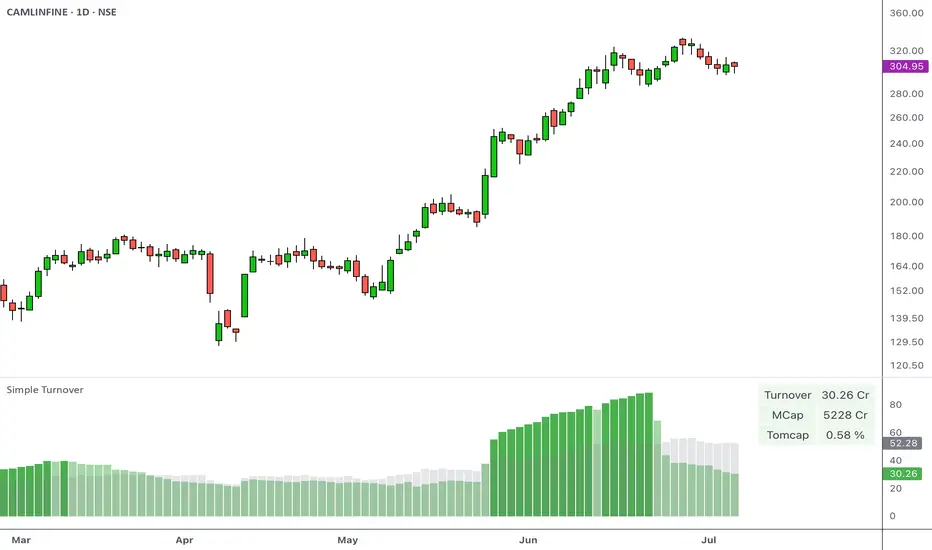
Simple Turnover with TOMCAPOverview
Turnover, or the total value traded over a given period, helps you gauge whether there’s enough liquidity in the instrument being traded. This indicator calculates the average turnover and presents it as a bar-by-bar plot. It also calculates the turnover-to-market capitalization (Tomcap) ratio, and presents this in a configurable table or text summary.
Introduction
Volume indicates the total number of shares that have been bought or sold in a specific period or during the trading day.
A company's market capitalization at any given time can be determined by multiplying its stock price by the number of shares outstanding.
Share turnover is a measure of stock liquidity, calculated by dividing the total number of shares traded during some period by the average number of shares outstanding for the same period. The higher the share turnover, the more liquid company shares are.
Compared to traditional volumes, potting the change in turnover can provide a better representation of the flow of money.
At its simplest, the daily turnover on each bar is computed as the closing price for a stock multiplied by its average volume:
turnover = volume * close / 10000000
The script calculates this by using average prices for both:
turnover = sma_volume * sma_close / 10000000
Script Basics
The script computes & plots the n-period average turnover by multiplying the moving average of price and volume.
By default, the market cap is plotted bar by bar as a background behind the turnover bars.
Every time the turnover reaches a new high in a quarter, the color of the turnover bars turns dark green. This represents the HTQ (Highest Turnover in a Quarter) , and multiple consecutive HTQs indicate a significant influx of funds into that stock.
Uses
The primary purpose of the script is to assist traders in making more informed decisions regarding stock selection.
1. Screen out non-tradable stocks
Quickly spot low-turnover names (illiquid stocks) to avoid wide spreads. Filter out any stocks whose average daily turnover is below, say, ₹5 Cr. This helps in eliminating tickers whose average turnover never clears your minimum threshold.
Example of a high-turnover stock:
Example of a low-turnover stock:
2. Turnover expansion
Observe when the average turnover suddenly expands from its previously subdued values. This occurs when money begins to flow in due to a catalyst, sectoral push, news flow, or any institutional activity.
Example:
3. Relative liquidity comparison
Even average turnover can sometimes overlook the context if we don’t know the company's size. That’s why the script also measures:
Turnover vs. Market cap (TOMCAP) , answering “What percent of the company’s value trades each day?”
Turnover vs. Free Float (TOFF) , showing liquidity against shares actually available for trading.
For example:
A small-cap stock with ₹1 Cr turnover but only ₹50 Cr market cap (Tomcap = 2 %)
vs. a large-cap with ₹10 Cr turnover and ₹20,000 Cr cap (Tomcap = 0.05 %)
Customization
A. Appearance
Dark Mode toggle switches colors to match your dark layout
Show turnover in Crores or Millions
B. What to show
Select the table size and position (e.g., top-left, bottom-center)
Under Table Settings, enable or disable any row:
Turnover
Mcap (market capitalization)
FF (free float)
1-Min liquidity (average turnover on 1-min bars)
Tomcap (Turnover to market capitalization) or Toff (Turnover to Free Float) ratio
C. Display mode
Table: a multi-row grid with colored cells
Text: a single summary string
Swing High/Low with Liquidity Sweeps🧠 Overview
This indicator identifies swing highs and swing lows based on user-defined candle lengths and checks for liquidity sweeps—situations where the price breaks a previous swing level but then closes back inside, indicating a potential false breakout or stop hunt. It also supports visual labeling and alerts for these events.
⚙️ Inputs
Swing Length (must be odd number ≥ 3):
Determines how many candles are used to identify swing highs/lows. The central candle must be higher or lower than all neighbors within the range.
Example: If swingLength = 5, the central candle must be higher/lower than the 2 candles on both sides.
Sweep Lookback (bars):
Defines how many bars to look back for possible liquidity sweeps.
Show Swing Labels (checkbox):
Optionally display labels on the chart when a swing high or low is detected.
Show Sweep Labels (checkbox):
Optionally display labels on the chart when a liquidity sweep occurs.
🕯️ Swing Detection Logic
A Swing High is detected when the high of the central candle is greater than the highs of all candles around it (as per the defined length).
A Swing Low is detected when the low of the central candle is lower than the lows of surrounding candles.
Swing labels are placed slightly above (for highs) or below (for lows) the candle.
💧 Liquidity Sweep Logic
A Sweep High is triggered if:
The current high breaks above a previously detected swing high,
And then the candle closes below that swing high,
Within the configured lookback window.
A Sweep Low is triggered if:
The current low breaks below a previous swing low,
And then closes above it,
Within the lookback window.
These are often seen as stop hunts or fake breakouts.
🔔 Alerts
Sweep High Alert: Triggered when a sweep above a swing high occurs.
Sweep Low Alert: Triggered when a sweep below a swing low occurs.
You can use these to set up TradingView alerts to notify you of potential liquidity grabs.
📊 Use Cases
Identifying market structure shifts.
Spotting fake breakouts and potential reversals.
Assisting in smart money concepts and liquidity-based trading.
Supporting entry timing in trend continuation or reversal strategies.

BTC-OTHERS Liquidity PivotBTC-OTHERS Liquidity Map – 1-hour Multi-Asset Pivot Scanner
WHAT IT DOES
This script tracks liquidity shifts between Bitcoin (BTC) and the broader alt-coin market (the OTHERS market-cap index that excludes the top-10 coins). It labels every confirmed 1-hour swing high or low on both assets, then flags four states:
BearPivot – BTC prints a new swing High while OTHERS does not; liquidity crowds into BTC and alts are weak.
BullPivot – BTC prints a swing Low and OTHERS forms a Higher Low; fresh liquidity starts flowing into stronger alts.
BearCon – BTC prints a swing Low and OTHERS forms a Lower Low; down-trend continuation.
BullCon – No new BTC Low while OTHERS makes a Higher High; up-trend continuation.
Signals appear on the actual pivot bar (offset back by the look-back length), so they never repaint after confirmation.
HOW THE PIVOTS ARE FOUND
• Symmetrical window: “Pivot Len” bars to the left and right (default 21).
• Full confirmation on both sides delivers stable, non-repainting pivots at the cost of about Pivot Len bars’ delay.
• Labels are offset –Pivot Len so they sit on the genuine extreme.
INPUTS
Symbols: BTC symbol and an OTHERS symbol so you can switch exchanges or choose another alt index.
Pivot Len: tighten for faster but noisier signals; widen for cleaner pivots.
Style: customise shape and text colours.
PLOTS AND ALERTS
Four labelled shapes (BearPivot, BullPivot, BearCon, BullCon) plot above or below price. Each label is linked to an alertcondition, so you can create one-click alerts and stay informed without watching the screen.
TYPICAL WORKFLOW
1. Attach the script to any 1-hour BTC chart (or leave the script’s timeframe empty to follow your current chart TF).
2. Turn on alerts to receive push/email notifications.
3. Use the labels as a liquidity compass, combining them with volume, funding or your own strategy for actual entries and exits.
Enjoy and trade safe.
