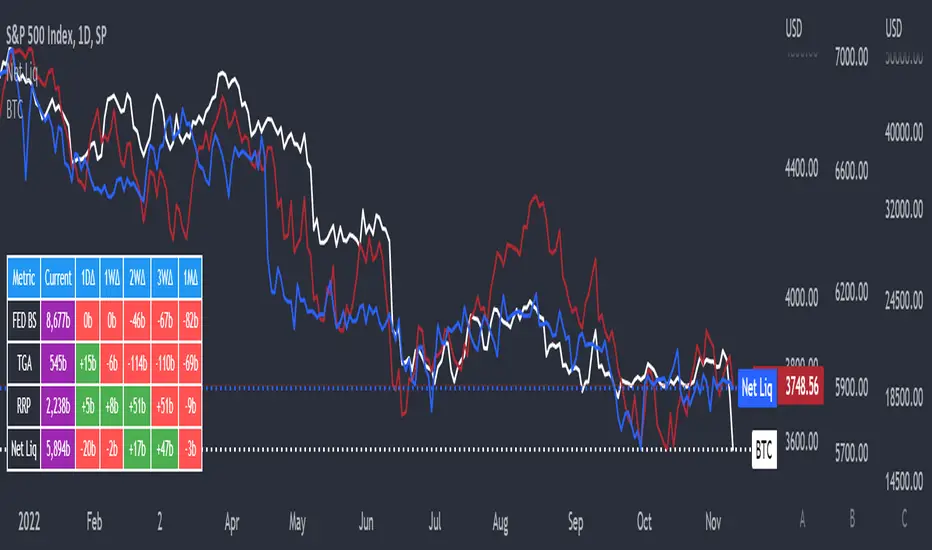
Weighted Global Liquidity Index (WGLI)The Weighted Global Liquidity Index (WGLI) provides a comprehensive view of major central bank balance sheets from around the world, using data converted to USD for consistency and expressed in trillions. This indicator includes specific US accounts like the Treasury General Account (TGA) and Reverse Repurchase Agreements (RRP), which are subtracted from the Federal Reserve's balance sheet to offer a more detailed perspective on US liquidity.
The WGLI incorporates not only the balance sheets but also additional key financial indicators such as Foreign Exchange Reserves, Interbank Rates, and Interest Rates, weighted by their global liquidity importance. The regions and central banks included are:
Federal Reserve System (FED) - Treasury General Account (TGA) - Reverse Repurchase Agreements (RRP)
European Central Bank (ECB)
People's Bank of China (PBC)
Bank of Japan (BOJ)
Bank of England (BOE)
Bank of Canada (BOC)
Reserve Bank of Australia (RBA)
Reserve Bank of India (RBI)
Swiss National Bank (SNB)
Central Bank of the Russian Federation (CBR)
Central Bank of Brazil (BCB)
Bank of Korea (BOK)
Reserve Bank of New Zealand (RBNZ)
Sweden's Central Bank (Riksbank)
Central Bank of Malaysia (BNM)
This tool is designed for anyone interested in gaining a snapshot of global liquidity to interpret macroeconomic trends. By examining these balance sheets and additional indicators, users can understand policy trajectories and evaluate the global economic climate. It also offers insights into asset pricing and helps investors make informed capital allocation decisions.
Feel free to explore and customize the WGLI script on Trading View to suit your analysis needs!
스크립트에서 "liquidity"에 대해 찾기

itradesize /\ Previous HTF x OHLC Box
FYI: It is an invite-only script, if you are interested in, please scroll down to see the Author's instructions.
Introducing an indicator which inspired by ICT concepts that use a model, based on what TTrades teaches in some of his DOL videos about how to get a proper bias.
Having a daily bias can be frustrating and this script could make it easy for you besides creating a ton of opportunities for scalpers as well as not only helpful for a daily bias, it can also help you to determine the actual H4 or H1 bias or even lower.
Always keep in mind: the higher the timeframe you use, the more accurate it can be.
You can use OHLC to determine the current or higher time frame bias as it can be used on any of them and properly gain a sentiment of a drawn of liquidity.
This model integrates the previous candle's open, high, low, and close values (or open, low, high close) in addition to their equilibrium to make it easier to identify where the price should go moreover they can be used as reference points for potential trading opportunities.
The 50% also known as equilibrium creates premium and discount zones within the previous candles. Using the former higher timeframe candle’s OHLC you can simply have an external range of liquidity and where the current price should it drawn to.
With this tool, you can achieve a proper trading framework as you can easily recognize the external & internal range of liquidity, so whether you are a scalper or a day trader you are able to rely on the indicator.
A bit of a candlestick analysis:
When the price wicks below means a potential bullish reversal is incoming.
When the price wicks above, then it means a potential bearish reversal is happening.
Closing below means lower prices. (Bearish trend)
Closing above means higher prices. (Bullish trend)
This indicator is an absolute monster for the OHLC guys.
How to use it?
- Analyse the trend on the higher timeframe, bullish trend is when the price continuously takes the previous candle’s high over and over again. Bearish trend is the total opposite.
- Wait for external liquidity to be taken.
- When it's happening there should be a displacement back to the range with an actual structure shift.
- Looking for an imbalance in the displacement.
- Aiming for an imbalance that is above 50% of the former move.
- Aggressive stop: below or above the candle which has an imbalance
- Conservative stop: below or above the former swing
Classic sell setup:
Classic buy setup:
The indicator has a ton of customizable features, the power of the tool is really in there, as you can find or refine your own model with it. Once you're familiar with your setup you will be really feeling the power of the tool, I promise.
Indicator Features:
• M5/M15/H1/H4/D Time frames
• OHLC bar with an offset (you can have a look at the current HTF bar developing or you can use it as a locked previous bar)
• Current time frame OHLC / OLHC box with extended lines to the current time
• Showing the previous time frame OHLC / OLHC box with extended lines and the ability to add labels. The color of the OHLC or OLHC box is based on the candle closing. If it's a bear candle, if it's a bull candle.
• Previous high time frame open / close lines with labels, customisable colours, label sizes
• It has a lot of customisable features, the power of the tool is really in there as you can find or refine your own model with it.
• Every box and bar automatically switches its colors based on the close of the candle whether it's a bear or a bull candle.
• The color of the labels is switching automatically based on the coloring of your chart.
• You can customize each and every box color - OHLC/OLHC based on your taste, and the open and closing lines of the previous HTF.
Additional Information:
You can combine it with my own model. If you are not familiar with it, you can find here .
Or you can combine it with other frameworks for extra confluences like combining it with Daye’s QT in some simple equation:
Open → Q1 , High → Q2, Low → Q3, Close → Q4
Open → Q1, Low → Q2, High → Q3, Close → Q4

Crypto USD Liquidity Delta [tedtalksmacro]Calculates and plots the week-on-week (WoW), month-on-month (MoM), quarter-on-quarter (QoQ), and year-on-year (YoY) percentage changes in the aggregate stablecoin liquidity. By comparing the current liquidity with its historical values at different intervals, the script provides insights into the short-term and long-term liquidity fluctuations. Each of these percentage changes is plotted with distinct colors, enabling traders to analyze and comprehend the rate of liquidity change over various time frames.

Shamji's Liquidity Sweep + FVG (Follow-up + Filters) Purpose (what it does)
This indicator looks for two related price structures used by many smart-money / liquidity-hunt traders:
Liquidity Sweeps — candles that wick beyond a recent swing high (for buy-side stop-hunts) or swing low (for sell-side stop-hunts), then close back inside. These are flagged as potential stop-hunt events that clear obvious liquidity.
Fair Value Gaps (FVGs) — simple 3-bar style gaps where an older bar’s high is below the current low (bullish FVG) or an older bar’s low is above the current high (bearish FVG). When an FVG appears after a sweep (within a configurable window), this is considered a follow-up alignment.
The script adds optional filters (volume spike and candle-range vs ATR) to increase confidence, and can restrict marking/alerts to only events that meet the follow-up and filter rules.

Candle volume analysis The indicator is designed for traders who are more interested in market structures and price action using volumes. Volume analysis can help traders build a clearer understanding of zones of buyer and seller interest, as well as places to capture liquidity (traders' stop levels).
Key Features:
The indicator highlights candle volumes in selected colors, where the volume is greater individually than the volumes of the trader's chosen number of preceding candles. Or the volume that is greater than the sum of volumes of the trader's chosen number of preceding candles.

Volumetric Toolkit [LuxAlgo]The Volumetric Toolkit is a complete and comprehensive set of tools that display price action-related analysis methods from volume data.
A total of 4 features are included within the toolkit. Symbols that do not include volume data will not be supported by the script.
🔶 USAGE
The volumetric toolkit puts a heavy focus on price action, returning support/resistance levels, ranges, volume divergences...etc.
The main premise between each feature is that volume has a direct relationship with market participants level of interest over a specific symbol, and that this interest is not constant over time.
Each individual feature is detailed below.
🔹 Ranges Of Interest
The Ranges Of Interest construct a range from a surge of high liquidity in the market. This range is constructed from the price high and price low of the candle with the associated significant liquidity.
The returned extremities can be used as support and resistance, with breakouts often being accompanied by significant liquidity as well, suggesting potential trend continuations.
The length setting associated with this feature determines how sensitive the range detection algorithm is to volume, with higher values requiring more significant volume in order to display a new range.
🔹 Impulses
Impulses highlight times when volume makes a new higher high while the price makes a new higher high or lower low, suggesting increased market participation.
When this occurs when the price makes a new higher high the impulse is considered bullish (green), if the price makes a new lower low the impulse is bearish (red).
Impulses occurring within an established trend opposite to it (e.g a bearish impulse on an uptrend) might be indicative of reversals.
The length setting works similarly to the previously described ranges of interest, with higher values requiring longer-term volume higher high and price higher high/lower low, highlighting more significant impulse and potentially longer-term reversals.
🔹 Levels Of Interest
Levels of interest display price levels of significant trading activity, contrary to the range of interest only the closing price is taken into account, also volume peaks are used to detect significant trading activity.
Note that this feature is subject to backpainting, that is lines are set retrospectively.
Users can determine the amount of most recent levels to display on the chart. These can be used as classical support/resistances.
🔹 Volume Divergence
We define volume divergence as a decreased market participation while a trend is still developing.
More precisely volume divergences are highlighted if volume makes a lower high while price is making a new higher high/lower low.
This can be indicative of a lack of further participation in the current trend, indicating a potential reversal.
Using higher length values will return longer-term divergences.
Note that this feature is subject to backpainting, that is lines are set retrospectively.
🔶 SETTINGS
🔹 Ranges Of Interest
Show Ranges Of Interest: Display Ranges Of Interest.
Length: Ranges Of Interest sensitivity to volume.
🔹 Impulses
Show Impulses: Display Ranges Of Interest.
Length: Impulses sensitivity to volume.
🔹 Levels Of Interest
Show: Determine if Levels Of Interest are displayed, and how many from the most recent.
Length: Level detection sensitivity to volume.
🔹 Volume Divergences
Show Divergences: Determine if Volume Divergences are displayed.
Length: Period for the detection of price tops/bottoms and volume peaks.

Net LiquidityThis is an indicator that plots Net Liquidity.
The Net Liquidity function is simply: Fed Balance Sheet - Treasury General Account - Reverse Repo Balance
Net Liquidity can be used to ball park how much money is in the system and how it will affect various markets' performance.
Its primary purpose is showing how to use the NetLiquidityLibrary
Smarter Money Concepts - OBs [PhenLabs]📊 Smarter Money Concepts - OBs
Version: PineScript™ v6
📌 Description
Smarter Money Concepts - OBs (Order Blocks) is an advanced technical analysis tool designed to identify and visualize institutional order zones on your charts. Order blocks represent significant areas of liquidity where smart money has entered positions before major moves. By tracking these zones, traders can anticipate potential reversals, continuations, and key reaction points in price action.
This indicator incorporates volume filtering technology to identify only the most significant order blocks, eliminating low-quality signals and focusing on areas where institutional participation is likely present. The combination of price structure analysis and volume confirmation provides traders with high-probability zones that may attract future price action for tests, rejections, or breakouts.
🚀 Points of Innovation
Volume-Filtered Block Detection : Identifies only order blocks formed with significant volume, focusing on areas with institutional participation
Advanced Break of Structure Logic : Uses sophisticated price action analysis to detect legitimate market structure breaks preceding order blocks
Dynamic Block Management : Intelligently tracks, extends, and removes order blocks based on price interaction and time-based expiration
Structure Recognition System : Employs technical analysis algorithms to find significant swing points for accurate order block identification
Dual Directional Tracking : Simultaneously monitors both bullish and bearish order blocks for comprehensive market structure analysis
🔧 Core Components
Order Block Detection : Identifies institutional entry zones by analyzing price action before significant breaks of structure, capturing where smart money has likely positioned before moves.
Volume Filtering Algorithm : Calculates relative volume compared to a moving average to qualify only order blocks formed with significant market participation, eliminating noise.
Structure Break Recognition : Uses price action analysis to detect legitimate breaks of market structure, ensuring order blocks are identified only at significant market turning points.
Dynamic Block Management : Continuously monitors price interaction with existing blocks, extending, maintaining, or removing them based on current market behavior.
🔥 Key Features
Volume-Based Filtering : Filter out insignificant blocks by requiring a minimum volume threshold, focusing only on zones with likely institutional activity
Visual Block Highlighting : Color-coded boxes clearly mark bullish and bearish order blocks with customizable appearance
Flexible Mitigation Options : Choose between “Wick” or “Close” methods for determining when a block has been tested or mitigated
Scan Range Adjustment : Customize how far back the indicator looks for structure points to adapt to different market conditions and timeframes
Break Source Selection : Configure which price component (close, open, high, low) is used to determine structure breaks for precise block identification
🎨 Visualization
Bullish Order Blocks : Blue-colored rectangles highlighting zones where bullish institutional orders were likely placed before upward moves, representing potential support areas.
Bearish Order Blocks : Red-colored rectangles highlighting zones where bearish institutional orders were likely placed before downward moves, representing potential resistance areas.
Block Extension : Order blocks extend to the right of the chart, providing clear visualization of these significant zones as price continues to develop.
📖 Usage Guidelines
Order Block Settings
Scan Range : Default: 25. Defines how many bars the indicator scans to determine significant structure points for order block identification.
Bull Break Price Source : Default: Close. Determines which price component is used to detect bullish breaks of structure.
Bear Break Price Source : Default: Close. Determines which price component is used to detect bearish breaks of structure.
Visual Settings
Bullish Blocks Color : Default: Blue with 85% transparency. Controls the appearance of bullish order blocks.
Bearish Blocks Color : Default: Red with 85% transparency. Controls the appearance of bearish order blocks.
General Options
Block Mitigation Method : Default: Wick, Options: Wick, Close. Determines how block mitigation is calculated - “Wick” uses high/low values while “Close” uses close values for more conservative mitigation criteria.
Remove Filled Blocks : Default: Disabled. When enabled, order blocks are removed once they’ve been mitigated by price action.
Volume Filter
Volume Filter Enabled : Default: Enabled. When activated, only shows order blocks formed with significant volume relative to recent average.
Volume SMA Period : Default: 15, Range: 1-50. Number of periods used to calculate the average volume baseline.
Min. Volume Ratio : Default: 1.5, Range: 0.5-10.0. Minimum volume ratio compared to average required to display an order block; higher values filter out more blocks.
✅ Best Use Cases
Identifying high-probability support and resistance zones for trade entries and exits
Finding optimal stop-loss placement behind significant order blocks
Detecting potential reversal areas where price may react after extended moves
Confirming breakout trades when price clears major order blocks
Building a comprehensive market structure map for medium to long-term trading decisions
Pinpointing areas where smart money may have positioned before major market moves
⚠️ Limitations
Most effective on higher timeframes (1H and above) where institutional activity is more clearly defined
Can generate multiple signals in choppy market conditions, requiring additional filtering
Volume filtering relies on accurate volume data, which may be less reliable for some securities
Recent market structure changes may invalidate older order blocks not yet automatically removed
Block identification is based on historical price action and may not predict future behavior with certainty
💡 What Makes This Unique
Volume Intelligence : Unlike basic order block indicators, this script incorporates volume analysis to identify only the most significant institutional zones, focusing on quality over quantity.
Structural Precision : Uses sophisticated break of structure algorithms to identify true market turning points, going beyond simple price pattern recognition.
Dynamic Block Management : Implements automatic block tracking, extension, and cleanup to maintain a clean and relevant chart display without manual intervention.
Institutional Focus : Designed specifically to highlight areas where smart money has likely positioned, helping retail traders align with institutional perspectives rather than retail noise.
🔬 How It Works
1. Structure Identification Process :
The indicator continuously scans price action to identify significant swing points and structure levels within the specified range, establishing a foundation for order block recognition.
2. Break Detection :
When price breaks an established structure level (crossing below a significant low for bearish breaks or above a significant high for bullish breaks), the indicator marks this as a potential zone for order block formation.
3. Volume Qualification :
For each potential order block, the algorithm calculates the relative volume compared to the configured period average. Only blocks formed with volume exceeding the minimum ratio threshold are displayed.
4. Block Creation and Management :
Valid order blocks are created, tracked, and managed as price continues to develop. Blocks extend to the right of the chart until they are either mitigated by price action or expire after the designated timeframe.
5. Continuous Monitoring :
The indicator constantly evaluates price interaction with existing blocks, determining when blocks have been tested, mitigated, or invalidated, and updates the visual representation accordingly.
💡 Note:
Order Blocks represent areas where institutional traders have likely established positions and may defend these zones during future price visits. For optimal results, use this indicator in conjunction with other confluent factors such as key support/resistance levels, trendlines, or additional confirmation indicators. The most reliable signals typically occur on higher timeframes where institutional activity is most prominent. Start with the default settings and adjust parameters gradually to match your specific trading instrument and style.

Volume based liquidity This indicator finds area where the price moves relatively mildly compared to the size of the volume, the target area. It also finds weak areas, that have low volume in a relatively large price movement. Larger and more recent target areas are much more useful in finding liquidity. the weak areas could be a tell for when price will reverse into a target area. Make sure a target area hasn't already had its liquidity swept.

Global M2 ex-China MonitorGlobal M2 Monitor - Ultimate Edition
🎯 OVERVIEW
Advanced global M2 money supply monitoring indicator, offering a unique macroeconomic view of global liquidity. Real-time tracking of M2 evolution in major developed economies.
📊 KEY FEATURES
Global M2 Aggregation : USA, Japan, Canada, Eurozone, United Kingdom
Currency Conversion : All data converted to USD for consistent analysis
High Resolution Display : Daily curve by default
Technical Analysis : 50-period moving average (SMA/EMA/WMA)
Accurate YoY Calculation : Annual variation based on monthly data
Advanced Signal System : Multi-condition color codes
🎨 COLOR SYSTEM - DEFAULT SETTINGS
🟢 GREEN : YoY ≥ 7% AND M2 ≥ SMA → Strong growth + Bullish momentum
🔴 RED : YoY ≤ 2% AND M2 ≤ SMA → Weak growth + Bearish momentum
🟢 LIGHT GREEN : YoY ≥ 7% BUT M2 < SMA → Good fundamentals, temporarily weak momentum
🔴 LIGHT RED : YoY ≤ 2% BUT M2 > SMA → Weak fundamentals, price still supported
🔵 BLUE : YoY between 2% and 7% → Neutral zone of moderate growth
🇨🇳 WHY IS CHINA EXCLUDED BY DEFAULT?
Chinese M2 data presents methodological reliability and transparency issues. Exclusion allows for more consistent analysis of mature market economies.
Different M2 definition vs Western standards
Capital controls affecting real convertibility
Frequent monetary manipulations by authorities
✅ Available option : Can be activated in settings
⚙️ OPTIMIZED DEFAULT PARAMETERS
// DISPLAY SETTINGS
Candle Period: D (Daily)
// MOVING AVERAGE
MA Period: 50, Type: SMA
// BACKGROUND LOGIC
YoY Bullish: 7%, YoY Bearish: 2%
SMA Method: absolute, Threshold: 0.2%
// COLORS
Transparency: 5%
China M2: Disabled
📈 RECOMMENDED USAGE
Traders : Anticipate sector rotations
Investors : Identify abundant/restricted liquidity phases
Macro-analysts : Monitor monetary policy impacts
Portfolio managers : Understand inflationary pressures
🔍 ADVANCED INTERPRETATION
M2 ↗️ + YoY ≥ 7% → Favorable risk-on environment
M2 ↘️ + YoY ≤ 2% → Defensive risk-off environment
Divergences → Early warning signals for trend changes
💡 WHY THIS INDICATOR?
Global money supply is the lifeblood of the financial economy . Its growth or contraction typically precedes market movements by 6 to 12 months.
"Don't fight the Fed... nor the world's central banks"
🛠️ ADVANCED CUSTOMIZATION
All parameters are customizable:
YoY bullish/bearish thresholds
SMA comparison method (absolute/percentage)
Colors and transparency
Moving average period and type
Optional China inclusion
📋 TECHNICAL INFORMATION
YoY Calculation : Based on monthly data for consistency
Sources : FRED, ECONOMICS, official data
Updates : Real-time with publications
Currencies : Updated exchange rates

Climax Absorption Engine [AlgoPoint]Overview
Have you ever noticed that during a sharp, fast-moving trend, the single candle with the highest volume often appears right at the end, just before the price reverses? This is no coincidence. It's the footprint of a Climax Event.
This indicator is designed to detect these critical moments of maximum panic (capitulation) and maximum euphoria (FOMO). These are the moments when retail traders are driven by emotion, creating a massive pool of liquidity. The "Climax Absorption Engine" identifies when Smart Money is likely absorbing this liquidity to enter large positions against the crowd, right before a potential reversal.
It's a tool built not just on mathematical formulas, but on the principles of market psychology and smart money activity.
How It Works: The 3-Step Logic
The indicator uses a sequential, three-step process to identify high-probability reversal setups:
1. Momentum Move Detection: First, the engine identifies a period of strong, directional momentum. It looks for a series of consecutive, same-colored candles and confirms that the move is backed by a steeply sloped moving average. This ensures we are only looking for climactic events at the end of a significant, non-random move.
2. Climax Candle Identification: Within this momentum move, the indicator scans for a candle with abnormally high volume—a volume spike that is significantly larger than the recent average. This candle is marked on your chart with a diamond shape and is identified as the Climax Candle. This is the point of peak emotion and the primary area of interest. No signal is generated yet.
3. Absorption & Reversal Confirmation: A climax is a warning, not a signal. The final signal is only triggered after the market confirms the reversal.
- For a BUY Signal: After a bearish (red) Climax Candle, the indicator waits for a subsequent green candle to close decisively above the midpoint of the Climax Candle. This confirms that the panic selling has been absorbed by buyers.
- For a SELL Signal: After a bullish (green) Climax Candle, it waits for a subsequent red candle to close decisively below the midpoint. This confirms that the euphoric buying has evaporated.
How to Interpret & Use This Indicator
- The Diamond Shape: A diamond shape on your chart is an early warning. It signifies that a climax event has occurred and the underlying trend is exhausted. This is the time to pay close attention and prepare for a potential reversal.
- The BUY/SELL Labels: These are the final, actionable signals. They appear only after the reversal has been confirmed by price action.
- A BUY signal suggests that capitulation selling is over, and buyers have absorbed the pressure.
- A SELL signal suggests that FOMO buying is over, and sellers are now in control.
Key Settings
- Momentum Detection: Adjust the number of consecutive bars and the EMA slope required to define a valid momentum move.
- Climax Detection: Fine-tune the sensitivity of the volume spike detection using the Volume Multiplier. Higher values will find only the most extreme events.
- Confirmation Window: Define how many bars the indicator should wait for a reversal candle after a climax event before the setup is cancelled.

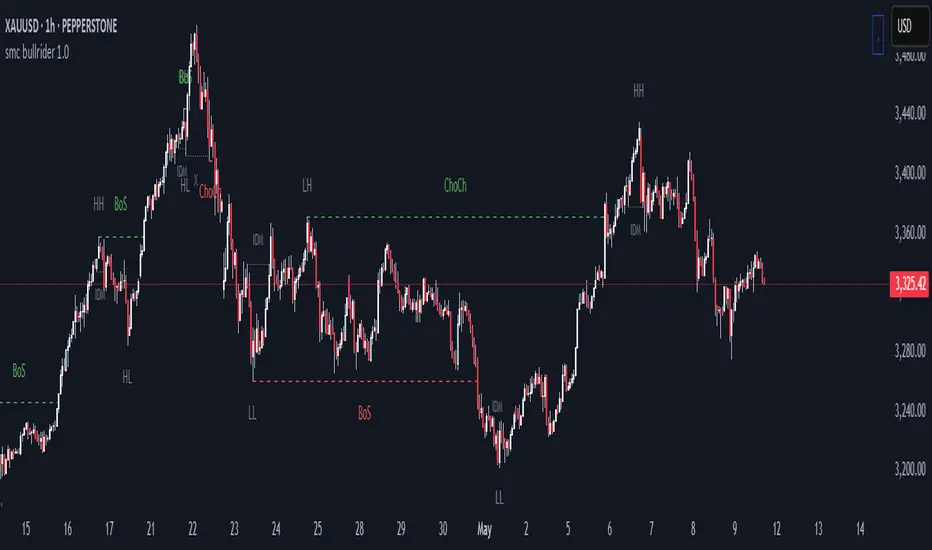
smc bullrider 1.0The smc bullrider 1.0 indicator is specifically crafted for mapping market structures. It excels in clearly recognizing type of Points Of Interest (SCOB) offering traders a straightforward and effective method to analyze market movements. It helps identify strategic entry points with precision.
🟠 Exploring Structure Mapping.
🔹This indicator presents a distinctive method for examining the market structure, emphasizing liquidity through the concept of 'Inducement'. Inducement plays a pivotal role in pinpointing essential structural indicators in the market, including Higher Highs (HH), Higher Lows (HL), Lower Lows (LL), and Lower Highs (LH).
🔹Consider Inducement as a strategically placed trap near supply or demand zones. It lures in eager buyers or sellers before the actual zone is reached, effectively creating liquidity. To validate an inducement, it must signify a legitimate pullback.
🔹A valid scenario arises when the price either sweeps or closes beyond the high or low of the preceding candle. In this context, the candle's color, whether bullish or bearish, holds no significance, and both situations are deemed valid. Inside bars are disregarded unless they meet this specific criterion. The indicator facilitates this process by automatically highlighting valid pullbacks with a distinctive gray round label.
🔹This feature serves not only as a visual guide but also as a vital tool for effortlessly comprehending market movements, offering a clear and visual representation of ongoing market trends
🟣 Understanding POI Functionality
🔹Single Candle Order Block (SCOB): Leveraging single-candle mitigation proves to be a powerful method for incorporating multiple entries into your successful trades.
🔵 How to Utilize the smc bullrider 1.0 Indicator:
🔹The smc bullrider 1.0 Indicator is crafted to elevate your trading strategy by pinpointing crucial order blocks and market signals. Below is a guide on how to make the most of the different components of the smc bullrider 1.0 Indicator:
🔹SCOB (Single Candle Order Block):
Application: SCOB is well-suited for scaling into a position. It is best utilized to increase positions when the market responds to OB or OB-EXT, signaling a potential reversal.
🟢Here's how to use it.
🔹Market Structure Drawing
This diagram depicts significant market indicators, such as instances of ascending prices (Higher Highs - HH) or descending prices (Lower Lows - LL). It serves as a valuable visual tool for comprehending the dynamics of market behavior
PICTURE (DIAGRAM)
Live Chart Example: Our indicator efficiently dissects market structure, showcasing the 'Inducement' concept with precision in real-time trends—highlighting HH, HL, LL, and LH
PICTURE (REAL CHART)
Valid Pullback ( IDM ):
Valid Pullback Example: This image illustrates a common situation where the price extends beyond the high or low of the preceding candle, signifying a valid pullback. Pay attention to the identifiable gray dotted line label marking the inducement point.
PICTURE (DRAW/REAL)
Single Candle Order Block (SCOB)
The provided chart showcases the SCOB in a real trading setting, highlighting its effectiveness in optimizing trades.
🟡 Summary
🔹smc bullrider 1.0 Indicator distinguishes itself in the realm of market analysis, with a distinct focus on structure mapping and high-probability Point of Interest (POI).
Furthermore, it provides a visual representation of three key areas for each market move: discount, premium, and the equilibrium area at 50%. Its innovative approach involves scrutinizing market structure using the 'Inducement' concept, a pivotal strategy for identifying vital structural markers and steering
Engulfing Sweeps - Milana TradesEngulfing Sweeps
The Engulfing Sweeps Candle is a candlestick pattern that:
1)Takes liquidity from the previous candle’s high or low.
2)Fully engulfs previous candles upon closing.
3)Indicates strong buying or selling pressure.
4)Helps determine the bias of the next candle.
Logic Behind Engulfing Sweeps
If you analyze this candle on a lower timeframe, you’ll often see popular models like PO3 (Power of Three) or AMD (Accumulation – Manipulation – Distribution).
Once the candle closes, the goal is to enter a position on the retracement of the distribution phase.
How to Use Engulfing Sweeps?
Recommended Timeframes:
4H, Daily, Weekly – these levels hold significant liquidity.
Personally, I prefer 4H, as it provides a solid view of mid-term market moves.
Step1 - Identify Engulfing Sweep Candle
Step 2-Switch to a lower timeframe (15m or 5m).And you task identify optimal trade entry
Look for an entry pattern based on:
FVG (Fair Value Gap)
OB (Order Block)
FIB levels (0/0.25/0.5/ 0.75/ 1)
Wait for confirmation and take the trade.
Automating with TradingView Alerts
To avoid missing the pattern, you can set up alerts using a custom script. Once the pattern forms, TradingView will notify you so you can analyze the chart and take action. This approch helps me be more freedom

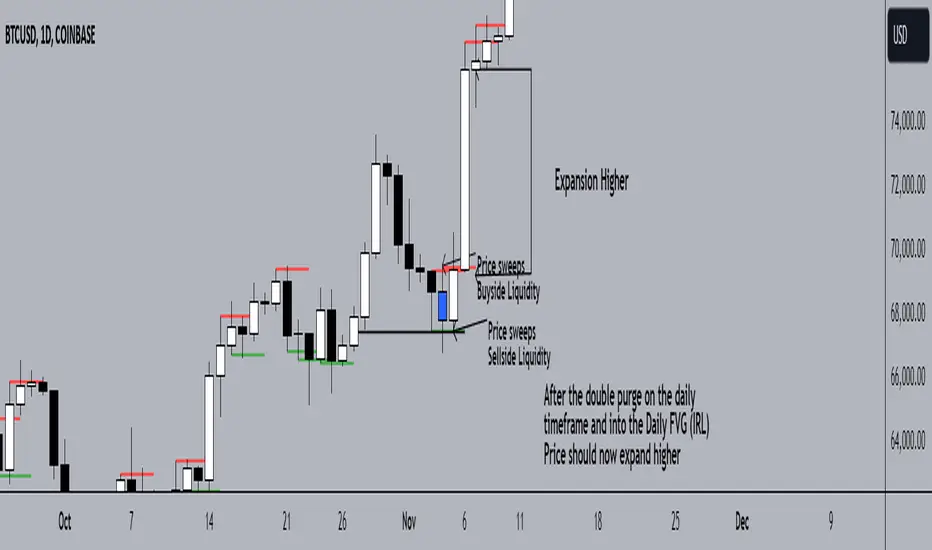
Double Purge Theory (DPT)The purpose of this script is to identify the Double Purge Theory-MMXM i.e. the run on liquidity on both the sell-side and the buy-side liquidity.
The simple use case behind this script is to provide additional entry confluence for your trade setups and more efficient stop loss placement on any given timeframe.
DPT in itself is a price signature that generally occurs before price makes impulsive move in the direction of the higher time frame narrative. It is not to be used as a standalone indicator for building narrative/framing bias.
How to use this script ?
1) Wait for the indicator to display the BLUE CANDLE highlight (DPT candle) that indicates the double purge has occurred.
2) The DPT should occur at/after price has tapped into a key level and is within the ICT killzones.
3) Position to frame your trade setup once you get a candle with a body close below / above the DPT candle , depending on your bias and stop loss placement at DPT candle high/low or after the body closure as mentioned in step 2.
For example :
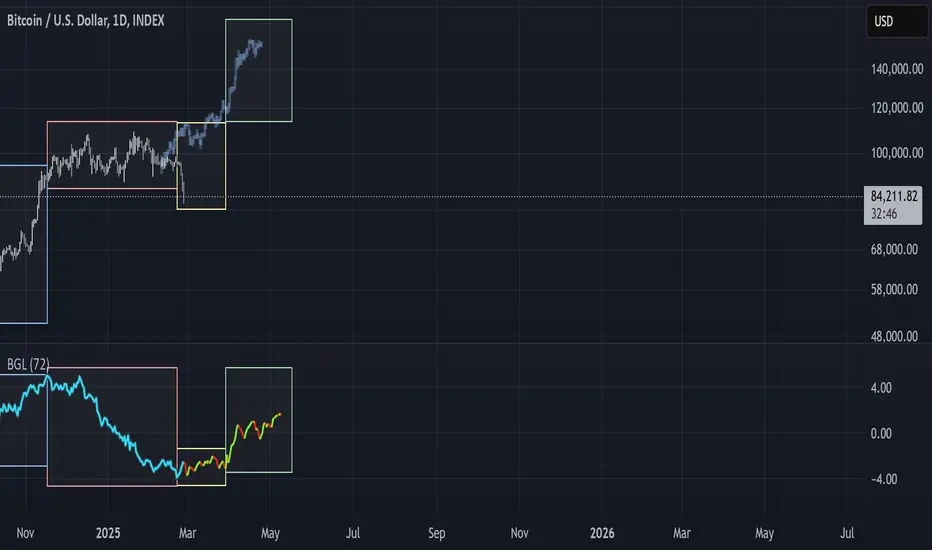
BGL - Bitcoin Global Liquidity Indicator [Da_Prof]This indicator takes global liquidity and shifts it forward by a set number of days. It can be used for any asset, but it is by default set for Bitcoin (BTC). The shift forward allows potential future prediction of BTC trends, especially uptrends. While not perfect, the current shift of 72 days seems to be best for the current cycle.
Sixteen currencies are used to calculate global liquidity.
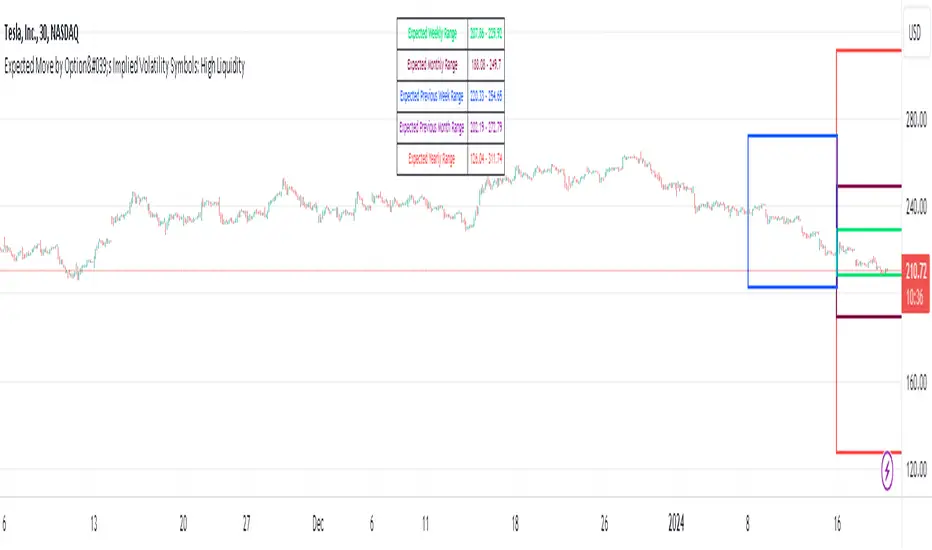
Expected Move by Option's Implied Volatility High Liquidity
This script plots boxes to reflect weekly, monthly and yearly expected moves based on "At The Money" put and call option's implied volatility.
Symbols in range: This script will display Expected Move data for Symbols with high option liquidity.
Weekly Updates: Each weekend, the script is updated with fresh expected move data, a job that takes place every Saturday following the close of the markets on Friday.
In the provided script, several boxes are created and plotted on a price chart to represent the expected price moves for various timeframes.
These boxes serve as visual indicators to help traders and analysts understand the expected price volatility.
Definition of Expected Move: Expected Move refers to the anticipated range within which the price of an underlying asset is expected to move over a specific time frame, based on the current implied volatility of its options. Calculation: Expected Move is typically calculated by taking the current stock price and applying a multiple of the implied volatility. The most commonly used multiple is the one-standard-deviation move, which encompasses approximately 68% of potential price outcomes.
Example: Suppose a stock is trading at $100, and the implied volatility of its options is 20%. The one-standard-deviation expected move would be $100 * 0.20 = $20.
This suggests that there is a 68% probability that the stock's price will stay within a range of $80 to $120 over the specified time frame. Usage: Traders and investors use the expected move as a guideline for setting trading strategies and managing risk. It helps them gauge the potential price swings and make informed decisions about buying or selling options.There is a 68% chance that the underlying asset stock or ETF price will be within the boxed area at option expiry. The data on this script is updating weekly at the close of Friday, calculating the implied volatility for the week/month/year based on the "at the money" put and call options with the relevant expiry. This script will display Expected Move data for Symbols within the range of JBL-NOTE in alphabetical order.
In summary, implied volatility reflects market expectations about future price volatility, especially in the context of options. Expected Move is a practical application of implied volatility, helping traders estimate the likely price range for an asset over a given period. Both concepts play a vital role in assessing risk and devising trading strategies in the options and stock markets.
Global Net LiquidityShows the value of Global Net Liquidity.
Currently defined as:
Fed + Japan + China + UK + ECB - RRP - TGA
where the first five components are central bank assets.

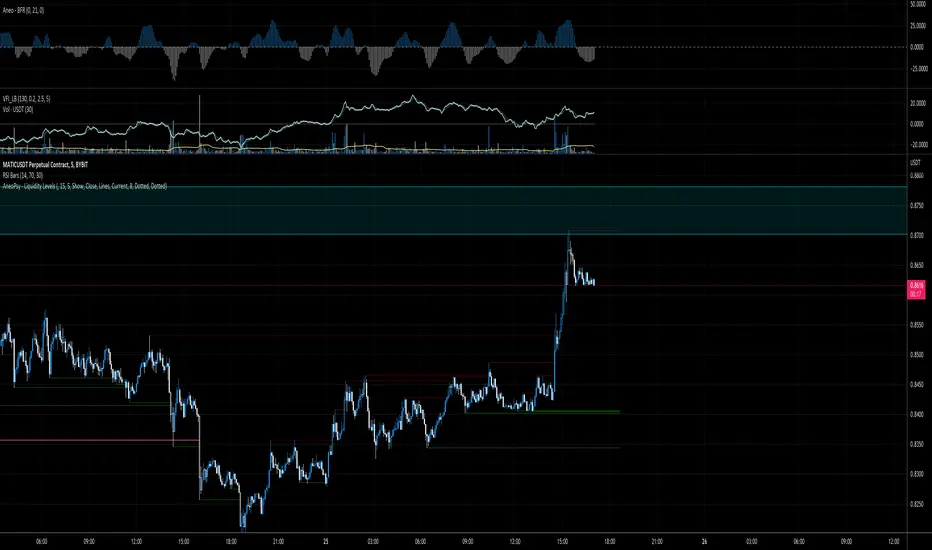
AneoPsy - Liquidity LevelsA script to show different level of liquidity.
I use this tool to find zone of stop loss.
HTF LiquidityThe ICT Liquidity Sweeps Indicator is designed to track liquidity zones in the market areas where stop-losses and pending orders are typically clustered. This indicator marks buyside liquidity (resistance) and sellside liquidity (support) from HTF (H4, H1 and M15), helping traders identify areas where price is likely to manipulate liquidity before making a significant move.
This tool is based on Inner Circle Trader (ICT) Smart Money Concepts, which emphasize how institutional traders, or “Smart Money,” manipulate liquidity to fuel price movements. By identifying these zones, traders can anticipate liquidity sweeps and position themselves accordingly.
⚙️ How It Works
1️⃣ Detects Key Liquidity Zones
The script automatically identifies significant swing highs and swing lows in price action using a pivot-based method.
A swing high (buyside liquidity) is a peak where price struggles to break higher, forming a resistance level.
A swing low (sellside liquidity) is a valley where price struggles to go lower, creating a support level.
These liquidity points are prime targets for liquidity sweeps before a true trend direction is confirmed.
2️⃣ Draws Liquidity Lines
Once a swing high or low is identified, a horizontal line is drawn at that level.
The lines extend to the right, serving as future liquidity targets until they are broken.
The indicator allows customization in terms of color, line width, and maximum number of liquidity lines displayed at once.
3️⃣ Handles Liquidity Sweeps
When price breaks a liquidity level, the indicator reacts based on the chosen action setting:
Dotted/Dashed: The line remains visible but changes style to indicate a sweep.
Delete: The line is completely removed once price has interacted with it.
This feature ensures that traders can easily spot where liquidity has been taken and determine whether a reversal or continuation is likely.
4️⃣ Prevents Chart Clutter
To maintain a clean chart, the script limits the number of liquidity lines displayed at any given time.
When new liquidity zones are formed, the oldest lines are automatically removed, keeping the focus on the most relevant liquidity zones.

AR-LiquidityAR-Liquidity is a clean, “chart-first” liquidity mapping tool built to automatically identify and maintain Buy-Side Liquidity (BSL) and Sell-Side Liquidity (SSL) levels, classify them as IRL / ERL using a dealing range filter, and mark sweeps/raids with an optional raid zone box—while keeping drawings stable using a fixed object bank (no random disappearing lines).
________________________________________
What it detects
1) BSL & SSL (Liquidity Pools)
• BSL (Buy-Side Liquidity): swing highs clustered into meaningful levels (areas where stops tend to rest above price).
• SSL (Sell-Side Liquidity): swing lows clustered into meaningful levels (areas where stops tend to rest below price).
Instead of plotting every single pivot, the script clusters nearby pivots using an ATR-based margin so you get clean, actionable liquidity levels, not noise.
2) IRL / ERL (Dealing Range Context)
Each liquidity level is labeled as:
• IRL (Internal Range Liquidity): inside the dealing range
• ERL (External Range Liquidity): outside the dealing range
By default, the dealing range uses:
• PDH / PDL (Previous Day High / Previous Day Low) as the IRL boundaries.
This helps you instantly understand whether a level is “internal” (often targeted during consolidation/mean reversion) or “external” (often targeted during expansion/displacement).
3) Sweeps / Raids (Liquidity Taken)
A sweep is flagged when price:
• Wicks through a confirmed level
• Then closes back inside (classic raid behavior)
The script marks swept levels with a ✓ check mark in the label.
Optionally, it can draw a raid zone box showing the wick-extreme to the level.
________________________________________
How it draws (stable & clean)
This indicator uses banked objects for lines/labels/boxes. That means:
• No flickering
• No unstable rendering
• No “objects disappearing” when new levels are created
Lines will extend to the right, and can be configured to stop when invalidated (depending on your build/settings).
________________________________________
Inputs (what each one actually means)
Detection
• Swing length (pivot L=R): controls pivot sensitivity (higher = fewer, stronger swings).
• ATR length: ATR basis for clustering margin.
• Cluster margin × ATR: how close pivots must be to merge into one liquidity level.
• Min touches to confirm: how many pivot touches are required before a level is considered valid.
• Max clusters to scan (perf): performance cap for how many stored levels the script checks.
Show / Filters
• Mode (Present/Historical):
o Present focuses on most relevant/active levels.
o Historical can show deeper history depending on your scan/visibility limits.
• Max visible levels per side: maximum number of BSL lines + SSL lines drawn at once.
• Extend levels right: keeps levels projected forward.
• Only above / only below: filter BSL above price and SSL below price (cleaner “current context” view).
• Hide swept levels: removes already-raided levels from view (if you want only “untouched” liquidity).
IRL / ERL (Dealing Range)
• Use PDH/PDL as dealing range: defines IRL boundaries using previous day high/low.
• Show PDH/PDL lines: plots those boundaries as dotted reference lines.
Sweeps / Raid Zones
• Mark sweeps: enables raid detection + check mark labeling.
• Show raid zone box: displays a box from level to wick extreme.
• Raid box extend (bars): how far the box projects to the right.
Style
Full control over:
• IRL vs ERL colors for BSL/SSL
• Line width
• Label size
• Raid box colors
________________________________________
How to use it (practical)
• Use BSL above price as likely upside draw / where liquidity may be taken.
• Use SSL below price as likely downside draw / where liquidity may be taken.
• Use IRL/ERL to decide whether the market is targeting internals (range) or externals (expansion).
• Use the ✓ sweep mark to identify “liquidity already taken” vs “still resting.”
• Pair it with structure (MSS/BOS), sessions, and displacement to time entries after raids.
________________________________________
Pro tips
• If you want more lines, increase:
o Max visible levels per side
o Max clusters to scan (perf)
• If the chart is too busy, increase:
o Swing length
o Min touches
o Or reduce Max visible levels per side

ICT FVG & Order Flow (IRL to ERL)Overview
Master liquidity with precision. This indicator brings the iCT trading concept to life by automatically detecting liquidity pools, fair value gaps, and key swing points. It shows you exactly where price is likely to move next — from Internal Range Liquidity (IRL) to External Range Liquidity (ERL). With built-in alerts and multi-timeframe validation, it helps you stay one step ahead of the market.
Concept
Markets move where liquidity is. According to iCT theory, price usually sweeps internal liquidity (IRL) first and then hunts for external liquidity (ERL). By mapping this process in real time, the indicator provides a clear framework for understanding market structure, liquidity grabs, and directional bias.
How it works
Detects the High-Probability Leg (HPL) — the leg containing a fair value gap (FVG)
Highlights unmitigated FVGs within the current context.
Marks swing points (SPs), IRL levels, and ERL targets automatically.
Identifies IRL rejections when liquidity is taken inside the leg.
Identifies if a FVG is Respected or Disrespected by 2 Candle Rejection (2CR)
Notifies you of every critical liquidity event:
New context leg
New FVG
IRL rejection
ERL or SP liquidity sweep
FVG is Respected or Disrespected by 2CR
Key Features
Automatic drawing of IRL, ERL, and SP levels
FVG types: Simple FVG or Breakaway Gap (BAG)
Multi-timeframe sweep check – if a single candle takes both IRL and ERL, the indicator zooms into a lower timeframe to confirm which liquidity was swept first
Fully customizable alerts for all liquidity events
Flexible settings for swing points, lookback depth, colors, and style
How to use
Start from the monthly chart to define the macro trend.
Analyze the latest order flow leg:
Bullish FVG = bullish context
Bearish FVG = bearish context
Step down to the daily timeframe and repeat the analysis.
Wait for price to approach or reject from IRL (the indicator highlights it automatically).
Drop to a lower timeframe for entries — use timeframe alignment to select the right LTF.
Enter with the FVG model, targeting liquidity within the leg.
Place take profit inside the context — e.g., never above ERL in a bullish setup.
🔔 Alerts
New Context
New FVG
IRL Rejection
ERL Sweep
SP Sweep
2CR
⚙️ Customization
Context side (auto/manual)
LTF pointer (auto/manual)
Show/hide Resistance FVG, Overlapping Defense, ERL/SP sweeps, 2CR
Look back bars, swing lines, swing length, line offsets
* Full color customization (FVG, bullish/bearish, labels, boxes)

LGZ – Liquidity Gravity Zones v1 📌 LGZ – Liquidity Gravity Zones (SVI + Net CVD + Volume)
Original Liquidity-Driven Price Magnet Model by Thomas Aaroon
📘 Concept Overview
LGZ (Liquidity Gravity Zones) is a new, original liquidity-based price-attraction model built using three core components:
SVI (Shock Volume Index) – measures abnormal volume spikes at each strike
Net CVD (NCP = CE_CVD − PE_CVD) – the real directional order-flow imbalance
Total Volume (CE + PE) – true liquidity density at each strike
Using these three elements, the indicator calculates Liquidity Gravity Weight (LGW) for every strike and identifies the strongest zones that attract price during the session.
🧠 Why This Indicator?
Traditional OI-based methods (long build-up, short build-up, OI change etc.) often lag.
LGZ focuses only on:
Real traded volume
Actual buy/sell aggression (CVD)
Shock events
Dealer hedging pressure
Strike-level liquidity clusters
This makes it far more responsive for intraday traders.
⭐ Core Formula
Liquidity Gravity Weight (LGW)
LGW = |SVI| × |Net CVD| × Total Volume
Where:
SVI = Shock Volume Index (Z-score based)
Net CVD (NCP) = CE_CVD − PE_CVD
Total Volume = CE_volume + PE_volume
LGW indicates how strongly a strike is pulling price toward it.
🎯 What the Indicator Shows
✔ Top Liquidity Gravity Zones (LGZ-1, LGZ-2, LGZ-3)
These are the strongest price magnets for the day.
✔ Gravity Lines on Chart
Each LGZ is plotted as a horizontal magnet line extending to the right.
✔ Strike-Level Liquidity Table
Shows:
Strike
SVI (Shock intensity)
LGW (Gravity strength)
This table gives a complete picture of the intraday liquidity landscape.
📈 How to Use (Intraday Trading Strategy)
🔵 1. Price gravitates toward LGZ-1
If price is below LGZ-1 → upward pull
If price is above LGZ-1 → downward pull
🔵 2. LGZ Flips = Trend Change
If LGZ-1 suddenly jumps to a different strike:
→ strong trend acceleration
🔵 3. LGZ Cluster = Reversal / Consolidation Zone
Multiple LGZ levels around the same strike indicate
→ liquidity saturation → reversal or slowdown.
🔵 4. Combine with Price Action
Best clarity on 5-minute timeframe
Use 1-minute only for entry.
🔬 Why LGZ Works
The indicator models the same reality driving option markets:
Where option volume + orderflow (CVD) + shock liquidity concentrate,
market makers hedge, and price moves toward that strike.
This is the foundation of dealer hedging mechanics and liquidity-based price movement.
🔧 Inputs
Symbol prefix (e.g., NIFTY)
Expiry (YYMMDD)
Center strike & range
Number of gravity zones
Color customization

Screener (ILPAC) [AlgoAlpha]🟠 OVERVIEW
This script is a powerful multi-symbol scanner designed to work as a companion to the "Institutional Liquidity & PA Concepts" (ILPAC) indicator. It allows you to monitor the key price action and liquidity signals from the ILPAC suite across a watchlist of up to 18 assets, all from a single dashboard. The primary goal of this tool is to provide a high-level market overview, enabling you to efficiently spot assets that are showing strong structural trends, interacting with key liquidity zones, or exhibiting signs of FOMO-driven volatility.
Instead of switching between dozens of charts, you can use this screener to quickly filter for assets that meet your specific trading criteria based on the advanced concepts of market structure, liquidity analysis, trend lines, and market sentiment.
🟠 CONCEPTS
The screener is built upon the core analytical engine of the "Institutional Liquidity & PA Concepts" indicator. It applies the proprietary algorithms of the ILPAC indicator to each symbol in your watchlist and presents the results in an easy-to-digest table. The concepts are combined to create a holistic view of the market.
Each column in the table is a window into a specific trading concept:
Market Structure: This is the foundation of price action analysis. The screener identifies the current market trend (bullish or bearish) by tracking swing highs and lows. It also flags critical events like a Break of Structure (BOS), which signals trend continuation, and a Change of Character (CHoCH), which suggests a potential trend reversal.
Liquidity Analysis: The screener analyzes order flow to determine where significant liquidity is resting. The "Liquidity Bias" column shows the net direction of this pressure, while the "Liquidity Event" column alerts you when price interacts with these key zones, either by forming a new one or mitigating an old one.
Trend Lines: This concept automates the classic technical analysis technique of drawing trend lines. The screener identifies significant swing points to form trend lines and then monitors them, alerting you to potential trend continuations or breakouts.
FOMO Bubbles: This concept measures crowd psychology by identifying sudden spikes in volume and price movement that are characteristic of "Fear of Missing Out." These signals can help identify potential trend exhaustion points or the start of a speculative rally.
By presenting these distinct but interconnected concepts together, the screener provides a multi-faceted view that allows traders to build a strong, confluence-based trading thesis.
🟠 FEATURES
This screener organizes a vast amount of data into a simple, color-coded table. Here is a breakdown of each column and the values you can expect to see:
Asset: Displays the ticker symbol for the asset being analyzed.
Market Structure: Shows the dominant trend based on swing highs and lows.
Bull: The asset is in a structural uptrend (making higher highs and higher lows).
Bear: The asset is in a structural downtrend (making lower highs and lower lows).
Detecting: The trend is neutral or a clear structure has not yet been established.
Structure Event: Flags the most recent significant market structure event.
Bull CHoCH: A bullish Change of Character, signaling a potential shift from a downtrend to an uptrend.
Bear CHoCH: A bearish Change of Character, signaling a potential shift from an uptrend to a downtrend.
Bull BOS: A bullish Break of Structure, confirming the continuation of an uptrend.
Bear BOS: A bearish Break of Structure, confirming the continuation of a downtrend.
–: No significant event has occurred recently.
Latest Swing Label: Identifies the most recently confirmed swing point.
HH: Higher High.
HL: Higher Low.
LH: Lower High.
LL: Lower Low.
–: No new swing point has been confirmed.
Liquidity Bias: Measures the net direction of liquidity and its relative strength.
▲ : A bullish liquidity bias, where the number indicates the strength.
▼ : A bearish liquidity bias, where the number indicates the strength.
Balanced: Liquidity is relatively balanced between buyers and sellers.
Liquidity Event: Indicates recent interactions with key liquidity zones.
New▲: A new bullish liquidity zone has just formed.
New▼: A new bearish liquidity zone has just formed.
Mit▲: Price has just tested (mitigated) a key bullish liquidity zone.
Mit▼: Price has just tested (mitigated) a key bearish liquidity zone.
–: No recent interaction.
Trend Line: Displays the status of automatically drawn trend lines.
Break▲: Price has broken above a key bearish trend line.
Break▼: Price has broken below a key bullish trend line.
Bull TL: Price is respecting an active bullish trend line.
Bear TL: Price is respecting an active bearish trend line.
–: No significant trend line is currently active.
FOMO: Detects sentiment-driven price moves of varying intensity.
Big▲/Med▲/Small▲: A bullish FOMO bubble has been detected (large, medium, or small).
Big▼/Med▼/Small▼: A bearish FOMO bubble has been detected (large, medium, or small).
–: No FOMO activity detected.
🟠 USAGE
The primary way to use this screener is to quickly scan your watchlist for assets that exhibit a confluence of bullish or bearish signals, which can significantly improve the probability of a trade.
1. Setup and Configuration:
Add the screener to your chart.
Open the settings and populate the "Watchlist" section with the symbols you want to track.
Fine-tune the input settings for each component (Market Structure, Liquidity, etc.) to match your preferred trading style. These settings will apply to all symbols in the table.
2. Interpreting the Columns for Trading Decisions:
Market Structure Columns: Use the first three structure columns to define your trading bias. For a high-probability long setup, you would look for an asset with a "Bull" structure, a recent "Bull BOS" event, and a "HL" as the latest swing point. This confirms the uptrend is healthy and ongoing.
Liquidity Columns: These are crucial for identifying key price levels. A strong "Liquidity Bias" can confirm your directional bias. A "Mit▲" (mitigation) event at a support level can be a powerful entry trigger, as it shows that institutional buy orders are defending that zone.
Trend Line Column: This is ideal for breakout traders. A "Break▲" signal can serve as an excellent entry confirmation, especially if the overall "Market Structure" is already "Bull".
FOMO Column: This column is best used for identifying potential exhaustion points. For instance, if you are in a long trade and a "Big▲" FOMO signal appears after a strong rally, it could be a sign that the move is overextended and it's a good time to consider taking profits.
유료 스크립트
