OBV Divergence Indicator [TradingFinder] On-Balance Vol Reversal🔵 Introduction
The On-Balance Volume (OBV) indicator, introduced by Joe Granville in 1963, is a powerful technical analysis tool used to measure buying and selling pressure based on trading volume and price.
By aggregating trading volume—adding it on positive days and subtracting it on negative days—OBV creates a cumulative line that reflects market volume pressure, making it valuable for confirming trends, identifying entry and exit points, and forecasting potential price movements.
Divergences between price and OBV often provide significant signals. A bearish divergence occurs when the price forms higher highs while the OBV line forms lower highs. This discrepancy indicates that upward momentum is weakening, increasing the likelihood of a downward trend.
In contrast, a bullish divergence happens when the price makes lower lows, but the OBV line forms higher lows. This suggests increasing buying pressure and the potential for an upward trend reversal.
For instance, if the price is rising but the OBV trendline is falling, it may signal a bearish divergence, warning of a possible price decline. Conversely, if the price is falling while the OBV line is rising, this could signal a bullish divergence, indicating a possible price recovery. These signals are particularly useful for identifying market turning points.
OBV often acts as a leading indicator, moving ahead of price changes. For example, a rising OBV alongside stable or declining prices can signal an impending upward breakout.
Conversely, a declining OBV with rising prices may indicate that the current uptrend is losing strength. Traders using this strategy often consider entering positions at breakout levels while setting stop losses near recent swing highs or lows to manage risk effectively.
This integration highlights how OBV divergences can provide actionable insights for predicting price movements and managing trades efficiently.
Bullish Divergence :
Bearish Divergence :
🔵 How to Use
The OBV indicator, as a cumulative tool, assists analysts in comparing volume and price changes to identify new trends and key levels for entering or exiting trades. Beyond confirming existing trends, it is particularly effective in analyzing positive and negative divergences between price and volume, providing valuable signals for trading decisions.
🟣 Bullish Divergence
A bullish divergence occurs when the price continues its downward or stable trend, but the OBV line starts rising, forming a higher low compared to its previous low. This suggests increasing volume on up days relative to down days and often signals a reversal to the upside.
For instance, if an asset's price stabilizes near a support level but the OBV line shows an upward trend, this divergence could present an opportunity to enter a long position.
🟣 Bearish Divergence
A bearish divergence occurs when the price forms higher highs, but the OBV line declines, creating lower highs compared to previous peaks. This indicates decreasing volume on up days relative to down days and often acts as a warning for a reversal to the downside.
For example, if an asset’s price approaches a resistance level while OBV starts declining, this divergence may signal the beginning of a downtrend and could indicate a good time to exit long trades or enter short positions.
🔵 Setting
Period : The "Period" setting allows you to define the number of bars or intervals for "Periodic" and "EMA" modes. A shorter period captures more short-term movements, while a longer period smooths out the fluctuations and provides a broader view of market trends.
You can enable or disable labels to highlight key levels or divergences and tables to show numerical details like values and divergence types. These options allow for a customized chart display.
🔵 Table
The following table breaks down the main features of the oscillator. It covers four critical categories: Exist, Consecutive, Divergence Quality, and Change Phase Indicator.
Exist : If divergence is detected, a "+" will appear in this row.
Consecutive: Shows the number of consecutive divergences that have formed in a short period.
Divergence Quality : Evaluates the quality of the divergence based on the number of occurrences. One is labeled "Normal," two are "Good," and three or more are considered "Strong."
Change Phase Indicator : If a phase change is detected between two oscillation peaks, this is marked in the table.
🔵 Conclusion
The OBV (On Balance Volume) indicator is a simple yet effective tool in technical analysis that combines volume and price changes to provide a comprehensive view of market buying and selling pressure. By identifying positive and negative divergences, OBV enables analysts to detect early signs of trend reversals and refine their trading strategies.
Divergences in OBV often precede price changes, making it a leading indicator for predicting market movements. Using OBV alongside other technical tools can enhance decision-making accuracy and help traders identify better entry and exit points. However, it is essential to consider the limitations of OBV, such as the potential for signal errors and the impact of sudden news events.
Ultimately, OBV serves as a complementary tool in technical analysis, aiding in trend identification, signal confirmation, and risk management. A thoughtful application of this indicator, in combination with other analytical tools, can create valuable opportunities for profiting in financial markets.
스크립트에서 "key levels"에 대해 찾기

Adaptive Trend Flow [QuantAlgo]Adaptive Trend Flow 📈🌊
The Adaptive Trend Flow by QuantAlgo is a sophisticated technical indicator that harnesses the power of volatility-adjusted EMAs to navigate market trends with precision. By seamlessly integrating a dynamic dual-EMA system with adaptive volatility bands, this premium tool enables traders and investors to identify and capitalize on sustained market moves while effectively filtering out noise. The indicator's unique approach to trend detection combines classical technical analysis with modern adaptive techniques, providing traders and investors with clear, actionable signals across various market conditions and asset class.
💫 Indicator Architecture
The Adaptive Trend Flow provides a sophisticated framework for assessing market trends through a harmonious blend of EMA dynamics and volatility-based boundary calculations. Unlike traditional moving average systems that use fixed parameters, this indicator incorporates smart volatility measurements to automatically adjust its sensitivity to market conditions. The core algorithm employs a dual EMA system combined with standard deviation-based volatility bands, creating a self-adjusting mechanism that expands and contracts based on market volatility. This adaptive approach allows the indicator to maintain its effectiveness across different market phases - from ranging to trending conditions. The volatility-adjusted bands act as dynamic support and resistance levels, while the gradient visualization system provides instant visual feedback on trend strength and duration.
📊 Technical Composition and Calculation
The Adaptive Trend Flow is composed of several technical components that create a dynamic trending system:
Dual EMA System: Utilizes fast and slow EMAs for primary trend detection
Volatility Integration: Computes and smooths volatility for adaptive band calculation
Dynamic Band Generation: Creates volatility-adjusted boundaries for trend validation
Gradient Visualization: Provides progressive visual feedback on trend strength
📈 Key Indicators and Features
The Adaptive Trend Flow utilizes customizable length parameters for both EMAs and volatility calculations to adapt to different trading styles. The trend detection component evaluates price action relative to the dynamic bands to validate signals and identify potential reversals.
The indicator incorporates multi-layered visualization with:
Color-coded basis and trend lines (bullish/bearish)
Adaptive volatility-based bands
Progressive gradient background for trend duration
Clear trend reversal signals (𝑳/𝑺)
Smooth fills between key levels
Programmable alerts for trend changes
⚡️ Practical Applications and Examples
✅ Add the Indicator: Add the indicator to your TradingView chart by clicking on the star icon to add it to your favorites ⭐️
👀 Monitor Trends: Watch the basis line and trend band interactions to identify trend direction and strength. The gradient background intensity indicates trend duration and conviction.
🎯 Track Signals: Pay attention to the trend reversal markers that appear on the chart:
→ Long signals (𝑳) appear when price action confirms a bullish trend reversal
→ Short signals (𝑺) indicate validated bearish trend reversals
🔔 Set Alerts: Configure alerts for trend changes in both bullish and bearish directions, ensuring you never miss significant technical developments.
🌟 Summary and Tips
The Adaptive Trend Flow by QuantAlgo is a sophisticated technical tool designed to support trend-following strategies across different market environments and asset class. By combining dual EMA analysis with volatility-adjusted bands, it helps traders and investors identify significant trend changes while filtering out market noise, providing validated signals. The tool's adaptability through customizable EMA lengths, volatility smoothing, and sensitivity settings makes it suitable for various trading timeframes and styles, allowing users to capture trending opportunities while maintaining protection against false signals.
Key parameters to optimize for your trading and/or investing style:
Main Length: Adjust for more or less sensitivity to trend changes (default: 10)
Smoothing Length: Fine-tune volatility calculations for signal stability (default: 14)
Sensitivity: Balance band width for trend validation (default: 2.0)
Visual Settings: Customize appearance with color and display options
The Adaptive Trend Flow is particularly effective for:
Identifying sustained market trends
Detecting trend reversals with confirmation
Measuring trend strength and duration
Filtering out market noise and false signals
Remember to:
Allow the indicator to validate trend changes before taking action
Use the gradient background to gauge trend strength
Combine with volume analysis for additional confirmation
Consider multiple timeframes for a complete market view
Adjust sensitivity based on market volatility conditions

Uphorico Candle RangesThis script allows you to see the high and low prices of a specific previous timeframe directly on your TradingView chart. You can choose which previous period to view—previous month, week, day, or last Monday—and the script will plot two horizontal lines for the high and low prices of that period. These lines help you quickly identify key levels based on past performance.
Features of the Script:
1. Select Previous Timeframe: You can choose between:
• Month: Shows the high and low of the previous month.
• Week: Shows the high and low of the previous week.
• Day: Shows the high and low of the previous day.
• Monday: Shows the high and low of the most recent Monday.
2. Line Customization:
• Color: Choose different colors for the high and low lines.
• Thickness: Adjust the line thickness (1–5).
• Style: Choose from solid, dashed, or dotted lines.
3. Touch Source Candle Option:
• If enabled, the lines will start directly at the last candle of the selected timeframe (e.g., at the last candle of the previous month or week).
• If disabled, the lines will start from the current bar and extend to the right.
How It Works:
• The script retrieves the high and low prices from your selected previous timeframe and draws two horizontal lines (one for the high and one for the low).
• These lines provide a quick visual reference for key support and resistance levels based on past periods, making it easier to spot potential price action zones.
This tool is designed to be simple and customizable, helping you analyze past levels and make better trading decisions.

Price Action Volumetric Breaker Blocks [UAlgo]The Price Action Volumetric Breaker Blocks indicator is designed to identify and visualize significant price levels in the market. It combines concepts of price action, volume analysis, and market structure to provide traders with a comprehensive view of potential support and resistance areas. This indicator identifies "breaker blocks," which are price zones where the market has shown significant interest in the past.
These blocks are created based on swing highs and lows, and are further analyzed using volume data to determine their strength. The indicator also tracks market structure shifts, providing additional context to price movements.
By visualizing these key levels and market structure changes, traders can gain insights into potential areas of price reversal or continuation, helping them make more informed trading decisions.
🔶 Key Features
Dynamic Breaker Block Identification: The indicator automatically detects and draws breaker blocks based on swing highs and lows. These blocks represent areas of potential support and resistance.
Volume-Weighted Strength Analysis: Each breaker block is analyzed using volume data to determine its bullish and bearish strength. This is visually represented by the proportion of green (bullish) and red (bearish) coloring within each block.
Market Structure Break (MSB) and Break of Structure (BOS): The indicator identifies and labels Market Structure Breaks (MSB) and Break of Structure (BOS) events, providing context to larger market trends.
Customizable Settings:
- Adjustable swing length for identifying pivot points
- Option to show a specific number of recent breaker blocks
- Choice between wick or close price for violation checks
- Toggle to hide overlapping blocks for cleaner analysis
Violation Detection: Automatically detects when a breaker block has been violated (broken through), either by wick or close price, depending on user settings.
Overlap Control: Provides an option to hide overlapping order blocks, ensuring that the chart remains clean and easy to read when multiple blocks are detected in close proximity.
🔶 Interpreting Indicator
Breaker Blocks:
Breaker blocks are key areas where the price moves through and invalidates a previously identified order block. The indicator detects a breaker block when the price violates an order block by exceeding its high or low (depending on whether it's a bullish or bearish block). This violation is determined by either the wick or the close of a candle, depending on the user's selection in the "Violation Check" setting. When a breaker block is detected, the indicator removes the violated order block from the chart, signaling that the zone is no longer relevant for future price action.
Bullish Breaker Block: This occurs when a bearish order block (red) is violated by the price closing above the block’s top boundary or when the wick surpasses this level. It signals that a prior bearish structure has been invalidated, and the market may shift to a bullish trend.
Bearish Breaker Block: This occurs when a bullish order block (teal) is violated by the price closing below the block’s bottom boundary or when the wick drops below it. It suggests that a previous bullish structure has been broken, indicating potential bearish momentum.
Market Structure Labels:
"MSB" (Market Structure Break) labels indicate a potential change in trend direction.
"BOS" (Break of Structure) labels confirm the continuation of the current trend after breaking a significant level.
Block Strength:
A block with more green indicates stronger bullish interest.
A block with more red indicates stronger bearish interest.
The relative sizes of the green and red portions show the balance of power between buyers and sellers at that level.
🔶 Disclaimer
Use with Caution: This indicator is provided for educational and informational purposes only and should not be considered as financial advice. Users should exercise caution and perform their own analysis before making trading decisions based on the indicator's signals.
Not Financial Advice: The information provided by this indicator does not constitute financial advice, and the creator (UAlgo) shall not be held responsible for any trading losses incurred as a result of using this indicator.
Backtesting Recommended: Traders are encouraged to backtest the indicator thoroughly on historical data before using it in live trading to assess its performance and suitability for their trading strategies.
Risk Management: Trading involves inherent risks, and users should implement proper risk management strategies, including but not limited to stop-loss orders and position sizing, to mitigate potential losses.
No Guarantees: The accuracy and reliability of the indicator's signals cannot be guaranteed, as they are based on historical price data and past performance may not be indicative of future results.

ICT Indicator with Paper TradingThe strategy implemented in the provided Pine Script is based on **ICT (Inner Circle Trader)** concepts, particularly focusing on **order blocks** to identify key levels for potential reversals or continuations in the market. Below is a detailed description of the strategy:
### 1. **Order Block Concept**
- **Order blocks** are price levels where large institutional orders accumulate, often leading to a reversal or continuation of price movement.
- In this strategy, **order blocks** are identified when:
- The high of the current bar crosses above the high of the previous bar (for bullish order blocks).
- The low of the current bar crosses below the low of the previous bar (for bearish order blocks).
### 2. **Buy and Sell Signal Generation**
The core of the strategy revolves around identifying the **breakout** of order blocks, which is interpreted as a signal to either enter or exit trades:
- **Buy Signal**:
- Generated when the closing price crosses **above** the last identified bullish order block (i.e., the highest point during the last upward crossover of highs).
- This signals a potential upward trend, and the strategy enters a long position.
- **Sell Signal**:
- Generated when the closing price crosses **below** the last identified bearish order block (i.e., the lowest point during the last downward crossover of lows).
- This signals a potential downward trend, and the strategy exits any open long positions.
### 3. **Strategy Execution**
The strategy is executed using the `strategy.entry()` and `strategy.close()` functions:
- **Enter Long Positions**: When a buy signal is generated, the strategy opens a long position (buying).
- **Exit Positions**: When a sell signal is generated, the strategy closes the long position.
### 4. **Visual Indicators on the Chart**
To make the strategy easier to follow visually, buy and sell signals are marked directly on the chart:
- **Buy signals** are indicated with a green upward-facing triangle above the bar where the signal occurred.
- **Sell signals** are indicated with a red downward-facing triangle below the bar where the signal occurred.
### 5. **Key Elements of the Strategy**
- **Trend Continuation and Reversals**: This strategy is attempting to capture trends based on the breakout of important price levels (order blocks). When the price breaks above or below a significant order block, it is expected that the market will continue in that direction.
- **Order Block Strength**: Order blocks are considered strong areas where price action could reverse or accelerate, based on how institutional investors place large orders.
### 6. **Paper Trading**
This script uses **paper trading** to simulate trades without actual money being involved. This allows users to backtest the strategy, seeing how it would have performed in historical market conditions.
### 7. **Basic Strategy Flow**
1. **Order Block Identification**: The script constantly monitors price movements to detect bullish and bearish order blocks.
2. **Buy Signal**: If the closing price crosses above the last order block high, the strategy interprets it as a sign of bullish momentum and enters a long position.
3. **Sell Signal**: If the closing price crosses below the last order block low, it signals a bearish momentum, and the strategy closes the long position.
4. **Visual Representation**: Buy and sell signals are displayed on the chart for easy identification.
### **Advantages of the Strategy:**
- **Simple and Clear Rules**: The strategy is based on clearly defined rules for identifying order blocks and trade signals.
- **Effective for Trend Following**: By focusing on breakouts of order blocks, this strategy attempts to capture strong trends in the market.
- **Visual Aids**: The plot of buy/sell signals helps traders to quickly see where trades would have been placed.
### **Limitations:**
- **No Shorting**: This strategy only enters long positions (buying). It does not account for shorting opportunities.
- **No Risk Management**: There are no built-in stop losses, trailing stops, or profit targets, which could expose the strategy to large losses during adverse market conditions.
- **Whipsaws in Range Markets**: The strategy could produce false signals in sideways or choppy markets, where breakouts are short-lived and prices quickly reverse.
### **Overall Strategy Objective:**
The goal of the strategy is to enter into long positions when the price breaks above a significant order block, and exit when it breaks below. The strategy is designed for trend-following, with the assumption that price will continue in the direction of the breakout.
Let me know if you'd like to enhance or modify this strategy further!

Dynamic Volume RSI (DVRSI) [QuantAlgo]Introducing the Dynamic Volume RSI (DVRSI) by QuantAlgo 📈✨
Elevate your trading and investing strategies with the Dynamic Volume RSI (DVRSI) , a powerful tool designed to provide clear insights into market momentum and trend shifts. This indicator is ideal for traders and investors who want to stay ahead of the curve by using volume-responsive calculations and adaptive smoothing techniques to enhance signal clarity and reliability.
🌟 Key Features:
🛠 Customizable RSI Settings: Tailor the indicator to your strategy by adjusting the RSI length and price source. Whether you’re focused on short-term trades or long-term investments, DVRSI adapts to your needs.
🌊 Adaptive Smoothing: Enable adaptive smoothing to filter out market noise and ensure cleaner signals in volatile or choppy market conditions.
🎨 Dynamic Color-Coding: Easily identify bullish and bearish trends with color-coded candles and RSI plots, offering clear visual cues to track market direction.
⚖️ Volume-Responsive Adjustments: The DVRSI reacts to volume changes, giving greater significance to high-volume price moves and improving the accuracy of trend detection.
🔔 Custom Alerts: Stay informed with alerts for key RSI crossovers and trend changes, allowing you to act quickly on emerging opportunities.
📈 How to Use:
✅ Add the Indicator: Set up the DVRSI by adding it to your chart and customizing the RSI length, price source, and smoothing options to fit your specific strategy.
👀 Monitor Visual Cues: Watch for trend shifts through the color-coded plot and candles, signaling changes in momentum as the RSI crosses key levels.
🔔 Set Alerts: Configure alerts for critical RSI crossovers, such as the 50 line, ensuring you stay on top of potential market reversals and opportunities.
🔍 How It Works:
The Dynamic Volume RSI (DVRSI) is a unique indicator designed to provide more accurate and responsive signals by incorporating both price movement and volume sensitivity into the RSI framework. It begins by calculating the traditional RSI values based on a user-defined length and price source, but unlike standard RSI tools, the DVRSI applies volume-weighted adjustments to reflect the strength of market participation.
The indicator dynamically adjusts its sensitivity by factoring in volume to the RSI calculation, which means that price moves backed by higher volumes carry more weight, making the signal more reliable. This method helps identify stronger trends and reduces the risk of false signals in low-volume environments. To further enhance accuracy, the DVRSI offers an adaptive smoothing option that allows users to reduce noise during periods of market volatility. This adaptive smoothing function responds to market conditions, providing a cleaner signal by reducing erratic movements or price spikes that could lead to misleading signals.
Additionally, the DVRSI uses dynamic color-coding to visually represent the strength of bullish or bearish trends. The candles and RSI plots change color based on the RSI values crossing critical thresholds, such as the 50 level, offering an intuitive way to recognize trend shifts. Traders can also configure alerts for specific RSI crossovers (e.g., above 50 or below 40), ensuring that they stay informed of potential trend reversals and significant market shifts in real-time.
The combination of volume sensitivity, adaptive smoothing, and dynamic trend visualization makes the DVRSI a robust and versatile tool for traders and investors looking to fine-tune their market analysis. By incorporating both price and volume data, this indicator delivers more precise signals, helping users make informed decisions with greater confidence.
Disclaimer:
The Dynamic Volume RSI is designed to enhance your market analysis but should not be used as a sole decision-making tool. Always consider multiple factors before making any trading or investment decisions. Past performance is not indicative of future results.

Lsma For Loop | viResearchLsma For Loop | viResearch
Conceptual Foundation and Innovation
The "Lsma For Loop" indicator offers a unique combination of the Least Squares Moving Average (LSMA) with a dynamic scoring system based on a loop function. By comparing the current LSMA value with historical values over a user-defined range, this indicator generates a detailed score that helps detect trend strength and potential reversals. This approach provides traders with a more nuanced analysis of price action, allowing them to identify trends earlier and with more accuracy.
The LSMA, which minimizes lag compared to traditional moving averages, is ideal for detecting trends as it provides a smooth and quick-to-respond line. When combined with the loop-based scoring system, traders can benefit from a powerful tool for analyzing market momentum and capturing profitable trends.
Technical Composition and Calculation
The "Lsma For Loop" script features two essential components:
Least Squares Moving Average (LSMA): The LSMA is calculated over a user-defined length using a linear regression model. It provides a smooth line that follows price trends more closely, reducing the noise that is often present in simple moving averages.
For Loop Scoring System: This system evaluates the LSMA over a range of previous values, generating a score based on whether the current LSMA is higher or lower than its previous values within the specified range. The resulting score reflects the strength of the trend, with higher scores indicating a stronger uptrend and lower scores signaling a downtrend.
Key Calculations:
LSMA Calculation: The LSMA is derived from the closing price over the selected period (len), providing a smooth moving average that fits the price data closely.
For Loop Scoring:
The loop iterates over a range of previous LSMA values, comparing the current LSMA to each past value.
If the current LSMA is higher than a previous value, a positive score is added; if it is lower, a negative score is added. The sum of these comparisons forms the overall score.
Features and User Inputs
The "Lsma For Loop" script offers a range of customization options, allowing traders to tailor the indicator to their specific trading strategies and market conditions:
LSMA Length: Adjust the length of the LSMA, controlling the smoothness of the indicator and how quickly it reacts to price changes.
Loop Range (From and To): Define the range over which the for loop evaluates LSMA values. This provides flexibility in assessing momentum over different timeframes.
Thresholds: Customizable threshold levels are used to define when the score indicates an uptrend or downtrend. This allows traders to fine-tune the sensitivity of the indicator to market movements.
Practical Applications
The "Lsma For Loop" is a versatile tool for traders who want to leverage the advantages of LSMA smoothing while gaining a more detailed view of trend strength. This indicator is particularly useful for:
Identifying Trend Reversals: The loop-based scoring system provides an early indication of potential trend reversals, allowing traders to react before major market movements.
Confirming Trend Strength: By evaluating the LSMA against a range of previous values, the script helps confirm whether a trend is strengthening or weakening.
Enhanced Market Positioning: The customizable range and thresholds enable traders to adapt the script to different market conditions, whether they are day trading or swing trading.
Advantages and Strategic Value
The primary advantage of the "Lsma For Loop" script lies in its ability to provide a more granular analysis of LSMA behavior through the use of the for loop. This dynamic approach reduces the likelihood of false signals and offers greater accuracy in detecting trends. The indicator’s versatility makes it a valuable tool for both short-term and long-term trading strategies.
Alerts and Visual Cues
The script includes built-in alert conditions to notify traders of key trend changes:
Lsma For Loop Long: Indicates a potential upward trend when the score exceeds the upper threshold.
Lsma For Loop Short: Signals a potential downward trend when the score falls below the lower threshold.
Additionally, visual cues such as background color changes highlight when the score crosses certain key levels, providing an easy-to-read representation of market trends directly on the chart.
Summary and Usage Tips
The "Lsma For Loop | viResearch" indicator provides traders with a powerful tool that combines LSMA smoothing with a dynamic loop-based scoring system for trend detection. Incorporating this script into your trading strategy can help improve trend identification and enhance decision-making around entries and exits. Whether you are trading in trending markets or looking for early reversal signals, this script offers a reliable and flexible solution.
Note: Backtests are based on past results and are not indicative of future performance.

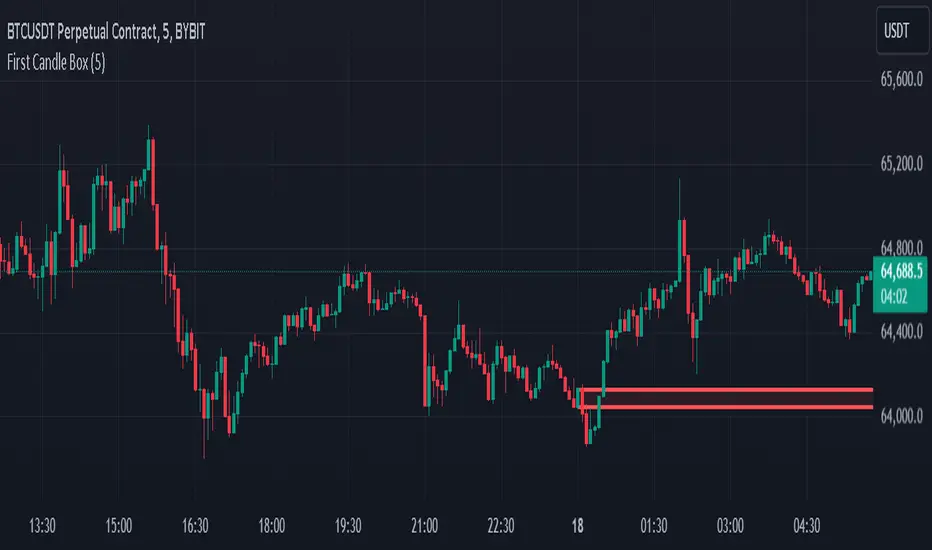
First 5-Minute Candle BoxTitle: "First 5-Minute Candle Box Indicator"
Description:
Introducing the "First 5-Minute Candle Box" indicator for TradingView! This powerful script is designed to help traders visualize and analyze the high and low prices of the first 5-minute candle of each trading day. By clearly marking this crucial price range, traders can gain valuable insights into potential support and resistance levels right from the start of the trading session.
Features:
First 5-Minute Candle High and Low: Automatically captures and displays the high and low prices of the first 5-minute candle of the trading day, providing key levels for intraday trading strategies.
Daily Reset: Resets the high and low variables at the beginning of each new trading day to ensure accurate data capture for the current session.
Visual Box Representation: Draws a visual rectangle box on the chart from the start of the trading day to the end, highlighting the range between the high and low of the first 5-minute candle.
Customizable Appearance: The box is drawn with a customizable border color and background color, allowing traders to personalize the indicator to their chart's aesthetic.
Usage:
Add the indicator to your TradingView chart to automatically display the high and low of the first 5-minute candle of each trading day.
Utilize these levels as potential support and resistance zones for your intraday trading strategies.
Gain an early edge in your trading day by identifying key price levels right from the market open.
Code Explanation:
Variable Initialization: The script initializes variables to store the high and low prices of the first 5-minute candle.
Daily Reset Logic: At the start of a new day, the variables are reset to ensure they capture the correct data for the new trading session.
Price Capture Logic: The high and low prices of the first 5-minute candle are captured and stored.
Box Drawing Logic: The script defines the start and end times for the visual box and draws the rectangle if the high and low prices are set.
Customizable Box: The box is drawn with specified colors and border properties, providing a clear visual representation on the chart.
Enhance your trading analysis with the "First 5-Minute Candle Box" indicator. Add it to your TradingView chart today and start leveraging the power of early price action!
Liquidity Hour by Ibramiho v2Liquidity Hour by Ibramiho (Version 2) - Identify High-Potential Reversal Zones
Understanding the pre-New York session hour is crucial for institutional traders. This period is often characterized by increased liquidity and price volatility as major financial players prepare for the upcoming trading day. The Liquidity Hour indicator capitalizes on this phenomenon, automatically pinpointing the candle (by default, in orange) immediately before the New York session opens.
Why Focus on This Candle?
Liquidity Magnet: Institutional traders often use this hour to establish or adjust positions, creating pockets of liquidity.
Breakout and Retracement Potential: The indicator helps you spot potential areas where price might retrace after a breakout, offering high-probability trading opportunities.
Visual Clarity: The highlighted candle acts as a visual anchor, making it easy to identify these key levels on your chart.
How It Works
1. Automatic Detection: The indicator intelligently detects the pre-New York session candle, regardless of your chart's timeframe.
2. Colour Coding: The candle is highlighted in orange (customizable), instantly drawing your attention.
3. Trade Insights: Watch for price breakouts above or below the highlighted candle. When price retraces back to this level, it signals a potential entry or exit point.
Key Features
Customizable Colour: Change the highlight colour to suit your chart preferences.
Working Timeframes: Works on timeframes, from minutes up to 2 hours timeframe.
Versatile Trading: Suitable for both intraday and swing trading strategies.
Unlock the Power of Institutional Liquidity
Don't miss out on the opportunities that arise in the hour before the New York session. With the Liquidity Hour indicator, you'll gain a valuable edge by identifying key levels where price action is most likely to reverse.

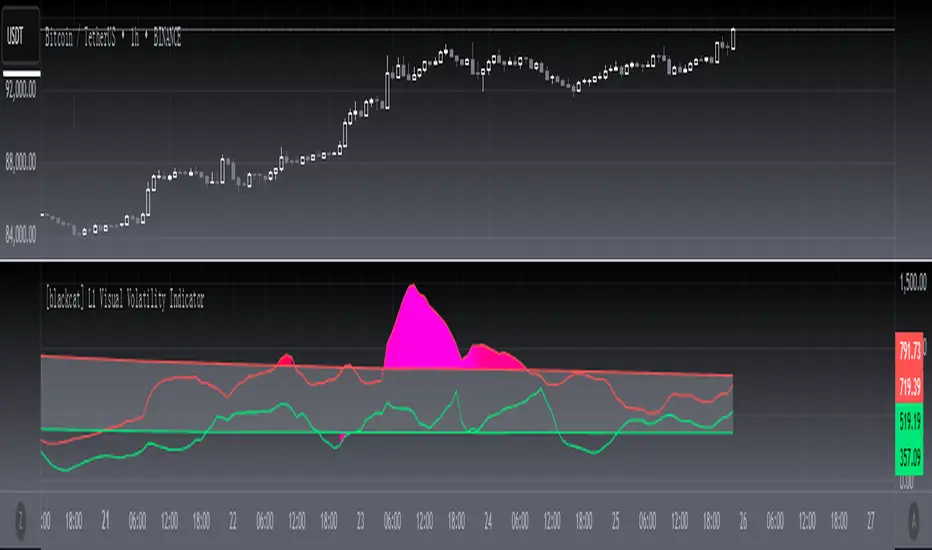
[blackcat] L1 Visual Volatility IndicatorHey there! Let's get into the details about dynamic rate indicators, how they work, their importance, usage, and benefits in trading.
Dynamic rate indicators are essential in trading as they help traders assess the volatility and risk level of the market, so they can make the right trading strategies and risk management measures.
When it comes to the importance of dynamic rate indicators, they provide critical information about market volatility, which is super important for traders. Traders can use this information to understand the risk level of the market, determine market stability and instability, and adjust trading strategies based on volatility changes.
Now let's talk about the usage of dynamic rate indicators. They have different usage times for different trading strategies and market environments. Generally, when market volatility is low, traders can take advantage of the opportunity to do trend tracking or oscillating trades. When market volatility is high, traders can take a more conservative approach, such as using stop-loss orders or reducing position sizes.
Using dynamic rate indicators can bring several benefits. First, they can help traders evaluate the risk level of the market, so they can develop suitable risk management strategies. Traders can adjust stop-loss and take-profit levels based on changes in volatility to control risk. Second, dynamic rate indicators provide information about market trends and price fluctuations, helping traders make wiser trading decisions. Traders can determine entry and exit points based on the signals of dynamic rate indicators. Lastly, dynamic rate indicators play a significant role in option pricing. Implied volatility helps traders evaluate option prices and market expectations for future volatility, so they can carry out option trades or hedging operations.
In conclusion, dynamic rate indicators are essential for traders as they help assess market volatility and risk levels, develop suitable trading strategies and risk management measures, and increase trading success and profitability. Remember that different indicators are suitable for different types of markets, so it is essential to choose the right one for your specific trading needs.
This indicator is a powerful tool for traders who want to stay ahead of the market and make informed trading decisions. By analyzing trends in volatility, this indicator can provide valuable insights into market sentiment and help traders identify potential trading opportunities.
One of the key advantages of the L1 Visual Volatility Indicator is its ability to adapt to changing market conditions. The channel structure it constructs based on ATR characteristics provides a framework for tracking volatility that can be adjusted to different timeframes and asset classes. This allows traders to customize the indicator to their specific needs and trading style, making it a versatile tool for a wide range of trading strategies.
Another advantage of this indicator is its use of gradient colors to differentiate between Bullish and Bearish volatility. This provides a visual representation of market sentiment that can help traders quickly identify potential trading opportunities and make informed decisions. Additionally, the use of Fibonacci's long-term moving average to define the sideways consolidation area provides a reliable framework for identifying key levels of support and resistance, further enhancing the indicator's usefulness in trading.
In conclusion, the L1 Visual Volatility Indicator is a powerful tool for traders looking to stay ahead of the market and make informed trading decisions. Its ability to adapt to changing market conditions and use of gradient colors to differentiate between Bullish and Bearish volatility make it a versatile and effective tool for a wide range of trading strategies. By incorporating this indicator into their trading arsenal, traders can gain valuable insights into market sentiment and improve their chances of success in the markets.
Standardized MACD Heikin-Ashi TransformedThe Standardized MACD Heikin-Ashi Transformed (St. MACD) is an advanced indicator designed to overcome the limitations of the traditional MACD. It offers a more robust and standardized measure of momentum, making it comparable across different timeframes and securities. By incorporating the Heikin-Ashi transformation, the St. MACD provides a smoother visualization of trends and potential reversals, enhancing its utility for traders seeking a clearer view of the underlying market direction.
Methodology:
The calculation of St. MACD begins with the traditional MACD, which computes the difference between two exponential moving averages (EMAs) of the price. To address the issue of non-comparability across assets, the St. MACD normalizes its values using the exponential average of the price's height. This normalization process ensures that the indicator's readings are not influenced by the absolute price levels, allowing for objective and quantitatively defined comparisons of momentum strength.
Furthermore, St. MACD utilizes the Heikin-Ashi transformation, which involves deriving candles from the price data. These Heikin-Ashi candles provide a smoother representation of trends and help filter out noise in the market. A predictive curve of Heikin-Ashi candles within the St. MACD turns blue or red, indicating the prevailing trend direction. This feature enables traders to easily identify trend shifts and make better informed trading decisions.
Advantages:
St. MACD offers several key advantages over the traditional MACD-
Standardization: By normalizing the indicator's values, St. MACD becomes comparable across different assets and timeframes. This makes it a valuable tool for traders analyzing various markets and seeking consistent momentum measurements.
Heikin-Ashi Transformation: The integration of the Heikin-Ashi transformation smoothes out the indicator's fluctuations and enhances trend visibility. Traders can more easily identify trends and potential reversal points, improving their market analysis.
Quantifiable Momentum: St. MACD's key levels represent the strength of momentum, providing traders with a quantifiable framework to gauge the intensity of market movements. This feature helps identify periods of increased or decreased momentum.
Utility:
The St. MACD indicator offers versatile utility for traders-
Trend Identification: Traders can use the color-coded predictive curve of Heikin-Ashi candles to swiftly determine the prevailing trend direction. This aids in identifying potential entry and exit points in the market.
Reversal Signals: Colored extremes within the St. MACD signal potential price reversals, alerting traders to potential turning points in the market. This assists in making timely decisions during market inflection points.
Overbought/Oversold Conditions: The histogram version of St. MACD can be used in conjunction with the bands to detect short-term overbought or oversold market conditions, allowing traders to adjust their strategies accordingly.
In conclusion, this tool addresses the limitations of the traditional MACD by providing a standardized and comparable momentum indicator. Its incorporation of the Heikin-Ashi transformation enhances trend visibility and assists traders in making more informed decisions. With its quantifiable momentum measurements and various utility features, the St. MACD is a valuable tool for traders seeking a clearer and more objective view of market trends and reversals.
Key Features:
Display Modes: MACD, Histogram or Hybrid
Reversion Triangles by adjustable thresholds
Bar Coloring Methods: MidLine, Candles, Signal Cross, Extremities, Reversions
Example Charts:
-Traditional limitations-
-Comparisons across time and securities-
-Showcase-
See Also:
-Other Heikin-Ashi Transforms-

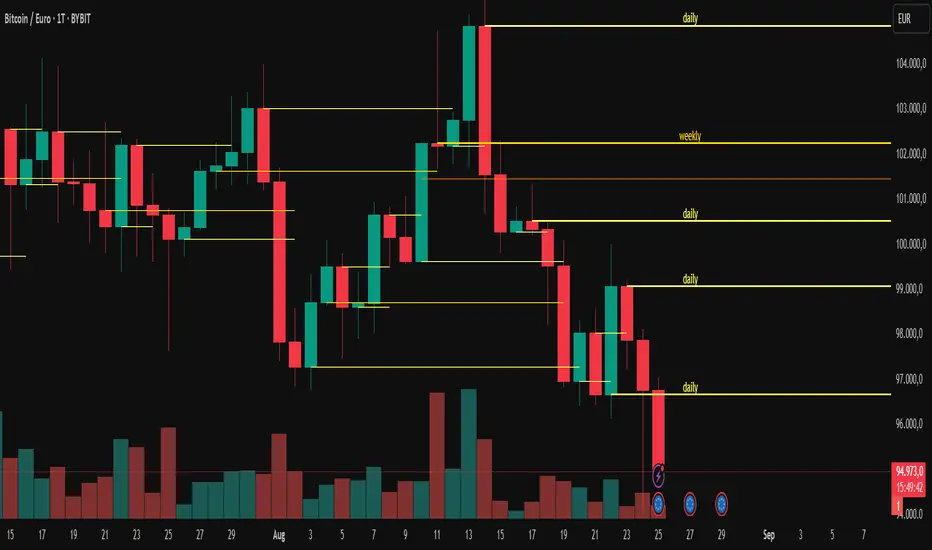
All-In-One Sessions, Weekly, Monday, Previous Highs/LowsWe are forever drawing key levels on our charts with saved drawing templates, but finding the levels, adding the labels, is all tedious stuff. We have indicators, but we have multiple different ones at a time.
What if you could just tick a box on/off?
Well now you can.
This all in one 'levels' indicator is designed to show all the key highs and lows from previous weeks, Monday, the current week, as well as an option to highlight the market sessions and their highs and lows.
There are lots of options available for extending lines and choosing their colors, so once you have set it up how you want, don't forget to save YOUR defaults.
Oorah.

AbdulLibraryLibrary "AbdulLibrary"
The library consists of three sections:
Technical Analysis Functions - A collection of tools commonly used by day traders
Trading Setup Filters Functions - A number of filters that help day traders to screen trading signals
Candlestick Pattern Detection Functions - To detect different candlestick patterns that are used in day trading setups
Note that this would have been possible without the help of @ZenAndTheArtOfTrading as I build-up this library after completing his pine script mastery course so big thanks to him
The content of the library are:-
fibLevels(preDayClose, preDayHigh, preDayLow) Calculates Daily Pivot Point and Fibonacci Key Levels
Parameters:
preDayClose : The previous day candle close
preDayHigh : The previous day candle high
preDayLow : The previous day candle low
Returns: Returns Daily Pivot Point and Fibonacci Key Levels as a tuple
bullishFib(canHigh, canLow, fibLevel) Calculates Fibonacci Levels in Bullish move
Parameters:
canHigh : The high of the move
canLow : The low of the move
fibLevel : The Fib level as % you want to calculate
Returns: Returns The Fib level for the Bullish move
bearishFib(canHigh, canLow, fibLevel) Calculates Fibonacci Levels in Bearish move
Parameters:
canHigh : The high of the move
canLow : The low of the move
fibLevel : The Fib level as % you want to calculate
Returns: Returns The Fib level for the Bearish move
getCandleSize() Calculates the size of candle (high - low) in points
Returns: Returns candle size in points
getCandleBodySize() Calculates the size of candle (close - open) in points
Returns: Returns candle body size in points
getHighWickSize() Calculates the high wick size of candle in points
Returns: Returns The high wick size of candle in points
getLowWickSize() Calculates the low wick size of candle in points
Returns: Returns The low wick size of candle in points
getBodyPercentage() Calculates the candle body size as % of overall candle size
Returns: Returns The candle body size as % of overall candle size
isSwingHigh(period) Checks if the price has created new swing high over a period of time
Parameters:
period : The lookback time we want to check for swing high
Returns: Returns True if the current candle or the previous candle is a swing high
isSwingLow(period) Checks if the price has created new swing low over a period of time
Parameters:
period : The lookback time we want to check for swing low
Returns: Returns True if the current candle or the previous candle is a swing low
isDojiSwingHigh(period) Checks if a doji is a swing high over a period of time
Parameters:
period : The lookback time we want to check for swing high
Returns: Returns True if the doji is a swing high
isDojiSwingLow(period) Checks if a doji is a swing low over a period of time
Parameters:
period : The lookback time we want to check for swing low
Returns: Returns True if the doji is a swing low
isBigBody(atrFilter, atr, candleBodySize, multiplier) Checks if a candle has big body compared to ATR
Parameters:
atrFilter : Check if user wants to use ATR to filter candle-setup signals
atr : The ATR value to be used to compare candle body size
candleBodySize : The candle body size
multiplier : The multiplier to be used to compare candle body size
Returns: Returns Boolean true if the candle setup is big
isSmallBody(atrFilter, atr, candleBodySize, multiplier) Checks if a candle has small body compared to ATR
Parameters:
atrFilter : Check if user wants to use ATR to filter candle-setup signals
atr : The ATR value to be used to compare candle body size
candleBodySize : The candle body size
multiplier : The multiplier to be used to compare candle body size
Returns: Returns Boolean true if the candle setup is small
isHammer(fibLevel, colorMatch) Checks if a candle is a hammer based on user input parameters and candle conditions
Parameters:
fibLevel : Fib level to base candle body on
colorMatch : Checks if user needs for the candel to be green
Returns: Returns Boolean - True if the candle setup is hammer
isShootingStar(fibLevel, colorMatch) Checks if a candle is a shooting star based on user input parameters and candle conditions
Parameters:
fibLevel : Fib level to base candle body on
colorMatch : Checks if user needs for the candel to be red
Returns: Returns Boolean - True if the candle setup is star
isBullEngCan(allowance, period) Check if a candle is a bullish engulfing candle
Parameters:
allowance : How many points the candle open is allowed to be off (To allow for gaps)
period : The lookback period for swing low check
Returns: Boolean - True only if the candle is a bullish engulfing candle
isBearEngCan(allowance, period) Check if a candle is a bearish engulfing candle
Parameters:
allowance : How many points the candle open is allowed to be off (To allow for gaps)
period : The lookback period for swing high check
Returns: Boolean - True only if the candle is a bearish engulfing candle
isBullDoji(maxSize, wickLimit, colorFilter) Check if a candle is a bullish doji candle
Parameters:
maxSize : Maximum candle body size as % of total candle size to be considered as doji
wickLimit : Maximum wick size of one wick compared to the other wick
colorFilter : Checks if the doji is green
Returns: Boolean - True if the candle is a bullish doji
isBearDoji(maxSize, wickLimit, colorFilter) Check if a candle is a bearish doji candle
Parameters:
maxSize : Maximum candle body size as % of total candle size to be considered as doji
wickLimit : Maximum wick size of one wick compared to the other wick
colorFilter : Checks if the doji is red
Returns: Boolean - True if the candle is a bearish doji
isBullOutBar() Check if a candle is a bullish outside bar
Returns: Boolean - True if the candle is a bullish outside bar
isInsideBar() Check if a candle is an inside bar
Returns: Returns Boolean - True if a candle is an inside bar

TrendlinesTrendline S&R
This indicator is an automated technical analysis tool designed to identify the most relevant Support and Resistance (S&R) zones based on market pivots. Unlike standard pivot indicators that clutter the chart with historic lines, this script uses a "Closest-to-Price" algorithm to display only the single most relevant Support (Green) and Resistance (Red) zone currently interacting with price action.
It solves common frustrations with automated trendlines—specifically the issue of lines disappearing immediately upon a breakout—by introducing a Stability Buffer.
Key Features & Importance
The script scans hundreds of potential trendlines but only draws the one geographically closest to the current price.
Importance: This ensures you are looking at the zone that matters right now. It filters out distant or irrelevant historic lines, keeping your chart clean and focused on immediate price action.
🛡️ 5-Bar Stability Buffer (Anti-Flicker)
Feature: A hardcoded 5-bar "memory" prevents the zone from disappearing the moment price touches or breaks it.
Importance: This is critical for trading breakouts. It allows you to see the zone persist while price breaches it, helping you distinguish between a true breakout, a fakeout, or a retest, without the reference level vanishing from your screen.
🔍 Dynamic Pivot Filtering
Feature: Uses a restricted Pivot Strength (5-15) and Minimum Confirmation (2-8 touches).
Importance: By enforcing these limits, the indicator ignores insignificant market noise and micro-swings, ensuring that drawn zones represent structural market levels with genuine liquidity.
🔔 Integrated Alert System
Feature: Built-in alerts for "Zone Breakout" (candle close crossing the zone) and "Zone Touch" (wick entering the zone).
Importance: Allows you to set the indicator and walk away. You will be notified instantly when price interacts with these key levels, removing the need to stare at the chart.
📉 Adaptive Tolerance (Fixed ATR)
Feature: Uses a fixed ATR multiplier internally to determine the width of the zone.
Importance: This automatically adjusts the thickness of the support/resistance zone based on the asset's volatility.
Settings Guide
Bars to Apply: How far back in history the script looks for pivots (Default: 300).
Pivot Source: Choose between calculating from "High/Low" (wicks) or "Close" (bodies).
Pivot Strength: The number of bars required on each side to define a swing point (Range: 5–15).
Min Pivot Confirmation: The minimum number of touches required to validate a trendline (Range: 2–8).
How to Use
Add the indicator to your chart.
Adjust Pivot Strength if you want to catch smaller swings (lower number) or major structures (higher number).
Set an alert in TradingView by clicking the "Clock" icon, selecting this indicator, and choosing "Zone Breakout" or "Zone Touch".

GCM Quantum Strike: VMDPB & MarubozuTitle Field: GCM Quantum Strike: VMDPB & Marubozu
Description:
GCM Quantum Strike is a comprehensive technical analysis suite designed to visualize Momentum (Marubozu), Trend (Ribbons/DEMA), and Key Levels (PDHL/VWAP) on a single overlay.
The core innovation of this script is the "Phantom Mode" Marubozu Engine, a custom coding technique designed to solve the issue of color transparency mixing on overlay charts.
Originality & Concept
Standard scripts often struggle when highlighting specific candle patterns; drawing a highlight over an existing candle results in muddy, mixed colors due to transparency blending.
GCM Quantum Strike solves this using a unique logic flow:
1. Detection: It scans price action for Marubozu candles based on strict ATR (Volatility) and Percentage (Body/Wick) requirements.
2. Phantom Mode: When a signal is found, the script programmatically turns the original chart bar 100% invisible (color.rgb(0,0,0,100)).
3. Reconstruction: It instantly draws a new, Solid (100% Opacity) custom candle in that exact space.
This results in crisp, "Quantum" styled signals that pop off the screen without blending with the background or previous themes.
How it Works & Key Features
1. The Marubozu Engine (GM / RM)
• Logic: A candle is identified as a Marubozu if:
o Size: The range exceeds a user-defined multiple of the ATR (14).
o Body: Occupies >80% (default) of the total range.
o Wicks: Occupy <10% (default) of the total range.
• Visuals:
o GM (Green Marubozu): Signals strong Bullish influx.
o RM (Red Marubozu): Signals strong Bearish influx.
o Both are rendered in solid Neon Green/Red.
2. Trend Ribbons & Averages
• EMA Ribbons: A visual ribbon formed by EMA 5, 9, 15, and SMA 20. The color intensity changes based on the slope alignment, helping identify the strength of the immediate trend.
• VWMA 20 (Volume Weighted): Plots in Light Blue (Rising) or Orange (Falling). This helps confirm if price moves are backed by volume.
• DEMA 100 (Step-Line): A Double EMA plotted as a step-line to act as a clear, non-noisy baseline for the long-term trend.
3. Institutional Levels
• PDH / PDL: The Previous Day's High and Low are fetched from daily data (non-repainting) and plotted as "Cross" markers. These often act as strong intraday magnets or reversal points.
• VWAP: The classic Session Volume Weighted Average Price (Yellow).
• Bollinger Bands: Standard 2.0 deviation bands to visualize volatility expansion and contraction.
How to Use
This script is designed for "Confluence Trading." Do not rely on one signal alone; look for agreement among the indicators.
1. The Setup: Wait for the EMA Ribbons and VWMA 20 to align in color (e.g., Green/Blue for Buy).
2. The Trigger: Look for a GM (Green Marubozu) label. This indicates a high-momentum breakout or trend continuation candle.
3. The Validation: Ensure the GM candle closes outside the EMA ribbons or above the VWAP.
4. The Targets: Use the PDH (Red Crosses) or Upper Bollinger Band as logical take-profit zones.
Settings
• Marubozu Settings: Fully adjustable. You can change the Min Body %, Max Shadow %, and ATR Multiplier to filter out smaller candles during choppy markets.
• Moving Averages: Adjust lengths for VWMA, SMA, and DEMA.
• Toggles: Every component (PDHL, BB, Ribbons) can be toggled on/off to keep your chart clean.

Bollinger Bands Delta Matrix Analytics [BDMA] Bollinger Bands Delta Matrix Analytics (BDMA) v7.0
Deep Kinetic Engine – 5x8 Volatility & Delta Decision Matrix
1. Introduction & Concept
Bollinger Bands Delta Matrix Analytics (BDMA) v7.0 is an analytical framework that merges:
- Spatial analysis via Bollinger Bands (%B location),
- with a 4-factor Deep Kinetic Engine based on:
• Total Volume
• Buy Volume
• Sell Volume
• Delta (Buy – Sell) Z-Scores
and converts them into an expanded 5×8 decision matrix that continuously tracks where price is trading and how the underlying orderflow is behaving.
BDMA is not a trading system or strategy. It does not generate entry/exit signals.
Instead, it provides a structured contextual map of volatility, volume, and delta so traders can:
- identify climactic extensions vs. fakeouts,
- distinguish strong initiative moves vs. passive absorption,
- and detect squeezes, traps, and liquidity voids with a unified visual dashboard.
2. Spatial Engine – Bollinger S-States (S1–S5)
The spatial dimension of BDMA comes from classic Bollinger Bands.
Price location is expressed as Percent B (%B) and mapped into 5 spatial states (S-States):
S1 – Hyper Extension (Above Upper Band)
Price has pushed beyond the upper Bollinger Band.
Often associated with parabolic or blow-off behavior, late-stage momentum, and elevated reversal risk.
S2 – Resistance Test (Upper Zone)
Price trades in the upper Bollinger region but remains inside the bands.
Represents a sustained test of resistance, typically within an established or emerging uptrend.
S3 – Neutral Zone (Middle)
Price hovers around the mid-band.
This is the mean reversion gravity field where the market often consolidates or transitions between regimes.
S4 – Support Test (Lower Zone)
Price trades in the lower Bollinger region but inside the bands.
Represents a sustained test of support within range or downtrend structures.
S5 – Hyper Drop (Below Lower Band)
Price extends below the lower Bollinger Band.
Often aligned with panic, forced liquidations, or capitulation-type behavior, with increased snap-back risk.
These 5 S-States define the vertical axis (rows) of the BDMA matrix.
3. Deep Kinetic Engine – 4-Factor Z-Score & D-States (D1–D8)
The Deep Kinetic Engine transforms raw volume and delta into standardized Z-Scores to measure how abnormal current activity is relative to its recent history.
For each bar:
- Raw Buy Volume is estimated from the candle’s position within its range
- Raw Sell Volume is complementary to buy volume
- Raw Delta = Buy Volume – Sell Volume
- Total Volume = Buy Volume + Sell Volume
These 4 series are then normalized using a unified Z-Score lookback to produce:
1. Z_Vol_Total – overall activity and liquidity intensity
2. Z_Vol_Buy – aggression from buyers (attack)
3. Z_Vol_Sell – aggression from sellers (defense or attack)
4. Z_Delta – net victory of one side over the other
Thresholds for Extreme, Significant, and Neutral Z-Score levels are fully configurable, allowing you to tune the sensitivity of the kinetic states.
Using Z_Vol_Total and Z_Delta (plus threshold logic), BDMA assigns one of 8 Deep Kinetic states (D-States):
D1 – Climax Buy
Extreme Total Volume + Extreme Positive Delta → Buying climax or blow-off behavior.
D2 – Strong Buy
High Volume + High Positive Delta → Confirmed bullish initiative activity.
D3 – Weak Buy / Fakeout
Low Volume + High Positive Delta → Bullish delta without commitment, low-liquidity breakout risk.
D4 – Absorption / Conflict
High Volume + Neutral Delta → Aggressive two-way trade, strong absorption, war zone behavior.
D5 – Neutral
Low Volume + Neutral Delta → Low-energy environment with low conviction.
D6 – Weak Sell / Fakeout
Low Volume + High Negative Delta → Bearish delta without commitment, low-liquidity breakdown risk.
D7 – Strong Sell
High Volume + High Negative Delta → Confirmed bearish initiative activity.
D8 – Capitulation
Extreme Volume + Extreme Negative Delta → Panic selling or capitulation regime.
These 8 D-States define the horizontal axis (columns) of the BDMA matrix.
4. The 5×8 BDMA Decision Matrix
The core of BDMA is a 5×8 matrix where:
- Rows (1–5) = Spatial S-States (S1…S5)
- Columns (1–8) = Kinetic D-States (D1…D8)
Each of the 40 possible combinations (SxDy) is pre-computed and mapped to:
- a Status or Regime Title (for example: Climax Breakout, Bear Trap Spring, Capitulation Breakdown),
- a Bias (Climactic Bull, Neutral, Strong Bear, Conflict or Reversal Risk, and similar labels),
- and a Strategic Signal or Consideration (for example: High reversal risk, Wait for confirmation, Low probability zone – avoid).
Internally, BDMA resolves all 40 regimes so the current state can be displayed on the dashboard without performance overhead.
5. Key Regime Families (How to Read the Matrix)
5.1. Breakouts and Breakdowns
Climax Breakout (Top-side)
Spatial S1 with Kinetic D1 or D2
Bias: Explosive or Extreme Bull
Signal:
- Strong or climactic upside extension with abnormal bullish orderflow.
- Trend continuation is possible, but reversal risk is extremely high after blow-off phases.
Low-Conviction Breakout (Fakeout Risk)
S1 with D3 (Weak Buy, low liquidity)
Bias: Weak Bull – Caution
Signal:
- Breakout not supported by volume.
- Elevated risk of failed auction or bull trap.
Capitulation Breakdown (Bottom-side)
Spatial S5 with Kinetic D8
Bias: Climactic Bear (panic)
Signal:
- Capitulation-type selling or forced liquidations.
- Trend can still proceed, but snap-back or violent short-covering risk is high.
Initiative Breakdown vs. Weak Breakdown
- Strong, high-volume breakdown typically corresponds to D7 (Strong Sell).
- Low-volume breakdown often corresponds to D6 (Weak Sell or Fakeout) with potential for failure.
5.2. Absorption, Traps and Springs
Absorption at Resistance (Top-side conflict)
S1 or S2 with D4 (Absorption or Conflict)
Bias: Conflict – Extreme Tension
Signal:
- Heavy two-way trade near resistance.
- Potential distribution or reversal if sellers begin to dominate.
Bull Trap or Failed Auction
Typically S1 with D6 (Weak Sell breakdown behavior after a top-side attempt)
Indicates a breakout attempt that fails and reverses, often after poor liquidity structure.
Absorption at Support and Bear Trap (Spring)
S4 or S5 with D4 or D3
Bias: Conflict or Weak Bear – Reversal Risk
Signal:
- Aggressive buying into lows (spring or shakeout behavior).
- Potential bear trap if price reclaims lost territory.
5.3. Trend Phases
Strong Uptrend Phases
Typically seen when S2–S3 combine with strong bullish kinetic behavior.
Bias: Strong or Extreme Bull
Signal:
- Pullbacks into S3 or S4 with supportive kinetic states often act as trend continuation zones.
Strong Downtrend Phases
Typically seen when S3–S4 combine with strong bearish kinetic behavior.
Bias: Strong or Extreme Bear
Signal:
- Rallies into resistance with strong bearish kinetic backing may act as continuation sell zones.
5.4. Neutral, Exhaustion and Squeeze
Exhaustion or Liquidity Void
S1 or S5 with D5 (Neutral kinetics)
Bias: Neutral or Exhaustion
Signal:
- Spatial extremes without kinetic confirmation.
- Often marks the end of a move, with poor follow-through.
Choppy, Low-Activity Range
S3 with D5
Bias: Neutral
Signal:
- Low volume, low conviction market.
- Typically a low-probability environment where standing aside can be logical.
Squeeze or High-Tension Zone
S3 with D4 or tightly clustered kinetic values
Bias: Conflict or High Tension
Signal:
- Hidden battle inside a volatility contraction.
- Often precedes large directionally-biased moves.
6. Dashboard Layout & Reading Guide
When Show Dashboard is enabled, BDMA displays:
1. Title and Status Line
Name of the current regime (for example: Climax Breakout, Bear Trap Spring, Mean Reversion).
2. Bias Line
Plain-language summary of directional context such as Climactic Bull, Strong Bear, Neutral, or Conflict and Reversal Risk.
3. Signal or Strategic Notes
Concise guidance focused on risk and context, not entries. For example:
- High reversal risk – aggressive traders only
- Wait for confirmation (break or rejection)
- Low probability zone – avoid taking new positions
4. Kinetic Profile (4-Factor Z-Score)
Shows the current Z-Scores for Total Volume (Activity), Buy Volume (Attack), Sell Volume (Defense), and Delta (Net Result).
5. Matrix Heatmap (5×8)
Visual representation of S-State vs. D-State with color coding:
- Bullish clusters in a green spectrum
- Bearish clusters in a red spectrum
- Conflict or exhaustion zones in yellow, amber, or neutral tones
The dashboard can be repositioned (top right, middle right, or bottom right) and its size can be adjusted (Tiny, Small, Normal, or Large) to fit different layouts.
7. Inputs & Customization
7.1. Core Parameters (Bollinger and Z-Score)
- Bollinger Length and Standard Deviation define the spatial engine.
- Z-Score Lookback (All Factors) defines how many bars are used to normalize volume and delta.
7.2. Deep Kinetic Thresholds
- Extreme Threshold defines what is considered climactic (D1 or D8).
- Significant Threshold distinguishes strong initiative vs. weak or fakeout behavior.
- Neutral Threshold is the band within which delta is treated as neutral.
These thresholds allow you to tune the sensitivity of the kinetic classification to fit different timeframes or instruments.
7.3. Calculation Method (Volume Delta)
Geometry (Approx)
- Fast, non-repainting approach based on candle geometry.
- Suitable for most users and real-time decision-making.
Intrabar (Precise)
- Uses lower-timeframe data for more precise volume delta estimation.
- Intrabar mode can repaint and requires compatible data and plan support on the platform.
- Best used for post-analysis or research, not blind automation.
7.4. Visuals and Interface
- Toggle Bollinger Bands visibility on or off.
- Switch between Dark and Light color themes.
- Configure dashboard visibility, matrix heatmap display, position, and size.
8. Multi-Language Semantic Engine (Asia and Middle East Focus)
BDMA v7.0 includes a fully integrated multi-language layer, targeting a wide geographic user base.
Supported Languages:
English, Türkçe, Русский, 简体中文, हिन्दी, العربية, فارسی, עברית
All dashboard labels, regime titles, bias descriptions, and signal texts are dynamically translated via an internal dictionary, while semantic meaning is kept consistent across languages.
This makes BDMA suitable for multi-language communities, study groups, and educational content across different regions.
However, due to the heavy computational load of the Deep Kinetic Engine and TradingView’s strict Pine Script execution limits, it was not possible to expand support to additional languages. Adding more translation layers would significantly increase memory usage and exceed runtime constraints. For this reason, the current language set represents the maximum optimized configuration achievable without compromising performance or stability.
9. Practical Usage Notes
BDMA is most powerful when used as a contextual overlay on top of market structure (HH, HL, LH, LL), higher-timeframe trend, key levels, and your own execution framework.
Recommended usage:
- Identify the current regime (Status and Bias).
- Check whether price location (S-State) and kinetic behavior (D-State) agree with your trade idea.
- Be especially cautious in climactic and absorption or conflict zones, where volatility and risk can be elevated.
Avoid treating BDMA as an automatic green equals buy, red equals sell tool.
The real edge comes from understanding where you are in the volatility or kinetic spectrum, not from forcing signals out of the matrix.
10. Limitations & Important Warnings
BDMA does not predict the future.
It organizes current and recent data into a structured context.
Volume data quality depends on the underlying symbol, exchange, and broker feed.
Forex, crypto, indices, and stocks may all behave differently.
Intrabar mode can repaint and is sensitive to lower-timeframe data availability and your plan type.
Use it with extra caution and primarily for research.
No indicator can remove the need for clear trading rules, disciplined risk management, and psychological control.
11. Disclaimer
This script is provided strictly for educational and analytical purposes.
It is not a trading system, signal service, financial product, or investment advice.
Nothing in this indicator or its description should be interpreted as a recommendation to buy or sell any asset.
Past behavior of any indicator or market pattern does not guarantee future results.
Trading and investing involve significant risk, including the risk of losing more than your initial capital in leveraged products.
You are solely responsible for your own decisions, risk management, and results.
By using this script, you acknowledge that you understand these risks and agree that the author or authors and publisher or publishers are not liable for any loss or damage arising from its use.

Every Hour 1st/Last FVG vTDL OVERVIEW - Shoutout to Micheal J. Huddleston aka ICT
This indicator identifies the first Fair Value Gap (FVG) that forms within each trading hour, providing traders with potential entry zones, reversal points, and unmitigated gap targets. Based on the concept that the first presented FVG of each hour represents a significant price delivery array where institutional order flow occurred.
The indicator detects FVGs on a lower timeframe (1-minute default) and displays them as boxes on your chart, tracking which gaps get filled and which remain open as potential draw-on-liquidity targets.
WHAT IS A FAIR VALUE GAP
A Fair Value Gap is a 3-candle price pattern representing an imbalance between buyers and sellers:
Bullish FVG: Forms when candle 3's low is above candle 1's high, leaving a gap
Bearish FVG: Forms when candle 3's high is below candle 1's low, leaving a gap
These gaps often act as magnets for price, which tends to return and "fill" the imbalance before continuing. They function as dynamic support and resistance zones.
KEY FEATURES
Detection Types
FVG: Standard fair value gap detection with volume imbalance expansion
Suspension FVG Blocks: Requires outside prints on both sides for more refined signals
Hourly Display Modes
First Only: Shows whichever FVG appears first each hour (bullish or bearish)
Show Both: Shows first bullish AND first bearish FVG independently each hour
Last FVG Tracking
Optionally display the last FVG of each hour
Useful for comparing how the hour developed
Can extend into the next hour for continued tracking
Breakaway Gap Detection
Gaps not traded into during their formation hour extend forward
Extended gaps display labels showing formation time and date
These unmitigated gaps become price targets and reversal zones
Gap Fill Modes
Touch Box: Marks filled when price enters the gap
Touch Midpoint: Marks filled when price reaches the 50 percent level
Fill Completely: Marks filled when price fills the entire gap with visual progress
HOW TO USE
Entry Points
The first FVG of each hour provides potential entry zones based on price reaction:
When price returns to an FVG and shows rejection, enter in the direction of rejection
The gap zone represents where institutional orders likely reside
Use the boundaries of the gap for stop loss placement
A clean rejection of the zone confirms it as valid support or resistance
Reversal Points
Unmitigated gaps that extend beyond their formation hour are high-probability reaction zones:
Extended boxes with labels indicate unfilled gaps
When price finally reaches these zones, expect a reaction
The longer a gap remains unfilled, the stronger the expected response
These zones act as magnets drawing price back to them
Price Targets
Use unmitigated gaps as draw-on-liquidity targets:
Look for extended boxes above or below current price
Price tends to seek out and fill imbalances
The midpoint line often serves as a minimum target
Multiple unfilled gaps in one direction suggest strong momentum potential
FRAMING DIRECTIONAL BIAS
The first presented FVG of each hour acts as a support or resistance zone. The direction of the FVG itself does not determine bias - it is how price reacts to that FVG that reveals the true market intention.
Reading Price Reaction
Price respects a bullish FVG as support and bounces higher = bullish bias confirmed
Price respects a bearish FVG as resistance and rejects lower = bearish bias confirmed
Price fails to hold a bullish FVG and breaks through = potential inversion, look for shorts
Price fails to hold a bearish FVG and breaks through = potential inversion, look for longs
Inversion Fair Value Gaps (IFVG)
When price trades through an FVG and closes beyond it, that gap can invert its role:
A bullish FVG that fails becomes resistance - use it as a short entry zone
A bearish FVG that fails becomes support - use it as a long entry zone
The inversion signals a shift in control from one side to the other
Watch for price to retest the inverted gap before continuing
Support and Resistance Framework
Think of each hourly first FVG as a key level:
Price above the FVG: the gap acts as potential support
Price below the FVG: the gap acts as potential resistance
Watch how price behaves when it returns to the gap zone
A clean rejection confirms the level; a break through signals inversion
SHORT-TERM SCALPING APPLICATION
These FVGs provide scalping opportunities each hour:
Identify the first FVG of the hour as your key level
Wait for price to trade away from it and return
Observe the reaction at the gap zone
Enter in the direction of the reaction with tight risk
Target the next FVG, midpoint, or nearby liquidity
Trade Management
Use the opposite side of the FVG box as your stop loss zone
The midpoint of the gap often provides first target or decision point
Scale out at nearby unmitigated gaps or key levels
If the gap inverts, flip your bias and look for entries in the new direction
MULTI-HOUR CONTEXT
If price consistently respects FVGs as support across hours = uptrend context
If price consistently respects FVGs as resistance across hours = downtrend context
If FVGs keep inverting = choppy or transitional market
Use higher timeframe direction to filter which reactions to trade
Compare first and last FVG of each hour to see how momentum developed
SESSION FILTERING
The indicator automatically excludes unreliable periods:
4 PM to 5 PM New York time (market close hours 16-17)
Weekend closed periods (Saturday and Sunday before 6 PM)
All timestamps use New York timezone for consistency with futures market hours.
SETTINGS GUIDE
Detection Settings
Detection Type: Choose between standard FVG or Suspension FVG Blocks
Lower Timeframe: 15 seconds, 1 minute, or 5 minutes for gap detection
Min FVG Size: Minimum gap size in ticks to filter noise
Display Settings
Hourly Display Mode: First Only shows one gap per hour; Show Both shows first bull and bear
Show First FVG: Toggle visibility of first FVG boxes
Show Last FVG: Toggle visibility of last FVG boxes
Show Midpoint Lines: Display the 50 percent level of each gap
Show Unfilled Breakaway Gaps: Extend boxes until price fills them
Show Only Today: Reduce clutter by hiding older hourly boxes
Gap Fill Detection Mode
Touch Box: Gap marked filled when price enters the zone
Touch Midpoint: Gap marked filled when price reaches 50 percent level
Fill Completely: Gap marked filled only when fully closed, shows visual fill progress
Recommended Settings by Style
Scalping: 1 minute LTF, 4 tick minimum, Show Both mode, Touch Box fill
Day Trading: 1 minute LTF, 4-8 tick minimum, First Only mode, Touch Midpoint fill
Swing Context: 5 minute LTF, Show Unfilled Gaps enabled, Fill Completely mode
COLOR CODING
Blue boxes: First bullish FVG of the hour
Red boxes: First bearish FVG of the hour
Green boxes: Last bullish FVG of the hour
Orange boxes: Last bearish FVG of the hour
Black midpoint lines: 50 percent level of each gap
Filled portion overlay: Shows visual progress in Fill Completely mode
All colors are fully customizable in the settings menu.
PRACTICAL TIPS
The first FVG of each hour is a hidden PD array - treat it as a significant level
Not every gap produces a tradeable reaction - wait for confirmation
Gaps that remain unfilled for multiple hours carry more weight
Use the Show Both mode to see both bullish and bearish opportunities each hour
When multiple gaps cluster in one zone, that area becomes even more significant
Inversions are powerful signals - a failed level often leads to acceleration
NOTES
Works on any instrument and timeframe
Best used on intraday charts (1 minute to 15 minute) viewing 1 minute LTF gaps
Combine with higher timeframe analysis for confluence
These are probability zones, not guarantees - always use proper risk management
The indicator handles HTF to LTF data fetching automatically

MACD Divergence Optimizer# MACD Divergence Optimizer - User Guide
## Overview
The **MACD Divergence Optimizer** is a professional-grade technical analysis indicator for TradingView that automatically detects hidden divergences on MACD with volume weighting. It identifies potential reversal points before price action confirms the move, giving traders an early edge.
---
## What is Divergence?
A **divergence** occurs when price and an oscillator (like MACD) move in opposite directions:
- **Bullish Divergence**: Price makes a lower low, but MACD makes a higher low → Potential uptrend reversal
- **Bearish Divergence**: Price makes a higher high, but MACD makes a lower high → Potential downtrend reversal
Divergences are among the most reliable reversal signals in technical analysis.
---
## Indicator Features
### Volume-Weighted MACD
- Standard MACD is calculated on closing price
- This indicator uses **volume-weighted closing prices** for greater accuracy
- Formula: MACD = (Volume-Weighted EMA₁₂ - Volume-Weighted EMA₂₆)
- Volume weighting gives more importance to high-conviction price moves
### Automatic Swing Detection
- Detects local highs and lows (5-bar lookback)
- Tracks the last 5 swings for divergence analysis
- Only meaningful swings are tracked (filtered for noise)
### Smart Signal Generation
- Green triangle (▲) = Bullish Divergence (BUY signal)
- Red triangle (▼) = Bearish Divergence (SELL signal)
- Triangles appear directly on the MACD line for precise entry timing
### Built-in Alerts
- Real-time notifications for divergence signals
- Alerts can trigger mobile push notifications or sound
- Never miss a trading opportunity
---
## How to Use
### Installation
1. Open TradingView and navigate to the Chart
2. Click "Indicator" → Search "MACD Divergence Optimizer"
3. Click "Add to Chart"
4. The indicator appears in a separate panel below the price chart
### Reading the Indicator
**MACD Panel displays:**
- **Blue Line** = MACD (fast momentum)
- **Orange Line** = Signal line (slow momentum)
- **Histogram** (colored bars) = Difference between MACD and Signal
- Green bars = MACD above signal (bullish)
- Red bars = MACD below signal (bearish)
**Divergence Signals:**
- **Green Triangle ▲** = Bullish divergence detected
- Price is lower, but MACD momentum is strengthening
- Look for uptrend reversal
- Confirm with higher closes or volume
- **Red Triangle ▼** = Bearish divergence detected
- Price is higher, but MACD momentum is weakening
- Look for downtrend reversal
- Confirm with lower closes or selling volume
---
## Parameters & Settings
### MACD Fast Length (Default: 12)
- Controls the faster moving average period
- **Lower values** → More responsive, more false signals
- **Higher values** → Smoother, fewer signals
- **Typical range**: 8-15
### MACD Slow Length (Default: 26)
- Controls the slower moving average period
- **Lower values** → Faster divergence detection
- **Higher values** → More reliable, fewer signals
- **Typical range**: 20-35
### Signal Smoothing (Default: 9)
- EMA period applied to MACD itself
- **Lower values** → Faster crossover signals
- **Higher values** → Fewer false crossovers
- **Typical range**: 5-15
### Min Divergence Strength (Default: 0.5%)
- Minimum % difference between current MACD and swing MACD
- **Lower values** → More divergence signals (noisier)
- **Higher values** → Only strong divergences (fewer signals)
- **Recommended**: 0.3% - 1.0%
### Lookback Bars (Default: 75)
- Historical window for analysis
- Larger lookback = more context but slower calculation
- **Typical range**: 50-100
---
## Trading Strategy
### Bullish Divergence (Entry Setup)
1. **Identify Signal**: Green triangle appears on MACD
2. **Confirm Price**: Look for price rejection of the low (bounce)
3. **Volume Check**: Buy on increase in volume at the bounce
4. **Entry**: Above the swing low level
5. **Stop Loss**: Below the most recent swing low
6. **Target**: Next swing high or resistance level
### Bearish Divergence (Entry Setup)
1. **Identify Signal**: Red triangle appears on MACD
2. **Confirm Price**: Look for price rejection of the high
3. **Volume Check**: Sell on increase in volume at rejection
4. **Entry**: Below the swing high level
5. **Stop Loss**: Above the most recent swing high
6. **Target**: Next swing low or support level
### Risk Management
- **Position Size**: Risk only 1-2% per trade
- **Stop Loss**: Place beyond recent swings
- **Take Profit**: Scale out at 1:1, 1:2, 1:3 risk-reward ratios
- **Filter**: Use on higher timeframes (4H, Daily) for reliability
---
## Timeframe Recommendations
| Timeframe | Best For | Signal Quality |
|-----------|----------|---|
| **1H** | Scalping, day trading | Moderate (some noise) |
| **4H** | Swing trading | Excellent |
| **Daily** | Position trading | Excellent |
| **Weekly** | Long-term trends | Excellent |
---
## Tips & Best Practices
### ✅ DO:
- **Use on trends**: Divergences work best when there's a clear trend
- **Combine signals**: Look for confirmation from price action, volume, or moving averages
- **Trade the bounce**: Wait for price to react to the swing, then enter
- **Adjust parameters**: Test different MACD lengths for your trading style
- **Use alerts**: Set up mobile alerts so you don't miss signals
### ❌ DON'T:
- **Trade every signal**: Some signals are stronger than others
- **Trade flat/choppy markets**: Divergences fail in ranging markets
- **Ignore support/resistance**: Trade divergences near key levels for best results
- **Over-leverage**: Divergences are probabilistic, not guaranteed
- **Disable volume analysis**: Always check volume when divergence fires
---
## Advanced Features
### Volume Weighting
The indicator uses **volume-weighted MACD** instead of standard MACD. This means:
- High-volume reversals get more emphasis
- Low-volume moves are smoothed out
- More accurate momentum readings
- Better at identifying true trend changes
### Array Tracking
The indicator tracks the last 5 swings in arrays:
- `swingLows ` = last 5 price lows
- `swingHighs ` = last 5 price highs
- `swingMacds ` = corresponding MACD values
This allows detection of **hidden divergences** not visible in traditional analysis.
---
## Common Questions
**Q: Why didn't the indicator trigger a signal when I see a divergence?**
A: The indicator may require:
- MACD histogram to cross the zero line (confirms momentum shift)
- Minimum strength threshold to be met (adjust Min Divergence Strength)
- At least 5 swings to be recorded in the lookback window
**Q: Can I use this on all timeframes?**
A: Yes, but divergences are more reliable on higher timeframes (4H+). Lower timeframes produce more signals but with more noise.
**Q: Should I trade every green/red triangle?**
A: No. Use them as a heads-up for potential reversals. Always confirm with:
- Price action (rejection of the swing)
- Volume (increasing volume at reversal)
- Key support/resistance levels
**Q: How do I set alerts?**
A:
1. Right-click the indicator → Edit Alerts
2. Check "Bullish Divergence" and/or "Bearish Divergence"
3. Choose notification type (browser, mobile, email)
4. Set frequency to "Once per bar close"
**Q: What's the difference between regular and hidden divergence?**
A: This indicator detects **hidden divergences** (also called continuation divergences):
- **Regular**: Price makes new extreme, but oscillator doesn't
- **Hidden**: Price makes new extreme, oscillator makes new extreme in different direction
- Hidden divergences are often more reliable for continuation plays
---
## Disclaimer
This indicator is provided for educational and informational purposes only. It is not financial advice. Past performance does not guarantee future results. Always use proper risk management and combine with other analysis methods. Trading and investing carry risk of loss. Do your own research before making trading decisions.
---
## Support & Updates
For issues, feature requests, or questions:
- Check the indicator settings and parameter values
- Test on historical data first before live trading
- Adjust parameters to match your trading style and timeframe
---
**Version**: 1.0
**Last Updated**: November 2025
**Compatible**: TradingView v6+

GTI BGTI: RSI Suite (Standard • Stochastic • Smoothed)
A three-layer momentum and trend toolkit that combines Standard RSI, Stochastic RSI, and a Smoothed/“Macro” RSI to help you read intraday swings, trend transitions, and high-probability reversal/continuation spots.
All in one pane with intuitive coloring and optional divergence markers and alerts.
Why this works
* Stochastic RSI (K/D) visualizes fast momentum swings and timing.
* Standard RSI moves more gradually, helping confirm trend transitions that may span several Stochastic cycles.
* Smoothed RSI (Average → Macro) adds a second-pass filter and slope persistence to reveal the macro direction while suppressing noise.
Used together, Stochastic guides entries/exits around local highs/lows, while the RSI layers improve confidence when a small swing is likely part of a larger turn.
What you’ll see
* Standard RSI (yellow; pink above Bull line, aqua below Bear line).
* Stochastic RSI (K/D) with contextual colors:
* Greens when RSI is weak/oversold (bearish conditions → watch for bullish reversals/continuations).
* Reds when RSI is strong/overbought (bullish conditions → watch for bearish reversals/continuations).
* Smoothed (Macro) RSI with trend color:
* Red when macro is ascending (bullish),
* Aqua when macro is descending (bearish).
* Divergences (optional markers):
* Bearish: RSI Lower High + Price Higher High (red ⬇).
* Bullish: RSI Higher Low + Price Lower Low (green ⬆).
* No repaint: pivots confirm after the chosen right-bars window.
How to use it
* Bullish Reversal
* Macro RSI is reversing at a higher low after price has been in a overall downtrend
* Stochastic RSI is switching from green to red in an overall downtrend
* Bullish Oversold
* Macro RSI is reversing from a significantly low level after price has a short but strong dip during an overall uptrend
* Stochastic RSI is switching from green to red in an overall uptrend
* Bullish Continuation
* Macro RSI is ascending with a strong slope or forming a higher low above the 50 line
* Stochastic RSI is reaching a bottom but still painted red
* Bearish Reversal
* Macro RSI is reversing at a lower high after price has been in a overall uptrend
* Stochastic RSI is switching from red to green in an overall uptrend
* Bearish Overbought
* Macro RSI is reversing from a significantly high level after price has a short but strong jump during an overall downtrend
* Stochastic RSI is switching from red to green in an overall downtrend
* Bearish Continuation
* Macro RSI is descending with a strong slope or forming a lower high below the 50 line
* Stochastic RSI is reaching a top but still painted green
* Divergences: Use as signals of exhaustion—best when aligned with Macro RSI color/slope and key levels (e.g., Bull/Bear lines, 50 midline).
*** IMPORTANT ***
* Stack confluence, don’t single-signal trade. Look for:
* 1) Macro RSI color & slope (red = ascending/bullish, aqua = descending/bearish)
* 2) Standard RSI location (above/below Bull/Bear lines or 50)
* 3) Stoch flip + direction
* 4) Price structure (HH/HL vs LH/LL)
* 5) Divergence type (regular vs hidden) at meaningful levels
* Trade with the macro
* Prioritize longs when Macro RSI is red or just flipped up
* Prioritize shorts when Macro RSI is aqua or just flipped down
* Counter-trend setups = smaller size and faster management.
* Location > signal
* The same crossover/divergence is higher quality near Bull (~60)/Bear(~40) or extremes than in the mid-range chop around 50.
* Early vs confirmed
* Use the early pivot heads-up for anticipation, but scale in only after the confirmed pivot (right-bars complete). If early signal fails to confirm, stand down.
* Define invalidation upfront
* For divergence entries, place stops beyond the pivot extreme (LL/HH). If Macro RSI flips against your trade or RSI breaks back through 50 with slope, exit or tighten.
* Multi-timeframe alignment
* Best results come when entry timeframe (e.g., 1H) aligns with higher-TF macro (e.g., 4H/D). If they disagree, treat it as mean-reversion only.
* Avoid common traps
* Skip: isolated Stochastic flips without RSI support, divergences without price HH/LL confirmation, and serial divergences when Macro RSI slope is strong against the idea.
* Parameter guidance
* Start with defaults; then tune: confirmBars 3–7, minSlope 0.05–0.15 RSI pts/bar, pivot left/right tighter for faster but noisier signals, wider for cleaner but fewer.
* Alerts = workflow, not auto-trades
* Use Macro Flip + Divergence alerts as a checklist trigger; enter only when your confluence rules are met and risk is defined.
Key inputs (tweak to your market/timeframe)
* RSI / Stochastic lengths and K/D smoothing.
* Bull / Bear Lines (default 61.1 / 43.6).
* Average RSI Method/Length (SMA/EMA/RMA/WMA) + Macro Smooth Length.
* Trend confirmation: bars of persistence and minimum slope to reduce flip noise.
* Pivot look-back (left/right) for divergence confirmation strictness.
Alerts included
* Macro Flip Up / Down (Smoothed RSI regime change).
* RSI Bullish/Bearish Divergence (confirmed at pivot).
* Stochastic RSI continuation/divergence (optional).
Tips
* Level + Slope matter. High/low RSI level flags conditions; slope confirms impulse/continuation.
* Let Stochastic time the swing; let Macro RSI filter the trend.
* Tighten or loosen pivot windows to trade fewer/cleaner vs. more/faster signals.

Regular-Delta RSI Gap Indicator# Regular-Delta RSI Gap Indicator
## Overview
The **Regular-Delta RSI Gap Indicator** is a sophisticated momentum oscillator that compares traditional RSI with volume-based Delta RSI to identify trend strength and potential reversal points. This unique indicator combines price action with volume dynamics to provide enhanced market insights.
## Key Features
### 🔄 Dual RSI Analysis
- **Regular RSI**: Standard RSI based on price changes
- **Delta RSI**: Volume-weighted RSI calculated from volume change rates
- **Visual Comparison**: Clear plotting of both RSIs with ribbon fill
### 💪 Strength Measurement
- **ADX-style Strength Calculation**: Measures the divergence strength between Regular and Delta RSI
- **Configurable Threshold**: Customizable strength level for trend validation
- **Trend Classification**: Identifies strong vs. weak market conditions
### 📊 Multiple Display Options
- **Histogram Visualization**: Columns showing the gap between Regular and Delta RSI
- **Cross Signals**: Triangle markers for crossover events
- **Ribbon Fill**: Color-coded area between the two RSI lines
- **Real-time Table**: Summary table showing current values and trends
## Input Parameters
### Core Settings
- **RSI Period** (default: 14): Calculation period for both RSIs
- **Strength Smoothing** (default: 14): Smoothing period for strength calculation
- **Strength Threshold** (default: 5): Minimum level for strong trend classification
### Visual Customization
- **Show Histogram**: Toggle histogram display
- **Show Signals**: Display crossover signals
- **Show Labels**: Enable trend labels and information table
- **Histogram Height Scale**: Adjust histogram visibility (0.1-3.0)
- **Apply Ribbon Fill**: Enable/disable ribbon coloring
### Color Scheme
- Fully customizable colors for bullish, bearish, neutral, and strength elements
## Interpretation
### Trend Signals
- **Strong Uptrend**: Regular RSI > Delta RSI + Strength above threshold
- **Strong Downtrend**: Regular RSI < Delta RSI + Strength above threshold
- **Weak Trend**: Strength below threshold
### Key Levels
- **Overbought**: 70 level (red line)
- **Oversold**: 30 level (blue line)
- **Midline**: 50 level (gray dotted line)
- **Zero Line**: Histogram baseline
- **Threshold**: Strength reference line
### Signal Types
1. **Crossover Signals**: Regular RSI crossing above/below Delta RSI
2. **Strength Transitions**: Strength line crossing threshold
3. **Histogram Patterns**: Column color and height changes
## Alerts
The indicator provides four alert conditions:
- Divergence Strength Rising
- Divergence Strength Falling
- RSI Crossover (Regular above Delta)
- RSI Crossunder (Regular below Delta)
## Use Cases
- **Trend Confirmation**: Validate price trends with volume confirmation
- **Reversal Detection**: Spot potential trend changes early
- **Momentum Analysis**: Gauge market momentum strength
- **Divergence Trading**: Identify regular/volume RSI divergences
## Optimization Tips
- Adjust period lengths based on trading timeframe
- Modify threshold based on market volatility
- Combine with price action for confirmation
- Use in conjunction with support/resistance levels
This indicator is particularly useful for traders looking to incorporate volume confirmation into their RSI analysis and identify high-probability trend continuations or reversals.

Stop Hunt Candlesticks (Liquidity Wicks)🕯️ Stop Hunt Candlesticks
Wick Highlighter – Spot Extreme Wicks Instantly
This indicator highlights candles where the upper or lower wick exceeds a customizable percentage of the asset’s price — perfect for quickly spotting strong rejections, liquidity grabs, stop hunts or exhaustion moves.
💡 Key Features
Visual Background Highlight: Automatically colors the chart background when a wick surpasses your defined % threshold (default 1%).
Customizable Threshold: Adjust wick sensitivity to suit different assets or timeframes.
Upper & Lower Wick Filters: Choose whether to track upper wicks, lower wicks, or both.
Dynamic Price Basis: Compare wick size relative to Close, Open, HL2, or OC2.
Optional Labels: Display the exact wick percentage directly on the chart.
Alerts Ready: Get notified whenever a candle shows an extreme wick condition.
⚙️ How It Works
The script measures each candle’s wick size relative to your chosen price basis:
Upper wick % = (High − max(Open, Close)) / Basis × 100
Lower wick % = (min(Open, Close) − Low) / Basis × 100
If the result exceeds your chosen threshold, the chart background changes color.
Red for upper wicks, green for lower wicks by default.
🎯 Use Cases
Identify strong rejections or stop hunts near key levels.
Confirm price exhaustion or potential reversals.
Filter fake breakouts or high-volatility events.
🧩 Customization
Tweak colors, transparency, and label visibility to fit seamlessly into your chart setup.

Multi EMA and Key Levels IndicatorKey Features:
Daily and Previous Day Levels
Plots today’s high and low.
Plots the previous day’s high (Y HOD) and low (Y LOD), with labels anchored to the price axis.
Premarket (Globex) High and Low
Tracks premarket session highs and lows (defined as 5:00 PM to 8:30 AM Chicago time).
Updates dynamically during the session and plots “GLOBEX HIGH” and “GLOBEX LOW” lines with labels.
Exponential & Simple Moving Averages
User can select 3 EMAs (default 8, 21, 200).
Plots EMAs with distinct colors.
Plots the 200-day SMA for longer-term trend context.

Androlog DailyWeeklyMonthlyAndrologLevel — Daily / Weekly / Monthly Levels
This indicator visualizes the Daily, Weekly, and Monthly key levels introduced by Daniel. It’s intentionally minimal and fast, focused on clean higher‑timeframe references for intraday and daily trading.
What it shows:
Daily open and prior‑day high/low
Weekly and Monthly “open”-based levels
Optional labels for quick price readouts
Controls
Show only new levels or keep/extend old ones
Choose whether levels extend to the right
Alerts
Optional alert conditions for level touches (per your settings)
Uses confirmed higher‑timeframe bars; no historical repaint