MACD-V with Volatility Normalisation [DCD]MACD-V with Volatility Normalisation
This indicator is a modified version of the traditional MACD, designed to account for market volatility by normalizing the MACD line using the Average True Range (ATR). It provides a more adaptive approach to identifying momentum shifts and potential trend reversals. This indicator was developed by Alex Spiroglou in this paper:
Spiroglou, Alex, MACD-V: Volatility Normalised Momentum (May 3, 2022).
Features:
Volatility Normalization: The MACD line is adjusted using ATR to standardize its values across different market conditions.
Customizable Parameters: Users can adjust the MACD fast length, slow length, signal line smoothing, and ATR length to suit their trading style.
Histogram Visualization: The histogram highlights the difference between the MACD and signal lines, with customizable colors for positive and negative momentum.
Crossover Signals: Green and red dots indicate bullish and bearish crossovers between the MACD and signal lines.
Background Highlighting: The chart background changes to green when the MACD is above 0 and red when it is below 0, providing a clear visual cue for bullish and bearish conditions.
Horizontal Levels: Dotted horizontal lines are plotted at key levels for better visualization of MACD values.
How to Use:
Look for crossovers between the MACD and signal lines to identify potential buy or sell signals.
Use the histogram to gauge the strength of momentum.
Pay attention to the background color for quick identification of bullish (green) or bearish (red) conditions.
This indicator is ideal for traders who want a more dynamic MACD that adapts to market volatility. Customize the settings to align with your trading strategy and timeframe.
스크립트에서 "key levels"에 대해 찾기

VWAP 2.0 with desv + Initial Balance by RiotWolftrading🌟 Overview
This powerful tool is designed for traders who want to harness the power of the Volume Weighted Average Price (VWAP) alongside session-based ranges to make informed trading decisions. Whether you're a day trader or a swing trader, this indicator provides a clean and effective way to identify support, resistance, and market trends—all in one place! 💡
✨ Key Features
Auto-Anchored VWAP 📊
Automatically calculates the VWAP based on a user-defined anchor period (e.g., Daily, Weekly, Monthly).
Resets at the start of each period (e.g., daily for a Daily anchor).
Displays a customizable VWAP line with standard deviation bands to highlight key price levels.
Standard Deviation Bands 📏
Plots up to three sets of standard deviation bands above and below the VWAP (multipliers: 1.0, 2.0, 3.0).
Includes volume percentage labels to show where trading volume is concentrated. 📉
Session High/Low Range 🕒
Identifies the high and low prices within a customizable session (default: 12:00 to 15:31).
Draws horizontal lines at the session high and low, with dotted deviation lines for additional reference points.
Perfect for spotting key levels during your trading session! 🔑
Time-Based Range Box ⏰
Highlights a specific time window (default: 15:40 to 15:50) with a colored box showing the high and low prices.
Ideal for tracking price action during high-impact events like news releases or market opens. 📅
Alerts 🚨
Set up alerts for when the price crosses above or below the VWAP—never miss a potential trading opportunity!
⚙️ Settings
Customize the indicator to fit your trading style with these easy-to-use settings:
VWAP Settings
Timezone 🌍: Select your timezone (default: GMT+2) to align calculations with your local time.
VWAP Source 📈: Choose the price source for VWAP (default: hlc3 - average of high, low, close).
Std Deviation Multipliers 📐: Adjust the multipliers for the bands (default: 1.0, 2.0, 3.0).
Line Width ✏️: Set the thickness of the VWAP and band lines (default: 1).
Session Time ⏳: Define the session window for VWAP calculations (default: 08:00-18:00, all days).
Show Upper/Lower Bands 👀: Toggle visibility for each set of bands (default: Band 1 visible, Bands 2 & 3 hidden).
Range Settings
Range Start/End Time 🕙: Set the time window for the range box (default: 15:40 to 15:50).
Box Color 🎨: Customize the border color (default: blue).
Box Background Color 🖌️: Adjust the background color (default: light aqua, 90% transparency).
I created this indicator to provide a streamlined, clutter-free tool for traders who rely on VWAP and session-based analysis. It focuses on the essentials—VWAP, standard deviation bands, session high/low, and range box—without unnecessary overlays. I hope it helps you in your trading journey! If you have feedback or suggestions, feel free to share—I’d love to hear from you! 😊

ScalpSwing Pro SetupScript Overview
This script is a multi-tool setup designed for both scalping (1m–5m) and swing trading (1H–4H–Daily). It combines the power of trend-following , momentum , and mean-reversion tools:
What’s Included in the Script
1. EMA Indicators (20, 50, 200)
- EMA 20 (blue) : Short-term trend
- EMA 50 (orange) : Medium-term trend
- EMA 200 (red) : Long-term trend
- Use:
- EMA 20 crossing above 50 → bullish trend
- EMA 20 crossing below 50 → bearish trend
- Price above 200 EMA = uptrend bias
2. VWAP (Volume Weighted Average Price)
- Shows the average price weighted by volume
- Best used in intraday (1m to 15m timeframes)
- Use:
- Price bouncing from VWAP = reversion trade
- Price far from VWAP = likely pullback incoming
3. RSI (14) + Key Levels
- Shows momentum and overbought/oversold zones
- Levels:
- 70 = Overbought (potential sell)
- 30 = Oversold (potential buy)
- 50 = Trend confirmation
- Use:
- RSI 30–50 in uptrend = dip buying zone
- RSI 70–50 in downtrend = pullback selling zone
4. MACD Crossovers
- Standard MACD with histogram & cross alerts
- Shows trend momentum shifts
- Green triangle = Bullish MACD crossover
- Red triangle = Bearish MACD crossover
- Use:
- Confirm swing trades with MACD crossover
- Combine with RSI divergence
5. Buy & Sell Signal Logic
BUY SIGNAL triggers when:
- EMA 20 crosses above EMA 50
- RSI is between 50 and 70 (momentum bullish, not overbought)
SELL SIGNAL triggers when:
- EMA 20 crosses below EMA 50
- RSI is between 30 and 50 (bearish momentum, not oversold)
These signals appear as:
- BUY : Green label below the candle
- SELL : Red label above the candle
How to Trade with It
For Scalping (1m–5m) :
- Focus on EMA crosses near VWAP
- Confirm with RSI between 50–70 (buy) or 50–30 (sell)
- Use MACD triangle as added confluence
For Swing (1H–4H–Daily) :
- Look for EMA 20–50 cross + price above EMA 200
- Confirm trend with MACD and RSI
- Trade breakout or pullback depending on structure

TMO (True Momentum Oscillator)TMO ((T)rue (M)omentum (O)scilator)
Created by Mobius V01.05.2018 TOS Convert to TV using Claude 3.7 and ChatGPT 03 Mini :
TMO calculates momentum using the delta of price. Giving a much better picture of trend, tend reversals and divergence than momentum oscillators using price.
True Momentum Oscillator (TMO)
The True Momentum Oscillator (TMO) is a momentum-based technical indicator designed to identify trend direction, trend strength, and potential reversal points in the market. It's particularly useful for spotting overbought and oversold conditions, aiding traders in timing their entries and exits.
How it Works:
The TMO calculates market momentum by analyzing recent price action:
Momentum Calculation:
For a user-defined length (e.g., 14 bars), TMO compares the current closing price to past open prices. It assigns:
+1 if the current close is greater than the open price of the past bar (indicating bullish momentum).
-1 if it's less (indicating bearish momentum).
0 if there's no change.
The sum of these scores gives a raw momentum measure.
EMA Smoothing:
To reduce noise and false signals, this raw momentum is smoothed using Exponential Moving Averages (EMAs):
First, the raw data is smoothed by an EMA over a short calculation period (default: 5).
Then, it undergoes additional smoothing through another EMA (default: 3 bars), creating the primary "Main" line of the indicator.
Lastly, a "Signal" line is derived by applying another EMA (also default: 3 bars) to the main line, adding further refinement.
Trend Identification:
The indicator plots two lines:
Main Line: Indicates current momentum strength and direction.
Signal Line: Acts as a reference line, similar to a moving average crossover system.
When the Main line crosses above the Signal line, it suggests strengthening bullish momentum. Conversely, when the Main line crosses below the Signal line, it indicates increasing bearish momentum.
Overbought/Oversold Levels:
The indicator identifies key levels based on the chosen length parameter:
Overbought zone (positive threshold): Suggests the market might be overheated, and a potential bearish reversal or pullback could occur.
Oversold zone (negative threshold): Suggests the market might be excessively bearish, signaling a potential bullish reversal.
Clouds visually mark these overbought/oversold areas, making it easy to see potential reversal zones.
Trading Applications:
Trend-following: Traders can enter positions based on crossovers of the Main and Signal lines.
Reversals: The overbought and oversold areas highlight high-probability reversal points.
Momentum confirmation: Use TMO to confirm price action or other technical signals, improving trade accuracy and timing.
The True Momentum Oscillator provides clarity in identifying momentum shifts, making it a valuable addition to various trading strategies.

ORB Sessions w/ MidlineORB Sessions with Midline – Customizable Opening Range Breakout Indicator
📌 Overview:
This indicator allows traders to visualize Opening Range Breakout (ORB) sessions with customizable high, low, and midline levels. It supports both predefined ORB sessions and user-defined custom sessions. The ORB levels update in real-time and are automatically hidden on higher timeframes.
🔹 Features:
✅ Predefined ORB Sessions – Toggle commonly used ORB periods to match your strategy.
✅ Custom ORB Sessions – Define up to three additional ORB sessions with custom start and end times.
✅ Live ORB Updates – ORB high, low, and midline update dynamically as bars close within the session.
✅ Customizable Colors & Labels – Set unique colors for high, midline, and low levels, and enable/disable price labels.
✅ Smart Timeframe Filtering – ORB lines automatically hide on higher timeframes when they exceed the ORB duration.
✅ Futures Market Adjustments – Automatically shifts ORB session times for NQ, ES, YM, RTY, and M2K to align with market hours.
🛠️ How to Use:
1️⃣ Enable ORB Sessions – Select which predefined sessions you want to track.
2️⃣ Customize Your Own ORBs – Define up to three custom ORB sessions with specific start and end times.
3️⃣ Adjust Visualization – Modify ORB colors and labels for better chart clarity.
4️⃣ Trade ORB Breakouts – Use these key levels to identify potential breakouts, reversals, and trend continuation setups.

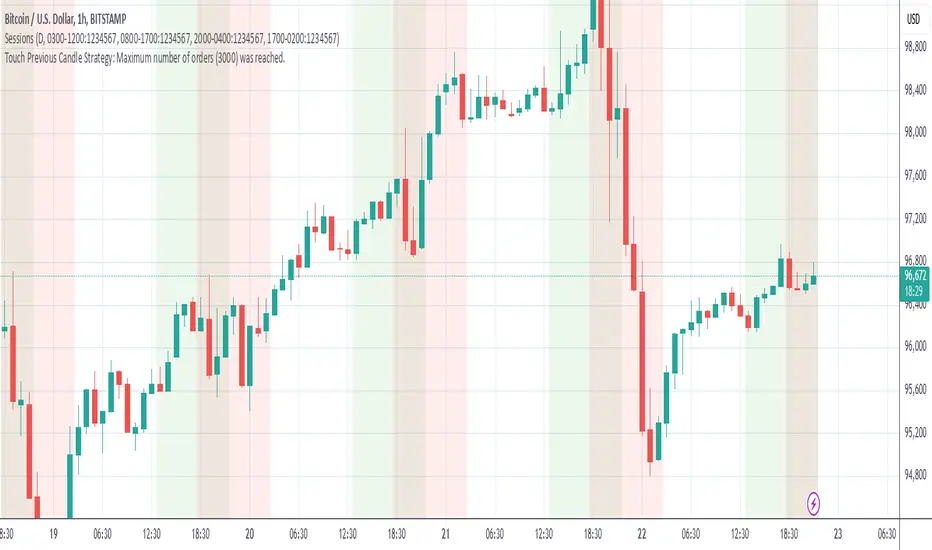
Grim SlashOverview:
The Touch Previous Candle Strategy is a simple yet effective trading approach designed for the 1-hour chart. It focuses on price action by placing trades when the current candle interacts with key levels from the previous candle. The strategy is fully automated and includes risk management with take profit and stop loss levels.
Entry Conditions:
Buy Signal: A buy order is triggered when the low of the current candle touches or drops below the previous candle's closing price.
Sell Signal: A position is closed when the high of the current candle reaches or exceeds the previous candle's highest price.
Risk Management:
Take Profit: The trade is exited automatically when the price increases by 15% from the entry point.
Stop Loss: A stop loss is set at 5% below the entry price to minimize risk.
Best Use Cases:
Works well in volatile markets where price frequently tests previous levels.
Suitable for traders who prefer price-action-based strategies over indicators.
Can be optimized for different assets or timeframes based on market behavior.
Trendilo ARTrendilo AR is a custom trading indicator designed to identify market trends using advanced techniques such as the Arnaud Legoux Moving Average (ALMA), volume confirmations, and dynamic volatility bands. This indicator provides a clear visualization of trends, including significant changes and custom alerts.
Review of Indicators Used
1. ALMA
Description:
ALMA is a moving average that applies an advanced filter to smooth price data, reducing noise and focusing on actual trends.
Usage in the Indicator:
Used to calculate the smoothed percentage price change and determine trend direction. Customizable parameters include:
- Length: Defines the number of bars to consider.
- Offset: Adjusts sensitivity toward recent prices.
- Sigma: Controls the degree of smoothing.
Advantages:
- Reduced lag in trend detection.
- Resistance to market noise.
2. ATR
Description:
ATR measures the market’s average volatility by considering the range between high and low prices over a given period.
Usage in the Indicator:
ATR is used to calculate "dynamic smoothing", adjusting the indicator’s sensitivity based on current market volatility.
Advantages:
- Adapts to high or low volatility conditions.
- Helps define dynamic support and resistance levels.
3. SMA
Description:
SMA calculates the average of prices or volume over a specific time period.
Usage in the Indicator:
Used to calculate the volume moving average (Volume SMA) to confirm whether the current volume supports the detected trend.
Advantages:
- Easy to understand and calculate.
- Provides volume-based trend confirmation.
4. RMS Bands
Description:
RMS Bands calculate the standard deviation of percentage price changes, creating upper and lower levels that act as overbought and oversold indicators.
Usage in the Indicator:
- Define the range within which the market is considered neutral.
- Crosses above or below the bands indicate trend changes.
Advantages:
- Visual identification of strong trends.
- Helps filter false signals.
Colors and Visuals Used in the Indicator
1. ALMA Line
Colors:
- Green: Indicates a confirmed uptrend (with sufficient volume).
- Red: Indicates a confirmed downtrend (with sufficient volume).
- Gray: Indicates a neutral phase or insufficient volume to confirm a trend.
2. RMS Bands
- Upper and Lower Lines:
- Purple (with transparency): These lines represent the RMS bands (upper and lower) and
adjust opacity based on trend strength.
- Stronger trends result in less transparency (more solid colors).
3. Highlighted Background (Strong Trends)
- Color:
- Light Green (transparent): Highlights a strong trend when the smoothed percentage change (ALMA) exceeds 1.5 times the RMS.
4. Horizontal Lines
- Baseline (0):
- Dark Gray: Serves as a central reference to identify the directionality of percentage changes.
- Additional Line (0.1):
- Blue: A customizable line to mark user-defined key levels.
5. Bar Colors
- Bar Colors:
- Green: When the price is in a confirmed uptrend.
- Red: When the price is in a confirmed downtrend.
- No color: When there is insufficient volume or no clear trend.
How to Use the Indicator
1. Initial Setup
1. Add the Indicator to Your Chart: Copy the code into the Pine Editor on TradingView and apply it to your chart.
2. Customize Parameters: Adjust values based on your trading strategy:
- Smoothing: Controls the level of smoothing for percentage changes.
- Lookback Length: Defines the observation period for calculations.
- Band Multiplier: Adjusts the width of RMS bands.
2. Signal Interpretation
1. Indicator Colors:
- Green: Confirmed uptrend.
- Red: Confirmed downtrend.
- Gray: No clear trend or insufficient volume.
2. RMS Bands:
- If the ALMA line (smoothed percentage change) crosses above the upper RMS band, it signals a potential uptrend.
- If it crosses below the lower RMS band, it signals a potential downtrend.
3. Volume Confirmation:
- The indicator's color activates only if the current volume exceeds the Volume SMA.
3. Alerts and Decisions
1. Trend Change Alerts:
- The indicator automatically triggers alerts when an uptrend or downtrend is detected.
- Configure these alerts to receive real-time notifications.
2. Strong Trend Signals:
- When the magnitude of the percentage change exceeds 1.5 times the RMS, the chart background highlights the strong trend.
4. Trading Strategies
1. Buy:
- Enter long positions when:
- The indicator turns green.
- Volume confirms the trend.
- Consider placing a stop-loss just below the lower RMS band.
2. Sell:
- Enter short positions when:
- The indicator turns red.
- Volume confirms the trend.
- Consider placing a stop-loss just above the upper RMS band.
3. Neutral:
- Avoid trading when the indicator is gray, as no clear trend or insufficient volume is present.
Disclaimer: As this is my first published indicator, please use it with caution. Feedback is highly appreciated to improve its performance.
Happy Trading!

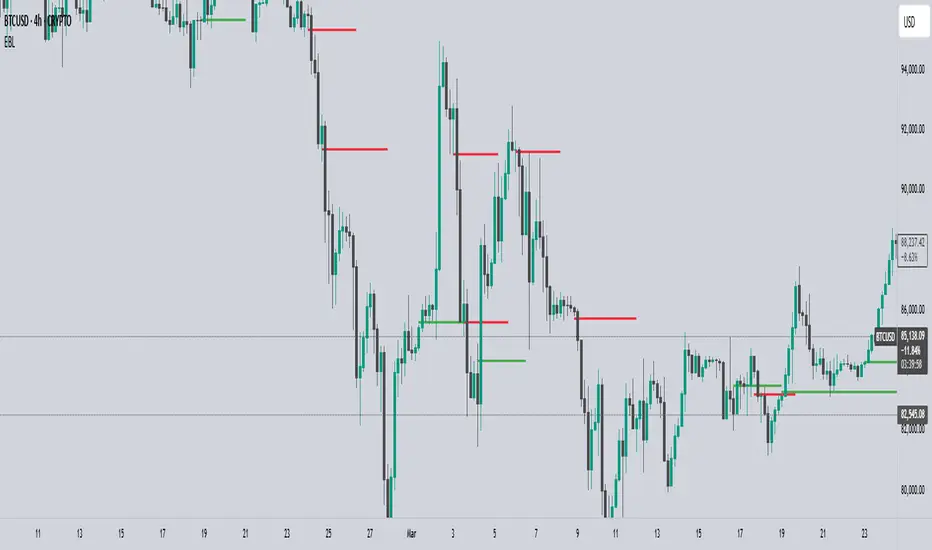
EBL - Enigma BOS LogicThe EBL - Enigma BOS Logic indicator is designed to detect key trend reversal points with precision by leveraging a unique concept based on two-candle price action analysis. Inspired by the balance of pairs in creation, this indicator identifies trend changes by focusing on significant bullish and bearish candle pairs, storing key levels, and waiting for confirmation to provide actionable trade signals. It goes beyond conventional trend-following indicators by offering real-time alerts and clear visual cues for traders.
How It Works
Bullish Setup:
The indicator identifies a bullish candle followed by a bearish candle. It then stores the high of the bullish candle as a potential reversal level.
A bullish confirmation occurs when a future bullish candle closes above the stored high. When this happens:
A green arrow is plotted below the confirming candle.
A horizontal green line is drawn at the stored high level, extending forward by a user-defined number of bars.
An alert is triggered to notify the trader of a confirmed bullish trend.
Bearish Setup:
The indicator identifies a bearish candle followed by a bullish candle. It stores the low of the bearish candle as a potential reversal level.
A bearish confirmation occurs when a future bearish candle closes below the stored low. When this happens:
A red arrow is plotted above the confirming candle.
A horizontal red line is drawn at the stored low level, extending forward by a user-defined number of bars.
An alert is triggered to notify the trader of a confirmed bearish trend.
Touch or Cross Alerts:
In addition to initial trend confirmation, the indicator tracks price movements relative to the drawn horizontal lines.
If the price returns to touch or cross a previously drawn horizontal line, an alert is triggered, indicating a potential re-entry or retracement opportunity.
Customization Options
To make the indicator versatile and adaptable for different trading styles, several customization options are provided:
Line Colors: Traders can customize the colors of the bullish and bearish lines.
Show/Hide Arrows and Lines: Users can choose whether to display the arrows and horizontal lines on the chart.
Line Length: The length of the horizontal lines (number of bars they extend into the future) is user-defined, offering flexibility based on trading timeframes and preferences.
Use Cases
Trend Reversal Detection: EBL is ideal for identifying key trend reversals, allowing traders to enter trades with a high probability of success.
Breakout Confirmation: The indicator provides visual and alert-based confirmation of breakouts beyond critical support or resistance levels.
Re-entry Opportunities: With alerts for price touching or crossing horizontal lines, traders can spot potential re-entry points during retracements.
Conceptual Foundation
The methodology behind this indicator is rooted in the principle that markets often move in pairs of bullish and bearish forces. By tracking the interaction between consecutive bullish and bearish candles and waiting for clear confirmations, this indicator ensures that only high-probability trend changes are signaled. This reduces noise and enhances trading accuracy, making it suitable for scalping, day trading, and swing trading across various timeframes.
How to Use
Apply the indicator to any chart and timeframe of your choice.
Set your preferred customization options, including line colors, arrow display, and line length.
Watch for arrows and listen for alerts to identify confirmed trend changes.
Pay attention to touch or cross alerts on horizontal lines, as these can signal potential re-entry or secondary trade opportunities.
Combine with other analysis: While EBL is powerful on its own, combining it with support/resistance analysis, moving averages, or volume indicators can further enhance its effectiveness.
This indicator is a powerful tool for traders seeking precision in identifying trend changes and actionable trade signals. Its unique logic, real-time alerts, and clear visual cues make it a valuable addition to any trader’s toolkit.
P/L CalculatorDescription of the P/L Calculator Indicator
The P/L Calculator is a dynamic TradingView indicator designed to provide traders with real-time insights into profit and loss metrics for their trades. It visualizes key levels such as entry price, profit target, and stop-loss, while also calculating percentage differences and net profit or loss, factoring in fees.
Features:
Customizable Input Parameters:
Entry Price: Define the starting price of the trade.
Profit and Stop-Loss Levels (%): Set percentage thresholds for targets and risk levels.
USDT Amount: Specify the trade size for precise calculations.
Trade Type: Choose between "Long" or "Short" positions.
Visual Representation:
Entry Price, Profit Target, and Stop-Loss levels are plotted as horizontal lines on the chart.
Line styles, colors, and thicknesses are fully customizable for better visibility.
Real-Time Metrics:
Percentage difference between the live price and the entry price is calculated dynamically.
Profit/Loss (P/L) and fees are computed in real time to display net profit or loss.
Alerts:
Alerts are triggered when:
The live price hits the profit target.
The live price crosses the stop-loss level.
The price reaches the specified entry level.
A user-defined percentage difference is reached.
Labels and Annotations:
Displays percentage difference, P/L, and fee information in a clear label near the live price.
Custom Fee Integration:
Allows input of trading fees (%), enabling accurate net profit or loss calculations.
Price Scale Visualization:
Displays the percentage difference on the price scale for enhanced context.
Use Case:
The P/L Calculator is ideal for traders who want to monitor their trades' performance and make informed decisions without manually calculating metrics. Its visual cues and alerts ensure you stay updated on critical levels and price movements.
This indicator supports a wide range of trading styles, including swing trading, scalping, and position trading, making it a versatile tool for anyone in the market.

Market Structure Algo V2 [OmegaTools]The Market Structure Algo V2 (MS Algo V2) is an advanced TradingView indicator developed by OmegaTools to provide traders with a comprehensive analysis of market structure. This tool refines the insights provided by its predecessor, combining enhanced pivot point analysis, dynamic market structure scoring, and zone visualization to deliver an intuitive view of potential market movements. Through custom settings, the MS Algo V2 allows users to tailor the indicator to fit their trading strategies more closely, offering enhanced adaptability to both short-term and long-term trends.
Core Functionality
The MS Algo V2 differentiates between internal and external market structures by analyzing pivot highs and lows over user-defined periods. The internal market structure focuses on shorter timeframes, providing insights into recent price action, while the external structure considers broader trends. This dual-layered approach helps traders distinguish between immediate and overarching market trends.
The indicator introduces improved visualization for areas of interest or zones around pivot points, adjustable through zone distance settings. These zones serve as potential support and resistance areas, helping traders anticipate price reactions at key levels. In addition to the zones, the indicator now provides gradient-based color coding on bars, reflecting the market structure’s bullish or bearish intensity. This visual enhancement aids in quickly interpreting the current trend's strength.
Dynamic signal generation has been refined in MS Algo V2. The indicator now offers both classic signals and breakout signals based on the market structure, including entries, exits, and change-of-character (CHoCH) alerts. Signals are generated based on price interactions with pivot levels, indicating potential long and short opportunities.
Operational Mechanism
The MS Algo V2 calculates pivot highs and lows over specified periods to define internal and external market structures. A market structure score is derived from these pivot points, classifying the market into bullish or bearish extremes. Signals are generated as the closing price interacts with these levels, marking entry and exit points based on the calculated structure.
A new feature in this version is zone visualization, where zones are plotted around a dynamic moving average derived from the exponential and simple moving averages (EMA and SMA). The zones are adjusted based on ATR (Average True Range) and the specified zone distance percentile, providing a clear visual representation of potential support and resistance regions. The external and internal zones are represented with different levels of transparency for quick reference.
Usage Guidelines
To apply the MS Algo V2 to your TradingView charts, adjust the internal and external market structure settings to match your preferred analysis timeframes. The line style and width of each structure can also be customized for a tailored view. The Zone Distance setting allows users to define the percentile range of the zones around the moving average, providing further flexibility in identifying potential areas of support and resistance.
For a color-coded overview of market sentiment, the bar gradient feature can be enabled. This option uses a gradient that reflects the bullish or bearish intensity of the market structure, giving traders a visual cue on the market’s overall trend. Color-coded signals and zone fill areas further assist in interpreting the current market structure and identifying potential trade areas.
The indicator includes customizable alerts for long and short signals, as well as specific breakout alerts (BOS) and change-of-character (CHoCH) signals. These alerts can help traders stay informed about significant market structure changes, supporting timely trading decisions.
Understanding the Indicator’s Originality
The MS Algo V2 stands out due to its robust integration of pivot analysis, zone visualization, and market structure scoring, offering a unique perspective on market dynamics. With features like color-coded signals, bar gradients, and configurable alerts, MS Algo V2 provides an edge in understanding both the current market environment and potential turning points. This indicator’s ability to represent the market’s structure visually makes it a powerful addition to any trader’s toolkit, especially for those seeking a deeper, multi-layered approach to market analysis.

Strategy: Candlestick Wick Analysis with Volume Conditions
This strategy focuses on analyzing the wicks (or shadows) of candlesticks to identify potential trading opportunities based on candlestick structure and volume. Based on these criteria, it places stop orders at the extremities of the wicks when certain conditions are met, thus increasing the chances of capturing significant price movements.
Trading Criteria
Volume Conditions:
The strategy checks if the volume of the current candle is higher than that of the previous three candles. This ensures that the observed price movement is supported by significant volume, increasing the probability that the price will continue in the same direction.
Wick Analysis:
Upper Wick:
If the upper wick of a candle represents more than 90% of its body size and is longer than the lower wick, this indicates that the price tested a resistance level before pulling back.
Order Placement: In this case, a Buy Stop order is placed at the upper extremity of the wick. This means that if the price rises back to this level, the order will be triggered, and the trader will take a buy position.
SL Management: A stop-loss is then placed below the lowest point of the same candle. This protects the trader by limiting losses if the price falls back after the order is triggered.
Lower Wick:
If the lower wick of a candle is longer than the upper wick and represents more than 90% of its body size, this indicates that the price tested a support level before rising.
Order Placement: In this case, a Sell Stop order is placed at the lower extremity of the wick. Thus, if the price drops back to this level, the order will be triggered, and the trader will take a sell position.
SL Management: A stop-loss is then placed above the highest point of the same candle. This ensures risk management by limiting losses if the price rebounds upward after the order is triggered.
Strategy Advantages
Responsiveness to Price Movements: The strategy is designed to detect significant price movements based on the market's reaction around support and resistance levels. By placing stop orders directly at the wick extremities, it allows capturing strong movements in the direction indicated by the candles.
Securing Positions: Using stop-losses positioned just above or below key levels (wicks) provides better risk management. If the market doesn't move as expected, the position is automatically closed with a limited loss.
Clear Visual Indicators: Symbols are displayed on the chart at the points where orders have been placed, making it easier to understand trading decisions. This helps to quickly identify the support or resistance levels tested by the price, as well as potential entry points.
Conclusion
The strategy is based on the idea that large wicks signal areas where buyers or sellers have tested significant price levels before temporarily retreating. By placing stop orders at the extremities of these wicks, the strategy allows capturing price movements when they confirm, while limiting risks through strategically placed stop-losses. It thus offers a balanced approach between capturing potential profit and managing risk.
This description emphasizes the idea of capturing significant market movements with stop orders while providing a clear explanation of the logic and risk management. It’s tailored for publication on TradingView and highlights the robustness of the strategy.

Prior Day High/Low and Highest High/Lowest LowFeatures:
Prior Day High and Low:
The script tracks and displays the previous trading day's high and low prices. These levels can serve as important areas of support or resistance, helping traders to make informed decisions about potential price reversals or breakouts.
Highest High and Lowest Low Over N Days:
This indicator also tracks and displays the highest high and lowest low over the last N days, where N is user-configurable. This allows traders to see broader trends in price action and identify key levels for potential trend changes.
User-Configurable Inputs:
Show Prior Day High/Low: Toggle whether to display the prior day’s high and low levels.
Days to Consider for Highest High/Lowest Low: Define the number of days over which the highest high and lowest low are calculated.
Show Highest High/Lowest Low: Toggle whether to display the highest high and lowest low levels over the specified period.
Low Source and High Source: Customize the data sources for the high and low values.
Automatic Data Handling:
The script automatically tracks the daily high and low prices, storing them in arrays, and calculates the highest and lowest prices over the user-specified number of days. When a new day begins, the prior day's data is saved, and the calculations are updated accordingly.
Visual Display:
The indicator uses distinct colors and plotting styles:
Prior day’s high and low are plotted as blue circles.
The highest high over N days is plotted as a red circle.
The lowest low over N days is plotted as a green circle.
This indicator helps traders stay informed about significant price levels, which are often used in trading strategies for breakouts, trend following, or reversals.

Dynamic Supply and Demand Zones [AlgoAlpha]Introducing the Dynamic Supply and Demand Zones by AlgoAlpha. This indicator is designed to automatically identify and visualize dynamic supply and demand zones on your chart, helping traders pinpoint potential reversal areas and assess market sentiment with enhanced clarity. It adapts to market conditions using a dynamic look-back mechanism, making it more responsive to recent price movements. 📈💡
Key Features
📊 Dynamic Look-Back : Automatically adjusts the look-back period based on the most recent pivot point, ensuring the most relevant data is analyzed.
🎯 Pivot Point Detection : Utilizes a user-defined period to detect significant pivot highs and lows, marking potential reversal points with precision.
🛠 Customizable Parameters : Offers extensive customization options including look-back period, pivot detection sensitivity, resolution, and zone tolerance.
🗺 Visual Display : Shows supply and demand zones as boxes on the chart, with optional profiles and background highlighting to differentiate between bullish and bearish zones.
🖍 Color-Coded Zones : Zones are color-coded for easy identification: green for bullish, red for bearish, and gray for neutral levels.
🔔 Alert Conditions : Triggers alerts when new pivot points are detected, ensuring you never miss a key market movement.
How to Use
🚀 Adding the Indicator : Press the star icon and add the indicator to favorites. Add it to your chart and adjust settings to fit your trading strategy.
🔍 Zone Analysis : Observe the color-coded zones on the chart. Bullish zones indicate potential support areas, while bearish zones suggest resistance. Monitor price interactions with these zones for potential entry and exit signals.
🔔 Alerts : Activate alert conditions for new pivot detections to stay ahead of market reversals.
How It Works
The indicator starts by detecting pivot highs and lows over a specified period. These pivots serve as reference points for determining the analysis range. If the Dynamic Look-Back feature is enabled, the look-back range dynamically adjusts from the most recent pivot to the current bar. Otherwise, a fixed look-back period is used. The price range is divided into multiple bins based on a specified resolution, and each bin’s volume is calculated by accumulating the volume of candles that fall within its price range. A zone is defined as significant if its volume is less than the adjacent bins, and the difference meets the Zone Tolerance criteria, indicating a potential area of support or resistance. These zones are then plotted on the chart as boxes. Bullish zones are shown in green, and bearish zones in red, helping traders visually identify key levels where supply and demand imbalances may cause price reversals.

Swing Points [Syafiq.Jr]The Swing Points indicator by Syafiq.Jr is designed to identify and visualize pivotal market structures such as Higher Highs (HH), Lower Highs (LH), Lower Lows (LL), and Higher Lows (HL) directly on the chart. This tool is essential for traders who utilize swing trading strategies and rely on understanding market trends through key price levels.
Key Features:
Pivot Strength: Configurable pivot strength to customize the sensitivity of swing points.
Customizable Visuals: Users can adjust the colors and visibility of the zones for each swing point category (HH, LH, LL, HL) based on their preferences.
Multiple Timeframe Support: The indicator offers the flexibility to display swing points from the current timeframe or higher timeframes such as 5-minute, 15-minute, 30-minute, 1-hour, 4-hour, and daily intervals.
Dynamic Extension Lines: Automatically extend key levels across the chart for ongoing reference.
Configurable Font Sizes: Adjust the font size for labels marking the swing points to ensure clear visualization.
This indicator is ideal for traders who need to spot and track critical swing points across different timeframes, enabling better decision-making in trending and ranging markets.

Composite Momentum IndicatorComposite Momentum Indicator" combines the signals from several oscillators, including Stochastic, RSI, Ultimate Oscillator, and Commodity Channel Index (CCI) by averaging the standardized values (Z-Scores). Since it is a Z-Score based indicators the values will be typically be bound between +3 and -3 oscillating around 0. Here's a summary of the code:
Input Parameters: Users can customize the look-back period and set threshold values for overbought and oversold conditions. They can also choose which oscillators to include in the composite calculation.
Oscillator Calculations: The code calculates four separate oscillators - Stochastic, RSI, Ultimate Oscillator, and CCI - each measuring different aspects of market momentum.
Z-Scores Calculation: For each oscillator, the code calculates a Z-Score, which normalizes the oscillator's values based on its historical standard deviation and mean. This allows for a consistent comparison of oscillator values across different timeframes.
Composite Z-Score: The code aggregates the Z-Scores from the selected oscillators, taking into account user preferences (whether to include each oscillator). It then calculates an average Z-Score to create the "Composite Momentum Oscillator."
Conditional Color Coding: The composite oscillator is color-coded based on its average Z-Score value. It turns green when it's above the overbought threshold, red when it's below the oversold threshold, and blue when it's within the specified range.
Horizontal Lines: The code plots horizontal lines at key levels, including 0, ±3, ±2, and ±1, to help users identify important momentum levels.
Gradient Fills: It adds gradient fills above the overbought threshold and below the oversold threshold to visually highlight extreme momentum conditions.
Combining the Stochastic, RSI, Ultimate Oscillator, and Commodity Channel Index (CCI) into one composite indicator offers several advantages for traders and technical analysts:
Comprehensive Insight: Each of these oscillators measures different aspects of market momentum and price action. Combining them into one indicator provides a more comprehensive view of the market's behavior, as it takes into account various dimensions of momentum simultaneously.
Reduced Noise: Standalone oscillators can generate conflicting signals and produce noisy readings, especially during choppy market conditions. A composite indicator smoothes out these discrepancies by averaging the signals from multiple indicators, potentially reducing false signals.
Confirmation and Divergence: By combining multiple oscillators, traders can seek confirmation or divergence signals. When multiple oscillators align in the same direction, it can strengthen a trading signal. Conversely, divergence between the oscillators can warn of potential reversals or weakening trends.
Customization: Traders can tailor the composite indicator to their specific trading strategies and preferences. They have the flexibility to include or exclude specific oscillators, adjust look-back periods, and set threshold levels. This adaptability allows for a more personalized approach to technical analysis.
Clarity and Efficiency: Rather than cluttering the chart with multiple individual oscillators, a composite indicator condenses the information into a single plot. This enhances the clarity of the chart and makes it easier for traders to quickly interpret market conditions.
Overbought/Oversold Identification: Combining these oscillators can improve the identification of overbought and oversold conditions. It reduces the likelihood of false signals since multiple indicators must align to trigger these extreme conditions.
Educational Tool: For novice traders and analysts, a composite indicator can serve as an educational tool by demonstrating how different oscillators interact and influence each other's signals. It allows users to learn about multiple technical indicators in one glance.
Efficient Use of Screen Space: A single composite indicator occupies less screen space compared to multiple separate indicators. This is especially beneficial when analyzing multiple markets or timeframes simultaneously.
Holistic Approach: Instead of relying on a single indicator, a composite approach encourages a more holistic assessment of market conditions. Traders can consider a broader range of factors before making trading decisions.
Increased Confidence: A composite indicator can boost traders' confidence in their decisions. When multiple reliable indicators align, it can provide a stronger basis for taking action in the market.
In summary, combining the Stochastic, RSI, Ultimate Oscillator, and CCI into one composite indicator enhances the depth and reliability of technical analysis. It simplifies the decision-making process, reduces noise, and offers a more complete picture of market momentum, ultimately helping traders make more informed and well-rounded trading decisions.
* Feel free to compare against individual oscillatiors*

dmn's ICT ToolkitThis is my quality of life indicator for forex trading using the methods and concepts of ICT.
The idea is to automate marking up important price levels and times of the day instead of doing it manually every day.
Killzones
Marks the most volatile times of the day on the chart, during which the intraday high/low usually takes place.
Particularly impactful when there's news released during these times.
London Open (02:00-05:00 EST)
New York Open (08:30-11:00 EST)
London Close (10:00-11:30 EST)
True Day delineation
Vertical line at the start of the "true day" (00:00 EST), start of the algorithmic trading day and aids in visualizing the intraday direction.
New York midnight price level
Noteworthy price level at the start of the "true day".
This price level is referenced by the interbank trading algorithms during the day. Buy below it on bullish days, sell above it on bearish days.
Daily open price level
Reference level for optimal trade entries. Buy below it on bullish days, sell above it on bearish days.
Central Banks Dealers Range (CBDR) (14:00-20:00 EST) &
Central Banks Dealers Flout (CBDF) (15:00-24:00 EST) &
Asian Range (AR) (20:00-24:00 EST)
The standard deviation lines available are used to make predictions for short-term future highs/lows when the CBDR and AR are smaller than 40 pips.
Trade them by looking for 5/15min key levels that converge with the projection levels.
X days Average Daily Range (ADR)
Default to 5 days back, gives an idea of how much movement to expect intraday when the ADR high/low is converging with CBDR/CBDF/AR standard deviations.
Current Daily Range (CDR)
Used for comparison against the ADR to help determine if there's enough intraday range left to enter a trade.
Dynamically changes color based on percentage of the ADR. Green below 50% of ADR, orange between 50 and 100%, red when CDR exceeds ADR.
All of the above are used in conjunction with each other and higher timeframe levels of importance to find entries and target.
Note: Preferably use New York's time zone for your charts.

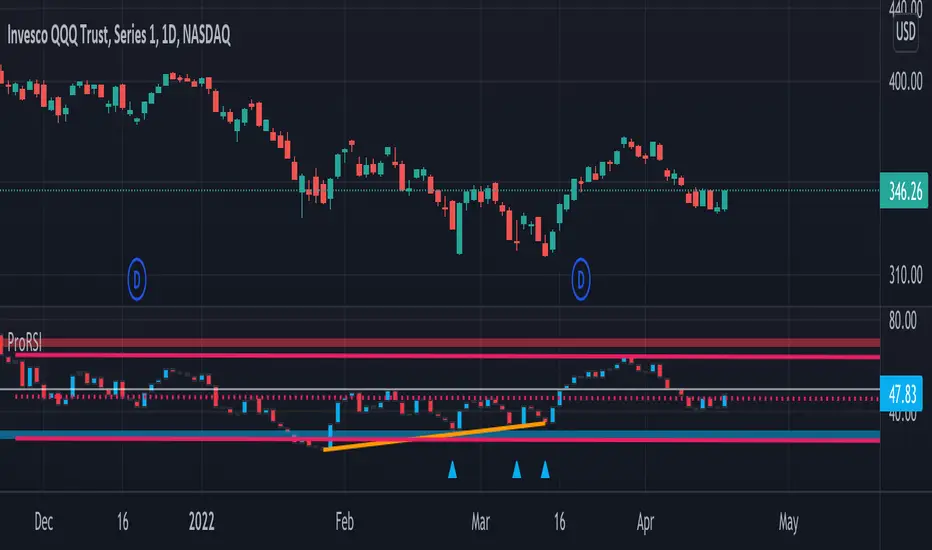
ProRSIProRSI is another in indicator to add to the Pro Indicator suite by DynaProTrading. This algo is made up of a few key components referenced below.
RSI: The primary function of the algo is to plot the candles of the ticker of choice on an oscillator pane to show how price compared to the various key levels. As you can see the red and blue arrows indicator oversold and overbought levels in conjunction with price.
Divergences: In addition to the RSI alerts, there is also a divergence functions where price could be making a higher high but the RSI indicator is making a lower high which is indicating a divergence in price. This is displayed by the lines in the lower window pane from one peak to another.
Trend Lines: Trend lines exist in all technical analysis but in this indicator, it shows the trend lines of the candles in the RSI pane which can help find support and resistance just like with normal price action.
Regression Model: The last key component of the indicator is a regression model which acts as a trend channel for more recent price action.
Momentum Trend & Ignition DashboardDescription
Rationale & Originality Traders often struggle with chart clutter, needing separate indicators for Moving Averages, Volume anomalies, and Fundamental stats (like 52-week highs or Float). This script solves this problem by creating a unified "Momentum Dashboard." It is not just a collection of averages; it is a purpose-built tool for Breakout and Trend Following strategies (such as CAN SLIM or VCP).
The uniqueness of this script lies in its "Confluence Logic": it allows a trader to instantly validate a setup by checking three pillars simultaneously without changing tabs:
Trend: Are the key MAs (20, 50, 100, 200) stacked correctly?
Ignition: Is there a "Power Play" (Big Price Move + Heavy Volume) occurring right now?
Stats: Is the stock near its 52-week high, and does it have a supportive Up/Down Volume Ratio?
How It Works (Detailed Calculations)
1. Custom Trend Ribbon (4x MA Mix):
The script plots 4 independent Moving Averages.
Innovation: Unlike standard inputs, each MA can be individually toggled between SMA (Simple) or EMA (Exponential). This allows traders to mix "Fast" trend lines (e.g., 10 or 20 EMA) with "Slow" institutional lines (e.g., 50 or 200 SMA) in one overlay.
2. "Purple Dot" Ignition Detection:
This features a custom detection algorithm for "Ignition Bars."
Logic: It compares the current candle's Close to the previous Close. If the move exceeds a user-defined threshold (default 5%) AND the Volume exceeds a fixed liquidity threshold (default 500k), a Purple Dot is plotted.
This filters out "low volume drift" and highlights true institutional participation.
3. Relative Volume (RVol) Engine:
Calculates the ratio of Current Volume to the 50-period SMA of Volume.
Visuals: If the ratio exceeds the user threshold (e.g., 1.5x average), the dashboard highlights the data, and optionally the chart bars, alerting the trader to unusual activity.
4. Statistical Dashboard (Data Panel):
Using request.security, the panel fetches daily timeframe data regardless of the chart view.
52-Week & 13-Week H/L: Calculates the percentage distance from these key levels to gauge overhead supply.
U/D Ratio: Calculates the sum of volume on "Up Days" vs. "Down Days" over 50 periods. A value > 1.0 suggests institutional accumulation.
Float %: (Stocks Only) Fetches financial data to show the percentage of shares available for trading.
How to Use This Script
This script is designed for Trend Following and Breakout Trading:
The Setup: Use the Data Panel to find stocks with a U/D Ratio > 1.0 and price within 15% of the 52-Week High.
The Trend: Ensure price is above the MA 2 (set to 50 SMA) and MA 4 (set to 200 SMA) to confirm a Stage 2 uptrend.
The Trigger: Watch for the Purple Dot.
If a Purple Dot appears as price breaks out of a consolidation (base), it confirms institutional buying.
Use the RVol panel to confirm that volume is at least 1.5x normal levels.
Risk Management: Use the MA 1 (set to 20 EMA) as a trailing stop-loss during strong trends.
Settings & Configuration
MAs: Fully adjustable Length and Type (SMA/EMA).
Big Move (Purple Dot): Adjust the % Move based on asset volatility (e.g., use 3% for Large Caps, 10% for Crypto).
Table: The data panel is fully dynamic. You can toggle specific rows (like Float or SMA distance) On/Off to save screen space, and position it anywhere on the chart.
Credits & References
The concept of Relative Volume (RVol) and U/D Ratio is derived from standard Volume Analysis used by William O'Neil.
The "Big Move" combined with Volume thresholds is based on standard Volume Spread Analysis (VSA) concepts regarding "Effort vs. Result."
Financial data fetch (Float) utilizes TradingView's built-in financial() library.

RSI & MACD SuiteRSI & MACD Suite
A professional combination of two essential momentum indicators - Relative Strength Index (RSI) and Moving Average Convergence Divergence (MACD) - designed to provide comprehensive market analysis in a single, clean interface.
OVERVIEW
This indicator combines the power of RSI and MACD to help traders identify potential overbought/oversold conditions, momentum shifts, and trend changes. Both indicators are displayed with enhanced visual elements including gradient fills, customizable bands, and clear signal lines.
FEATURES
RSI (Relative Strength Index)
- Customizable Period: Adjustable RSI length (default: 14)
- Visual Zones: Overbought zone (above 70) with green gradient, Oversold zone (below 30) with red gradient, Background fill between bands for easy reference
- Key Levels: Clear horizontal lines at 30, 50, and 70
- Flexible Source: Choose any price source (close, open, high, low, etc.)
MACD (Moving Average Convergence Divergence)
- Customizable Parameters: Fast Length (default: 12), Slow Length (default: 26), Signal Length (default: 9)
- MA Type Selection: Choose between EMA or SMA for both oscillator and signal line
- Color-Coded Histogram: Green for bullish momentum, Red for bearish momentum
- Clear Signal Lines: Blue MACD line and orange Signal line for easy identification
ALERT CONDITIONS
The indicator includes 7 built-in alert conditions:
RSI Alerts:
1. RSI Overbought - Triggers when RSI crosses above 70
2. RSI Oversold - Triggers when RSI crosses below 30
3. RSI Midline Cross - Triggers when RSI crosses the 50 level
MACD Alerts:
4. MACD Bullish Cross - Triggers when MACD line crosses above Signal line
5. MACD Bearish Cross - Triggers when MACD line crosses below Signal line
6. MACD Histogram Bullish - Triggers when histogram crosses above zero
7. MACD Histogram Bearish - Triggers when histogram crosses below zero
CUSTOMIZATION
Clean Organization
- Inputs Tab: Separate groups for RSI and MACD settings
- Style Tab: All visual elements clearly labeled with "RSI -" or "MACD -" prefixes for easy identification
- Full Control: Customize colors, line widths, and visibility of all elements
Visual Clarity
- Professional color scheme optimized for both light and dark themes
- Gradient fills for intuitive zone identification
- Clear separation between RSI and MACD elements
SETTINGS
RSI Settings
- Length: Lookback period for RSI calculation (default: 14)
- Source: Price data to use for calculation (default: close)
MACD Settings
- Source: Price data to use for calculation (default: close)
- Fast Length: Period for fast moving average (default: 12)
- Slow Length: Period for slow moving average (default: 26)
- Signal Length: Period for signal line (default: 9)
- Oscillator MA Type: EMA or SMA for MACD calculation
- Signal MA Type: EMA or SMA for signal line
TECHNICAL DETAILS
- Pine Script Version: v6
- Indicator Type: Oscillator (subplot)
- Calculation Method: RSI uses Relative Strength Index with RMA smoothing, MACD uses Fast MA minus Slow MA with configurable MA types
- Input Validation: Built-in checks to ensure valid parameter combinations
NOTES
- Default settings are industry-standard values (RSI: 14, MACD: 12/26/9)
- All visual elements can be hidden/shown individually in the Style tab
- Alerts must be manually created by users through TradingView's alert system
- This indicator does not repaint - all signals are based on closed candles
WHO SHOULD USE THIS
- Day traders looking for momentum signals
- Swing traders identifying trend changes
- Technical analysts performing multi-indicator analysis
- Traders who want a clean, all-in-one momentum solution
DISCLAIMER
This indicator is for educational and informational purposes only. It does not constitute financial advice. Always perform your own analysis and risk assessment before making trading decisions.
Version: 1.0
Author: aaboomar
License: Mozilla Public License 2.0

MA Distance MonitorMA Distance Monitor - Custom
Overview
The MA Distance Monitor is a professional-grade dashboard designed for traders who need to track the relationship between price and multiple Moving Averages simultaneously.
Unlike standard indicators that simply plot lines, this tool quantifies exactly how far the price is from your key levels (in Percentage or Price terms). This is crucial for identifying Mean Reversion opportunities (when price is overextended) and confirming Trend Strength.
Key Features
1. 5 Fully Configurable Moving Averages
Monitor 5 distinct MAs at once.
Default Setup: 5, 10, 20, 50, and 200 SMA (Simple Moving Average) — widely used institutional levels.
Customization: Switch any individual MA between SMA and EMA (Exponential Moving Average) and change lengths to fit your strategy.
2. Smart Dashboard (Clean Mode by Default)
The on-screen table gives you real-time data without cluttering your chart.
Clean Mode: By default, it shows only the Distance %, giving you a minimalist view of market extension.
Expandable: In the settings, you can enable additional columns to see the MA Name, MA Price, and Warning Thresholds.
Borders: Toggle table grid lines on or off for a seamless look.
3. "Overextended" Warning System
Set a specific "Warn %" threshold for each MA (e.g., 5%).
If the price deviates beyond this threshold, the indicator highlights the data in Orange (or your custom color).
Use Case: This helps identify when price has moved too far, too fast, signaling a potential pullback or reversal.
4. Chart Scale Labels
Floating labels appear on the right-side price scale, marking the exact price level of your MAs.
These labels dynamically show the current distance %, keeping your eyes on the price action.
5. Advanced Theming
Dark Mode: High-contrast colors optimized for dark charts.
Light Mode: Optimized for bright backgrounds.
Custom: Fully control every color (Bullish, Bearish, Warning, Text, Headers, Borders) to match your chart aesthetic perfectly.
How to Use
Interpreting the Data
Green: Price is Above the Moving Average (Bullish Trend).
Red: Price is Below the Moving Average (Bearish Trend).
Orange (Warning): Price is Overextended (Distance > Threshold). Watch for mean reversion.
Settings Guide
MA Configuration: Set your Lengths and Types (SMA/EMA).
Display & Styling: * Toggle Show Dashboard Table to hide/view the table.
Toggle Show Table Header or Show Table Borders for layout preference.
Enable Show MA Name or Show MA Price for more detailed data.
Colors: Select "Custom" in the Theme dropdown to apply your own color palette.
Alerts
This script includes built-in alertcondition events for automation:
Crossover: Triggered when Price crosses OVER a specific MA.
Crossunder: Triggered when Price crosses UNDER a specific MA.
To set an alert:
Click the "Alert" button in TradingView.
Select "MA Dist Custom" as the condition.
Choose the specific crossing event (e.g., "Cross Over MA 5").
Created by Psycholfye

Custom ORBIT GSK-VIZAG-AP-INDIA🚀 Custom ORBIT — Opening Range Breakout & Reversal Indicator
This indicator automatically calculates and plots the Opening Range (OR) high and low levels for a user-defined session and duration. It is designed to assist intraday traders by providing immediate visual signals for both price breakouts and subsequent reversals from these key levels.
The indicator is particularly suitable for markets with defined trading hours, such as the Indian indices (Nifty, Bank Nifty), given its default time settings are based on GMT+5:30.
⚙️ How It Works (Indicator Logic)
The indicator operates based on three main logical components: time definition, level calculation, and signal generation.
1. Time Session and Range Definition: All time calculations are based on GMT+5:30 (Indian Standard Time/IST). The script defines a specific trading session from a customizable start time (default 9:15 AM) to a session end time (default 3:30 PM). The Opening Range (OR) is established during the initial duration, which is set by the rangeMinutes input (default 15 minutes, meaning the OR is calculated from 9:15 AM to 9:30 AM).
2. Level Calculation and Plotting: During the initial range duration, the script captures the absolute highest price (OR High) and the absolute lowest price (OR Low). Once this period ends, two horizontal lines—a green line for the OR High and a red line for the OR Low—are drawn and automatically extended across the chart for the remainder of the active trading session. The visual style of these lines can be customized to Dotted, Dashed, or Solid.
3. Breakout and Reversal Logic: The indicator actively tracks the market's state relative to the OR levels to generate four distinct signals:
Break Up: A signal is generated when the closing price crosses over the OR High, indicating potential upward momentum.
Break Down: A signal is generated when the closing price crosses under the OR Low, indicating potential downward momentum.
Reversal Down: This yellow signal occurs only after a price has already broken above the OR High (Break Up state), and then the price moves back into the range (closing below the ORH), suggesting a failed breakout.
Reversal Up: This yellow signal occurs only after a price has already broken below the OR Low (Break Down state), and then the price moves back into the range (closing above the ORL), suggesting a failed breakdown.
💡 Suggested Use Cases
The signals generated by this indicator can be used in two primary ways:
Breakout Trading: A trader may enter a long position on a "Break Up" signal or a short position on a "Break Down" signal. A common risk management practice is to use the opposite OR level (ORL for long trades, ORH for short trades) as a stop-loss reference.
Faded Breakout / Reversal Trading: Look for the yellow "Reversal Up" or "Reversal Down" signals. These signals indicate a rejection of the OR level, and a trader may take a counter-trend position with the expectation that the price will return to the consolidation range or move toward the opposite OR level.
⚠️ Educational Disclaimer
This indicator is for educational and illustrative purposes only. It provides technical signals based on mathematical calculation of price action and should not be construed as financial advice, trading advice, or a solicitation to buy or sell any financial instrument. Trading carries a high level of risk, and you may lose more than your initial deposit. Past performance is not indicative of future results. Always consult with a qualified financial professional before making any investment decisions.

On Balance Volume [BrightSideTrading]
# On Balance Volume - Complete User Guide
## Overview
This enhanced OBV indicator provides clean, actionable volume analysis with intelligent signal filtering. It combines On-Balance Volume (OBV) with a smoothed signal line to identify shifts in buying and selling pressure without chart clutter.
**Key Features:**
- Real-time OBV and signal line visualization
- Smart crossover detection with confirmation filtering
- Z-Score momentum analysis
- Customizable signal alerts with V-shaped markers
- Window-normalized option for detrended analysis
---
## What is On-Balance Volume (OBV)?
OBV is a volume-based momentum indicator that accumulates volume on up days and subtracts volume on down days. It answers a fundamental question: **Is volume flowing in (buying) or out (selling)?**
**Formula:**
- If Close > Previous Close: OBV = Previous OBV + Volume
- If Close < Previous Close: OBV = Previous OBV - Volume
- If Close = Previous Close: OBV = Previous OBV (unchanged)
**What it tells you:**
- **Rising OBV** = Accumulation (smart money buying)
- **Falling OBV** = Distribution (smart money selling)
- **OBV above zero line** = Net positive buying pressure
- **OBV below zero line** = Net negative selling pressure
---
## Interface & Settings
### **MAIN VISUALIZATION**
**OBV Line (Green/Red Ribbon)**
- Green when OBV is above the signal line (bullish trend)
- Red when OBV is below the signal line (bearish trend)
- Toggles between window-normalized (detrended) and raw values
**Signal Line (Orange)**
- Smoothed average of OBV
- Crossovers with OBV generate buy/sell signals
- Default: 21-period SMA
**V-Shaped Markers**
- Green upward V = Bullish crossover (buy signal)
- Red downward V = Bearish crossover (sell signal)
- Appears at the OBV value when signal is triggered
**Zero Line (Yellow)**
- Center equilibrium point for volume balance
- Acts as support/resistance for OBV
- Separates buying pressure (above) from selling pressure (below)
---
### **SOURCE GROUP**
**Source**
- **Default:** Close
- **Options:** Open, High, Low, or any custom value
- Controls which price value triggers OBV direction changes
- Most traders use Close for standard OBV calculation
---
### **SIGNAL SMOOTHING GROUP**
**Show Signal?**
- **Default:** ON
- Toggle visibility of the signal line
- Disable if you prefer to see raw OBV only
**Smoothing Type**
- **SMA (Simple Moving Average)** - Default, standard smoothing
- **EMA (Exponential Moving Average)** - Faster response, weights recent bars more heavily
- **Choose SMA** for consistent, traditional OBV signals
- **Choose EMA** for faster trend identification (more whipsaws possible)
**Smoothing Length**
- **Default:** 21 bars
- **Range:** 1-200 bars
- **Lower values** (5-14): Faster signals, more noise
- **Higher values** (30-50): Slower signals, fewer false alarms
- **Recommendation:** Use 21-25 for most timeframes
---
### **SIGNAL FILTERING GROUP**
This is your primary control for signal quality and frequency.
**Show Signal Markers?**
- **Default:** ON
- Toggle the V-shaped buy/sell markers on/off
- Disable if markers distract from your analysis
**Signal Filter Type**
- **None** - Shows every single crossover (noisy, best for skilled traders)
- **Confirmation Bars** - Waits N bars before confirming signal (recommended)
- **Strength-Based** - Only signals during strong momentum (filters weakest moves)
#### **CONFIRMATION BARS MODE** (Recommended)
Best for reducing false signals while staying responsive to real moves.
**Confirmation Bars**
- **Default:** 2 bars
- **Range:** 1-10 bars
- Waits for the signal to hold for N consecutive bars after crossover
- **Setting 1:** Every crossover (same as "None")
- **Setting 2:** Wait 1 bar confirmation (good balance)
- **Setting 3:** Wait 2 bars confirmation (filters 50% of noise)
- **Setting 4+:** Very selective, misses quick reversals
**How it works:**
1. OBV crosses signal line → Confirmation counter starts
2. If OBV stays on correct side for 2 bars → V-marker appears
3. If OBV crosses back → Counter resets, no signal
#### **STRENGTH-BASED MODE**
Only signals when momentum is statistically significant.
**Min Z-Score Strength**
- **Default:** 0.3
- **Range:** 0.0-3.0
- Requires OBV deviation from its mean to reach this threshold
- **Setting 0.1-0.3:** More signals, lower quality
- **Setting 0.5-0.8:** Moderate signals, good quality
- **Setting 1.0+:** Only the strongest momentum shifts
**How it works:**
- Calculates how far OBV is from its 50-bar average (Z-score)
- Only shows signals when this distance is meaningful
- Automatically avoids weak, choppy market conditions
---
### **VISUALS & COLORS GROUP**
**Highlight Crossovers?**
- **Default:** ON
- Master toggle for all signal markers
- Turn OFF to see only the OBV/signal lines
**Apply Ribbon Filling?**
- **Default:** ON
- Colors the space between OBV and signal line
- Green fill = OBV above signal (bullish)
- Red fill = OBV below signal (bearish)
- Provides clear visual trend confirmation
- Turn OFF for minimal chart clutter
---
### **STATS & ZONES GROUP**
**Use Window-Normalized OBV (visual only)?**
- **Default:** ON
- Removes long-term trend from OBV for clearer short-term signals
- Detrends the indicator to highlight recent momentum changes
- **ON:** Better for swing trading and identifying reversals
- **OFF:** Better for trend-following strategies
- Note: Z-Score always uses raw OBV for statistical accuracy
**OBV Normalize Window**
- **Default:** 200 bars
- Lookback period for detrending calculation
- Larger values = more aggressive detrending
- Adjust if you want OBV to oscillate more/less around zero
**Show Z-Score (OBV)?**
- **Default:** ON
- Displays statistical momentum indicator below main chart
- Ranges from -3 to +3 (most data within -2 to +2)
- High Z-Score = Strong buying momentum
- Low Z-Score = Strong selling momentum
**Z-Score Lookback**
- **Default:** 50 bars
- Period for calculating Z-Score mean and standard deviation
- Larger = smoother Z-Score, slower response
- Smaller = noisier Z-Score, faster response
**Show ROC (OBV Momentum)?**
- **Default:** OFF
- Rate of Change indicator for OBV velocity
- Useful for identifying momentum turning points
- Enable if you want to see speed of volume changes
**ROC Lookback**
- **Default:** 14 bars
- Period for ROC calculation
**Show Z-Score StdDev Zones?**
- **Default:** ON
- Shaded regions around zero line showing statistical boundaries
- Inner Zone (±1 Z) = Normal variation
- Outer Zone (±2 Z) = Extreme moves, potential reversals
- Helps identify overbought/oversold volume conditions
**Inner Zone (±Z)**
- **Default:** 1.0
- First boundary for standard deviation zones
- Most normal trading occurs within ±1
**Outer Zone (±Z)**
- **Default:** 2.0
- Second boundary for extreme conditions
- Crossing these zones indicates significant momentum shift
---
## Trading Strategy Examples
### **Strategy 1: Signal Line Crossovers (Beginner)**
**Setup:**
- Signal Filter Type: **Confirmation Bars**
- Confirmation Bars: **2-3**
- Show Signal Markers: **ON**
**Rules:**
1. **BUY signal** (green V): When OBV crosses above signal line and holds for 2-3 bars
- Confirms buying pressure is building
- Look for price to follow within 1-3 bars
2. **SELL signal** (red V): When OBV crosses below signal line and holds for 2-3 bars
- Confirms selling pressure is increasing
- Expect price decline
3. **Exit:** Take profits at next signal or use price support/resistance
**Best For:** Swing trading, intraday reversals, timeframes 5m-1h
---
### **Strategy 2: Zero Line Bounce (Intermediate)**
**Setup:**
- Signal Filter Type: **Strength-Based**
- Min Z-Score Strength: **0.5**
- Show Z-Score StdDev Zones: **ON**
**Rules:**
1. **Watch OBV approach zero line** during established trends
- OBV bouncing repeatedly off zero = trend is healthy
- OBV breaking through zero = trend reversal imminent
2. **Enter on bounce:** Buy when OBV bounces from zero line in uptrend
3. **Exit on break:** Close position when OBV breaks below zero line
4. **Confirm with Z-Score:** Only take trades when Z-Score shows momentum (|Z| > 0.5)
**Best For:** Trend traders, identifying trend strength, medium timeframes 15m-4h
---
### **Strategy 3: Momentum Extremes (Advanced)**
**Setup:**
- Signal Filter Type: **None**
- Show Z-Score StdDev Zones: **ON**
- Outer Zone: **2.0**
**Rules:**
1. **Identify extremes:** When Z-Score breaks outer zone (±2.0)
- Indicator is in extreme territory
- Likely overextended
2. **Fade extremes:** Take opposite position when Z-Score hits extreme
- High Z (>2.0) = OBV overbought, expect pullback
- Low Z (<-2.0) = OBV oversold, expect bounce
3. **Confirm:** Wait for crossover signal to enter
4. **Target:** Outer zone of opposite side or zero line
**Best For:** Range trading, mean reversion, experienced traders only
---
## Reading the Indicator in Different Markets
### **Strong Uptrend**
- OBV consistently above signal line (green)
- OBV well above zero line, rising higher lows
- Z-Score positive, trending upward
- **Action:** Buy dips to signal line, sell at resistance
### **Strong Downtrend**
- OBV consistently below signal line (red)
- OBV well below zero line, making lower highs
- Z-Score negative, trending downward
- **Action:** Sell rallies to signal line, cover at support
### **Consolidation/Choppy Market**
- OBV whipsaws around signal line frequently
- Crossovers occur every few bars
- Z-Score oscillating between -1 and +1
- **Action:** Increase confirmation bars to 3-4, or switch to strength-based filter
### **Accumulation (Bottom Formation)**
- OBV rising while price is flat or falling
- Volume flowing in despite downtrend (bullish divergence)
- Z-Score climbing while price lows hold
- **Action:** Expect breakout up; prepare buy near support
### **Distribution (Top Formation)**
- OBV falling while price is flat or rising
- Volume flowing out despite uptrend (bearish divergence)
- Z-Score falling while price continues higher
- **Action:** Expect breakdown down; prepare short near resistance
---
## Parameter Tuning Guide
### **Aggressive Settings (More Signals)**
- Smoothing Length: 14
- Signal Filter: None or Confirmation Bars: 1
- Min Z-Score: 0.1
- Best for: Day trading, high volatility stocks
- Risk: More false signals
### **Balanced Settings (Recommended)**
- Smoothing Length: 21
- Signal Filter: Confirmation Bars: 2
- Min Z-Score: 0.3
- Best for: Swing trading, most market conditions
- Risk/Reward: Moderate
### **Conservative Settings (Fewer Signals)**
- Smoothing Length: 30-40
- Signal Filter: Confirmation Bars: 3-4 or Strength-Based: 0.7+
- Min Z-Score: 0.8
- Best for: Position trading, high-conviction trades only
- Risk: May miss some moves
---
## Common Questions & Troubleshooting
**Q: Why are there more sell signals than buy signals?**
A: This reflects the actual market action. Markets often decline faster than they rise (fear > greed). Confirm signals with price action and support/resistance.
**Q: The indicator keeps whipsawing, should I hide it?**
A: Increase Confirmation Bars to 3-4 or switch to Strength-Based filter. Market conditions matter—choppy markets require stricter filters.
**Q: What's the difference between normalized and raw OBV?**
A: Normalized (detrended) shows shorter-term momentum by removing long-term trends. Raw OBV shows absolute accumulation/distribution over the full period. Use normalized for swing signals, raw for trend confirmation.
**Q: My signals come too late. How do I get faster entry?**
A: Reduce Smoothing Length (try 14 instead of 21), use EMA instead of SMA, or set Confirmation Bars to 1. Trade-off: More false signals.
**Q: Can I use this for day trading?**
A: Yes, on 1m-5m charts with aggressive settings. Use Confirmation Bars: 1 and focus on Z-Score > 0.5 entries only.
**Q: Should I trade every signal?**
A: No. Filter signals using: price near support/resistance, multiple indicators confirming, and Z-Score showing momentum. Best signals occur at key levels.
---
## Best Practices
1. **Always confirm with price action:** OBV signals work best when price is near support, resistance, or moving average. Don't trade signals in a vacuum.
2. **Use volume context:** Check if volume is increasing or decreasing on the signal. Strong signals have volume confirmation (increasing volume on OBV spikes).
3. **Adjust settings per timeframe:**
- 1m-5m: Smoothing 12, Confirmation 1, Z-Score 0.2
- 15m-1h: Smoothing 20, Confirmation 2, Z-Score 0.3
- 4h-1d: Smoothing 25, Confirmation 3, Z-Score 0.5
4. **Watch the zero line:** It's your friend. OBV behavior at the zero line reveals trend strength. Bounces = healthy trend. Breaks = reversal.
5. **Risk management:** No indicator is perfect. Use proper position sizing and stop losses. OBV should confirm your thesis, not be the only reason to trade.
6. **Combine with other indicators:**
- Price moving averages for trend confirmation
- RSI or Stochastic for overbought/oversold levels
- Support/resistance for entry/exit zones
- MACD for momentum divergences
---
## Disclaimer
This indicator is for educational and informational purposes only. It is not financial advice. Past performance does not guarantee future results. Always conduct your own research and consult with a financial advisor before making trading decisions. Trading carries risk, including potential loss of principal.
---
## Version History
**Version 1.0** - Initial release with enhanced signal filtering, Z-Score analysis, and customizable parameters.

Liquidity Structure & Sweeps [Visualized]Liquidity Structure & Sweeps | 流动性结构与猎杀
1. Design Philosophy & Logic
This indicator is designed based on Smart Money Concepts (SMC) and Market Microstructure principles. Unlike traditional indicators that rely on lagging averages or repainting fractals, this script focuses on "Objective Structure" and "Liquidity Grabs".
The core design philosophy rests on three pillars:
Zero Repainting (Real-time Integrity): We utilize a strict "Left-Side Confirmation" algorithm. A structure level is only stored in memory when the candle is fully closed (barstate.isconfirmed). This ensures that the historical signals you see are exactly what happened in real-time.
Institutional Memory (Visualized): Markets "remember" key levels. This script draws dashed lines extending from valid pivot points. These lines represent "resting liquidity" (Stop Orders). They remain on the chart until the price interacts with them.
Sweep vs. Breakout: Not all breaches are equal. We specifically look for "Sweeps" (Liquidity Grabs) — where price pierces a level but closes back inside. This is a classic sign of absorption and potential reversal, distinct from a structural breakout.
2. Key Features
Visualized Order Blocks: Automatically draws potential support (Green Dotted) and resistance (Red Dotted) lines based on fractal points.
Wick Detection: Filters out strong momentum breakouts. Signals are only generated when a specific "Wick Ratio" is met, indicating a rejection.
Clean Charts: Features a "Garbage Collection" mechanism. Once a level is swept, the line is removed, and a signal dot is placed. Old, untouched levels are automatically cycled out to prevent chart clutter.
3. How to Use
The Lines (Context):
Red Dotted Line: Buy-side Liquidity (Resistance). Expect potential shorts or breakouts here.
Green Dotted Line: Sell-side Liquidity (Support). Expect potential longs or breakdowns here.
The Signals (Action):
Red Dot (Bearish Sweep): Price spiked above a Resistance Line but closed below it. This suggests long stops were hunted, and bears are stepping in.
Green Dot (Bullish Sweep): Price spiked below a Support Line but closed above it. This suggests short stops were hunted, and bulls are stepping in.
Configuration:
Structure Length: Adjusts sensitivity. Higher values (e.g., 20-50) find major swing points; lower values (e.g., 5-10) find scalping setups.
Wick Filter %: The minimum size of the wick relative to the breakout. Increase this to filter for only the most dramatic rejections.
4. Developer Notes & Considerations
Why do lines disappear? In this logic, liquidity is treated as "Fuel". Once a level is swept (the stop orders are triggered), the fuel is consumed. Keeping the line would clutter the chart with invalid data.
Why is the dot small? The indicator is designed to be part of a toolchain, not a standalone signal. The minimalist design prevents visual interference with price action or other indicators.
1. 设计思路与核心逻辑
本指标基于 聪明钱概念 (SMC) 与 市场微观结构 原理设计。不同于依赖滞后均线或存在重绘问题的传统分形指标,本脚本专注于捕捉 “客观结构” 与 “流动性猎杀 (Liquidity Grabs)”。
核心设计哲学包含三大支柱:
零重绘 (Zero Repainting): 我们采用了严格的“左侧确认”算法。所有的结构位仅在K线完全收盘 (barstate.isconfirmed) 后才会被记录。这保证了您回测看到的信号与实盘完全一致,杜绝“未来函数”陷阱。
可视化的机构记忆: 市场是有记忆的。本脚本会从有效的波段高低点引出虚线。这些虚线代表了“沉睡的流动性”(止损盘聚集区)。它们会一直延伸,直到价格触碰它们。
区分“猎杀”与“突破”: 并不是所有的破位都是一样的。我们专注于识别“扫损(Sweep)”——即价格刺破了关键位,但收盘价收回了关键位内部。这是典型的吸筹或派发信号,与趋势延续的真突破有本质区别。
2. 主要功能
结构可视化: 自动基于分形点绘制潜在的支撑线(绿色虚线)和阻力线(红色虚线)。
插针检测: 过滤掉强势的实体突破。只有当价格出现明显的“长影线”拒绝行为时,才会触发信号。
图表自清洁: 内置“垃圾回收”机制。一旦某个关键位的流动性被猎杀(触发信号),该线条会被自动删除。过旧且未被触碰的线条也会被自动替换,保持图表整洁。
3. 使用指南
线条 (市场语境):
红色虚线: 买方流动性池(阻力位)。
绿色虚线: 卖方流动性池(支撑位)。
信号点 (交易动作):
红色圆点 (看跌猎杀): 价格刺破了红色阻力线,但收盘价回落到线下方。这暗示多头止损被触发,主力可能正在建立空单。
绿色圆点 (看涨猎杀): 价格刺破了绿色支撑线,但收盘价反弹到线上方。这暗示空头止损被触发,主力可能正在建立多单。
参数设置建议:
Structure Length (结构周期): 调整灵敏度。数值越大(如 20-50)锁定大级别波段;数值越小(如 5-10)适合短线剥头皮。
Wick Filter % (影线过滤): 设置影线占价格波动的最小比例。调大该数值可以只看最剧烈的反转信号。
4. 开发者注记与潜在考量
为什么线条会消失? 在本逻辑中,流动性被视为“燃料”。一旦发生猎杀(止损单成交),该位置的燃料即被消耗。移除线条是为了防止无效数据干扰判断。
为什么圆点设计得很小? 该指标旨在成为您交易工具链的一部分,而非唯一的决策依据。极简设计是为了避免干扰裸K形态或其他指标的观察。
===============================================================
这个脚本(我们称之为 Liq Structure Script)本质上是一个基于价格行为(Price Action)的结构猎杀探测器。
以下是详细的深度对比分析:
1. 如何使用? (实战操作手册)
不要把它当作“红灯停绿灯行”的傻瓜指标。把它当作一个**“战场地图”**。
第一阶段:观察结构 (The Setup)
图表上会自动画出 红色虚线(上方压力)和 绿色虚线(下方支撑)。
解读:告诉自己,“这里埋着很多人的止损单”。不要在这里盲目追涨杀跌。
第二阶段:等待猎杀 (The Trigger)
耐心等待价格冲向这些虚线。
关键动作:价格刺破虚线,然后迅速收回。
信号确认:虚线消失,留下一个 红点(顶部猎杀)或 绿点(底部猎杀)。
第三阶段:进场逻辑 (The Execution)
做空逻辑:出现红点 + K线留长上影线 → 说明多头试图突破失败,被主力“倒了一盆冷水”。此时可尝试做空,止损设在刚刚那个最高点上方一点点。
做多逻辑:出现绿点 + K线留长下影线 → 说明空头试图砸盘失败,被主力接住了。
传统爆量是“燃料”,Liq 脚本是“引爆点”。没有引爆点的爆量可能是空转;没有爆量的引爆点可能是假摔。Liq 脚本是一个免费、轻量级、基于K线逻辑的替代品。它不需要你买昂贵的数据服务,它利用的是“图表形态学”中的流动性共识。
结论:如何定位这个工具?
这个脚本不是“预测未来的水晶球”,而是一个**“高胜率区域提示器”**。
用它来找位置(哪里有陷阱?)。
用成交量来做确认(是不是真的有主力介入?)。
用宏观逻辑来定方向(现在该做多还是做空?)。
它是你交易工具链中负责**“微观入场时机(Timing)”**的那一环。
