Dynamic Support & Resistance ZonesDynamic Support & Resistance Zones
Overview
This indicator automatically detects and visualizes dynamic support and resistance zones based on pivot point analysis. Unlike simple horizontal lines, these zones adapt to market volatility using ATR and track how many times price has respected each level—giving you a real-time strength score for every zone.
How It Works
The indicator identifies swing highs and lows using pivot detection, then creates zones around these price levels. Each zone is continuously monitored for:
Touches: Every time price enters the zone and reverses, the touch count increases
Strength: A 0-100% score based on touch count and recency (zones fade over time if untested)
Breaks: When price closes beyond the zone for consecutive bars, it's marked as broken and removed
Nearby zones of the same type automatically merge to reduce clutter, and only the strongest zones are displayed based on your settings.
Features
🎯 Smart Zone Detection
Pivot-based identification of key price levels
ATR-adaptive zone width (adjusts to volatility)
Automatic merging of overlapping zones
📊 Strength Scoring System
Each zone rated 0-100% based on touches + time decay
Stronger zones appear more opaque
Weak/old zones automatically removed
🔔 Built-in Alerts
Alert when price approaches a zone
Alert when price breaks through a zone
📋 Info Panel
Shows count of active resistance/support zones
Displays nearest S/R levels above and below current price
Settings
Detection Settings
Pivot Lookback Length - Higher values find stronger but fewer levels (default: 10)
Zone Width (%) - Width of each zone as % of price (default: 0.5%)
Max Zones to Display - Limits visual clutter (default: 8)
Merge Distance (%) - Zones within this % are combined (default: 1.0%)
Zone Strength
Min Touches for Valid Zone - Zones need this many touches to display (default: 2)
Strength Decay (bars) - How quickly zones lose strength over time (default: 100)
Break Confirmation Bars - Consecutive closes needed to confirm a break (default: 2)
Visual Settings
Customize resistance/support colors
Toggle labels and strength display
Option to extend zones into the future
How to Use
For Entries:
Look for confluence when price approaches a high-strength zone (70%+)
Zones with 3+ touches have historically acted as strong reversal points
Use the "approaching zone" alert to get notified before price reaches key levels
For Exits/Targets:
Set profit targets at the nearest resistance (for longs) or support (for shorts)
The info panel shows these levels in real-time
For Breakout Trading:
Watch for breaks of high-touch zones—these often lead to momentum moves
Use the "broke zone" alert to catch breakouts as they happen
Best Practices
On higher timeframes (4H, Daily): Use higher pivot lookback (15-20) for major levels
On lower timeframes (5m, 15m): Use lower pivot lookback (5-8) for scalping levels
For volatile assets: Increase zone width to 1-2%
For ranging markets: Lower min touches to 1 to see more potential levels
Notes
Zones are drawn from the time they were created, extending right
The indicator uses timestamps (not bar indices) so it works on any history length
Broken zones are automatically cleaned up to keep your chart clear
Tip: Combine with volume analysis or momentum indicators for confirmation before trading S/R levels.
If you find this indicator useful, please leave a comment with your feedback or suggestions for improvements!
스크립트에서 "key levels"에 대해 찾기
SPY Daily Gamma Levels [Manual Input With Alerts]Overview This indicator plots key options-based support and resistance levels (Gamma Exposure / GEX) directly on your chart. Unlike standard technical analysis, these levels (Call Wall, Gamma Flip, Put Support, and Volatility Trigger) represent where Market Makers are positioned, often acting as "magnets" or "repellents" for price action.
Important Note: TradingView Pine Script cannot currently access external options open interest data natively. Therefore, this is a Manual Input Indicator. You must update the four price levels in the settings each morning before the market opens.
Key Features:
4 Key Levels: Plots the Call Wall, Gamma Flip (Zero Gamma), Put Support, and Volatility Trigger.
Auto-Cleaning: Automatically deletes yesterday's lines to keep your chart clean; lines only show for the current session.
Alerts Included: Built-in alert conditions allow you to set notifications when price crosses the Gamma Flip or breaks the Vol Trigger.
Customization: Fully customizable colors and line styles.
Best Practices:
Timeframe: Works best on 15-minute charts for trend identification and 5-minute charts for entry execution.
Strategy:
Above Gamma Flip: Market generally stabilizes; dealers buy dips.
Below Gamma Flip: Volatility expands; dealers sell rips.
Below Vol Trigger: "Danger Zone" – expect accelerated selling pressure.
How to Get the Data (The AI Workflow)
Since these numbers change daily, I use Google Gemini to fetch the data and remind me every morning. Here is how you can set up the same automated workflow:
1. The Prompt You can ask Gemini (or your preferred AI) the following prompt manually each morning:
"Find the daily SPY Call Wall, Gamma Flip, Put Support, and Vol Trigger levels for today to input into my TradingView indicator."
2. Automating the Routine I have set up a scheduled daily reminder with Gemini. To do this yourself, simply ask Gemini:
"Can you schedule a daily task to search for these SPY Gamma levels and send them to me every morning at 8:00 AM?"
3. Updating the Chart
Receive the notification from the AI.
Open the Indicator Settings in TradingView.
Type in the new numbers.
The chart updates instantly.
Disclaimer: This tool is for educational purposes only. Gamma levels are estimates based on Open Interest and Dealer Gamma exposure models. Always manage your risk.

VolumeAnlaysis### Volume Analysis (VA) Indicator
**Overview**
The Volume Analysis (VA) indicator is a dynamic overlay tool designed for traders seeking to identify high-volume breakouts, retests, and multi-timeframe volume-driven price cycles. By combining volume spikes with price action and support/resistance boxes, it highlights potential trend continuations, reversals, and cycle shifts. Ideal for intraday and swing trading on stocks, forex, or crypto, it uses a Fibonacci-inspired 1.618 multiplier to detect significant volume surges, then maps them to visual boxes and key levels for actionable insights.
This indicator draws from volume profile concepts but focuses on **breakout confirmation** and **cycle momentum**, helping you spot when "smart money" volume aligns with price extremes. It's particularly useful in volatile markets where volume precedes price moves.
**How It Works**
1. **Volume Break Detection**:
- Identifies a "Volume Break" when the current bar's volume exceeds 1.618x the highest volume from the prior 5 bars. This signals unusual activity, often preceding breakouts.
- A "Volume Retest" triggers exactly 3 bars after a break if volume has been falling steadily over those 3 bars—indicating a pullback for re-accumulation/distribution.
2. **Visual Annotations**:
- **Labels**: Green/red/yellow labels mark Volume Breaks and Retests, positioned above/below the bar based on candle direction for clarity.
- **Demand/Supply Boxes**:
- Blue semi-transparent boxes form around Retest bars, extending rightward to act as dynamic support/resistance.
- Green (bullish) or red (bearish) boxes draw from Volume Breaks, based on the original candle's open/close, highlighting potential zones for continuation.
- Limited to 5 boxes max to avoid chart clutter; older boxes fade as new ones form.
3. **Box Interaction Signals**:
- When price enters a box:
- **Reversal Hints**: Maroon (bearish rejection) or lime (bullish rejection) labels on closes against the trend with opening price momentum.
- **Breakout Arrows**: Up/down arrows on crossovers/crossunders of box tops/bottoms from Retest boxes.
- Scans all active boxes for interactions, prioritizing recent volume events.
4. **Multi-Timeframe Volume Cycles**:
- Aggregates the "Volume Break Max" level (a proxy for key price extremes tied to volume spikes) across timeframes: 1min, 5min, 10min, 30min, and 65min (using `request.security`).
- Computes **MaxVolBreak** (highest extreme) and **MinVolBreak** (lowest extreme) for trend-following levels.
- Tracks **Percent Volume Greater/Less Than Close**: Sums volumes from TFs where price is below/above these levels, creating a momentum ratio.
- **CrossClose**: Plots the prior close where this ratio crosses (gray line), signaling cycle shifts—bullish below MinVolBreak, bearish above MaxVolBreak.
- **Fills**: Red fill above CrossClose/MaxVolBreak (bearish cycle); green below CrossClose/MinVolBreak (bullish cycle).
5. **Plots**:
- Black lines for MaxVolBreak (⏫) and MinVolBreak (⏬).
- Gray 🔄 for CrossClose.
- Colors dynamically adjust (green/red) based on close relative to levels.
**Key Features**
- **Trend vs. Reversal Modes**: Toggle alerts for trend-following breaks (crosses of Max/MinVolBreak) or reversal signals (crosses of CrossClose).
- **Multi-TF Fusion**: Optionally include the chart's native timeframe in Max/Min calculations for finer tuning.
- **Box Management**: Auto-prunes to 5 boxes; focuses on retest/break alignments for "inside bar" logic.
- **Momentum Filters**: Uses rising/falling opens and crossovers for label precision, reducing noise.
- **Customizable**: Simple inputs for alert visibility and timeframe inclusion.
**Settings**
| Input | Default | Description |
|-------|---------|-------------|
| Show Volume Reversal Breaks | False | Enables alerts/labels for CrossClose crosses (cycle reversals). |
| Show Trend Following Breaks | True | Enables alerts for Max/MinVolBreak crosses (trend signals). |
| Use Current Time | False | Includes chart's native TF in multi-TF Max/Min calculations. |
**Alerts**
- **Reversal Alerts** (if enabled): "Volume Reverse Bullish/Bearish Break of " on close crosses of CrossClose.
- **Trend Alerts** (if enabled): "Trend Volume Bullish/Bearish Signal" on close crosses of Max/MinVolBreak; plus notes if prior low/high aligns with levels.
- All alerts include ticker and level value for easy scanning. Use `alert.freq_once_per_bar` to avoid spam.
**Trading Ideas**
- **Bullish Entry**: Green box formation + price holding MinVolBreak + upward arrow on retest box. Target next resistance.
- **Bearish Entry**: Red box + close above MaxVolBreak + red fill activation. Stop below recent low.
- **Cycle Trading**: Watch CrossClose crosses for regime shifts—fade extremes in overextended cycles.
- **Best Timeframes**: 5-30min for intraday; combine with daily for swings. Works best on liquid assets with reliable volume data.
**Limitations & Notes**
- Relies on accurate volume data (e.g., stocks/forex); less effective on low-volume or synthetic instruments.
- Boxes extend rightward but don't auto-delete—monitor for clutter on long histories (max_bars_back=500).
- Some logic (e.g., exact 3-bar retest) is rigid; backtest for your market.
- Open-source under MPL 2.0—fork and tweak as needed!
For questions or enhancements, drop a comment below. Happy trading! 🚀

HM2 - Murrey Math Levels# Murrey Math Indicator - Comprehensive Description
## **What is Murrey Math?**
Murrey Math is a trading system developed by T.H. Murrey that divides price action into 8 equal segments (octaves) based on Gann and geometry principles. It automatically identifies key support and resistance levels where price is likely to react, making it a powerful tool for determining entry/exit points and price targets.
## **How It Works**
The indicator:
1. **Analyzes price history** over a lookback period (default 64-200 bars)
2. **Finds the highest high and lowest low** in that period
3. **Calculates a "fractal"** - a geometric scaling factor based on price magnitude
4. **Creates 8 equal divisions** between key levels, plus 4 overshoot levels (total 13 levels)
5. **Labels each level** from -2/8 to +2/8 with their trading significance
## **The 13 Murrey Math Levels**
### **Core Levels (0/8 to 8/8):**
- ** - Ultimate Support** (Blue)
- Extreme oversold condition
- Strong buying opportunity
- Price rarely breaks below this
- ** - Weak, Stall & Reverse** (Orange)
- Weak support level
- Price often stalls and reverses here
- ** - Pivot/Reverse Level** (Red)
- Major support that can become resistance
- Important reversal zone
- ** - Bottom of Trading Range - BUY Zone** (Green)
- Bottom boundary of normal trading
- **Premium BUY zone** - 40% of trading happens between 3/8 and 5/8
- ** - Major Support/Resistance** (Blue)
- **THE MOST IMPORTANT LEVEL**
- The midpoint - best entry/exit level
- Strong pivot point that price respects
- ** - Top of Trading Range - SELL Zone** (Green)
- Top boundary of normal trading
- **Premium SELL zone**
- ** - Pivot/Reverse Level** (Red)
- Major resistance that can become support
- Important reversal zone
- ** - Weak, Stall & Reverse** (Orange)
- Weak resistance level
- Price often stalls and reverses here
- ** - Ultimate Resistance** (Blue)
- Extreme overbought condition
- Strong selling opportunity
- Price rarely breaks above this
### **Overshoot Levels:**
- ** & ** (Gray) - Extreme downside overshoot zones
- ** & ** (Gray) - Extreme upside overshoot zones
- These indicate extreme moves beyond normal trading ranges
## **Trading Zones (from your diagram)**
1. **Consolidation Trading Area** (0/8 to 3/8)
- Price is in a bearish zone
- Look for BUY opportunities near support levels
2. **Normal Trading Area** (3/8 to 5/8)
- **40% of trading occurs here**
- Price oscillates between these boundaries
- Range-bound trading strategies work best
3. **Premium Trading Area** (5/8 to 8/8)
- Price is in a bullish zone
- Look for SELL opportunities near resistance levels
## **Trading Strategies**
### **Buy Signals:**
- Price bounces off 0/8 (ultimate support)
- Price pulls back to 3/8 in an uptrend
- Price breaks above 4/8 after consolidation
### **Sell Signals:**
- Price rejects at 8/8 (ultimate resistance)
- Price rallies to 5/8 in a downtrend
- Price breaks below 4/8 after consolidation
### **Range Trading:**
- Buy near 3/8, sell near 5/8 when price is ranging
- Use 4/8 as the pivot to determine trend direction
## **Key Advantages**
✅ **Objective levels** - No subjective placement
✅ **Self-adjusting** - Automatically recalculates based on recent price action
✅ **Clear trading zones** - Easy to identify support/resistance
✅ **Works on all timeframes** - From 1-minute to monthly charts
✅ **Combines with other indicators** - Works well with RSI, MACD, etc.
## **Important Notes**
- The indicator is **dynamic** - levels update as new highs/lows form
- **4/8 is the most critical level** - price above = bullish, below = bearish
- When price reaches overshoot levels (±1/8, ±2/8), expect strong reversals
- Works best in trending markets; can give false signals in choppy conditions
This geometric approach to support/resistance has been used by traders for decades and remains popular due to its objective, mathematical nature!

Round Number Analyzer v3Round Number Analyzer v3 is an indicator designed to analyze how price interacts with round number levels (levels spaced at fixed intervals in points or pips).
The indicator does not generate entry/exit signals, but provides detailed statistics to better understand market dynamics around these key levels.
✨ Key Features
Cross Counting: detects every time the price crosses a round number level (up = Long, down = Short).
Continuations & Reversals: classifies each cross as:
Continuation: the move continues in the same direction as the previous sequence.
Reversal: the move changes direction compared to the previous sequence.
Sequence Classification (L1…L5+): each level is labelled based on its position within the consecutive cross sequence:
L1 = first level of the sequence,
L2 = second consecutive,
…
L5+ = fifth or higher.
Comprehensive Stats Table (top right corner):
Total crosses (Long, Short, Totals).
Total continuations + breakdown by L1…L5+.
Total reversals + breakdown by L1…L5+.
Percentages calculated against the proper denominator, displayed directly inside the cells next to the absolute values.
Date range of analysis (user-defined).
Customizable Step: Works in both points and pips, making the indicator suitable for indices and forex.
⚙️ Main Inputs
Start date / End date → sets the analysis period.
Step mode → Points or Pips.
Step value → distance between round levels.
Pip size → pip size (default = 0.0001, typical for forex).
📈 How to Interpret
A high continuation percentage after L1–L2 suggests the market tends to extend multiple times beyond the first breakout levels.
Higher reversal percentages at advanced levels (L4–L5+) may signal trend exhaustion.
The analysis helps estimate the probability of continuation or reversal depending on how many consecutive levels have already been crossed.
🔎 Practical Applications
Support for breakout or mean-reversion strategies.
Comparative analysis across different markets (e.g. indices vs forex) or different time periods.
📝 Notes
The indicator is timeframe-robust, as it accounts for multiple steps within the same candle, ensuring results do not depend on the selected timeframe (except for TradingView’s historical data limits).
It does not provide automatic trading signals, but serves as a quantitative analysis tool to refine your strategies.
---
Round Number Analyzer v3 è un indicatore pensato per analizzare come il prezzo interagisce con i livelli di round number (livelli a distanza fissa in punti o pips).
L’indicatore non genera segnali di ingresso/uscita, ma fornisce statistiche dettagliate utili per comprendere la dinamica del mercato attorno a questi livelli.
✨ Funzionalità principali
Conteggio dei Cross: rileva ogni volta che il prezzo attraversa un livello round (verso l’alto = Long, verso il basso = Short).
Continuations & Reversals: classifica ogni attraversamento come:
Continuation: il movimento prosegue nella stessa direzione della sequenza precedente.
Reversal: il movimento inverte la direzione rispetto alla sequenza precedente.
Classificazione per sequenza (L1…L5+): ogni livello è etichettato in base alla sua posizione nella sequenza di cross consecutivi:
L1 = primo livello della sequenza,
L2 = secondo consecutivo,
…
L5+ = quinto o superiore.
Statistiche complete in tabella (in alto a destra):
Cross totali (Long, Short, Totals).
Continuations totali + breakdown per L1…L5+.
Reversals totali + breakdown per L1…L5+.
Percentuali calcolate sul denominatore corretto, mostrate direttamente dentro le celle accanto ai valori assoluti.
Date range di analisi (impostabile dall’utente).
Step personalizzabile: puoi lavorare sia in punti che in pips, così l’indicatore è adatto sia per indici che per forex.
⚙️ Input principali
Start date / End date → imposta l’intervallo temporale di analisi.
Step mode → punti o pips.
Step value → ampiezza tra i livelli round.
Pip size → dimensione del pip (default = 0.0001, tipico per il forex).
📈 Come interpretarlo
Una percentuale di continuation molto alta dopo L1–L2 indica che il mercato tende a proseguire più volte oltre i primi livelli di breakout.
Percentuali di reversal più elevate nei livelli avanzati (L4–L5+) possono suggerire esaurimento della spinta.
L’analisi permette di stimare la probabilità che un movimento in corso continui o si inverta in base a quanti livelli sono già stati attraversati consecutivamente.
🔎 Applicazioni pratiche
Supporto per strategie di breakout o mean reversion.
Analisi comparativa tra mercati (es. indici vs forex) o tra periodi temporali diversi.
📝 Note
L’indicatore è timeframe-robust: il conteggio tiene conto di multipli step dentro la stessa candela, così i risultati non dipendono dal timeframe scelto (salvo i limiti di caricamento storico di TradingView).
Non fornisce segnali operativi automatici, ma è un tool di analisi quantitativa per affinare le proprie strategie.

Contrarian Period High & LowContrarian Period High & Low
This indicator pairs nicely with the Contrarian 100 MA and can be located here:
Overview
The "Contrarian Period High & Low" indicator is a powerful technical analysis tool designed for traders seeking to identify key support and resistance levels and capitalize on contrarian trading opportunities. By tracking the highest highs and lowest lows over user-defined periods (Daily, Weekly, or Monthly), this indicator plots historical levels and generates buy and sell signals when price breaks these levels in a contrarian manner. A unique blue dot counter and action table enhance decision-making, making it ideal for swing traders, trend followers, and those trading forex, stocks, or cryptocurrencies. Optimized for daily charts, it can be adapted to other timeframes with proper testing.
How It Works
The indicator identifies the highest high and lowest low within a specified period (e.g., daily, weekly, or monthly) and draws horizontal lines for the previous period’s extremes on the chart. These levels act as dynamic support and resistance zones. Contrarian signals are generated when the price crosses below the previous period’s low (buy signal) or above the previous period’s high (sell signal), indicating potential reversals. A blue dot counter tracks consecutive buy signals, and a table displays the count and recommended action, helping traders decide whether to hold or flip positions.
Key Components
Period High/Low Levels: Tracks the highest high and lowest low for each period, plotting red lines for highs and green lines for lows from the bar where they occurred, extending for a user-defined length (default: 200 bars).
Contrarian Signals: Generates buy signals (blue circles) when price crosses below the previous period’s low and sell signals (white circles) when price crosses above the previous period’s high, designed to capture potential reversals.
Blue Dot Tracker: Counts consecutive buy signals (“blue dots”). If three or more occur, it suggests a stronger trend, with the table recommending whether to “Hold Investment” or “Flip Investment.”
Action Table: A 2x2 table in the bottom-right corner displays the blue dot count and action (“Hold Investment” if count ≥ 4, else “Flip Investment”) for quick reference.
Mathematical Concepts
Period Detection: Uses an approximate bar count to define periods (1 bar for Daily, 5 bars for Weekly, 20 bars for Monthly on a daily chart). When a new period starts, the previous period’s high/low is finalized and plotted.
High/Low Tracking:
Highest high (periodHigh) and lowest low (periodLow) are updated within the period.
Lines are drawn at these levels when the period ends, starting from the bar where the extreme occurred (periodHighBar, periodLowBar).
Signal Logic:
Buy signal: ta.crossunder(close , prevPeriodLow) and not lowBroken and barstate.isconfirmed
Sell signal: ta.crossover(close , prevPeriodHigh) and not highBroken and barstate.isconfirmed
Flags (highBroken, lowBroken) prevent multiple signals for the same level within a period.
Blue Dot Counter: Increments on each buy signal, resets on a sell signal or if price exceeds the entry price after three or more buy signals.
Entry and Exit Rules
Buy Signal (Blue Circle): Triggered when the price crosses below the previous period’s low, suggesting a potential oversold condition and buying opportunity. The signal appears as a blue circle below the price bar.
Sell Signal (White Circle): Triggered when the price crosses above the previous period’s high, indicating a potential overbought condition and selling opportunity. The signal appears as a white circle above the price bar.
Blue Dot Tracker:
Increments blueDotCount on each buy signal and sets an entryPrice on the first buy.
Resets on a sell signal or if price exceeds entryPrice after three or more buy signals.
If blueDotCount >= 3, the table suggests holding; if >= 4, it reinforces “Hold Investment.”
Exit Rules: Exit a buy position on a sell signal or when price exceeds the entry price after three or more buy signals. Combine with other tools (e.g., trendlines, support/resistance) for additional confirmation. Always apply proper risk management.
Recommended Usage
The "Contrarian Period High & Low" indicator is optimized for daily charts but can be adapted to other timeframes (e.g., 1H, 4H) with adjustments to the period bar count. It excels in markets with clear support/resistance levels and potential reversal zones. Traders should:
Backtest the indicator on their chosen asset and timeframe to validate signal reliability.
Combine with other technical tools (e.g., moving averages, Fibonacci levels) for stronger trade confirmation.
Adjust barsPerPeriod (e.g., ~120 bars for Weekly on hourly charts) based on the chart timeframe and market volatility.
Monitor the action table to guide position management based on blue dot counts.
Customization Options
Period Type: Choose between Daily, Weekly, or Monthly periods (default: Monthly).
Line Length: Set the length of high/low lines in bars (default: 200).
Show Highs/Lows: Toggle visibility of period high (red) and low (green) lines.
Max Lines to Keep: Limit the number of historical lines displayed (default: 10).
Hide Signals: Toggle buy/sell signal visibility for a cleaner chart.
Table Display: A fixed table in the bottom-right corner shows the blue dot count and action, with yellow (Hold) or green (Flip) backgrounds based on the count.
Why Use This Indicator?
The "Contrarian Period High & Low" indicator offers a unique blend of support/resistance visualization and contrarian signal generation, making it a versatile tool for identifying potential reversals. Its clear visual cues (lines and signals), blue dot tracker, and actionable table provide traders with an intuitive way to monitor market structure and manage trades. Whether you’re a beginner or an experienced trader, this indicator enhances your ability to spot key levels and time entries/exits effectively.
Tips for Users
Test the indicator thoroughly on your chosen market and timeframe to optimize settings (e.g., adjust barsPerPeriod for non-daily charts).
Use in conjunction with price action or other indicators for stronger trade setups.
Monitor the action table to decide whether to hold or flip positions based on blue dot counts.
Ensure your chart timeframe aligns with the selected period type (e.g., daily chart for Monthly periods).
Apply strict risk management to protect against false breakouts.
Happy trading with the Contrarian Period High & Low indicator! Share your feedback and strategies in the TradingView community!

MTF Candles [Fadi x MMT]MTF Candles
Overview
The MTF Candles indicator is a powerful tool designed for traders who want to visualize higher timeframe (HTF) candles directly on their current chart. Built with flexibility and precision in mind, this Pine Script indicator displays up to six higher timeframe candles, complete with customizable styling, sweeps, midpoints, fair value gaps (FVGs), volume imbalances, and trace lines. It’s perfect for multi-timeframe analysis, helping traders identify key levels, market structure, and potential trading opportunities with ease.
Key Features
- Multi-Timeframe Candles : Display up to six higher timeframe candles (e.g., 5m, 15m, 30m, 4H, 1D, 1W) on your chart, with configurable timeframes and visibility.
- Sweeps Detection : Identify liquidity sweeps (highs/lows) with customizable line styles, widths, and colors, plus optional alerts for confirmed bullish or bearish sweeps.
- Midpoint Lines : Plot the midpoint (average of high and low) of the previous HTF candle, with customizable color, width, and style for enhanced market analysis.
- Fair Value Gaps (FVGs) : Highlight gaps between non-adjacent candles, indicating potential areas of interest for price action.
- Volume Imbalances : Detect and display volume imbalances between adjacent candles, aiding in spotting significant price levels.
- Trace Lines : Connect HTF candle open, close, high, and low prices to their respective chart bars, with customizable styles and optional price labels.
- Custom Daily Open Times : Support for custom daily candle open times (Midnight, 8:30, or 9:30) to align with specific market sessions.
- Dynamic Labels : Show timeframe names, remaining time until the next HTF candle, and interval labels (e.g., day of the week for daily candles) with adjustable positions and sizes.
- Highly Customizable : Fine-tune candle appearance, spacing, padding, and visual elements to suit your trading style.
How It Works
The indicator renders HTF candles as boxes (bodies) and lines (wicks) on the right side of the chart, with each timeframe offset for clarity. It dynamically updates candles in real-time, tracks their highs and lows, and displays sweeps and midpoints when conditions are met. FVGs and volume imbalances are calculated based on candle relationships, and trace lines link HTF candle levels to their originating bars on the chart.
Sweep Logic
- A bearish sweep occurs when the current candle’s high exceeds the previous candle’s high, but the close is below it.
- A bullish sweep occurs when the current candle’s low falls below the previous candle’s low, but the close is above it.
- Sweeps are visualized as horizontal lines and can trigger alerts when confirmed on the next candle.
Midpoint Logic
- A midpoint line is drawn at the average of the previous HTF candle’s high and low, extending until the next HTF candle forms.
- Useful for identifying potential support/resistance or mean reversion levels.
Imbalance Detection
- FVGs : Identified when a candle’s low is above the next-but-one candle’s high (or vice versa), indicating a price gap.
- Volume Imbalances : Detected between adjacent candles where the body of one candle doesn’t overlap with the next, signaling potential liquidity zones.
Settings
Timeframe Settings
- HTF 1–6 : Enable/disable up to six higher timeframes (default: 5m, 15m, 30m, 4H, 1D, 1W) and set the maximum number of candles to display per timeframe (default: 4).
- Limit to Next HTFs : Restrict the number of active timeframes (1–6).
Styling
- Body, Border, Wick Colors : Customize bull and bear candle colors (default: light gray for bulls, dark gray for bears).
- Candle Width : Adjust the width of HTF candles (1–4).
- Padding and Spacing : Set the offset from the current price action and spacing between candles and timeframes.
Label Settings
- HTF Label : Show/hide timeframe labels (e.g., "15m", "4H") at the top/bottom of candle sets.
- Remaining Time : Display the countdown to the next HTF candle.
Interval Value: Show day of the week for daily candles or time for intraday candles.
- Label Position/Alignment : Choose to display labels at the top, bottom, or both, and align them with the highest/lowest candles or follow individual candle sets.
Imbalance Settings
- Fair Value Gap : Enable/disable FVGs with customizable color (default: semi-transparent gray).
- Volume Imbalance : Enable/disable volume imbalances with customizable color (default: semi-transparent red).
Trace Settings
- Trace Lines : Enable/disable lines connecting HTF candle levels to their chart bars, with customizable colors, styles (solid, dashed, dotted), and sizes.
- Price Labels : Show price levels for open, close, high, and low trace lines.
- Anchor : Choose whether trace lines anchor to the first or last enabled timeframe.
Sweep Settings
- Show Sweeps : Enable/disable sweep detection and visualization.
- Sweep Line : Customize color, width, and style (solid, dashed, dotted).
- Sweep Alert : Enable alerts for confirmed sweeps.
Midpoint Settings
- Show Midpoint : Enable/disable midpoint lines.
- Midpoint Line : Customize color (default: orange), width, and style (solid, dashed, dotted).
Custom Daily Open
Custom Daily Candle Open : Choose between Midnight, 8:30, or 9:30 (America/New_York) for daily candle opens.
Usage
- Add the indicator to your TradingView chart.
- Configure the desired higher timeframes (HTF 1–6) and enable/disable features via the settings panel.
- Adjust styling, labels, and spacing to match your chart preferences.
Use sweeps, midpoints, FVGs, and volume imbalances to identify key levels for trading decisions.
- Enable sweep alerts to receive notifications for confirmed liquidity sweeps.
Notes
Performance: The indicator is optimized for up to 500 boxes, lines, and labels, with a maximum of 5000 bars back. Can be slow at a time
Time Zone: Custom daily opens use the America/New_York time zone for consistency with major financial markets.
Compatibility: Ensure selected HTFs are valid (higher than the chart’s timeframe and divisible by it for intraday periods).

TPO[Fixed Range, Anchored, Bars Back]TPO Bars Back, Fixed Range and Anchored
Overview
The TPO Profile (Time Price Opportunity Profile) is a powerful market profile indicator that displays the amount of time price spent at different levels during a specified period. Unlike traditional volume profile indicators that show volume distribution, TPO Profile shows time distribution , providing insights into where price has spent the most time and identifying key support and resistance levels.
Key Advantages Over TradingView's Built-in TPO
Simplified Composite Creation : Automatically creates TPO profiles for any time range without manual split/merge operations
Instant Value Area Calculation : Immediately shows Value Area, POC, VAH, and VAL for your selected period
No Manual Assembly Required : TradingView's native TPO requires you to manually split sessions and merge them to create composites - this indicator does it automatically
Flexible Time Ranges : Create composites for any custom time period (multiple days, weeks, specific events) with a few clicks
Real-time Composite Updates : Anchor mode creates live composites that update as new data arrives
Multiple Composite Analysis : Easily compare different time periods without the tedious manual process
Key Features
Core Functionality
Time-Based Analysis : Shows time spent at each price level rather than volume
Configurable Time Blocks : Use any timeframe for TPO counting (30min, 1H, 4H, etc.)
Multiple Price Levels : Adjustable from 5 to 200 levels for granular analysis
Point of Control (POC) : Automatically identifies the price level with highest time activity
Value Area Calculation : Shows the price range containing 70% (configurable) of time activity
Automatic Composite Generation : Creates multi-session composites without manual intervention
Three Operating Modes
1. Bars Back Mode
Analyzes the last N bars from the current bar
Perfect for recent market activity analysis
Range: 10-500 bars
Use Case : Intraday analysis, recent session review
2. Fixed Range Mode
Analyzes a specific time period between start and end times
Ideal for historical analysis of specific events
Creates perfect composites for multi-day periods
Use Case : Earnings periods, news events, specific trading sessions, weekly/monthly composites
3. Anchor Mode (NEW)
Starts from a specific time and extends to the current bar
Dynamically updates as new bars form
Perfect for building live composites from any starting point
Use Case : Live session monitoring, event-based analysis from a specific point, growing composites
Visual Elements
TPO Bars
Horizontal bars showing time distribution at each price level
Longer bars = more time spent at that level
Color-coded to distinguish Value Area from outlying levels
Point of Control (POC)
Red line marking the price level with highest time activity
Most significant support/resistance level
Configurable line style (Solid/Dashed/Dotted) and width
Value Area High/Low (VAH/VAL)
Green and Orange lines marking the boundaries of the Value Area
Shows the price range containing the specified percentage of time activity
Optional display with customizable line styles
Single Print Detection
Identifies price levels touched by only one time block
Display options: Lines or Boxes
Purple color highlighting these significant levels
Often act as strong support/resistance in future trading
Customization Options
Time Block Configuration
Block Time : Choose timeframe for TPO counting (30min, 1H, 4H, etc.)
Allows analysis at different time granularities
Higher timeframes = broader perspective, Lower timeframes = finer detail
Visual Styling
Line Styles : Solid, Dashed, or Dotted for all line elements
Line Widths : 1-5 pixels for POC, VAH, and VAL lines
Colors : Fully customizable colors for all elements
Transparency : Adjustable transparency for better chart readability
Label Management
Show/Hide Labels : Toggle POC, VAH, VAL labels
Font Sizes : Tiny, Small, Normal, Large, Huge
Label Positioning : 8 different position options relative to lines
Offset Controls : Fine-tune label positioning
Line Extension
Level Offset Right : Controls how far lines extend
Smart extension logic:
Value ≤ 0: Infinite extension (extend.right)
Value ≥ 1: Extends exactly N bars ahead
Trading Applications
Support & Resistance
POC often acts as strong support/resistance
Value Area boundaries provide key levels
Single prints frequently become significant levels
Market Structure Analysis
Identify areas of price acceptance (thick TPO bars)
Spot areas of price rejection (thin TPO bars)
Understand where market participants are comfortable trading
Composite Profile Analysis
Create multi-day, weekly, or monthly composites instantly
Compare different composite periods without manual work
Analyze longer-term price acceptance levels
Build composites around specific events or announcements
Session Analysis
Monitor intraday session development in real-time
Compare different sessions (London, New York, Asia)
Track how profiles change throughout the trading day
Build live composites across multiple sessions
Event Analysis
Use Fixed Range mode for earnings, news events
Use Anchor mode to track price development from specific events
Compare pre/post event price acceptance levels
Create event-based composites automatically
Input Parameters
Mode Selection
Mode : Bars Back | Fixed Range | Anchor
Bars Back : Number of bars to analyze (10-500)
Start Time : Beginning time for Fixed Range and Anchor modes
End Time : Ending time for Fixed Range mode only
Analysis Configuration
Block Time : Timeframe for TPO blocks (e.g., "30" for 30-minute blocks)
TPO Levels : Number of price levels (5-200)
Value Area % : Percentage for Value Area calculation (50-95%)
Display Options
Show POC : Display Point of Control line
Show Value Area : Display Value Area box
Show VAH/VAL Lines : Display Value Area boundary lines
Show Single Prints : Display single print detection
Single Print Style : Lines or Boxes
Styling Controls
Colors : TPO, POC, Value Area, VAH, VAL, Single Print colors
Line Styles : POC, VAH, VAL line styles
Line Widths : POC, VAH, VAL line widths
Labels : Show/hide, font size, position, offset controls
Technical Details
Calculation Method
Divides the price range into equal levels based on TPO Levels setting
For each time block, determines which price levels it crosses
Adds +1 count to each crossed level
Identifies POC as the level with highest count
Calculates Value Area by expanding from POC until target percentage is reached
Performance Considerations
Historical data limited to prevent buffer overflow errors
Smart bounds checking for different timeframes
Optimized cleanup routines to prevent drawing object accumulation
Pine Script Version
Built on Pine Script v6
Uses modern Pine Script best practices
Efficient array handling and drawing object management
Best Practices
Timeframe Selection
Block Time = Chart Timeframe : Traditional TPO approach
Block Time > Chart Timeframe : Smoother, broader perspective
Block Time < Chart Timeframe : More granular, detailed analysis
Level Count Guidelines
Low levels (10-20) : Better for swing trading, major levels
High levels (50-100) : Better for scalping, precise entries
Very high levels (100+) : For very detailed analysis
Mode Selection
Bars Back : Daily analysis, recent activity
Fixed Range : Historical events, specific periods, manual composites
Anchor : Live monitoring, event-based analysis, growing composites
Composite Creation Workflow
Select Fixed Range or Anchor mode
Set your desired start time (and end time for Fixed Range)
Adjust TPO Levels for desired granularity
Enable VAH/VAL lines to see Value Area boundaries
The composite profile generates automatically with all key levels
This indicator eliminates the tedious manual process of creating composite TPO profiles in TradingView. Instead of splitting sessions and manually merging them, you get instant composite analysis with automatic Value Area calculation, POC identification, and single print detection. The combination of time-based analysis, multiple operating modes, and extensive customization options makes it a powerful tool for understanding market structure and price acceptance levels across any time period.

Support and Resistance MTFSupport and Resistance MTF
Support and Resistance MTF is a powerful tool that automatically detects and visualizes key support and resistance levels based on pivot highs and lows, using a higher timeframe of your choice. It is designed for traders who focus on price action and market structure, and want an adaptive, clean, and customizable indicator that helps identify important market zones.
The script uses configurable pivot logic to identify levels, with user-defined parameters for pivot strength and timeframe. Once a support or resistance level is detected, it is displayed on the chart either as a horizontal line, a shaded box, or both, depending on your display settings. You can fully customize the visual appearance including color, transparency, and line thickness. Levels are automatically extended into the future, and optionally into the past, to give better context.
Each level is monitored for breakout behavior. If price breaks through a level, it can change its role — a former resistance may become support, and vice versa. After a certain number of breakouts (which you define), the level is considered invalid and is automatically removed from the chart. This helps to maintain a clean visual layout and ensures only relevant levels are shown.
The indicator supports multi-timeframe analysis, allowing you to overlay higher-timeframe structure directly on your lower-timeframe trading chart. It is also compatible with Heikin Ashi candles internally for reference, without affecting your main chart type.
Support and Resistance MTF is ideal for traders looking to align intraday setups with higher-timeframe zones, manage risk around structural levels, or simply highlight market turning points in a clear and automated way. Built with Pine Script v5 and optimized for performance, it is both powerful and lightweight.
⚙️ Input Parameters – Description
[Time-Frame
Defines the higher timeframe used for detecting support and resistance levels. For example, you can set this to 1h, 4h, or D to visualize significant levels from a broader market perspective on a lower-timeframe chart.
Left / Right (Pivot Left / Pivot Right)
These parameters control the sensitivity of the pivot detection. A pivot high/low is confirmed if it is higher/lower than the defined number of candles to its left and right. Higher values reduce noise but may miss smaller turning points.
Extend Left
When enabled, the drawn levels (lines and/or boxes) are extended to the left side of the chart, allowing you to see the historical alignment of these levels.
Max Breaks Before Delete
Defines how many times a level can be broken by price before it is removed from the chart. This helps to avoid clutter from outdated or invalidated levels and keeps your chart relevant to current price action.
Draw Lines Only
If enabled, the indicator will draw only horizontal lines for support and resistance zones, omitting the colored background boxes. Useful for a cleaner chart appearance.
Line Width Broken Level
Sets the thickness of the support/resistance lines. Thicker lines can emphasize key levels, especially after a breakout.
Transparency Boxes
Controls the transparency (0–100) of the background boxes representing the zones. A higher value makes the boxes more transparent, lower values make them more opaque.
Transparency Lines
Controls the transparency (0–100) of the horizontal support and resistance lines. This allows for visual fine-tuning based on chart background and personal preference.
Support (Color, Group: Display)
Lets you choose the color used for support zones and lines. By default, it's green, but you can change it to fit your theme or visual preference.
Resistance (Color, Group: Display)
Defines the color for resistance zones and lines. The default is red, but it can be customized freely.

Super Arma Institucional PRO v6.3Super Arma Institucional PRO v6.3
Description
Super Arma Institucional PRO v6.3 is a multifunctional indicator designed for traders looking for a clear and objective analysis of the market, focusing on trends, key price levels and high liquidity zones. It combines three essential elements: moving averages (EMA 20, SMA 50, EMA 200), dynamic support and resistance, and volume-based liquidity zones. This integration offers an institutional view of the market, ideal for identifying strategic entry and exit points.
How it Works
Moving Averages:
EMA 20 (orange): Sensitive to short-term movements, ideal for capturing fast trends.
SMA 50 (blue): Represents the medium-term trend, smoothing out fluctuations.
EMA 200 (red): Indicates the long-term trend, used as a reference for the general market bias.
Support and Resistance: Calculated based on the highest and lowest prices over a defined period (default: 20 bars). These dynamic levels help identify zones where the price may encounter barriers or supports.
Liquidity Zones: Purple rectangles are drawn in areas of significantly above-average volume, indicating regions where large market participants (institutional) may be active. These zones are useful for anticipating price movements or order absorption.
Purpose
The indicator was developed to provide a clean and institutional view of the market, combining classic tools (moving averages and support/resistance) with modern liquidity analysis. It is ideal for traders operating swing trading or position trading strategies, allowing to identify:
Short, medium and long-term trends.
Key support and resistance levels to plan entries and exits.
High liquidity zones where institutional orders can influence the price.
Settings
Show EMA 20 (true): Enables/disables the 20-period EMA.
Show SMA 50 (true): Enables/disables the 50-period SMA.
Show EMA 200 (true): Enables/disables the 200-period EMA.
Support/Resistance Period (20): Sets the period for calculating support and resistance levels.
Liquidity Sensitivity (20): Period for calculating the average volume.
Minimum Liquidity Factor (1.5): Multiplier of the average volume to identify high liquidity zones.
How to Use
Moving Averages:
Crossovers between the EMA 20 and SMA 50 may indicate short/medium-term trend changes.
The EMA 200 serves as a reference for the long-term bias (above = bullish, below = bearish).
Support and Resistance: Use the red (resistance) and green (support) lines to identify reversal or consolidation zones.
Liquidity Zones: The purple rectangles highlight areas of high volume, where the price may react (reversal or breakout). Consider these zones to place orders or manage risks.
Adjust the parameters according to the asset and timeframe to optimize the analysis.
Notes
The chart should be configured only with this indicator to ensure clarity.
Use on timeframes such as 1 hour, 4 hours or daily for better visualization of liquidity zones and support/resistance levels.
Avoid adding other indicators to the chart to keep the script output easily identifiable.
The indicator is designed to be clean, without explicit buy/sell signals, following an institutional approach.
This indicator is perfect for traders who want a visually clear and powerful tool to trade based on trends, key levels and institutional behavior.

AMD Liquidity Sweep with AlertsAMD Liquidity Sweep with Alerts
Identify key liquidity levels from the Asian trading session with visual markers and alerts.
📌 Key Features:
Asia Session Detection
Customizable start/end hours (0-23) to match your trading timezone
Automatically calculates session high/low
Smart Swing Level Identification
Finds the closest significant swing high ≥ Asia high
Finds the closest significant swing low ≤ Asia low
Adjustable pivot sensitivity (# of left/right bars)
Professional Visuals
Dashed reference lines extending into the future
Blue-highlighted key levels
Clean label formatting with precise price levels
Trading Alerts
Price-cross alerts for liquidity breaks
Visual markers (triangles) when levels are breached
Separate alerts for buy-side/sell-side liquidity
Customization Options
Toggle intermediate swing highlights
Adjust label sizes
💡 Trading Applications:
Institutional Levels: Identify zones where Asian session liquidity pools exist
Breakout Trading: Get alerted when price breaches Asian session ranges
S/R Flip Zones: Watch how price reacts at these key reference levels
London/NY Open: Use Asian levels for early European session trades
🔧 How to Use:
Set your preferred Asia session hours
Adjust pivot sensitivity (default 1 bar works for most timeframes)
Enable alerts for breakouts if desired
Watch for reactions at the plotted levels

PowerHouse SwiftEdge AI v2.10 StrategyOverview
The PowerHouse SwiftEdge AI v2.10 Strategy is a sophisticated trading system designed to identify high-probability trade setups in forex, stocks, and cryptocurrencies. By combining multi-timeframe trend analysis, momentum signals, volume confirmation, and smart money concepts (Change of Character and Break of Structure ), this strategy offers traders a robust tool to capitalize on market trends while minimizing false signals. The strategy’s unique “AI” component analyzes trends across multiple timeframes to provide a clear, actionable dashboard, making it accessible for both novice and experienced traders. The strategy is fully customizable, allowing users to tailor its filters to their trading style.
What It Does
This strategy generates Buy and Sell signals based on a confluence of technical indicators and smart money concepts. It uses:
Multi-Timeframe Trend Analysis: Confirms the market’s direction by analyzing trends on the 1-hour (60M), 4-hour (240M), and daily (D) timeframes.
Momentum Filter: Ensures trades align with strong price movements to avoid choppy markets.
Volume Filter: Validates signals with above-average volume to confirm market participation.
Breakout Filter: Requires price to break key levels for added confirmation.
Smart Money Signals (CHoCH/BOS): Identifies reversals (CHoCH) and trend continuations (BOS) based on pivot points.
AI Trend Dashboard: Summarizes trend strength, confidence, and predictions across timeframes, helping traders make informed decisions without needing to analyze complex data manually.
The strategy also plots dynamic support and resistance trendlines, take-profit (TP) levels, and “Get Ready” signals to alert users of potential setups before they fully develop. Trades are executed with predefined take-profit and stop-loss levels for disciplined risk management.
How It Works
The strategy integrates multiple components to create a cohesive trading system:
Multi-Timeframe Trend Analysis:
The strategy evaluates trends on three timeframes (1H, 4H, Daily) using Exponential Moving Averages (EMA) and Volume-Weighted Average Price (VWAP). A trend is considered bullish if the price is above both the EMA and VWAP, bearish if below, or neutral otherwise.
Signals are only generated when the trend on the user-selected higher timeframe aligns with the trade direction (e.g., Buy signals require a bullish higher timeframe trend). This reduces noise and ensures trades follow the broader market context.
Momentum Filter:
Measures the percentage price change between consecutive bars and compares it to a volatility-adjusted threshold (based on the Average True Range ). This ensures trades are taken only during significant price movements, filtering out low-momentum conditions.
Volume Filter (Optional):
Checks if the current volume exceeds a long-term average and shows positive short-term volume change. This confirms strong market participation, reducing the risk of false breakouts.
Breakout Filter (Optional):
Requires the price to break above (for Buy) or below (for Sell) recent highs/lows, ensuring the signal aligns with a structural shift in the market.
Smart Money Concepts (CHoCH/BOS):
Change of Character (CHoCH): Detects potential reversals when the price crosses under a recent pivot high (for Sell) or over a recent pivot low (for Buy) with a bearish or bullish candle, respectively.
Break of Structure (BOS): Confirms trend continuations when the price breaks below a recent pivot low (for Sell) or above a recent pivot high (for Buy) with strong momentum.
These signals are plotted as horizontal lines with labels, making it easy to visualize key levels.
AI Trend Dashboard:
Combines trend direction, momentum, and volatility (ATR) across timeframes to calculate a trend score. Scores above 0.5 indicate an “Up” trend, below -0.5 indicate a “Down” trend, and otherwise “Neutral.”
Displays a table summarizing trend strength (as a percentage), AI confidence (based on trend alignment), and Cumulative Volume Delta (CVD) for market context.
A second table (optional) shows trend predictions for 1H, 4H, and Daily timeframes, helping traders anticipate future market direction.
Dynamic Trendlines:
Plots support and resistance lines based on recent swing lows and highs within user-defined periods (shortTrendPeriod, longTrendPeriod). These lines adapt to market conditions and are colored based on trend strength.
Why This Combination?
The PowerHouse SwiftEdge AI v2.10 Strategy is original because it seamlessly integrates traditional technical analysis (EMA, VWAP, ATR, volume) with smart money concepts (CHoCH, BOS) and a proprietary AI-driven trend analysis. Unlike standalone indicators, this strategy:
Reduces False Signals: By requiring confluence across trend, momentum, volume, and breakout filters, it minimizes trades in choppy or low-conviction markets.
Adapts to Market Context: The ATR-based momentum threshold adjusts dynamically to volatility, ensuring signals remain relevant in both trending and ranging markets.
Simplifies Decision-Making: The AI dashboard distills complex multi-timeframe data into a user-friendly table, eliminating the need for manual analysis.
Leverages Smart Money: CHoCH and BOS signals capture institutional price action patterns, giving traders an edge in identifying reversals and continuations.
The combination of these components creates a balanced system that aligns short-term trade entries with longer-term market trends, offering a unique blend of precision, adaptability, and clarity.
How to Use
Add to Chart:
Apply the strategy to your TradingView chart on a liquid symbol (e.g., EURUSD, BTCUSD, AAPL) with a timeframe of 60 minutes or lower (e.g., 15M, 60M).
Configure Inputs:
Pivot Length: Adjust the number of bars (default: 5) to detect pivot highs/lows for CHoCH/BOS signals. Higher values reduce noise but may delay signals.
Momentum Threshold: Set the base percentage (default: 0.01%) for momentum confirmation. Increase for stricter signals.
Take Profit/Stop Loss: Define TP and SL in points (default: 10 each) for risk management.
Higher/Lower Timeframe: Choose timeframes (60M, 240M, D) for trend filtering. Ensure the chart timeframe is lower than or equal to the higher timeframe.
Filters: Enable/disable momentum, volume, or breakout filters to suit your trading style.
Trend Periods: Set shortTrendPeriod (default: 30) and longTrendPeriod (default: 100) for trendline plotting. Keep below 2000 to avoid buffer errors.
AI Dashboard: Toggle Enable AI Market Analysis to show/hide the prediction table and adjust its position.
Interpret Signals:
Buy/Sell Labels: Green "Buy" or red "Sell" labels indicate trade entries with predefined TP/SL levels plotted.
Get Ready Signals: Yellow "Get Ready BUY" or orange "Get Ready SELL" labels warn of potential setups.
CHoCH/BOS Lines: Aqua (CHoCH Sell), lime (CHoCH Buy), fuchsia (BOS Sell), or teal (BOS Buy) lines mark key levels.
Trendlines: Green/lime (support) or fuchsia/purple (resistance) dashed lines show dynamic support/resistance.
AI Dashboard: Check the top-right table for trend strength, confidence, and CVD. The optional bottom table shows trend predictions (Up, Down, Neutral).
Backtest and Trade:
Use TradingView’s Strategy Tester to evaluate performance. Adjust TP/SL and filters based on results.
Trade manually based on signals or automate with TradingView alerts (set alerts for Buy/Sell labels).
Originality and Value
The PowerHouse SwiftEdge AI v2.10 Strategy stands out by combining multi-timeframe analysis, smart money concepts, and an AI-driven dashboard into a single, user-friendly system. Its adaptive momentum threshold, robust filtering, and clear visualizations empower traders to make confident decisions without needing advanced technical knowledge. Whether you’re a day trader or swing trader, this strategy provides a versatile, data-driven approach to navigating dynamic markets.
Important Notes:
Risk Management: Always use appropriate position sizing and risk management, as the strategy’s TP/SL levels are customizable.
Symbol Compatibility: Test on liquid symbols with sufficient historical data (at least 2000 bars) to avoid buffer errors.
Performance: Backtest thoroughly to optimize settings for your market and timeframe.

Market Sessions & LevelsOverview
This Pine Script indicator identifies key trading levels and market sessions, making it easier for traders to analyze price movements. It highlights the previous day's high and low, tracks premarket price action, and marks the first 5-minute high and low after the market opens.
Features
✅ Identifies Market Sessions:
Pre-Market Session (4:30 AM - 9:30 AM EST)
Regular Market Session (9:30 AM - 4:00 PM EST)
✅ Tracks Key Levels:
Previous Day’s High & Low
Premarket High & Low
First 5-Minute High & Low after market open
✅ Visual Cues for Easy Analysis:
Plots horizontal lines for each level with distinct colors
Displays labels for key price levels on the chart
How It Helps Traders
📊 Pre-Market Preparation: Helps traders spot key resistance/support levels before the market opens.
🚀 Momentum Trading: The first 5-minute high/low can act as breakout or reversal zones.
📉 Historical Price Context: Uses the previous day's high/low to gauge market sentiment.
Customization
The script can be easily modified to adjust session timings, colors, or additional levels based on your trading strategy.
💡 How to Use:
Apply the script to a 1-minute or 5-minute chart for the most accurate premarket and first 5-minute tracking.
Look for price reactions at the plotted levels to determine potential trade setups.
Higher Timeframe Support/ResistanceMulti-Timeframe Support/Resistance Indicator
This TradingView indicator helps you monitor important support and resistance levels based on the previous candle’s high, low, and close from a higher timeframe. By default, it uses a daily timeframe, but you can adjust this to any timeframe you want.
Key Features:
- Previous Candle High (PCH) and Previous Candle Low (PCL):
These levels are plotted on your chart (if enabled) and can act as potential support and
resistance zones. You can toggle the visibility of these levels.
- Pivot, Resistance (R1), and Support (S1):
The script calculates Pivot, R1 (Resistance), and S1 (Support) levels based on the previous
candle's price action from the selected higher timeframe.
These levels are displayed on your chart and can be used to identify potential breakout or
reversal points.
- Alert Feature:
Alerts are triggered when the price approaches any of these key levels (PCH, PCL, Pivot, R1,
or S1) within a specified threshold (e.g., 0.5%).
This helps traders react quickly to potential price movements near critical levels.
- Visual Representation:
The script visually fills the areas between Pivot and R1 (Resistance-Pivot Zone) and Pivot and
S1 (Support-Pivot Zone) with color for easy identification of key price zones.

Multi-Timeframe VWAP DashboardMulti-Timeframe VWAP Dashboard with Advanced Customization**
Unlock the power of **Volume-Weighted Average Price (VWAP)** across multiple timeframes with this highly customizable and feature-rich Pine Script. Designed for traders who demand precision and flexibility, this script provides a **comprehensive VWAP dashboard** that adapts to your trading style and strategy. Whether you're a day trader, swing trader, or long-term investor, this tool offers unparalleled insights into market trends and price levels.
---
### **Key Features:**
1. **Multi-Timeframe VWAP Calculation:**
- Calculate VWAP across **12-minute, 48-minute, 96-minute, 192-minute, daily, weekly, monthly, and even yearly timeframes**.
- Supports **custom timeframes** for tailored analysis.
2. **Price Source Selection:**
- Choose from multiple price sources for VWAP calculation, including **Open, High, Low, Close, HL2, HLC3, HLCC4, and All**.
- Optimize VWAP for **uptrends and downtrends** by selecting the most relevant price source.
3. **Customizable Labels:**
- Add **dynamic labels** to each VWAP line for quick reference.
- Customize label **colors, sizes, and offsets** to suit your chart setup.
- Display **price values** and **session types** (e.g., "12 Min", "Daily", "Weekly") directly on the chart.
4. **Advanced Session Detection:**
- Automatically detect new sessions for **intraday, daily, weekly, monthly, and yearly timeframes**.
- Ensures accurate VWAP calculations for each session.
5. **Plot Visibility Control:**
- Toggle the visibility of individual VWAP plots to **reduce clutter** and focus on the most relevant timeframes.
- Includes options for **short-term, medium-term, and long-term VWAPs**.
6. **Comprehensive Timeframe Coverage:**
- From **12-minute intervals** to **12-month intervals**, this script covers all major timeframes.
- Perfect for traders who analyze markets across multiple horizons.
7. **User-Friendly Inputs:**
- Intuitive input options for **timeframes, colors, labels, and offsets**.
- Easily customize the script to match your trading preferences.
8. **Dynamic Label Positioning:**
- Labels adjust automatically based on price movements and session changes.
- Choose from **multiple offset options** to position labels precisely.
9. **Miscellaneous Customization:**
- Adjust **text color, label size, and price display settings**.
- Enable or disable **price values** and **session type labels** for a cleaner chart.
---
### **Why Use This Script?**
- **Versatility:** Suitable for all trading styles, including scalping, day trading, swing trading, and long-term investing.
- **Precision:** Accurate VWAP calculations across multiple timeframes ensure you never miss key price levels.
- **Customization:** Tailor the script to your specific needs with a wide range of input options.
- **Clarity:** Dynamic labels and customizable plots make it easy to interpret market trends at a glance.
---
### **How It Works:**
1. **Select Your Price Source:**
- Choose the price source (e.g., Open, Close, HL2) for VWAP calculation based on your trading strategy.
2. **Choose Timeframes:**
- Define the timeframes for VWAP calculation, from intraday to yearly intervals.
3. **Customize Labels and Plots:**
- Enable or disable labels and plots for each timeframe.
- Adjust colors, sizes, and offsets to match your chart setup.
4. **Analyze Market Trends:**
- Use the VWAP lines and labels to identify **support/resistance levels**, **trend direction**, and **potential reversal points**.
5. **Adapt to Market Conditions:**
- Switch between timeframes and price sources to adapt to changing market conditions.
---
### **Ideal For:**
- **Day Traders:** Use short-term VWAPs (e.g., 12-minute, 48-minute) to identify intraday trends and key levels.
- **Swing Traders:** Leverage medium-term VWAPs (e.g., 96-minute, daily) to spot swing opportunities.
- **Long-Term Investors:** Analyze long-term VWAPs (e.g., weekly, monthly) to gauge overall market direction.
---
### **How to Get Started:**
1. Add the script to your TradingView chart.
2. Customize the inputs to match your trading preferences.
3. Analyze the VWAP lines and labels to make informed trading decisions.
---
### **Pro Tip:**
Combine this script with other technical indicators (e.g., moving averages, RSI) for a **holistic view** of the market. Use the VWAP lines as dynamic support/resistance levels to enhance your entry and exit strategies.
This script is a must-have tool for traders who value precision, flexibility, and clarity. Share it with your audience to help them elevate their trading game. Whether they're beginners or seasoned professionals, this **Multi-Timeframe VWAP Dashboard** will become an essential part of their toolkit.

Multi-Timeframe VWAP Master ProThe Multi-Timeframe VWAP Suite is a comprehensive and highly customizable indicator designed for traders who rely on Volume-Weighted Average Price (VWAP) across multiple timeframes and periods. This tool provides a complete suite of VWAP calculations, including daily, weekly, monthly, quarterly, yearly, and custom VWAPs, allowing traders to analyze price action and volume trends with precision. Whether you're a day trader, swing trader, or long-term investor, this indicator offers unparalleled flexibility and depth for your trading strategy.
Multi-Timeframe VWAPs:
Daily, Weekly, Monthly, Quarterly, and Yearly VWAPs: Track VWAP across various timeframes to identify key support and resistance levels.
Customizable Timeframes: Use the SMA timeframe input to adjust the period for moving averages and other calculations.
Previous Period VWAPs:
Previous Daily, Weekly, Monthly, and Quarterly VWAPs: Analyze historical VWAP levels to understand past price behavior and identify potential reversal zones.
Previous Year Quarterly VWAPs: Compare current price action to VWAP levels from specific quarters of the previous year.
Custom VWAPs:
Custom Start Date and Timeframe: Define your own VWAP periods by specifying a start date and timeframe, allowing for tailored analysis.
Dynamic Custom VWAP Calculation: Automatically calculates VWAP based on your custom inputs, ensuring flexibility for unique trading strategies.
Seasonal and Yearly VWAPs:
April, July, and October VWAPs: Analyze seasonal trends by tracking VWAP levels for specific months.
Yearly VWAP: Get a broader perspective on long-term price trends with the yearly VWAP.
SMA Integration:
SMA Overlay: Combine VWAP analysis with a Simple Moving Average (SMA) for additional confirmation of trends and reversals.
Customizable SMA Length and Timeframe: Adjust the SMA settings to match your trading style and preferences.
User-Friendly Customization:
Toggle Visibility and Labels: Easily enable or disable the display of specific VWAPs and their labels to keep your chart clean and focused.
Color Customization: Each VWAP line and label is color-coded for easy identification and can be customized to suit your preferences.
Dynamic Labeling:
Automatic Labels: Labels are dynamically placed on the last bar, providing clear and concise information about each VWAP level.
Customizable Label Text: Labels include detailed information, such as the timeframe or custom period, for quick reference.
Flexible Timeframe Detection:
Automatic Timeframe Detection: The indicator automatically detects new days, weeks, months, and quarters, ensuring accurate VWAP calculations.
Support for Intraday and Higher Timeframes: Works seamlessly on all chart timeframes, from 1-minute to monthly charts.
Previous Year Quarterly VWAPs:
Q1, Q2, Q3, Q4 VWAPs: Compare current price action to VWAP levels from specific quarters of the previous year.
User-Selectable Year: Choose the year for which you want to calculate previous quarterly VWAPs.
Persistent Monthly VWAPs:
Option to Persist Monthly VWAPs Year-Round: Keep monthly VWAP levels visible even after the month ends for ongoing analysis.
Comprehensive Analysis: Combines multiple VWAP timeframes and periods into a single tool, eliminating the need for multiple indicators.
Customizable and Flexible: Tailor the indicator to your specific trading strategy with customizable timeframes, periods, and settings.
Enhanced Decision-Making: Gain deeper insights into price action and volume trends across different timeframes, helping you make more informed trading decisions.
Clean and Organized Charts: Toggle visibility and labels to keep your chart clutter-free while still accessing all the information you need.
Ideal For:
Day Traders: Use daily and intraday VWAPs to identify intraday support and resistance levels.
Swing Traders: Analyze weekly and monthly VWAPs to spot medium-term trends and reversals.
Long-Term Investors: Leverage quarterly and yearly VWAPs to understand long-term price behavior and key levels.
Seasonal Traders: Track April, July, and October VWAPs to capitalize on seasonal trends.
The Multi-Timeframe VWAP Suite is a powerful and versatile tool for traders of all styles and timeframes. With its comprehensive suite of VWAP calculations, customizable settings, and user-friendly design, it provides everything you need to analyze price action and volume trends with precision and confidence. Whether you're looking to fine-tune your intraday strategy or gain a broader perspective on long-term trends, this indicator has you covered.

Multi-Timeframe Open LinesThe Multi-Timeframe Open Lines indicator is designed to help traders visualize key price levels at the open of specific time intervals. It draws horizontal lines at the open of 5-minute, 15-minute, 30-minute, and hourly candles, extending these lines to the start of the next respective interval. Traders can now control which timeframes are displayed and how many past opening lines are shown, ensuring a clean and organized chart.
Key Features:
Customizable Lines:
5-Minute Lines: Highlight the open of every 5-minute candle, ending at the start of the next 5-minute candle.
15-Minute Lines: Highlight the open of every 15-minute candle, ending at the start of the next 15-minute candle.
30-Minute Lines: Highlight the open of every 30-minute candle, ending at the start of the next 30-minute candle.
Hourly Lines: Highlight the open of every hourly candle, ending at the start of the next hourly candle.
Each timeframe's lines can be customized in terms of color, line style, and thickness.
Toggle Options:
Easily turn on or off the display of lines for each timeframe (5m, 15m, 30m, 1h) using checkboxes in the settings.
User-Defined Limits:
Control the number of past opening lines displayed for each timeframe (5m, 15m, 30m, 1h).
Prevents chart clutter by limiting the number of visible lines.
Multi-Timeframe Analysis:
Enables traders to analyze price action across multiple timeframes simultaneously, providing a clearer picture of market structure and key levels.
User-Friendly Inputs:
Easy-to-use settings for customizing line appearance and behavior, ensuring the indicator fits seamlessly into any trading strategy.
How to Use:
Apply the indicator to your chart to visualize the open price levels for 5-minute, 15-minute, 30-minute, and hourly candles.
Use the lines as dynamic support/resistance levels or to identify potential breakout/breakdown points.
Customize the colors, styles, and the number of visible lines to match your chart theme or trading preferences.
Toggle specific timeframes on or off to focus on the most relevant price levels.
Ideal For:
Traders who use multi-timeframe analysis.
Those who rely on key price levels for decision-making.
Anyone looking to enhance their chart with clear, customizable reference lines while avoiding clutter.

Volume profile [Signals] - By Leviathan [Mindyourbuisness]Market Sessions and Volume Profile with Sweep Signals - Based on Leviathan's Volume Profile
This indicator is an enhanced version of Leviathan's Volume Profile indicator, adding session-based value area analysis and sweep detection signals. It combines volume profile analysis with market structure concepts to identify potential reversal opportunities.
Features
- Session-based volume profiles (Daily, Weekly, Monthly, Quarterly, Yearly)
- Forex sessions support (Tokyo, London, New York)
- Value Area analysis with POC, VAH, and VAL levels
- Extended level visualization for the last completed session
- Sweep detection signals for key value area levels
Sweep Signals Explanation
The indicator detects two types of sweeps at VAH, VAL, and POC levels:
Bearish Sweeps (Red Triangle Down)
Conditions:
- Price makes a high above the level (VAH/VAL/POC)
- Closes below the level
- Closes below the previous candle's low
- Previous candle must be bullish
Trading Implication: Suggests a failed breakout and potential reversal to the downside. These sweeps often indicate stop-loss hunting above key levels followed by institutional selling.
Bullish Sweeps (Green Triangle Up)
Conditions:
- Price makes a low below the level (VAH/VAL/POC)
- Closes above the level
- Closes above the previous candle's high
- Previous candle must be bearish
Trading Implication: Suggests a failed breakdown and potential reversal to the upside. These sweeps often indicate stop-loss hunting below key levels followed by institutional buying.
Trading Guidelines
1. Use sweep signals in conjunction with the overall trend
2. Look for additional confirmation like:
- Volume surge during the sweep
- Price action patterns
- Support/resistance levels
3. Consider the session's volatility and time of day
4. More reliable signals often occur at VAH and VAL levels
5. POC sweeps might indicate stronger reversals due to their significance as fair value levels
Notes
- The indicator works best on higher timeframes (1H and above)
- Sweep signals are more reliable during active market hours
- Consider using multiple timeframe analysis for better confirmation
- Past performance is not indicative of future results
Credits: Original Volume Profile indicator by Leviathan
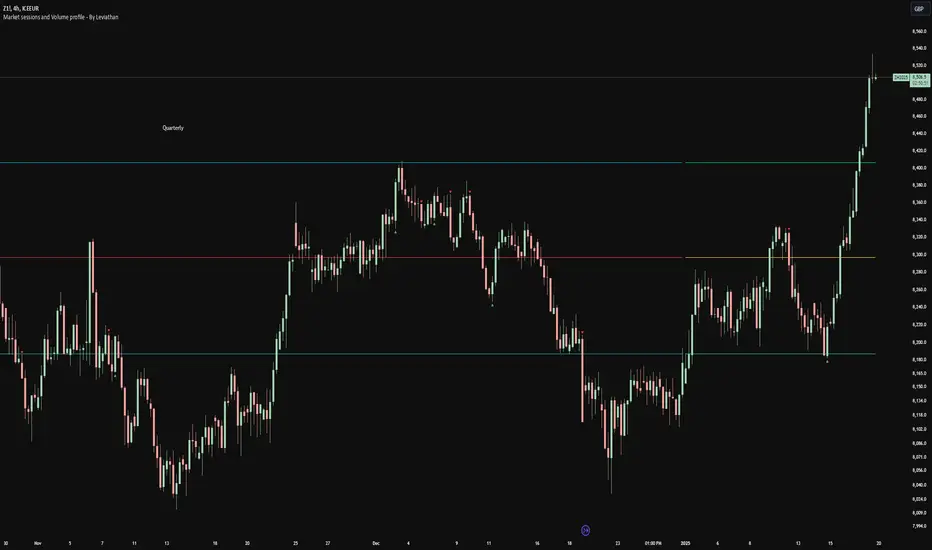
Max The Minner: RSI Bands with Min/Max [by Oberlunar]This Pine Script, titled "Max The Minner: RSI Bands with Min/Max " is a technical indicator designed to visualize RSI-based dynamic bands with local minimum and maximum levels on a chosen timeframe. The script incorporates user-configurable parameters for RSI thresholds, resolution, and color settings, providing traders with a highly customizable tool for analyzing price behavior in relation to overbought and oversold conditions.
Core Functionality
The script begins by calculating the RSI (Relative Strength Index) using user-defined inputs for overbought and oversold levels, the RSI length, and the resolution (default set to daily). The RSI is computed through an exponential moving average (EMA) approach that smooths the upward and downward price movements, creating adaptive upper (ub) and lower (lb) bands based on the overbought and oversold thresholds.
These bands are then dynamically adjusted based on the current price (src) and the EMA calculations. The upper band (ub) represents a potential resistance zone aligned with the RSI overbought level, while the lower band (lb) represents a support zone aligned with the RSI oversold level. The script employs additional calculations to ensure the adaptive nature of these bands, depending on whether the RSI is pushing higher or lower relative to its thresholds.
Local Minima and Maxima
A key feature of the indicator is its ability to track and update local minima and maxima based on the chosen timeframe. The script uses a buffer system that refreshes these levels every three bars to smooth out noise and avoid excessive sensitivity to short-term fluctuations. These local extrema (localMin and localMax) are retrieved from the lower and upper prices of the selected timeframe and act as dynamic benchmarks for evaluating the RSI bands.
Conditional Logic
The script includes conditional logic to determine when the RSI bands intersect with or approach the local maxima or minima. For example:
The upper band (ub) is plotted only if it is below the local maximum, suggesting that price may encounter resistance.
Similarly, the lower band (lb) is plotted only if it is above the local minimum, indicating potential support.
This logic ensures that the bands are contextually relevant to the prevailing market structure, rather than being static overlays.
Visualization
The RSI bands and local extrema are plotted on the chart using color-coded lines, with transparency adjustable through user inputs. The upper band and local maximum are linked with a fill area, visually representing the resistance zone. Similarly, the lower band and local minimum are filled to highlight the support zone. These fills provide a clear depiction of price boundaries, making it easier for traders to spot key levels.
Additionally, the script marks breakout conditions. If the price exceeds the local maximum, a label is plotted at the breakout point with a distinctive style and color. Similarly, a breakout below the local minimum is labeled, providing a visual cue for significant price movements.
Customization
The script offers extensive customization options for both functionality and appearance:
Users can define the overbought and oversold levels for RSI, along with the RSI length and the resolution (timeframe).
Colors for the upper and lower bands, along with transparency (alpha) levels, can be adjusted, allowing for seamless integration with different chart styles.
The periodicity of the local minima and maxima updates is hardcoded to three bars but could be further parameterized for greater flexibility.
This indicator is particularly useful for traders who rely on RSI-based strategies and need a dynamic representation of overbought and oversold conditions in conjunction with local price extremes. By combining RSI bands with the context provided by local minima and maxima, it allows traders to:
Identify potential support and resistance levels.
Visualize price behavior relative to RSI thresholds.
Spot breakout opportunities when price exceeds predefined levels.

BTC Trendline Patterns with Signals BTC Trendline Patterns with Signals
This custom Pine Script indicator automatically detects key pivot points in Bitcoin price action and draws support and resistance trendlines. The indicator provides buy (long) and sell (short) signals when these trendlines are broken. This can help traders identify potential breakout opportunities and trend reversals based on established price levels.
Features:
Pivot Point Detection: Automatically identifies pivot highs and lows in the price chart, based on customizable parameters (Pivot Left and Pivot Right).
Support and Resistance Trendlines: Draws trendlines based on the identified pivot points. These lines represent significant price levels where price may experience support or resistance.
Breakout Signals: Provides buy (long) and sell (short) signals when the price breaks above the resistance trendline (for buy signals) or below the support trendline (for sell signals).
Customizable Pivot Lengths: Adjust the number of bars considered for determining pivot points using the Pivot Left and Pivot Right input parameters.
How it Works:
Pivot Detection: The script identifies the highest high (pivotHigh) and the lowest low (pivotLow) within a specific range of bars (defined by Pivot Left and Pivot Right).
Trendline Plotting: Once pivots are detected, the script draws resistance (red) and support (green) trendlines connecting the most recent pivots. These trendlines act as dynamic support and resistance levels.
Breakout Signals: The script generates signals:
BUY (Long): Triggered when the price breaks above the most recent resistance trendline.
SELL (Short): Triggered when the price breaks below the most recent support trendline.
Parameters:
Pivot Left: Number of bars to the left of the pivot point to consider.
Pivot Right: Number of bars to the right of the pivot point to consider.
Line Width: Customizable line width for drawing trendlines.
Ideal Use:
Timeframes: This indicator works well on timeframes ranging from 1-minute to daily charts. For best results, use it on 1-hour, 4-hour, or daily charts.
Strategy: Ideal for breakout traders or trend-following strategies. Use it to identify potential entry points when price breaks key levels of support or resistance.
Example Use Case:
Swing Traders: Traders looking for potential breakouts can use this script to identify key levels in the market and wait for the price to break through resistance for a long trade or support for a short trade.
Day Traders: For those looking to enter and exit trades in a single day, this indicator can help pinpoint areas of support and resistance, and provide actionable signals when price breaks those levels.
Disclaimer:
This script is not a guarantee of success and should be used in conjunction with other technical analysis tools. Always perform additional research and backtesting before live trading.
Important Notes:
The pivot points and trendlines may adjust dynamically as the price evolves. Adjust the pivot settings to suit the volatility and timeframe of the market you're trading.
This indicator works best when combined with other indicators such as volume, RSI, or MACD for confirmation.
How to Use:
Add the indicator to your chart.
Adjust the Pivot Left and Pivot Right parameters to fine-tune the pivot point detection.
Monitor for trendline breakouts. When the price breaks above the resistance line, a BUY signal will appear. When the price breaks below the support line, a SELL signal will appear.
Use the signals to enter trades at the right moment.
Final Notes:
If you're submitting to TradingView for publishing, keep your description clear and informative, but also concise. Traders need to quickly understand how your indicator works, what parameters they can adjust, and how it might fit into their trading strategy.

Swing Percentile Lines [QuantVue]The Swing High/Low Percentile Indicator is designed to help traders identify key price levels based on the most recent swing high and low. By anchoring to the most recent swing high and swing low, the indicator automatically generates percentile lines ( 25%, 50%, 75%) that act as dynamic support and resistance levels.
What Does the Indicator Do?
The Swing High/Low Percentile Indicator works by identifying the most recent significant price swings, whether it's a swing high or swing low. It then calculates the range between these points and divides the distance into percentage-based levels. These levels are plotted on the chart as clear, easy-to-read lines at 25%, 50%, and 75% of the range between the swing high and low.
These percentile lines serve as dynamic price zones where traders can anticipate potential reactions, whether the market is trending or consolidating.
How Can Traders Use the Indicator?
Support and Resistance: The percentile lines act as evolving support and resistance zones. Traders can anticipate price bounces or breaks at these levels, providing opportunities for trend-following or reversal trades.
Trend Identification: The indicator helps traders determine the strength of a trend. In a strong uptrend, price will likely stay above the 50% or 75% lines, while in a downtrend, it may remain below the 50% or 25% lines. This gives traders an edge in recognizing the overall market direction.
Entry and Exit Points: Traders can use the percentile lines to time their entries and exits. For example, entering a trade on a pullback to the 25% or 50% line offers a favorable risk-to-reward ratio. Similarly, the percentile lines serve as natural profit targets, allowing traders to plan exits as the price approaches the 50% or 75% levels.
Risk Management: The clear delineation of price levels makes it easy for traders to set stop-loss orders. For example, if price falls below the 25% line in an uptrend, it may signal weakness, prompting an exit or reduced position size.
Breakout and Breakdown Scenarios: When price breaks above a recent swing high or below a swing low, the percentile lines provide traders with pullback entry opportunities or key levels to watch for continuation of the move.

Gold IBH/IBL with IBM, Overnight Levels, OVM, and ONVPOCThe Initial Balance (IB) indicator for gold trading is a valuable tool for identifying key price levels and potential trade setups. Here's an overview of how it works:
Initial Balance Calculation
The Initial Balance for gold is calculated from 8:20 AM to 9:20 AM EST, coinciding with the COMEX open. This one-hour period establishes crucial reference points for the trading day.
Key Levels
The indicator displays several important price levels:
IB High: The highest price reached during the Initial Balance period
IB Low: The lowest price reached during the Initial Balance period
IB Midpoint: The average of the IB High and IB Low
These levels often serve as significant support and resistance areas, with many traders placing stop-losses around them.
Overnight Levels
In addition to the IB levels, the indicator shows overnight price action:
ONH: Overnight High
ONL: Overnight Low
ONM: Overnight Midpoint
Overnight VWAP: Volume Weighted Average Price from the overnight session
These overnight levels have a high probability of being tested during the COMEX trading session, making them valuable reference points for traders.
Trading Applications
Traders can use the IB and overnight levels for various purposes:
Setting profit targets
Identifying potential trade entry points
Managing risk by placing stop-losses at key levels
Gauging overall market sentiment and volatility
The levels established during both the Initial Balance and overnight sessions are likely to be touched during the COMEX trading session. This insight allows traders to make more informed decisions and enhances their trading strategies.
If you have more questions about the trading strategy, please DM me, and I can explain further. I also have probabilities of all these levels being broken during the COMEX trading hours, which gives us confidence to hold our trades to targets.
Understanding and utilizing these levels can provide traders with a competitive edge in gold trading, helping them make more informed decisions based on early market dynamics and overnight price action.
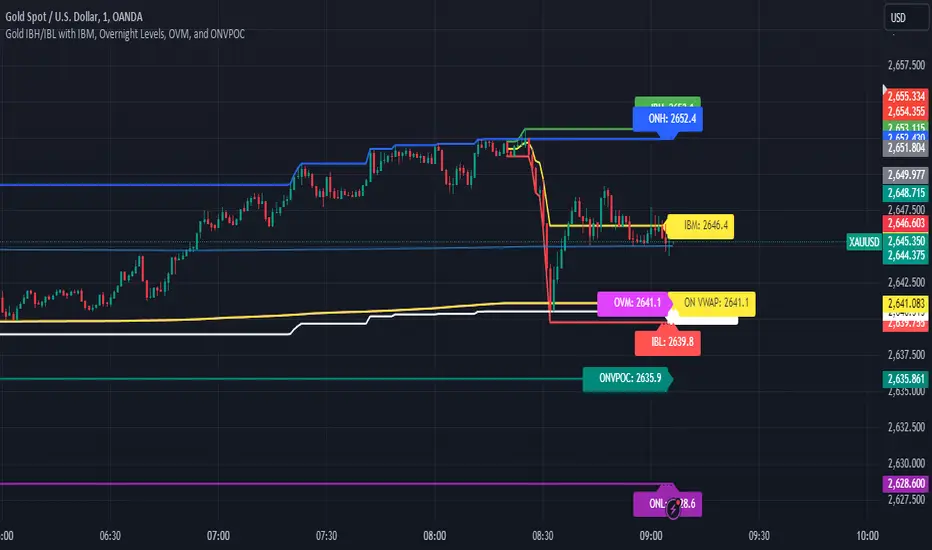
Support Resistance ImportanceThe Support Resistance Importance indicator is designed to highlight key price levels based on the relationship between fractal occurrences and volume distribution within a given price range. By dividing the range into bins, the indicator calculates the total volume traded at each fractal level and normalizes the values for easy visualization. The normalized values represent an "importance score" for each price range, helping traders identify critical support and resistance levels where price action might react.
Key Features:
Fractal Detection:
The indicator detects Williams Fractals, which are specific price patterns representing potential market reversals. It identifies both upward fractals (potential resistance) and downward fractals (potential support).
Price Range Binning:
The price range is divided into a user-defined number of bins (default is 20). Each bin represents a segment of the total price range, allowing the indicator to bucket price action and track fractal volumes in each bin.
Volume-Based Importance Calculation:
For each bin, the indicator sums up the volume traded at the time a fractal occurred. The volumes are then normalized to reflect their relative importance.
The importance score is calculated as the relative volume in each bin, representing the potential influence of that price range. Higher scores indicate stronger support or resistance levels.
Normalization:
The volume data is normalized to allow for better comparison across bins. This normalization ensures that the highest and lowest volumes are scaled between 0 and 1 for visualization purposes. The smallest volume value is used to scale the rest, ensuring meaningful comparisons.
Visualization:
The indicator provides a table-based visualization showing the price range and the corresponding importance score for each bin.
Each bin is color-coded based on the normalized importance score, with blue or greenish shades indicating higher importance levels. The current price range is highlighted to help traders quickly identify relevant areas of interest.
Trading Utility:
Traders can use the importance scores to identify price levels where significant volume has accumulated at fractals. A higher importance score suggests a stronger likelihood of the price reacting to that level.
If a price moves towards a bin with a high score and the bins above it have much smaller values, it suggests that the price may "pump" up to the next high-scored range, similar to how price drops can occur.
Example Use Case:
Suppose the price approaches a bin with an importance score of 25, and the bins above have much smaller values. This suggests that price may break higher towards the next significant level of resistance, offering traders an opportunity to capitalize on the move by entering long positions or adjusting their stop losses.
This indicator is particularly useful for support and resistance trading, where understanding key levels of price action and volume can improve decision-making in anticipating market reactions.
