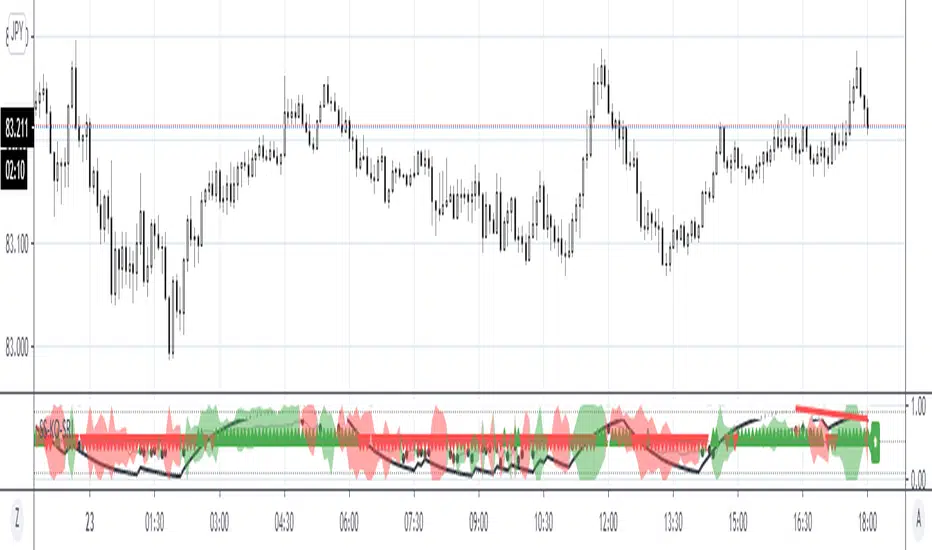
Similarity Search, Karobein and Seasonal Random IndexSimilarity Search, Karobein oscillator (KO) and Seasonal Random Index (SRI)
Description:
This indicator uses dynamic capabilities of Pinescript version 4 coupled with Seasonal Random Index (SRI) and Karobein Oscillator (KO). SRI (green/red areas) is employed to detect trends and KO (black curce) is used to find historical similarities to predict the next bar's direction. The midline arrows are the predictions produced by the similarity search algorithm.
스크립트에서 "index"에 대해 찾기
Combo Backtest 123 Reversal & MASS Index This is combo strategies for get a cumulative signal.
First strategy
This System was created from the Book "How I Tripled My Money In The
Futures Market" by Ulf Jensen, Page 183. This is reverse type of strategies.
The strategy buys at market, if close price is higher than the previous close
during 2 days and the meaning of 9-days Stochastic Slow Oscillator is lower than 50.
The strategy sells at market, if close price is lower than the previous close price
during 2 days and the meaning of 9-days Stochastic Fast Oscillator is higher than 50.
Second strategy
The Mass Index was designed to identify trend reversals by measuring
the narrowing and widening of the range between the high and low prices.
As this range widens, the Mass Index increases; as the range narrows
the Mass Index decreases.
The Mass Index was developed by Donald Dorsey.
WARNING:
- For purpose educate only
- This script to change bars colors.

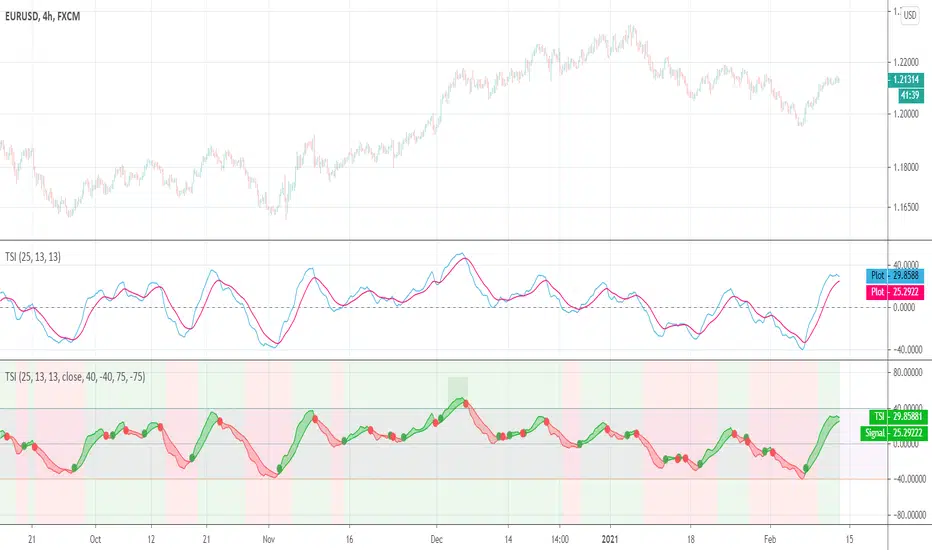
True Strength Index (TSI)User request. A tuned version of the built-in True Strength Index (TSI) indicator with the following options included:
TSI - Signal Histogram
TSI/Signal Crossovers
TSI/Signal Ribbon
Bands breakouts highlighting
Zero line crossovers background
Combo Backtest 123 Reversal & Market Facilitation Index This is combo strategies for get a cumulative signal.
First strategy
This System was created from the Book "How I Tripled My Money In The
Futures Market" by Ulf Jensen, Page 183. This is reverse type of strategies.
The strategy buys at market, if close price is higher than the previous close
during 2 days and the meaning of 9-days Stochastic Slow Oscillator is lower than 50.
The strategy sells at market, if close price is lower than the previous close price
during 2 days and the meaning of 9-days Stochastic Fast Oscillator is higher than 50.
Second strategy
The Market Facilitation Index is an indicator that relates price range to
volume and measures the efficency of price movement. Use the indicator to
determine if the market is trending. If the Market Facilitation Index increased,
then the market is facilitating trade and is more efficient, implying that the
market is trending. If the Market Facilitation Index decreased, then the market
is becoming less efficient, which may indicate a trading range is developing that
may be a trend reversal.
WARNING:
- For purpose educate only
- This script to change bars colors.

Crypto Directional Movement Index DMI/ADXCrypto ADX + DMI
This indicator is a customised version of the ADX + DMI by J. Welles Wilder in 1978, with default settings optimal for cryptocurrencies.
What is the DMI (ADX) Indicator?
According to Investopedia:
DMI (ADX) consists of three indicators that measure a trend’s strength and direction. Three lines compose the Direction Movement Index (DMI): ADX (black line), DI+ (green line), and DI- (red line). The Average Directional Index (ADX) line shows the strength of the trend. The higher the ADX value, the stronger the trend. The color of the lines can be altered, but black, green, and red are the default in most software.
The Plus Direction Indicator (DI+) and Minus Direction Indicator (DI-) show the current price direction. When the DI+ is above DI-, the current price momentum is up. When the DI- is above DI+, the current price momentum is down.
This Version
The ADX default value has been changed to from 14 to 2 (optimal for cryptocurrencies). The background flashes red when the –DMI goes above the HZ1 threshold and green when the +DMI does the same. There is an option to change it so that it’ll only flash when the ADX and the DMI are both above the threshold. The ADX changes color when above HZ1.
Red and green plotshapes appear at DMI crossovers and three horizontal lines have also been added.
Any suggestions are most welcome

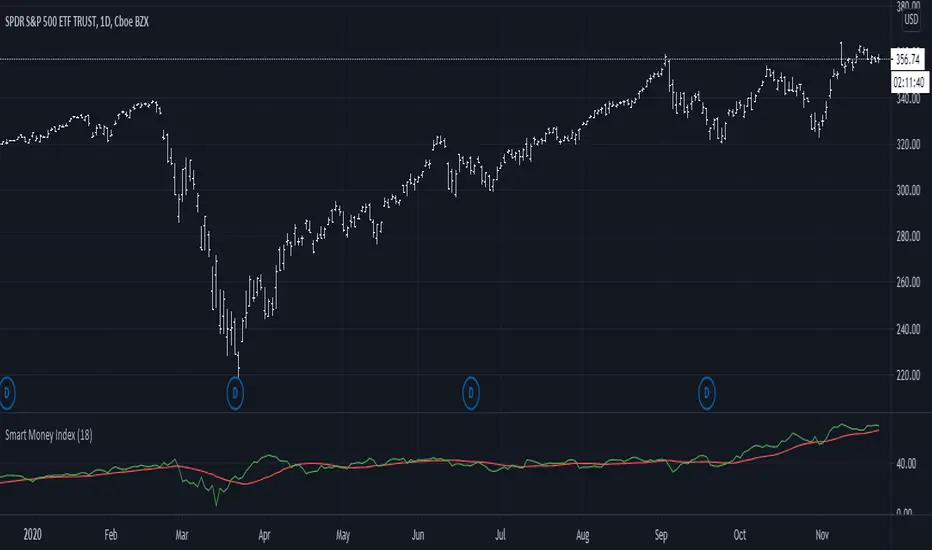
Smart Money Index (SMI)It came to my attention that one very common implementation of SMI was incorrect; rather than subtracting the first hour delta and adding the last hour delta it subtracts the whole day delta and adds the last 30m delta. While this indicator might have had some use, it is not what I understand to be the actual Smart Money Index and so I post this as a correction for use in other scripts.
Bollinger Bands Strategy with Intraday Intensity IndexFor Educational Purposes. Results can differ on different markets and can fail at any time. Profit is not guaranteed.
This only works in a few markets and in certain situations. Changing the settings can give better or worse results for other markets.
This is a mean reversion strategy based on Bollinger Bands and the Intraday Intensity Index (a volume indicator). John Bollinger mentions that the Intraday Intensity Index can be used with Bollinger Bands and is one of the top indicators he recommends in his book. It seems he prefers it over the other volume indicators that he compares to for some reason. III looks a lot like Chaikin Money Flow but without the denominator in that calculation. On the default settings of the BBs, the III helps give off better entry signals. John Bollinger however is vague on how to use the BBs and it's hard to say if one should enter when it is below/above the bands or when the price crosses them. I find that with many indicators and strategies it's best to wait for a confirmation of some sort, in this case by waiting for some crossover of a band. Like most mean reversion strategies, the exit is very loose if using BBs alone. Usually the plan to exit is when the price finally reverts back to the mean or in this case the middle band. This can potentially lead to huge drawdowns and/or losses. Mean reversion strategies can have high win/loss ratios but can still end up unprofitable because of the huge losses that can occur. These drawdowns/losses that mean reversion strategies suffer from can potentially eat away at a large chunk of all that was previously made or perhaps up to all of it in the worst cases, can occur weeks or perhaps up to months after being profitable trading such a strategy, and will take a while and several trades to make it all back or keep a profitable track record. It is important to have a stop loss, trailing stop, or some sort of stop plan with these types of strategies. For this one, in addition to exiting the trade when price reverts to the middle band, I included a time-based stop plan that exits with a gain or with a loss to avoid potentially large losses, and to exit after only a few periods after taking the trade if in profit instead of waiting for the price to revert back to the mean.

The Lazy Trader - Index (ETF) Trend Following Robot50/150 moving average, index (ETF) trend following robot. Coded for people who cannot psychologically handle dollar-cost-averaging through bear markets and extreme drawdowns (although DCA can produce better results eventually), this robot helps you to avoid bear markets. Be a fair-weathered friend of Mr Market, and only take up his offer when the sun is shining! Designed for the lazy trader who really doesn't care...
Recommended Chart Settings:
Asset Class: ETF
Time Frame: Daily
Necessary ETF Macro Conditions:
a) Country must have healthy demographics, good ratio of young > old
b) Country population must be increasing
c) Country must be experiencing price-inflation
Default Robot Settings:
Slow Moving Average: 50 (integer) //adjust to suit your underlying index
Fast Moving Average: 150 (integer) //adjust to suit your underlying index
Bullish Slope Angle: 5 (degrees) //up angle of moving averages
Bearish Slope Angle: -5 (degrees) //down angle of moving averages
Average True Range: 14 (integer) //input for slope-angle formula
Risk: 100 (%) //100% risk means using all equity per trade
ETF Test Results (Default Settings):
SPY (1993 to 2020, 27 years), 332% profit, 20 trades, 6.4 profit factor, 7% drawdown
EWG (1996 to 2020, 24 years), 310% profit, 18 trades, 3.7 profit factor, 10% drawdown
EWH (1996 to 2020, 24 years), 4% loss, 26 trades, 0.9 profit factor, 36% drawdown
QQQ (1999 to 2020, 21 years), 232% profit, 17 trades, 3.6 profit factor, 2% drawdown
EEM (2003 to 2020, 17 years), 73% profit, 17 trades, 1.1 profit factor, 3% drawdown
GXC (2007 to 2020, 13 years), 18% profit, 14 trades, 1.3 profit factor, 26% drawdown
BKF (2009 to 2020, 11 years), 11% profit, 13 trades, 1.2 profit factor, 33% drawdown
A longer time in the markets is better, with the exception of EWH. 6 out of 7 tested ETFs were profitable, feel free to test on your favourite ETF (default settings) and comment below.
Risk Warning:
Not tested on commodities nor other financial products like currencies (code will not work), feel free to leave comments below.
Moving Average Slope Angle Formula:
Reproduced and modified from source:

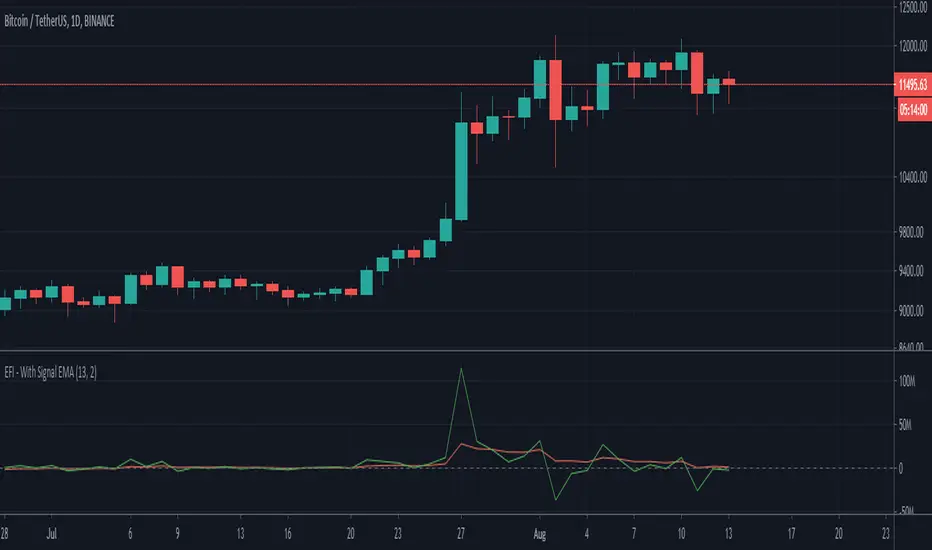
Elders Force Index - With Signal EMA - ValenteSame as Elders Force Index, but with an Additional EMA for buy and sell signal
Congestion Index by KatsanosCONGESTION INDEX
Market movements can be characterized by two distinct types or phases. In the first, the market shows trending movements which have a directional bias over a period of time. The second type of market behavior is periodic or cyclic motion, where the market shows no consistent directional bias and trades between two levels. This type of market results in the failure of trend-following indicators and the success of overbought/oversold oscillators. Both phases of the market require the use of different types of indicator. Trending markets need trend-following indicators such as moving averages, moving average convergence/divergence (MACD), and so on. Trading range markets need oscillators such as the relative strength index (RSI) and stochastics, which use overbought and oversold levels. The age-old problem for many trading systems is their inability to determine if a trending or trading range market is at hand. Trend-following indicators, such as the MACD or moving averages, tend to be whipsawed as markets enter a nontrending congestion phase. On the other hand, oscillators (which work well during trading range markets) are often too early to buy or sell in a trending market. Thus, identifying the market phase and selecting the appropriate indicators is critical to a system’s success. The congestion index attempts to identify the market’s character by dividing the actual percentage that the market has changed in the past x days by the extreme range according to the following formula:
Readings between+20 and−20indicate congestion or oscillating mode. Crossing over the 20 line from below indicates the start of a rising trend. Conversely, the start of a down turn is indicated by crossing under−20 from above. The CI can also be used as an overbought/oversold oscillator.
It was taken from İntermarket Trading Strategies book of by Markos Katsanos.Read the book.
D1:=Input(“DAYS IN CONGESTION”,1,500,15);
CI:=ROC(C,D1-1,%)/((HHV(H,D1)-LLV(L,D1))/(LLV(L,D1)+.01)+.000001);
Mov ( CI ,3,E)
(Copyright Markos Katsanos 2008)

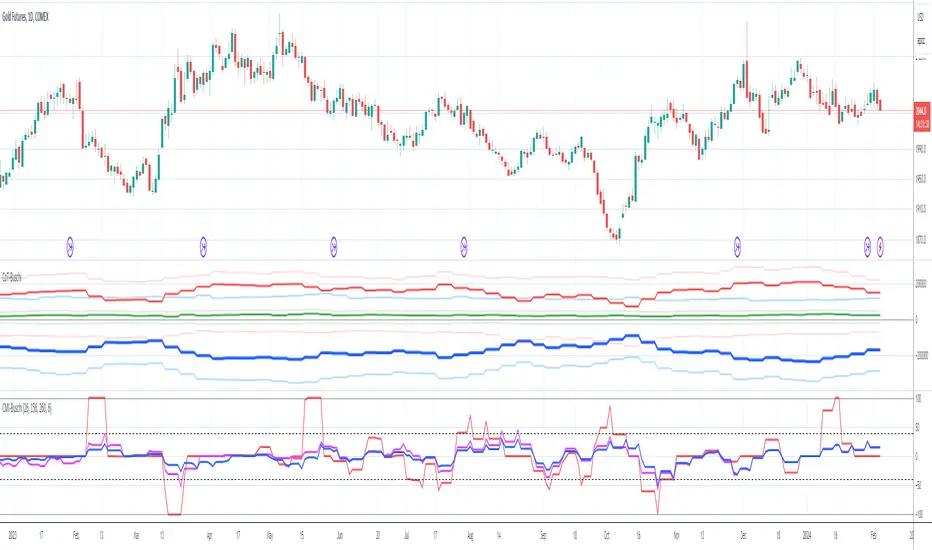
Commercial Movement Index-BuschiEnglish
Inspired by the book "The Commitments of Traders Bible" by Stephen Briese, this indicator is a follow-up of my already published "Commercial Index-Buschi".
Here, the Commercial Index isn't shown in values from 0 to 100, but in how far the value changed from a given timeframe (default Movement Reference: 6 weeks). Therefore it ranges from 100 (bullish move from the Commercials during the last weeks) to -100 (bearish move).
Deutsch
Inspiriert durch das Buch "The Commitments of Traders Bible" by Stephen Briese, ist dieser Indikator eine Weiterentwicklung meines bereits veröffentlichten Skriptes "Commercial Index-Buschi".
Hier wird der Commercial Index nicht in Werten von 0 bis 100 angezeigt, sondern in wieweit er sich innerhalb eines vorgegebenen Zeitfensters (Standard: Movement Reference: 6 Wochen) verändert hat. Daher schwankt er zwischen 100 (bullishe Bewegung der Commercials innerhalb der letzten Wochen) und -100 (bearishe Bewegung).

Coinbase ALT/USD IndexA simple ALT/USD pair index of all the altcoins currently trading on Coinbase.


Commodity Selection Index Backtest The Commodity Selection Index ("CSI") is a momentum indicator. It was
developed by Welles Wilder and is presented in his book New Concepts in
Technical Trading Systems. The name of the index reflects its primary purpose.
That is, to help select commodities suitable for short-term trading.
A high CSI rating indicates that the commodity has strong trending and volatility
characteristics. The trending characteristics are brought out by the Directional
Movement factor in the calculation--the volatility characteristic by the Average
True Range factor.
Wilder's approach is to trade commodities with high CSI values (relative to other
commodities). Because these commodities are highly volatile, they have the potential
to make the "most money in the shortest period of time." High CSI values imply
trending characteristics which make it easier to trade the security.
The Commodity Selection Index is designed for short-term traders who can handle
the risks associated with highly volatile markets.
WARNING:
- For purpose educate only
- This script to change bars colors.

Commodity Selection Index Strategy The Commodity Selection Index ("CSI") is a momentum indicator. It was
developed by Welles Wilder and is presented in his book New Concepts in
Technical Trading Systems. The name of the index reflects its primary purpose.
That is, to help select commodities suitable for short-term trading.
A high CSI rating indicates that the commodity has strong trending and volatility
characteristics. The trending characteristics are brought out by the Directional
Movement factor in the calculation--the volatility characteristic by the Average
True Range factor.
Wilder's approach is to trade commodities with high CSI values (relative to other
commodities). Because these commodities are highly volatile, they have the potential
to make the "most money in the shortest period of time." High CSI values imply
trending characteristics which make it easier to trade the security.
The Commodity Selection Index is designed for short-term traders who can handle
the risks associated with highly volatile markets.
Bitcoin Liquid Indexbravenewcoin.com
TV doesn't allow you to view the Bitcoin Liquid Index on lower time frames if you aren't a Premium subscriber >:(
I cheesed the system by recreating the formula that BNC uses. It isn't an exact replica, but very very close!
It can be slow to load due to the security( ) calls.
Default settings use the timeframe of the chart, however, you can set a custom timeframe if you wish.
Cheers
DasanC

Deribit Bitcoin IndexDeribit Bitcoin index, with hl2 as mid price substitute, as it tracks price more accurately than close alone.
Bitfinex excluded as Deribit has been doing so for a while now.

Damping IndexThis indicator was originally developed by Curtis McKallip Jr. (Stocks & Commodities, V.10:7 (296-299): "The Damping Index").
It indentifies bars where the highs and lows are getting close and closer. A high Damping Index value means that the difference between the high price and low price is becoming lower and the security price is reaching equilibrium. A low Damping Index value means that the difference between the high and low prices is increasing.
Good luck and happy trading!
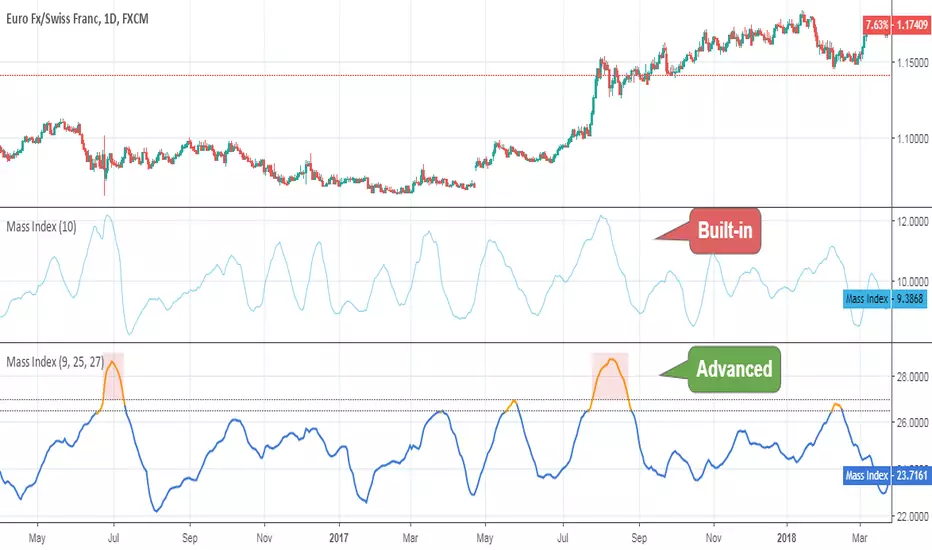
Mass IndexThis indicator was originally developed by Donald Dorsey (Stocks & Commodities, V.10:6 (June, 1992): "The Mass Index").
Specially for @AlexMayorov :
If indicator reaches 27 and then falls to below 26.5 then it could be a signal of potential trend reversal.
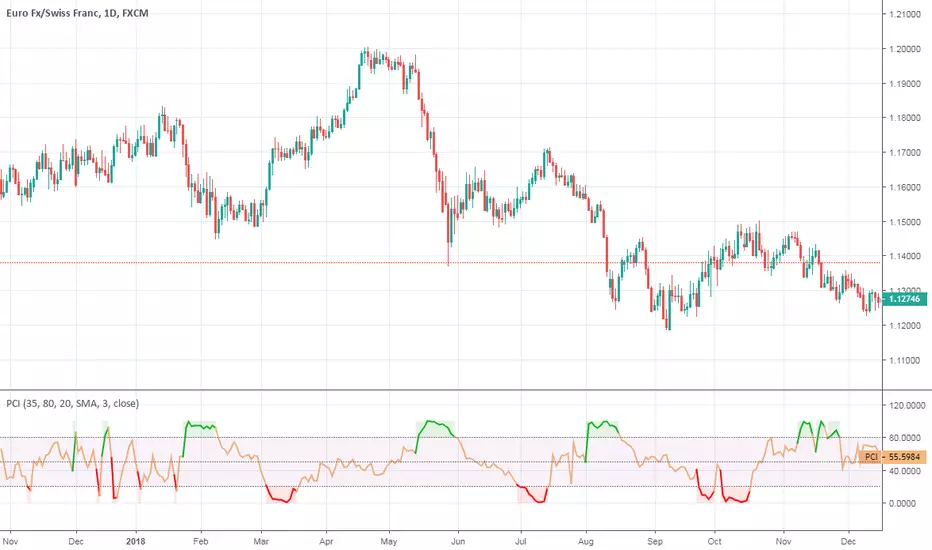
Phase Change IndexPhase Change Index script.
This indicator was developed and described by M. H. Pee (Stocks & Commodities V.22:5 (28-37): Phase Change Index).
Other indicators of M. H. Pee:
Average Directional Index-BuschiA simple modification of the built-in "Average Directional Index":
To identify wether there is an uptrend or a downtrend, the function color is conditional:
no trend: black
small uptrend (weak threshold): light green
big uptrend (strong threshold): green
small downtrend (weak threshold): light red
big downtrend (strong threshold): red
