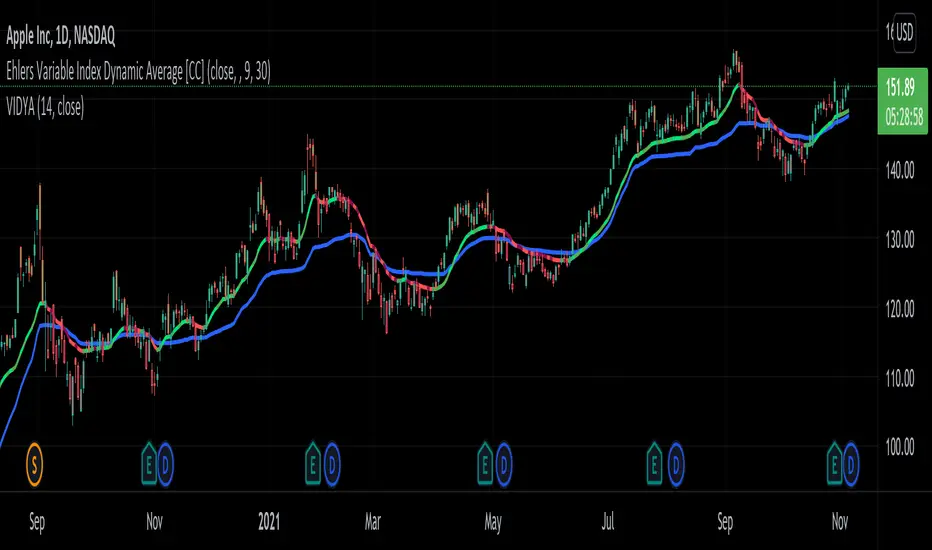
Ehlers Variable Index Dynamic Average [CC]The Variable Index Dynamic Average was created by Tushar Chande and this is a variation of that original formula created by John Ehlers. As you can see I have included the default Vidya from a script by @everget and as you can see the Ehlers version is able to follow the price much closer. I have included strong buy and sell signals in addition to normal ones and so darker colors are strong signals and lighter colors are normal ones. Buy when the line turns green and sell when it turns red.
Let me know if there are any other scripts you would like to see me publish!
스크립트에서 "index"에 대해 찾기
[LanZhu] - Bursa Index/Sector Trend With PortfolioDescription
Hi all, this is a simple indicator that shows trend of both KLCI and sectors of Bursa . The sector finding is using my Bursa_Sector library. Besides, I have also included portfolio tracker which is by Mohamed3nan in this script.
Usage
Top Trend - Malaysia KLCI Index Trend
Bottom Trend - Any Bursa Sector Trend
Portfolio Table - Copy from Portfolio Tracker by Mohamed3nan

True Strength Index Histogram [Futures Market]This is a modified version of True Strength Index to fit the scalping trading style in futures market

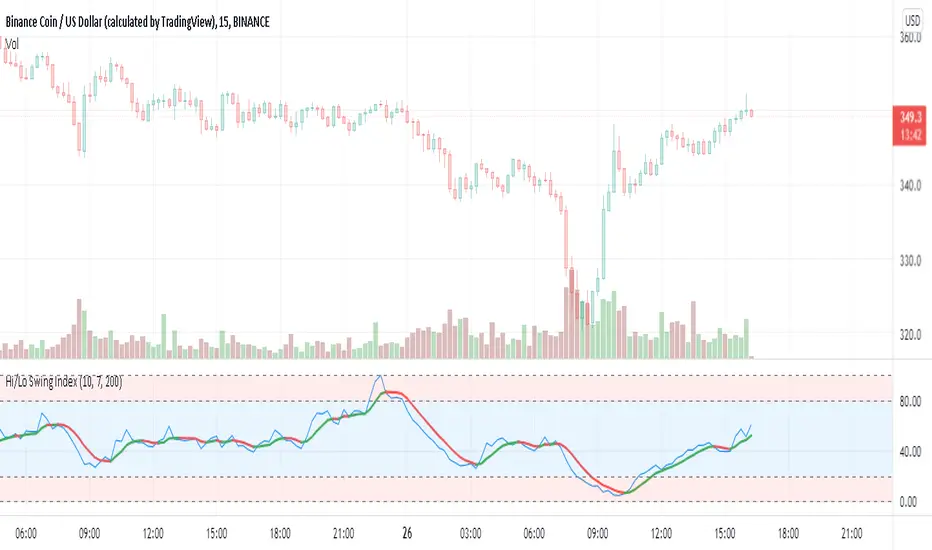
Hi/Lo Swing Index [by hajixde]Author: Hajixde
This indicator illustrates the High-to-Low variation. It works nicely on shorter time frames.
The index value is calculated based on the observation length (Memory Length). By changing this input, you can have a wider or shorter observation range.
MA Length is the moving average filter length, which smooths out the signal.
There is an additional smoothing function to make the output even smoother (Smoothing Length). Remember, that "Smoothing Length" is better to be less than "MA Length".
You may activate the trend direction.
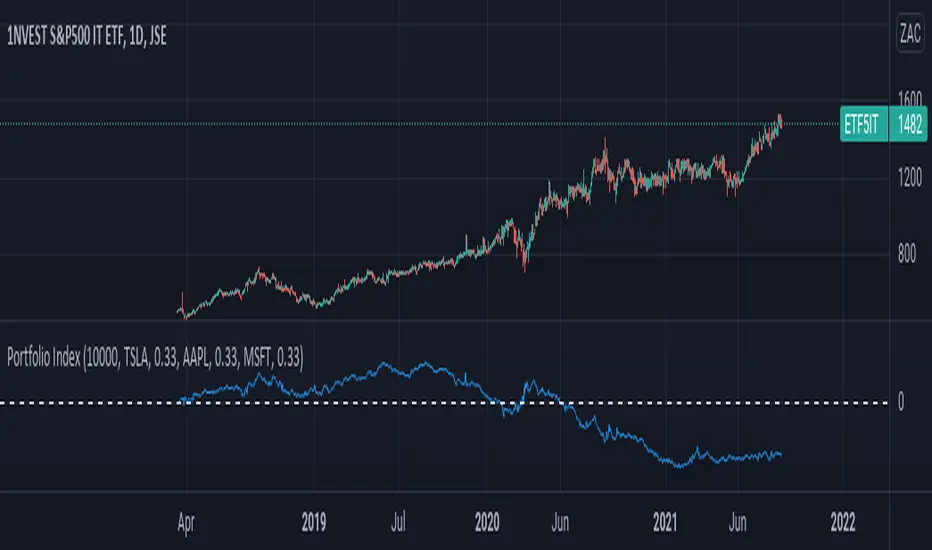
Portfolio IndexPortfolio Index Indicator
Compare a selected asset against a 3 assets portfolio.
Inputs :
- Equity : Default 10000, Initial capital for the portfolio
- %Holding : % of Holding for each Portfolio Element
- Asset in the chart as compared asset
Output :
- Delta between selected asset and portfolio
Ichimoku with MACD/ CMF/ TSIThis is a very powerful trend strategy designed for markets such as stocks market , stock index and crypto.
For time frames I found out that 1h seems to do the trick.
Components:
Ichimoku full pack
MACD histogram
CMF oscillator
TSI oscillator
Rules for entry
Long :
For Ichimoku:Tenkan part of cloud is bigger than kijun, Chikou is above 0 , close of a candle is above the Senkou
MACD histogram is above 0
CMF oscillator is positive and bigger than 0.1
TSI oscillator is above 0
Short:
For Ichimoku:Tenkan part of cloud is smaller than kijun, Chikou is below 0 , close of a candle is belowthe Senkou
MACD histogram is below 0
CMF oscillator is negative and below -0.1
TSI oscillator is below 0
Rules for exit
This strategy does not have any risk management inside. Instead it exits whenver it receives an opposite signal form the original one used for entry.
If you have any questions let me know !

Relative Strength Index 2x maThe relative strength index, represented as two moving averages with periods, one of which will be a multiple of the longer moving average by the amount you set.
The indicator can work both in automatic and manual mode. In automatic mode, the optimal periods are selected, in my opinion, depending on which timeframe is being analyzed at the current moment. In manual mode, you can set the required period yourself.
You can also set the method of smoothing the moving averages yourself and apply them to the opening or closing, the minimum of the bar, etc.
An important point: it is possible to enable/disable graphical functions that may not be required - just check the box next to the function that you want to see on your indicator.
Show ConDiv? - enabling / disabling the convergence/divergence function of the moving averages of the RSI indicator (not to be confused with the MACD for the asset price chart)
Show ma? - enabling/disabling the graphical display of the moving averages of the RSI indicator
Show RSI? - enabling / disabling the standard RSI indicator (if you want to see only it, check the box opposite; in this case, you need to remove the other two checkboxes)
I wish you good luck in building your trading plans, and remember: such indicators do not predict the future price movement on the chart, they only determine the characteristics of the price movement at the current time, taking into account historical data.

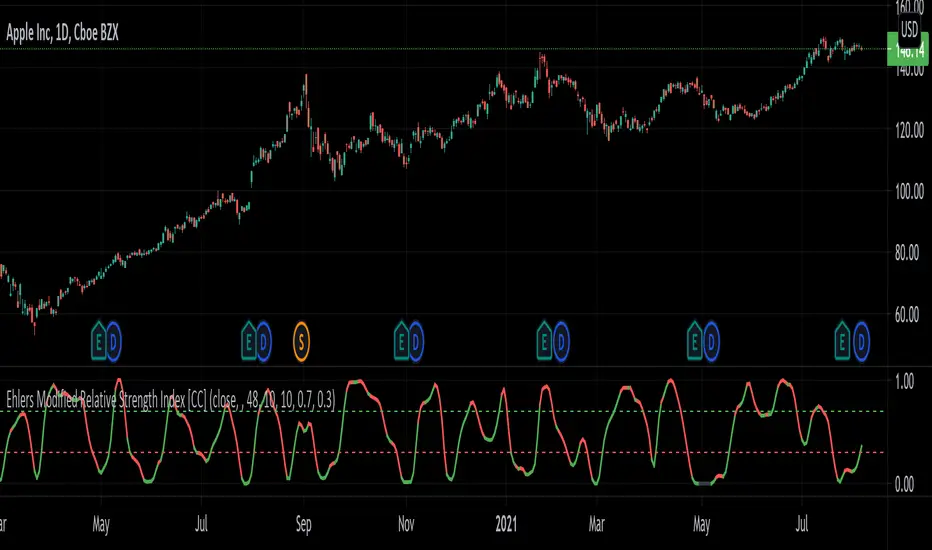
Ehlers Modified Relative Strength Index [CC]The Modified Relative Strength Index was created by John Ehlers (Cycle Analytics For Traders pgs 87-88) and this is a typical RSI that uses his roofing filter as the input. He smooths it with his own super smoother filter to provide signals. This indicator is extremely reactive and works in cycles so keep that in mind. I haven't been able to come up with clear buy and sell signals at this point so let me know if you any suggestions but I'm publishing the code to complete my goal of publishing all of his work one day. I will be publishing a bunch of Ehlers scripts in the next few weeks so stay tuned. What I recommend for buy and sell signals at this point are to buy when the indicator goes below the oversold line and starts going up and sell when the indicator goes below the oversold line a second time. Vice versa for sell signals.
Let me know if there are any other scripts you would like to see me publish!
Money Flow Index 5 min Strategy1 - Apply the 3 period Money Flow Index indicator to the 5 minute chart, using 0 and 100 as our oversold and overbought boundaries
2 - Wait for the MFI to reach overbought levels, that indicates the presence of "big sharks" in the market. Price needs to hold up
the first two MFI overbought occurrences of the day to be considered as a bullish entry signal.*
3 - We buy when the MFI = 100 and the next candle is a bullish candle with short wicks.
4 - We place our Stop Loss below the low of the trading day and we Take Profit during the first 60 minutes after taking the trade.
The logic above can be used in a mirrored fashion to take short entries, this is a custom parameter that can be modified from
the strategy Inputs panel.
* I'm using a SMA filter to avoid buying when the price is declining. Time frame was better at 15 min according to my test.

RedK Volume-Weighted Directional Efficiency Index (DXF)RedK Volume-Weighted Directional Efficiency Index (DXF) is a momentum indicator - that builds on Kaufman's Efficiency Ratio (ER) concept.
DXF utilizes a restricted +100/-100 oscillator to represent the "quality" of a trend, and does a good job in detecting the possibility of an upcoming trend change (in both direction and quality), improving our ability to make decisions on trade entries and exits.
Here's a quick background on Kaufman's Efficiency Ratio (ER)
------------------------------------------------------------------------------- Copied from internet sources -----------------------------
Developed by Perry Kaufman and introduced in his book “New Trading Systems and Methods”, the Efficiency Ratio reflects relative market speed to volatility. There are cases, when it is used as a filter, which helps a trader to avoid ”choppy” markets or trading ranges and to identify smoother trends.
ER is the result of dividing the net change in price movement during n-periods by the sum of all bar-to-bar price changes during the same n-periods. In case the market is trending smoother, then the ratio will be higher. In case the ratio shows readings in proximity to zero, this implies that market movement is inefficient and ”choppy”.
If the Efficiency Ratio shows a reading of +100, this means that the trading instrument is in a bull trend and trending with perfect efficiency.
If the Efficiency Ratio shows a reading of -100, this means that the trading instrument is in a bear trend and trending with perfect efficiency.
It is impossible for any instrument to have a perfect Efficiency ratio, because any movement against the major trend during the examined period of time would cause the ratio to drop.
If the Efficiency Ratio shows a reading above +30 (common setting for the "Significant Level"), this is indicative of a quality bull trend. If the ratio shows a reading below -30, this is indicative of a quality bear trend.
------------------------------------------------------------------------------- End of Copy -------------------------------------------------------------------------------------------------------
Kaufman also used the ER as basis for his famous Kaufman Adaptive Moving Average (KAMA).
Read more on ER & Kama here
How is DXF different from other ER-based indicators?
------------------------------------------------------------------
- Let's get the easy part out of the way: DXF has a "volume-weighting" option ✔
This option is OFF by default (to avoid errors with instruments with no volume data)
- once this option is applied, it provides the benefit of combining the volume effect into the calculation - those who appreciate the effect of volume on price action will hopefully find this option valuable
- The calculation of ER and how it can be "best utilized":
Let's examine the ER concept a bit closer: as a (math) concept, the (original) Efficiency Ratio (ER) takes the positive change of the price of an instrument during a certain period, and divide it by the sum of (absolute) price moves that were observed during that same period.
So, in the trader's language, we will be saying "out of a total of $20 moves (up and down) that MSFT did in the past 10 days, MSFT only made a net change of $5 up during that period" - so the "10-day ER" for MSFT in that case is 5/20 = 25% -- then we continue to observe that ongoing "10-day ER" and if it increases, we can expect that MSFT is going to establish a strong move (trend) up --- right?
the magic word here is to "observe the ongoing ER" - many of the ER based indicators just use the ER as calculated by Kaufman's original method. IMHO, these are just "point-in-time readings" - if we hope to get real insights from the ER, we need to take an average of that reading - for our "time window" we're interested in - and only then we can identify trends and patterns in the ER value as it changes during that windowss- DXF does that - and that allows a trader to say "the (weighted) 5-day average of the 10-day ER for MSFT is increasing, and that why i expect an up-trend" -- makes sense ? both the "Lookback" used to calculate the ER, and the Length of observed "window" for the Average ER are adjustable in DXF settings
Other Uses and Settings :
---------------------------------
- As a momentum indicator, DXF can predict an upcoming change of trend - cause that will reflect on the average ER value. There are few examples in the chart where the price move and ER trend *do not agree* - The trader can see these signs and take decisions accordingly
- DXF can help reveal best entries and exits: assume we are long-term bullish on MSFT, and we want to "buy the dip" - DXF can help reveal the time where price is recovering from extreme weakness - and that would be the ideal buy opportunities for us - exampled marked on the chart
- the Stepping & Smoothing options enable better visualization of the DXF plot. the "raw" DXF is still shown as a silver line.
- The "Significant Levels" option is available and is set to -20/+20 by default .. also adjustable in indicator settings.
- Please use DXF in combination with other trend and volume indicators, and with thorough chart / price action analysis and not in isolation to ensure you get proper signal confirmation for trades. In the chart above, you can see DXF combined with a moving average that can act as a filter and to confirm the price moves.
---------------------------------------------------
As usual, feedback & comments are welcome - if you find this work useful in your trading arsenal, please share a comment - i would be more than happy to learn about that. Good luck!

Euro Currency Volatility IndexThis script is written on request of a Forex trader who wanted the value of Euro Currency Volatility Index shown on his chart.
He wanted to have the value displayed to help him with his trades.
As I do not trade Forex, I do not know the co-relation of $EVZ with Forex currency pairs and wrote the script only on his request. Perhaps other Forex traders who understand $EVZ and Forex may also benefit from this script.
All the best to all.

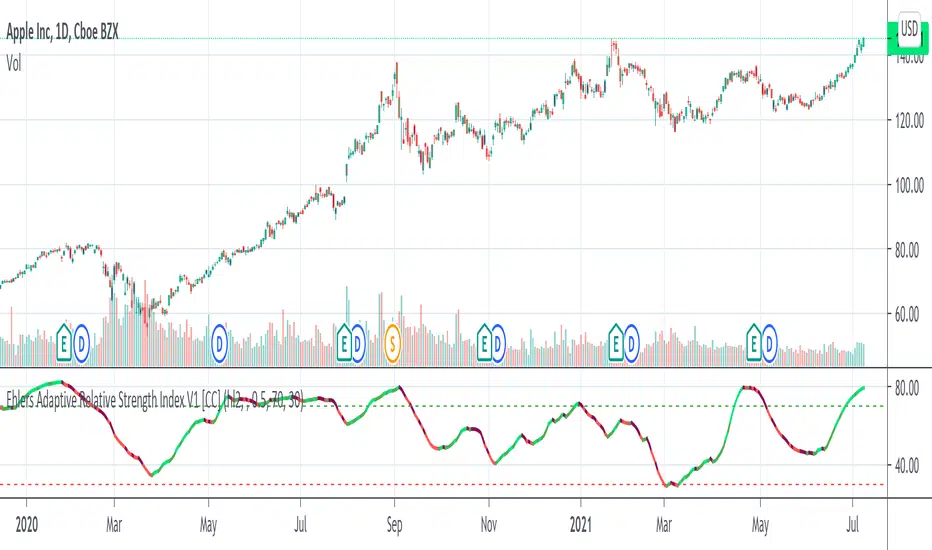
Ehlers Adaptive Relative Strength Index V1 [CC]The Adaptive Relative Strength Index was created by John Ehlers and this is his first version. I will of course publish his updated version at a later date along with publishing the final script from Jim Sloman's Ocean Theory book. I have changed his script to include extra smoothing to provide clear buy and sell signals. This is a version of a RSI that is very adaptive to changes by finding the length of the current cycle and using that to calculate the rsi and I use this same basic process to provide extra smoothing. A great strategy of course is to buy right after the indicator goes from below the oversold level to right above it and stay in until the indicator turns red or when it reaches the overbought level. I have included strong buy and sell signals in addition to normal ones and the darker colors mean strong signals and lighter colors are normal signals.
Let me know what other indicators you would like to see me publish!
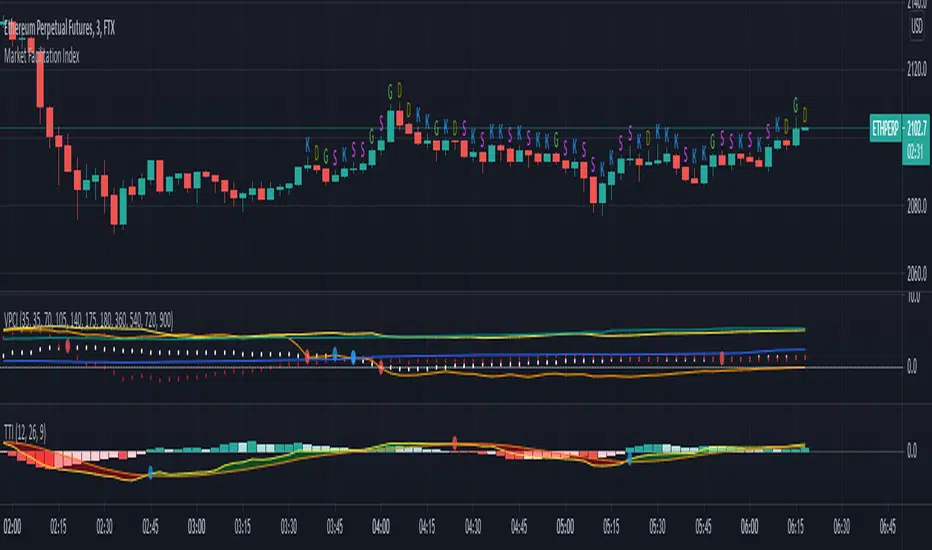
[MFI] Market Facilitation Index Written by Bruce-JSH
Implemented MFI(Market Facilitation Index) of Buff Dormeier
no license, no copyright.
There are no obligations or restrictions on you no matter how you do this script.
version 2021.07.11.a
1. First public release
2. G => Green(++), D => faDe bar(--), K => faKe bar(-+), S => Squat bar(+-)
Volatility IndexThis indicator is based on Historical Volatility (HV) built-in indicator with minor tweaks to match the Bitcoin Volatility Index (from Bybt).
Also, you can select a symbol to compare its volatility with the volatility of the currently selected symbol.

Folded Relative Strength Index [CC]The Folded Relative Strength Index was created by Richard Poster (Stocks and Commodities July 2021 pg 21) and this indicator provides both trend strength but also momentum and of course reversal points using the overbought and oversold markers. If the indicator line is above the mid line then this shows upward momentum and when it falls below the midline then this means it is losing momentum. When the indicator rises above the signal line then this shows upward trend strength and vice versa. Buy when the indicator line turns green and sell when it turns red.
Let me know if there are any other indicators you would like to see me publish!

Combo Backtest 123 Reversal & Relative Volatility Index This is combo strategies for get a cumulative signal.
First strategy
This System was created from the Book "How I Tripled My Money In The
Futures Market" by Ulf Jensen, Page 183. This is reverse type of strategies.
The strategy buys at market, if close price is higher than the previous close
during 2 days and the meaning of 9-days Stochastic Slow Oscillator is lower than 50.
The strategy sells at market, if close price is lower than the previous close price
during 2 days and the meaning of 9-days Stochastic Fast Oscillator is higher than 50.
Second strategy
The RVI is a modified form of the relative strength index (RSI).
The original RSI calculation separates one-day net changes into
positive closes and negative closes, then smoothes the data and
normalizes the ratio on a scale of zero to 100 as the basis for the
formula. The RVI uses the same basic formula but substitutes the
10-day standard deviation of the closing prices for either the up
close or the down close. The goal is to create an indicator that
measures the general direction of volatility. The volatility is
being measured by the 10-days standard deviation of the closing prices.
WARNING:
- For purpose educate only
- This script to change bars colors.

Table: Relative Strength Index (Multiple Timeframes) DESCRIPTION
It is the most popular and dependent Indicator, Relative Strength Index (RSI) . Now, I put inside a table to view chart momentum from Multiple timeframes.
This indicator tells different Timeframe (30 minutes, 1 hour, 4 hour, 1 day, 1 week, 1 month) of RSI value within table form.
HOW TO USE
Can consider a Long position when all timeframes go oversold while Short position when all timeframes go overbought. Alarm function is available. It sounds as all timeframes are overbought or oversold.
Modified The source of indicator from ©BeeHolder named "Performance"

Trader Pressure Index (TPX)This is my take on the script by RedK
I kept the algorithm exactly the same, but changed the layout and the default look back period. Most important is that the resulting line, the TPX, is now a histogram with green and red staves.
To put the histogram on a logical place in the graph, I changed the way the control/dominance level is implemented, it now lowers or highers the whole graph, this way the zero level becomes the ‘no interest’ level.
I added two horizontal lines at a distance of 40 because I feel that this is sort of an oversold / overbought indication. In practice not very convincing, but provides a visual comparison.
In this layout I explain that grass is growing on bull hills peaking up behind the foreground and blood is dripping from the bear hills.
Enjoy.

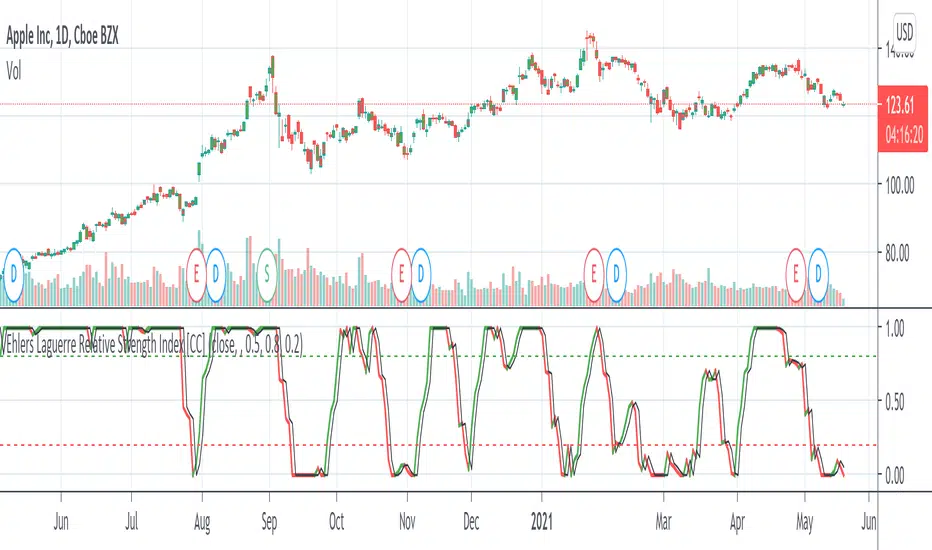
Ehlers Laguerre Relative Strength Index [CC]The Laguerre Relative Strength Index was created by John Ehlers and this is essentially his version of the RSI but I find that the buy and sell signals work better with his version as you can see. Buy when the line turns green and sell when the line turns red.
Let me know if there are any other indicators you want me to publish!
VWMACDV2 w/Intraday Intensity Index Histogram & VBCB Hello traders! In this script i tried to combine Kıvanç Özbilgiç's Volume Based Coloured Bars, Volume Weighted Macd V2 and Intraday Intensity Index developed by Dave Bostian and added to Tradingview by Kıvanç Özbilgiç. Let's see what we got here;
VBCB, Paints candlestick bars according to the volume of that bar. Period is 30 by default. If you're trading stocks, 21 should be better.
Volume Weighted Macd V2, "Here in this version; Exponential Moving Averages used and Weighted by Volume instead of using only vwma (Volume Weighted Moving Averages)." Says, Kıvanç Özbilgiç.
III, "A technical indicator that approximates the volume of trading for a specified security in a given day. It is designed to help track the activity of institutional block traders and is calculated by subtracting the day's high and low from double the closing price, divided by the volume and multiplied by the difference between the high and the low."
*Histogram of vwmacd changes color according to the value of III. (Green if positive, yellow if negative value)*
VWMACD also comes with the values of 21,13,3... Which are fibonacci numbers and that's how i use it. You can always go back to the good old 26,12,9.
Other options according to the fibonacci numbers might be= 21,13,5-13,8,3-13,8,5... (For shorter terms of trading)
Trading combined with the bollinger bands is strongly advised for both VWMACD and III. VBCB is just the candy on top :)
Enjoy!

TDI - Traders Dynamic Index + RSI Divergences + Buy/Sell SignalsTraders Dynamic Index + RSI Divergences + Buy/Sell Signals
Credits to LazyBear (original code author) and JustUncleL (modifications)..
I added some new features:
1- RSI Divergences (Original code from 'Divergence Indicator')
2- Buy/Sell Signals with alerts (Green label 'Buy' - Red label 'Sell')
3- Background colouring when RSI (Green line) crosses above MBL (yellow line)
- Buy and Sell Signals are generated using Dean Malone's method (The Author of the TDI indicator) as mentioned in his PDF: (( www.forexfactory.com )), according to:
** Buy (Green Label) = RSI > 50, Red line, & Yellow line
** Sell (Red Label) = RSI < 50, Red line, & Yellow line
- I found that the best quality long trades generated when RSI crosses above red line, yellow line and they are all above 50, and vice versa for sell trades.
-I figured out another way to generate Buy/Sell Signals when RSI crosses above the yellow line, and you can stay with the trade till RSI crosses under the yellow line (I made a background colouring for that to be easily detected)
Hope you all wonderful trades..
مؤلف المؤشر هو (Dean Malone)
وكتب LazyBear كوده في tradingview
وأضاف JustUncleL بعض التعديلات عليه
أضفت إليه بعض المزايا الأخرى المتمثلة في:
1- رصد انحرافات مؤشر القوة النسبية
2- إشارات بيع وشراء بناء على طريقة مؤلف المؤشر
3- تظليل بالأخضر للمنطقة التي يعبر فيها مؤشر القوة النسبية الخط الأوسط (الخط الأصفر)
إشارات البيع والشراء تكون كالتالي:
** الشراء عندما يكون مؤشر القوة النسبية فوق الخط الأحمر وفوق خط الـ 50 وفوق الخط الأصفر
** البيع عندما يكون مؤشر القوة النسبية تحت الخط الأحمر وتحت خط الـ 50 وتحت الخط الأصفر
** أفضل إشارات الشراء حينما يعبر مؤشر القوة النسبية فوق الخط الأحمر والأصفر، ويكونوا جميعا فوق خط الـ 50، والعكس بالنسبة لإشارات البيع
يمكن استخدام المؤشر في دخول صفقات متوسط المدى، وذلك عندما يعبر مؤشر القوة النسبية فوق الخط الأصفر (قمت بتظليل المنطقة بالأخضر لسهولة رصدها) والخروج من الصفقة إذا نزل مؤشر القوة النسبية عن الخط الأصفر،
يرجى التنبه إلى أن الدخول والخروج يكون بأسباب فنية مدروسة، والمؤشر يدعم قراراتك فقط، ولا يمكن الاعتماد عليه منفردا في تحديد نقاط الدخول أوالخروج.
تجارة موفقة لكم جميعا :)

Combo Backtest 123 Reversal & Perfomance indexThis is combo strategies for get a cumulative signal.
First strategy
This System was created from the Book "How I Tripled My Money In The
Futures Market" by Ulf Jensen, Page 183. This is reverse type of strategies.
The strategy buys at market, if close price is higher than the previous close
during 2 days and the meaning of 9-days Stochastic Slow Oscillator is lower than 50.
The strategy sells at market, if close price is lower than the previous close price
during 2 days and the meaning of 9-days Stochastic Fast Oscillator is higher than 50.
Second strategy
The Performance indicator or a more familiar term, KPI (key performance indicator),
is an industry term that measures the performance. Generally used by organizations,
they determine whether the company is successful or not, and the degree of success.
It is used on a business’ different levels, to quantify the progress or regress of a
department, of an employee or even of a certain program or activity. For a manager
it’s extremely important to determine which KPIs are relevant for his activity, and
what is important almost always depends on which department he wants to measure the
performance for. So the indicators set for the financial team will be different than
the ones for the marketing department and so on.
Similar to the KPIs companies use to measure their performance on a monthly, quarterly
and yearly basis, the stock market makes use of a performance indicator as well, although
on the market, the performance index is calculated on a daily basis. The stock market
performance indicates the direction of the stock market as a whole, or of a specific stock
and gives traders an overall impression over the future security prices, helping them decide
the best move. A change in the indicator gives information about future trends a stock could
adopt, information about a sector or even on the whole economy. The financial sector is the
most relevant department of the economy and the indicators provide information on its overall
health, so when a stock price moves upwards, the indicators are a signal of good news. On the
other hand, if the price of a particular stock decreases, that is because bad news about its
performance are out and they generate negative signals to the market, causing the price to go
downwards. One could state that the movement of the security prices and consequently, the movement
of the indicators are an overall evaluation of a country’s economic trend.
WARNING:
- For purpose educate only
- This script to change bars colors.
