Fair Value Gaps Mitigation Oscillator [LuxAlgo]The Fair Value Gaps Mitigation Oscillator is an oscillator based on the traditional Fair Value Gaps (FVGs) imbalances. The oscillator displays the current total un-mitigated values for the number of FVGs chosen by the user.
The indicator also displays each New FVG as a bar representing the current ratio of the New FVG in relation to the current un-mitigated total for its direction.
🔶 USAGE
When an FVG forms, it is often interpreted as strong market sentiment in the direction of the gap. For example, an upward FVG during an uptrend is typically seen as a confirmation of the strength and continuation of the trend, as it indicates that buyers are willing to purchase at higher prices without much resistance, suggesting strong demand and positive sentiment.
By analyzing the mitigation (or lack thereof), we can visualize the increase of directional strength in a trend. This is where the proposed oscillator is useful.
🔶 DETAILS
The oscillator's values are expressed as Percentages (%). Each FVG is allocated 100% of the total of its width with a max potential value of 100 and minimum potential value of 0.
Based on the "FVG Lookback" Input, the FVGs are scaled to fit within the range of +1 to -1. Using a higher "FVG Lookback" value will allow you to get indications of longer-term trends.
A higher value of the normalized bullish FVG areas suggest a stronger and cleaner uptrend, while lower values of the bearish the normalized bullish FVG areas suggest a stronger and cleaner downtrend.
+1 or -1 indicates that there is a Full Lookback of FVGs, and each one is fully un-mitigated, and the opposite direction of FVGs is entirely Mitigated.
When the price closes over/under or within an FVG it begins to get mitigated, when this happens the % of mitigation is subtracted from the total.
When a New FVG is formed, a Histogram bar is created representing the ratio of the current FVG's width to the total width off all un-mitigated FVGs.
The entire bar represents 100% of total un-mitigated FVG Width.
The filled area represents the current FVG's width relative to the whole.
A 50% hash mark is also displayed for reference.
🔶 SETTINGS
FVG Lookback - Determines the number of FVGs (Bullish and Bearish Pairs) to keep in memory for analysis.
스크립트에서 "imbalance"에 대해 찾기

ICT Fair Value Gap [LM]Hello traders,
I would like to present you ICT Fair Value Gap script. The idea is the same as in my other script to look form imbalances. I have improved the previous script from teaching of ICT and created this script to train the eye to see those gaps. Shrinking option also shows if the gap has been already filled and also in case gap is filled you can get alert in case you will set it up .
The script has two settings:
general settings - definition of volatility condition for middle candle
box settings - setting for boxes, box colors, shrinking
I hope you enjoy it,
Lukas

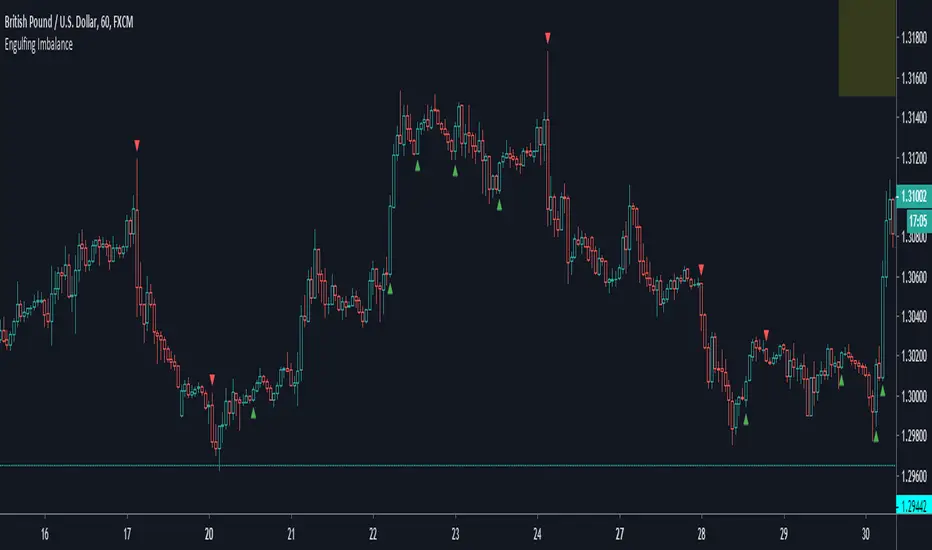
Engulfing ImbalanceShows Engulfing candles which are immediately followed by an imbalance. Useful to quickly identify impulsive moves and future reversal areas.
FVG Heatmap [Hash Capital Research]FVG Map
FVG Map is a visual Fair Value Gap (FVG) mapping tool built to make displacement imbalances easy to see and manage in real time. It detects 3-candle FVG zones, plots them as clean heatmap boxes, tracks partial mitigation (how much of the zone has been filled), and summarizes recent “fill speed” behavior in a small regime dashboard.
This is an indicator (not a strategy). It does not place trades and it does not publish performance claims. It is a market-structure visualization tool intended to support discretionary or systematic workflows.
What this script detects
Bullish FVG (gap below price)
A bullish FVG is detected when the candle from two bars ago has a high below the current candle’s low.
The zone spans from that prior high up to the current low.
Bearish FVG (gap above price)
A bearish FVG is detected when the candle from two bars ago has a low above the current candle’s high.
The zone spans from the current high up to that prior low.
What makes it useful
Heatmap zones (clean, readable FVG boxes)
Bullish zones plot below price. Bearish zones plot above price.
Partial fill tracking (mitigation progress)
As price trades back into a zone, the script visually shows how much of the zone has been filled.
Mitigation modes (your definition of “filled”)
• Full Fill: price fully trades through the zone
• 50% Fill: price reaches the midpoint of the zone
• First Touch: price touches the zone one time
Optional auto-cleanup
Optionally remove zones once they’re mitigated to keep the chart clean.
Fill-Speed Regime Dashboard
When zones get mitigated, the script records how many bars it took to fill and summarizes the recent environment:
• Average fill time
• Median fill time
• % fast fills vs % slow fills
• Regime label: choppy/mean-revert, trending/displacement, or mixed
How to use
Use FVG zones as structure, not guaranteed signals.
• Bullish zones are often watched as potential support on pullbacks.
• Bearish zones are often watched as potential resistance on rallies.
The fill-speed dashboard helps provide context: fast fills tend to appear in more rotational conditions, while slow fills tend to appear in stronger trend/displacement conditions.
Alerts
Bullish FVG Created
Bearish FVG Created
Notes
FVGs are not guaranteed reversal points. Fill-speed/regime is descriptive of recent behavior and should be treated as context, not prediction. On realtime candles, visuals may update as the bar forms.

ICT FVG & Swing Detector Basic by Trader RiazICT FVG & Swing Detector Basic by Trader Riaz
Unlock Precision Trading with the Ultimate Fair Value Gap (FVG) and Swing Detection Tool!
Developed by Trader Riaz , the ICT FVG and Swing Detector Basic is a powerful Pine Script indicator designed to help traders identify key market structures with ease. Whether you're a day trader, swing trader, or scalper, this indicator provides actionable insights by detecting Bullish and Bearish Fair Value Gaps (FVGs) and Swing Highs/Lows on any timeframe. Perfect for trading forex, stocks, crypto, and more on TradingView!
Key Features:
1: Bullish and Bearish FVG Detection
- Automatically identifies Bullish FVGs (highlighted in green) and Bearish FVGs (highlighted in red) to spot potential reversal or continuation zones.
- Displays FVGs as shaded boxes with a dashed midline at 70% opacity, making it easy to see the midpoint of the gap for precise entries and exits.
- Labels are placed inside the FVG boxes at the extreme right for clear visibility.
2: Customizable FVG Display
- Control the number of Bullish and Bearish FVGs displayed on the chart with user-defined inputs (fvg_bull_count and fvg_bear_count).
- Toggle the visibility of Bullish and Bearish FVGs with simple checkboxes (show_bull_fvg and show_bear_fvg) to declutter your chart.
3: Swing High and Swing Low Detection
- Detects Swing Highs (blue lines) and Swing Lows (red lines) to identify key market turning points.
- Labels are positioned at the extreme right edge of the lines for better readability and alignment.
- Customize the number of Swing Highs and Lows displayed (swing_high_count and swing_low_count) to focus on the most recent market structures.
4: Fully Customizable Display
- Toggle visibility for Swing Highs and Lows (show_swing_high and show_swing_low) to suit your trading style.
- Adjust the colors of Swing High and Low lines (swing_high_color and swing_low_color) to match your chart preferences.
5: Clean and Efficient Design
- Built with Pine Script v6 for optimal performance on TradingView.
- Automatically removes older FVGs and Swing points when the user-defined count is exceeded, keeping your chart clean and focused.
- Labels are strategically placed to avoid clutter while providing clear information.
Why Use This Indicator?
Precision Trading: Identify high-probability setups with FVGs and Swing points, commonly used in Smart Money Concepts (SMC) and Institutional Trading strategies.
User-Friendly: Easy-to-use inputs allow traders of all levels to customize the indicator to their needs.
Versatile: Works on any market (Forex, Stocks, Crypto, Commodities) and timeframe (1M, 5M, 1H, 4H, Daily, etc.).
Developed by Trader Riaz: Backed by the expertise of Trader Riaz, a seasoned trader dedicated to creating tools that empower the TradingView community.
How to Use:
- Add the Custom FVG and Swing Detector to your chart on TradingView.
- Adjust the input settings to control the number of FVGs and Swing points displayed.
- Toggle visibility for Bullish/Bearish FVGs and Swing Highs/Lows as needed.
- Use the identified FVGs and Swing points to plan your trades, set stop-losses, and target key levels.
Ideal For:
- Traders using Smart Money Concepts (SMC), Price Action, or Market Structure strategies.
- Those looking to identify liquidity grabs, imbalances, and trend reversals.
- Beginners and advanced traders seeking a reliable tool to enhance their technical analysis.
Happy trading!

Fair Value Gaps (FVG) [UAlgo]A fair value gap is especially popular among price action traders and occurs when there are inefficiencies or imbalances in the market, or when the buying and selling are not equal. Fair value gaps can become a magnet for the price before continuing in the same direction.
🔶 Key Features :
Fair Value Gap Identification:
Bullish fair value gaps occur when the current market price exceeds the previous high. The indicator identifies bullish gaps by comparing the low of the current candle with the high of the candle two candles ago . If the low of the current candle is higher than the high two candles ago and the closing price of the previous candle is also higher than the high two candles ago, a bullish fair value gap is detected.
Bearish fair value gaps occur when the current market price falls below the previous low. The indicator identifies bearish gaps by comparing the high of the current candle with the low of the candle two candles ago. If the high of the current candle is lower than the low two periods ago and the closing price of the previous candle is also lower than the low two candles ago, a bearish fair value gap is detected.
Fair Value Gap Filter :
ATR measures market volatility by analyzing the range of price movements over a specified period. It provides insights into the average price range that a security experiences within a given timeframe. After the ATR is calculated, a Simple Moving Average (SMA) is computed for the ATR values. This moving average smoothens out the ATR data, providing a clearer indication of the average volatility levels over time.
When the filter is active, fair value gaps are identified only if they occur during periods of relatively higher volatility, as indicated by the ATR being greater than the SMA. This helps in refining and obtaining the detection of stronger fair value gaps
An example with FVG filtering off:
An example with FVG filtering on:
Customizable Settings: Users have the flexibility to customize various parameters to suit their trading preferences. They can adjust settings such as the number of fair value gaps displayed, mitigation method (either based on closing prices or wicks), and apply filters based on Average True Range (ATR) to refine gap detection.
🔶 Disclaimer :
Use with Caution: Trading involves significant risk, and this indicator should be used with caution. While it can help identify potential trading opportunities, it does not guarantee profits and may sometimes provide false signals.
Not Financial Advice: The information provided by the Fair Value Gaps indicator is for educational and informational purposes only and should not be considered as financial advice. Traders should conduct their own research and consult with financial professionals before making any trading decisions.
Past Performance: Past performance is not indicative of future results. Historical price movements analyzed by the indicator may not accurately predict future market behavior.

Strong Demands & Supplies + Liquidity | Zonas de Compra e VendaThis indicator is inspired on the Smart Money Concepts indicator (Credits to @LuxAlgo) and it was optimized to show only the most relevant demand and supply zones (premium) on every time frame - but on higher time frames (1H and above) the zones are more relevant and stronger, meaning these zones can handle the price for longer time.
I've added a new feature that includes the Liquidity lines in order to add more confluence and importance to a demand or supply zone: when a demand or supply zone has strong liquidity (like weekly or monthly) next to it means that zone can be a strongest price target.
- Blue Line: Daily liquidity
- Yellow Line: Weekly Liquidity
- Purple Line: Monthly Liquidity
Main Features:
- Displays the most relevant demand and supply zones (green and red boxes) and which ones are strong and weak
- Displays the relevant change of character and break of structure
- Displays the previous day highest price and previous day lowest price
- Display imbalances between sell and buy orders (purple boxes)
- Displays the liquidity areas with lines on each point.
- It works for Forex and Cryptocurrency as well.
Portuguese:
Este indicador é inspirado no Smart Money Concepts (Créditos para @LuxAlgo) e foi otimizado para mostrar apenas as zonas de procura e oferta mais relevantes em cada time frame - mas em time frames maiores as zonas são mais relevantes e mais fortes.
Adicionei uma nova funcionalidade que inclui as linhas de Liquidez de forma a adicionar mais confluência e importância a uma zona de procura ou oferta: quando uma zona de procura ou oferta tem forte liquidez (como semanal/linha amarela ou mensal/linha roxa) junto a ela significa que aquela zona pode ser um alvo de preço mais forte.
- Linha Azul: Liquidez diária
- Linha Amarela: Liquidez Semanal
- Linha Roxa: Liquidez Mensal
Principais características:
- Exibe as zonas de procura e oferta mais relevantes (zonas a verde e zonas a vermelho) e quais delas são fortes e fracas
- Exibe a mudança relevante de caráter e quebra de estrutura
- Exibe o preço mais alto do dia anterior e o preço mais baixo do dia anterior
- Exibe as imbalances entre as ordens de venda e compra (zonas a roxo)
- Exibe as zonas de maior liquidez através de linhas no gráfico
- Funciona tanto para Forex como para Criptomoedas

MOMO – Imbalance Trend (SIMPLE BUY/SELL)MOMO – Imbalance Trend (SIMPLE BUY/SELL)
This strategy combines trend breaks, imbalance detection, and first-tap supply/demand entries to create a clean and disciplined trading model.
It automatically highlights imbalance candles, draws fresh zones, and waits for the first retest to deliver precise BUY and SELL signals.
Performance
On optimized settings, this strategy shows an estimated 57%–70% win-rate, depending on the asset and timeframe.
Actual performance may vary, but the model is built for consistency, discipline, and improved decision-making.
How it works
Detects trend structure shifts (BOS / Break of Trend)
Identifies displacement (imbalance) candles
Creates supply and demand zones from imbalance origin
Waits for first tap only (no second chances)
Confirms direction using trend logic
Generates clean BUY/SELL arrows
Automatic SL/TP based on user settings
Features
Clean BUY/SELL markers
Auto-drawn supply & demand zones
Trend break markers
Imbalance tags
Smart first-tap confirmation
Customizable stop loss & take profit
Works on crypto, gold, forex, indices
Best on M5–H1 for day trading
Note
This strategy is designed for day traders who want clarity, structure, and zero emotional trading.
Use it with discipline — and it will serve you well.
Good luck, soldier.

Volume Imbalance Heatmap + Delta Cluster [@darshakssc]🔥 Volume Imbalance Heatmap + Delta Cluster
Created by: @darshakssc
This indicator is designed to visually reveal institutional pressure zones using a combination of:
🔺 Delta Cluster Detection: Highlights candles with strong body ratios and volume spikes, helping identify aggressive buying or selling activity.
🌡️ Real-Time Heatmap Overlay: Background color dynamically adjusts based on volume imbalance relative to its moving average.
🧠 Adaptive Dashboard: Displays live insights into current market imbalance and directional flow (Buy/Sell clusters).
📈 How It Works:
A candle is marked as a Buy Cluster if it closes bullish, has a strong body, and exhibits a volume spike above average.
A Sell Cluster triggers under the inverse conditions.
The heatmap shades the chart background to reflect areas of high or low imbalance using a color gradient.
⚙️ Inputs You Can Adjust:
Volume MA Length
Minimum Body Ratio
Imbalance Multiplier Sensitivity
Dashboard Location
🚫 Note: This is not a buy/sell signal tool, but a visual aid to support institutional flow tracking and confluence with your existing system.
For educational use only. Not financial advice.

Short Term Imbalance ContinuationShort Term Imbalance Continuation
This indicator identifies short-term trading opportunities based on imbalance situations followed by consolidation.
Functionality:
The indicator looks for a specific candle formation:
1. An imbalance candle where the low is above the high of the following candle (bearish) or the high is below the low of the following candle (bullish)
2. Followed by 1-2 inside candles (close within the range of the previous candle) in the same direction
Theory:
The formation is based on two important market mechanisms:
1. Imbalance and Momentum:
- The imbalance shows a strong move with one-sided orderflow dominance
- Inside candles in the same direction confirm that the opposing side cannot take control
2. Consolidation Behavior:
- Inside candles are a classic consolidation pattern
- They show that the market is "digesting" the previous strong movement
- Consolidation within the range indicates controlled accumulation/distribution
- Particularly relevant when large market participants are building or expanding positions
- Consolidation at higher/lower levels confirms the dominance of the trend direction
Settings:
- Choice between one or two inside candles for different consolidation phases
- Option whether both inside candles must have the same direction
- Customizable colors for bullish and bearish signals
Application:
The indicator is particularly suitable for:
- Trend confirmation after strong movements
- Entry into pullbacks during trends
- Identification of continuation setups after consolidations
- Detection of accumulation/distribution phases of large market participants
Notes:
- Best used in combination with higher timeframe trend
- Particularly meaningful at important price zones
- Consolidation phases can indicate institutional interest
- The length of consolidation (one vs. two inside candles) can indicate different accumulation phases

ICT Flow Matrix [Ultimate]📊 Overview
ICT Flow Matrix is a comprehensive, all-in-one Smart Money Concepts (SMC) indicator built for traders who follow ICT (Inner Circle Trader) methodology. This indicator consolidates over 15 institutional trading concepts into a single, highly customizable tool—eliminating chart clutter from multiple indicators while providing deep market structure analysis.
Whether you're identifying liquidity pools, tracking order flow, or timing entries during ICT Macro windows, this indicator delivers institutional-grade analysis directly on your chart.
Pro Tip: use with ICT Market Regime Detector for clear language reads on everything.
⚡ Key Features
🎯 Price Delivery Arrays (PDAs)
Fair Value Gaps (FVG) — Automatic detection with customizable mitigation tracking (Wick Touch, 50% CE, Full Close)
Inverse FVGs (iFVG) — Identifies when FVGs fail and flip, creating new tradeable zones
Order Blocks (OB) — Last opposing candle before impulsive moves with adjustable impulse strength
Breaker Blocks (BB) — Automatically generated when Order Blocks fail
Rejection Blocks (RB) — Strong wick rejections indicating institutional defense
Volume Imbalances (VIMB) — Gaps between candle bodies showing aggressive institutional activity
📐 Market Structure & Liquidity
Market Structure Shifts (MSS) — Real-time detection of bullish/bearish structure breaks
Equal Highs/Lows (EQH/EQL) — Liquidity pools where stop losses accumulate
Buy-Side/Sell-Side Liquidity (BSL/SSL) — Swing point liquidity levels with sweep detection
Premium/Discount Zones — Visual shading showing institutional buying/selling areas
OTE Zone (61.8%-79%) — Optimal Trade Entry zone for high-probability entries
⏰ Time-Based Analysis
ICT Macro Times — All nine 30-minute algorithmic windows (02:45, 03:45, 04:45, 09:45, 10:45, 13:45, 14:45, 15:15, 15:45 NY Time)
Killzone Sessions — Asia, London, NY AM, NY PM with customizable times
Session Opens — Weekly, Monthly, Daily opening prices
Previous Period H/L — PDH/PDL, PWH/PWL, PMH/PML levels
📏 Dealing Ranges
Multi-Timeframe Ranges — 21-Day, 3-Day, Daily dealing ranges
Session Ranges — Asia, London, NY dealing ranges with equilibrium
Fibonacci Structure — 0%, 50% (EQ), 100% levels with P/D shading
🕯️ HTF Orderflow
Higher Timeframe Candles — Display up to 6 HTF candles with auto-timeframe selection
Candle Timer — Countdown to next HTF candle close
O/H/L Reference Lines — Current HTF open, high, low levels extended on chart
🎨 Visual Customization
5 Theme Presets — Dark Pro, Light Clean, Neon, Classic, Custom
Full Color Control — Customize every element individually
Zone Styles — Filled or Border Only options
Mitigation Effects — Visual fade when zones are mitigated
📋 Smart Dashboard
Real-Time Status — Structure bias, zone position, active session, OTE status
Confluence Score — Algorithmic scoring when multiple concepts align
Zone Counters — Active FVG, OB, BB, RB, VIMB, liquidity levels
3 Display Modes — Minimal, Compact, Detailed
🔔 Comprehensive Alert System
40+ Alert Conditions including:
FVG/OB/BB/RB/VIMB formation
Liquidity sweeps (EQH, EQL, BSL, SSL)
Market Structure Shifts
OTE zone entry
Macro time windows
Session opens
High confluence zones
Combo alerts (Macro + Confluence)
📖 How To Use
For Swing/Position Traders:
Enable HTF Orderflow to identify dominant trend direction
Use Dealing Ranges (3D, 21D) to find premium/discount zones
Look for OB/FVG confluence in discount (longs) or premium (shorts)
Confirm with MSS for trend alignment
For Day/Intraday Traders:
Mark the Asian Range during pre-market
Wait for London or NY AM Killzone
Enter during ICT Macro windows when price reaches FVG/OB in OTE zone
Target opposite liquidity (BSL for longs, SSL for shorts)
Confluence Trading:
Dashboard shows real-time confluence score
Score ≥ 3 indicates multiple ICT concepts aligned
Higher scores = higher probability setups
⚙️ Recommended Settings
Trading Style FVG Max OB Max History Bars HTF Candles
Scalping 3-5 2-3 100-200 3-4 Day Trading 5-8 3-5 200-400 4-5
Swing Trading 8-12 5-8 400-800 5-6
🎯 Best Practices
✅ Do:
Use HTF bias before taking LTF entries
Wait for Macro time windows for highest probability
Combine MSS + FVG/OB + OTE for A+ setups
Let mitigated zones fade (use Mitigation Fade setting)
❌ Avoid:
Trading against HTF structure
Entries outside Killzones (lower probability)
Ignoring liquidity targets
Over-cluttering chart (disable unused features)
📝 Version History
v6.0 (Current)
Complete rewrite in PineScript v6
Added ICT Macro Times with bracket/background styles
Enhanced confluence detection algorithm
Improved HTF candle rendering with multiple styles
Added Inverse FVG detection
Session-based Dealing Ranges
Performance optimizations
40+ alert conditions
⚠️ Disclaimer
This indicator is a technical analysis tool designed to visualize ICT/SMC concepts. It does not provide financial advice or guarantee profitable trades. Past performance is not indicative of future results. Always use proper risk management and trade responsibly.
💬 Support & Feedback
If you find this indicator valuable, please leave a comment or boost! Your feedback helps improve future updates.
Questions? Drop a comment below—I actively respond to all questions about the indicator's features and usage.

Volume vs Range Imbalance DetectorDescription :-
Concept :-
This indicator is designed to identify "Effort vs. Result" anomalies in the market using Volume Spread Analysis (VSA) concepts. It highlights specific candles where high trading activity (Volume) is occurring, but the price movement (Range) is restricted. This behavior often signals the presence of heavy absorption by buyers or sellers ("Smart Money" activity) before a potential reversal or continuation.
How It Works :-
The script combines two distinct methods of volume analysis into a single view
1. Structural Imbalance (Lime & Red Signals)
This logic detects major market anomalies by comparing the current candle against a 50-period average context.
The Logic: A signal is generated if the Volume is significantly higher than the average (default 1.618x the 50 SMA) AND the Price Range is significantly smaller than the average (default 1.272x the 50 ATR).
Lime Candle/Dot (Bullish Absorption): Massive volume with small range, closing in the upper 50% of the bar. This suggests sellers are dumping, but buyers are absorbing all orders, preventing the price from dropping.
Red Candle/Dot (Bearish Blockade): Massive volume with small range, closing in the lower 50% of the bar. This suggests buyers are pushing, but sellers are absorbing the demand, preventing the price from rising.
2. Hidden Activity (Orange Signals)
This logic is more sensitive and compares the current candle only to the previous candle.
The Logic: A signal is generated if the current Volume is higher than the previous bar's volume, but the current Range is smaller than the previous bar's range.
Orange Candle/Dot: This indicates "Churn." Effort is increasing, but the result (movement) is decreasing. It is often an early warning sign of congestion or a pending breakout.
Visual Guide
Lime Dot (Below Bar): Strong Buying Pressure (Bullish Imbalance).
Red Dot (Above Bar): Strong Selling Pressure (Bearish Imbalance).
Orange Dot (Above Bar): Hidden Activity / Churn (Warning).
Settings
Context Length: The lookback period for the moving averages (Default: 50).
Volume/Range Multipliers: Determine how strict the "Imbalance" signals are. Higher numbers result in fewer, more significant signals.
Show Hidden Activity: Toggle the orange signals on or off.
Disclaimer
This tool is for educational purposes only. Volume analysis is subjective and should be used in conjunction with other form

Perp Imbalance Zones • Pro (clean)USD Premium (perp vs spot) → (Perp − Spot) / Spot.
Imbalance (z-score of that premium) → how extreme the current premium is relative to its own history over lenPrem bars.
Hysteresis state machine → flips to a SHORT bias when perp-long pressure is extreme; flips to LONG bias when perp-short pressure is extreme. It exits only after the imbalance cools (prevents whipsaw).
Price stretch filter (±σ) → optional Bollinger check so signals only fire when price is already stretched.
HTF confirmation (optional) → require higher-timeframe imbalance to agree with the current-TF bias.
Gradient visuals → line + background tint deepen as |z| grows (more extreme pressure).
What you see on the pane
A single line (z):
Above 0 = perp richer than spot (perp longs pressing).
Below 0 = perp cheaper than spot (perp shorts pressing).
Guides: dotted levels at ±enterZ (entry) and ±exitZ (cool-off/exit).
Background tint:
Red when state = SHORT bias (perp longs heavy).
Blue when state = LONG bias (perp shorts heavy).
Tint intensity scales with |z| (via hotZ).
Labels (optional): prints when bias flips.
Alerts (optional): “Enter SHORT/LONG bias” and “Exit bias”.
How to use it (playbook)
Attach & set symbols
Put the script on your chart.
Set Spot symbol and Perp symbol to the venue you trade (e.g., BINANCE:BTCUSDT + BINANCE:BTCUSDTPERP).
Read the bias
SHORT bias (red background): perp longs over-extended. Look for short entries if price is at resistance, σ-stretched, or your PA system agrees.
LONG bias (blue background): perp shorts over-extended. Look for long entries at support/σ-stretched down.
Entries
Use the bias flip as a context/confirm. Combine with your structure trigger (OB/level sweep, rejection wick, micro-break in market structure, etc.).
If useSigma=true, only trade when price is already ≥ upper band (shorts) or ≤ lower band (longs).
Exits
Bias auto-exits when |z| falls below exitZ.
You can also take profits at your levels or when the line fades back toward 0 while price mean-reverts to the middle band.
Tuning (what each knob does)
enterZ / exitZ (signal strictness + hysteresis)
Higher enterZ → fewer, cleaner signals (e.g., 1.8–2.2).
exitZ should be lower than enterZ (e.g., 0.6–1.0) to prevent flicker.
lenPrem (context window for z)
Larger (50–100) = steadier baseline, fewer signals.
Smaller (20–30) = more reactive, more signals.
smoothLen (EMA on z)
2–3 = snappier; 5–7 = smoother/laggier but cleaner.
useSigma, bbLen, bbK (price-stretch filter)
On filters chop. Try bbLen=100, bbK=1.0–1.5.
Off if you want more frequent signals or you already gate with your own σ/Keltner.
useHTF, htfTF, htfZmin (trend/confirmation)
Turn on to require higher-TF imbalance agreement (e.g., trading 1H → confirm with 4H htfTF=240, htfZmin≈0.6–1.0).
hotZ (visual intensity)
Lower (2.0–2.5) heats up faster; higher (4.0) is more subtle.
Ready-made presets
Conservative swing (fewer, higher-conviction):
enterZ=2.0, exitZ=1.0, lenPrem=60–80, smoothLen=5, useSigma=true, bbK=1.5, useHTF=true (240/0.8).
Balanced intraday (default feel):
enterZ=1.6–1.8, exitZ=0.8–1.0, lenPrem=50, smoothLen=3–4, useSigma=true, bbK=1.0–1.25, useHTF=false/true depending on trendiness.
Aggressive scalping (more signals):
enterZ=1.2–1.4, exitZ=0.6–0.8, lenPrem=20–30, smoothLen=2–3, useSigma=false, useHTF=false.
Practical tips
Don’t trade the line in isolation. Use it to time trades into your levels: VWAP bands, Monday high/low, prior POC/VAH/VAL, order blocks, etc.
Perp-led reversals often snap—be ready to scale out quickly back to mid-bands.
Venue matters. Keep spot & perp from the same exchange family to avoid cross-venue quirks.
Alerts: enable after you’ve tuned thresholds for your timeframe so you only get high-quality pings.

FVG Reversal Sentinel🔵 FVG Reversal Sentinel – Multi-Timeframe Fair Value Gap Indicator
The FVG Reversal Sentinel is a powerful TradingView indicator designed to help traders identify and track Fair Value Gaps (FVGs) across multiple timeframes, all within a single chart.
This tool allows you to select up to five separate timeframes, ensuring you never miss key market shifts, whether you are scalping, day trading, or swing trading. You can use this indicator in any asset (Cryptos, Futures, Indices, Forex Pairs, etc.).
🔵 - Key Features -
Multi-Timeframe FVG Tracking – Select and display up to five different timeframes on one chart, providing a comprehensive view of market structure.
Customizable Colors – Adjust bullish and bearish FVG colors to match your chart theme for a seamless trading experience.
Enhanced Market Context – Quickly identify key liquidity zones and refine your entries and exits with precision.
Hide the lower timeframes FVGs to get a clear view in a custom timeframe.
Show or hide mitigated FVGs to declutter the chart.
FVGs boxes are going to be displayed only when the candle bar closes
FVGs are going to be mitigated only when the body of the candle closes above or below the FVG area.
No repainting
Whether you're looking to fine-tune your entries or gain a broader market perspective, the FVG Reversal Sentinel indicator ensures you have the tools to stay ahead of price action and capitalize on market inefficiencies.
🔵 - Customization-
You can change the indicator settings as you see fit to achieve the best results for your use case.
TIMEFRAMES
This indicator provides the ability to select up to 5 timeframes. These timeframes are based on the trader's timeframes including any custom timeframes.
Select the desired timeframe from the options list.
Add the label text you would like to show for the selected timeframe.
Check or uncheck the box to display or hide the timeframe from your chart.
FVG SETTINGS
Length of boxes: allows you to select the length of the box that is going to be displayed for the FVGs.
Delete boxes after fill?: allows you to show or hide mitigated FVGs on your chart.
Hide FVGs lower than enabled timeframes?: allows you to show or hide lower timeframe FVGs on your chart. Example - You are in a 15 minutes timeframe chart, if you choose to hide lower timeframe FVGs you will not be able to see 5 minutes FVG defined in your Timeframes Settings, only 15 minutes or higher timeframe FVGs will be displayed on your chart.
BOX VISUALS
Bullish FVG box color: the color and opacity of the box for the bullish FVGs.
Bearish FVG box color: the color and opacity of the box for the bearish FVGs.
LABELS VISUALS
Bullish FVG labels color: the color for bullish labels.
Bearish FVG labels color: the color for bearish labels.
Labels size: the size of the text displayed in the labels.
Labels position: the position of the label inside the FVGs boxes (right, left or center).
BORDER VISUALS
Border width: the width of the border (the thickness).
Bullish FVG border color: the color and the opacity of the bullish box border.
Bearish FVG border color: the color and the opacity of the bearish box border.
🔵 - How to use the indicator -
Just add the indicator in your chart and click in the settings option to customize it.
Make sure you select the desired timeframes and set the colors and opacity for the FVGs boxes.
This indicator can be used in many trading strategies, such as:
SILVER BULLET
iFVG
iFVG RETEST
These strategies are based on the use of FVGs, this tool can help you analyze the market and make the right decision.
🔵 - How was the indicator designed? -
I have spent a lot of time testing other open source indicators from the community. All of these indicators do a great job, but they have a problem, they not only mitigate FVGs when a candle closes above or below the FVG, they also mitigate FVGs when the candle closes exactly to the tick (not above or below the FVG). This is a problem for many strategies that rely on FVGs mitigation.
What makes this indicator different is that it focuses on just mitigating imbalances at the right time for these strategies.
I have taken ideas and some pieces of code from many community indicator developers, such as:
@twingall
@tflab
@marktools
@nacho-fx
@pmk07
... and many other people, to whom I thank for their valuable work and have allowed me to create this tool by making modifications to their source code.
🔵 - Disclaimer -
This tool is intended solely for informational and educational purposes and should not be regarded as financial, investment, or trading advice. It's not designed to predict market movements or offer specific recommendations. Users should be aware that past performance is not indicative of future results and should not rely on any indicator for financial decisions.

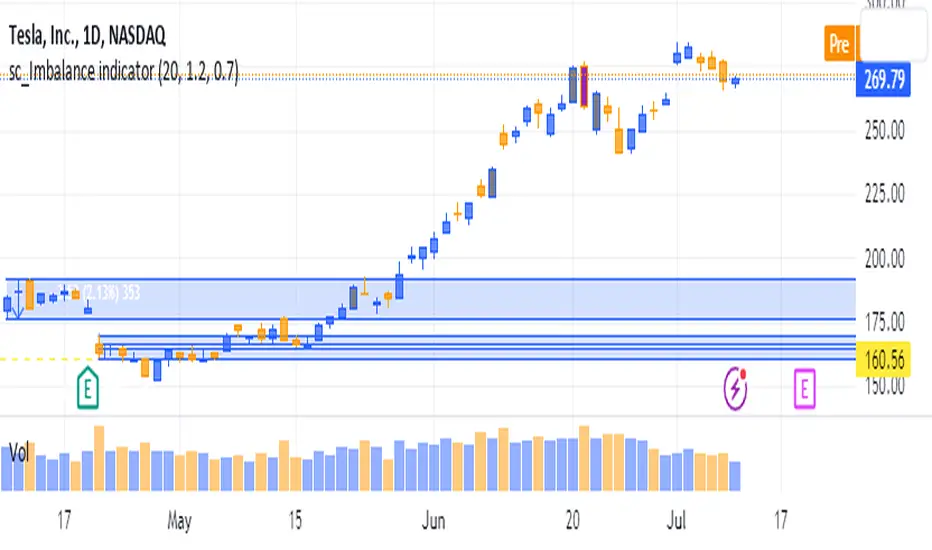
sc_Imbalance indicatorThe script helps to identify imbalance trade candles on the chart.
Prices after a rip-up candle (color in gray, default) will often see subsequent prices backfilling the rip-up candle ie. prices after the rip-up imbalance will fall back down. The opposite is true for flush-down candles (color in purple, default). This indicator allows a quick seeing of which imbalance candle that not been backfilled yet and present opportunities in trading the stock with potential target price based on the imbalance candle.
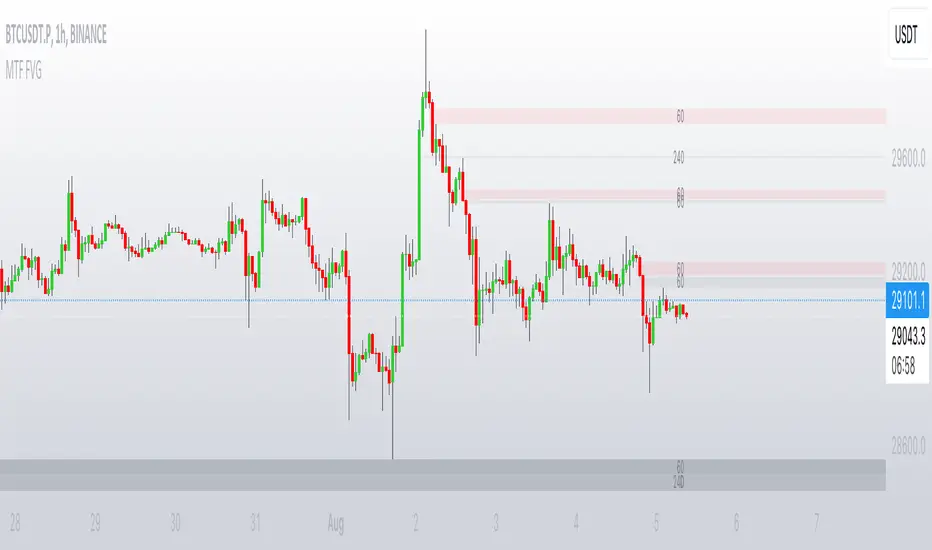
MTF FVGThis script finds Imbalance (Fair Value Gap (FVG)) on multi timeframes.
If needed all TF can be used at once: 1, 3, 5, 15, 30, 45, 60, 120, 180, 240, D, W.
It finds FVG on any desired TF that is greater or equal than TF on the chart.
FVG stands for fair value gap, which is a three-candle structure that indicates an imbalance or inefficiency in the market. An imbalance means that the buying and selling is not equal, and there is a gap between the fair value and the market value of an asset. A bullish FVG shows that the market value is lower than the fair value, and a bearish FVG shows the opposite.
FVG takes place in a series of 3 candles when the middle candle gaps up or down. This signals strong buying or selling pressure in the direction of the gap. When a gap occurs the wicks of the candles do not overlap each other.
POI Zones with Imbalance- Ahmed AwadHighlights Point of Interest (POI) zones on the chart where a significant price imbalance occurs between the candle’s open and close. The indicator draws semi-transparent orange zones to mark potential buy or sell areas, helping traders spot strong price moves and key levels. Adjustable imbalance threshold and transparency for flexibility.

Liquidity Levels/Voids (VP) [LuxAlgo]The Liquidity Levels/Voids (VP) is a script designed to detect liquidity voids & levels by measuring traded volume at all price levels on the market between two swing points and highlighting the distribution of the liquidity voids & levels at specific price levels.
🔶 USAGE
Liquidity is a fundamental market force that shapes the trajectory of assets.
The creation of a liquidity level comes as a result of an initial imbalance of supply/demand, which forms what we know as a swing high or swing low. As more players take positions in the market, these are levels that market participants will use as a historical reference to place their stops. When the levels are then re-tested, a decision will be made. The binary outcome here can be a breakout of the level or a reversal back to the mean.
Liquidity voids are sudden price changes that occur in the market when the price jumps from one level to another with little trading activity (low volume), creating an imbalance in price. The price tends to fill or retest the liquidity voids area, and traders understand at which price level institutional players have been active.
Liquidity voids are a valuable concept in trading, as they provide insights about where many orders were injected, creating this inefficiency in the market. The price tends to restore the balance.
🔶 SETTINGS
The script takes into account user-defined parameters and detects the liquidity voids based on them, where detailed usage for each user-defined input parameter in indicator settings is provided with the related input's tooltip.
🔹 Liquidity Levels / Voids
Liquidity Levels/Voids: Color customization option for Unfilled Liquidity Levels/Voids.
Detection Length: Lookback period used for the calculation of Swing Levels.
Threshold %: Threshold used for the calculation of the Liquidity Levels & Voids.
Sensitivity: Adjusts the number of levels between two swing points, as a result, the height of a level is determined, and then based on the above-given threshold the level is checked if it matches the liquidity level/void conditions.
Filled Liquidity Levels/Voids: Toggles the visibility of the Filled Liquidity Levels/Voids and color customization option for Filled Liquidity Levels/Voids.
🔹 Other Features
Swing Highs/Lows: Toggles the visibility of the Swing Levels, where tooltips present statistical information, such as price, price change, and cumulative volume between the two swing levels detected based on the detection length specified above, Coloring options to customize swing low and swing high label colors, and Size option to adjust the size of the labels.
🔹 Display Options
Mode: Controls the lookback length of detection and visualization.
# Bars: Lookback length customization, in case Mode is set to Present.
🔶 RELATED SCRIPTS
Liquidity-Voids-FVG
Buyside-Sellside-Liquidity
Swing-Volume-Profiles

FVG Sessions [LuxAlgo]The FVG Sessions indicator highlights the first fair value gap of the trading session as well as the session range. Detected fair value gaps extend to the end of the trading session.
Alerts are included on the formation of a session fair value gap, price being within a session fair value gap, mitigations, and price crossing session fair value gaps average.
🔶 USAGE
Trader ICT states that the first fair value gap of the trading session can attract the most significant reaction. Having only one FVG per session allows users to further focus on that precise imbalance as well as external elements.
The mitigation of a fair value gap is clearly indicated on the chart with a more transparent color allowing users to see inverse FVGs.
Extending the fair value gaps allows the imbalance area to provide potential support and resistance.
Do note that this script should be used on intraday charts.
🔶 ALERTS
The script includes the following alerts:
🔹 Bullish/Bearish FVG
Alerts on the formation of the first bullish or bearish FVG of the session.
🔹 Bullish/Bearish FVG Mitigation
Alerts when the first bullish or bearish FVG of the session is mitigated.
🔹 Price Within FVG
Alerts when price is within the first bullish or bearish FVG area of the session.
🔹 Price Cross FVG Average
Alerts when price cross the average level of the first bullish or bearish FVG of the session.


NX - ICT PD ArraysThis Pine Script indicator identifies and visualizes Fair Value Gaps (FVGs) and Order Blocks (OBs) based on refined price action logic.
FVGs are highlighted when price leaves an imbalance between candles, while Order Blocks are detected using ICT methodology—marking the last opposing candle before a displacement move.
The script dynamically tracks and updates these zones, halting box extension once price interacts with them. Customizable colors and lookback settings allow traders to tailor the display to their strategy.

Tape Pressure Proxy — Signals (CVD + Imbalance + VWAP/EMA) v1.1Tape reading: The stack approximates aggressor flow using CVD (cumulative signed volume) and a Z-score “imbalance” of that signed volume. This captures speed/side bias you’d look for on the tape.
