Immediate rebalanceGuided by the new ICT tutoring, I create this versatile Immediate Rebalance indicator
This indicator shows a different way on how to view the "Spikes or Shadows", based on the direction of the price this indicator divides the "Spike or Shadows" into levels 0.5 - 0.75 - 0.25 Fibonacci, giving the possibility to view the levels both in normal or in pre-Macro times
The user has the possibility to:
- Choose to have Spike levels shown in MultiTimeframe
- Choose to show Sike levels only Bullish or only Bearish
- Choose to show Sike levels only in pre-Macro/Macro times
- Choose to view the maximum amount of levels with Max Show
The indicator must be used as ICT shows in its concepts, the indicator takes into consideration the last 2 candles already closed so on the candle that is forming it is possible to expect reactions on the levels it marks, below is an example of how to use it in MultiTimeframe
Below I show an example on how to set the indicator to see Immediate Rebalance in Macro times
Below is an example of when not to take the indicator into consideration
스크립트에서 "ict"에 대해 찾기

Time Matrix [Pro+] (DRxICT)Description:
The Time Matrix Pro is an automated Time-based trading tool adaptable to futures, forex, and bond markets. This indicator is inspired by concepts taught by the Inner Circle Trader (ICT) and ICT_Concepts.
ICT’s repertoire encompasses the concepts of liquidity and couples them with Time. The Time Matrix helps the analyst to locate key Time-based price levels to determine bias and recurring price patterns within the market. Analysts can use levels like Previous Day’s Highs and Lows, Weekly Highs and Lows, Session Openings, and Macros to base and qualify Premium and Discount arrays in intraday analysis.
Session Boxes are Time opportunities of the day that identify the market mechanics of consolidation, expansion, retracement, and reversals.
ICT_Concepts's Session Boxes are described as the Premarket, AM Session, PM session:
Premarket is defined as 9:30pm to 1:30am
AM session is defined as 4:00am to 11:00am
PM Session is defined as 11:30am to 2:15pm
Understanding how Time is crucial for identifying intraday profiling, the analyst is able to toggle price levels in conjunction with Time-based macros. These help analyze key market turning points that can correspond to unique market mechanics.
Beyond the Time-based liquidity levels, and the Time macros, there are also predefined Time clusters.
These clusters highlight a significant lower Timeframe candle which was found to hold significant value by ICT_Concepts. Very much alike Time-based liquidity levels, analysts will notice how price reacts to support or negate existing orderflow, trend and direction.
Key Features:
Customizable Extension: the analyst is given the choice to toggle the ending Time Offset to either Noon NY Time or at the end of the trading day.
Time-Based Toggles: choose individual Time-based prices to highlight on your chart.
Time Table: depending on the Timeframe, the Time Table will display the number of bars and the Time elapsed since the Time-based liquidity levels were established.
Other Features
Customize Session Boxes Color
Customize Time-Based Liquidity Line Style
Customize Time-Based Liquidity Level Color
Customize Time-Based Liquidity Line Width
Customize Table Size and Location
Usage Guidance:
Add Time Matrix to your Tradingview chart.
Customize your desired settings of Time-Based Liquidity Levels to align with your personal preference.
Observe where the Time-Based Liquidity Levels as well as Previous Day, Week, and Macros play a role in intraday narrative.
Analysts can choose to utilize Time-Based Liquidity Levels as automated framework to organize models and layouts.
These tools are available ONLY on the TradingView platform.
Terms and Conditions
Our charting tools are products provided for informational and educational purposes only and do not constitute financial, investment, or trading advice. Our charting tools are not designed to predict market movements or provide specific recommendations. Users should be aware that past performance is not indicative of future results and should not be relied upon for making financial decisions. By using our charting tools, the purchaser agrees that the seller and the creator are not responsible for any decisions made based on the information provided by these charting tools. The purchaser assumes full responsibility and liability for any actions taken and the consequences thereof, including any loss of money or investments that may occur as a result of using these products. Hence, by purchasing these charting tools, the customer accepts and acknowledges that the seller and the creator are not liable nor responsible for any unwanted outcome that arises from the development, the sale, or the use of these products.
Finally, the purchaser indemnifies the seller from any and all liability. If the purchaser was invited through the Friends and Family Program, they acknowledge that the provided discount code only applies to the first initial purchase of the Toodegrees Premium Suite subscription. The purchaser is therefore responsible for cancelling – or requesting to cancel – their subscription in the event that they do not wish to continue using the product at full retail price. If the purchaser no longer wishes to use the products, they must unsubscribe from the membership service, if applicable. We hold no reimbursement, refund, or chargeback policy. Once these Terms and Conditions are accepted by the Customer, before purchase, no reimbursements, refunds or chargebacks will be provided under any circumstances.
By continuing to use these charting tools, the user acknowledges and agrees to the Terms and Conditions outlined in this legal disclaimer.

Liquidity Depth [Pro+]Description:
Liquidity Depth Pro+ is a trading tool with a remarkable adaptability and perfectly aligned with the intricate demands of the futures, forex, and bond markets. This indicator is based on a concept taught by the Inner Circle Trader (ICT), who explains that institutions tend to dig deeper into Liquidity Pools above highs and below lows. Specifically, ICT mentions how in Forex these Liquidity Depths are classically manifested as 10-20-30 pips respectively.
This tool allows the Analyst to adapt this concept based on their understanding of price. It delves into the essence of institutional trading, exposing deeper liquidity depth pursued by institutional giants and astute bank traders that lay further than the mere extremities of price.
CME_MINI:NQ1! Example (Tuesday):
Price raids Monday's low
Price raids Friday's low
Price digs deeper into one of Friday's Deep Liquidity Pools
Low of the Day Reversal
Note: the Depths used in this example are 30-60-90 points.
Key Features:
Versatility Across Assets: Liquidity Depth Pro+ is finely tailored for futures, forex, and bond markets, making it an all-encompassing solution suitable for a broad range of financial instruments.
Timeframe Customization: Liquidity Depth Pro+ allows users to decide Timeframe Liquidity empowering the analyst with flexibility.
Historical Pools: Choose up to the last 20 highs and lows to mark liquidity pools from the User Selected Timeframe.
Universal Trading Style: Regardless of your trading approach, be it trend-following or reversal models, this indicator embraces all styles. It offers a holistic perspective to navigating liquidity zones above highs and below lows of the chosen Timeframe.
Visual Precision: This indicator visualizes the liquidity depth with a customizable style, allowing the analyst to frame the position of deeper liquidity pools above highs and below lows.
Liquidity Table: Keep track of liquidity levels and unlock faster decision making by taking advantage of the visual Liquidity Table cues.
Adaptive Table Colors: When price is above your desired liquidity pool high, the table will match the liquidity high color to indicate a current liquidity raid or deeper pool being attacked. Vice versa, when price is below your desired liquidity pool low, the table will match the liquidity low color.
Real-Time Alerts: Save Time with live alerts that provide valuable insights into potential opportunities and liquidity purges at your desired liquidity levels.
Other Features:
Choose the Depth Type ("Auto", "Value", "Ticks", "Pips"). The “Auto” feature will select the best unit of measurement for the depths based on the current market on chart.
Choose to show up to Three Liquidity Depths.
Customize the Liquidity Line Style.
Customize the Liquidity Line Color.
Customize the Liquidity Line Width.
Customize Table Size and Location
Usage Guidance:
Add Liquidity Depth to your Tradingview chart.
Customize your desired Timeframe and Liquidity Depths to align with your personal preference.
Observe where the Liquidity Lines manifest above and below your chosen Timeframe’s highs and lows respectively, once they are raided.
Leverage this invaluable information to frame the narrative, whether you opt to pursue liquidity or capitalize on post-purge reversals.
These tools are available ONLY on the TradingView platform.
Terms and Conditions
Our charting tools are products provided for informational and educational purposes only and do not constitute financial, investment, or trading advice. Our charting tools are not designed to predict market movements or provide specific recommendations. Users should be aware that past performance is not indicative of future results and should not be relied upon for making financial decisions. By using our charting tools, the purchaser agrees that the seller and the creator are not responsible for any decisions made based on the information provided by these charting tools. The purchaser assumes full responsibility and liability for any actions taken and the consequences thereof, including any loss of money or investments that may occur as a result of using these products. Hence, by purchasing these charting tools, the customer accepts and acknowledges that the seller and the creator are not liable nor responsible for any unwanted outcome that arises from the development, the sale, or the use of these products.
Finally, the purchaser indemnifies the seller from any and all liability. If the purchaser was invited through the Friends and Family Program, they acknowledge that the provided discount code only applies to the first initial purchase of the Toodegrees Premium Suite subscription. The purchaser is therefore responsible for cancelling – or requesting to cancel – their subscription in the event that they do not wish to continue using the product at full retail price. If the purchaser no longer wishes to use the products, they must unsubscribe from the membership service, if applicable. We hold no reimbursement, refund, or chargeback policy. Once these Terms and Conditions are accepted by the Customer, before purchase, no reimbursements, refunds or chargebacks will be provided under any circumstances.
By continuing to use these charting tools, the user acknowledges and agrees to the Terms and Conditions outlined in this legal disclaimer.
유료 스크립트

Liquidity Sentiment Profile (Auto-Anchored) [LuxAlgo]
The Liquidity Sentiment Profile (Auto-Anchored) is an advanced charting tool that measures by combining PRICE and VOLUME data over specified anchored periods and highlights the distribution of the liquidity and the market sentiment at specific price levels. This version is a variation of the previously published Liquidity Sentiment Profile , wherewith this version allows users to select a variety of different anchoring periods, such as 'Auto', 'Fixed Range', 'Swing High', 'Swing Low', 'Session', 'Day', 'Week', 'Month', 'Quarter', and 'Year'
Liquidity refers to the availability of orders at specific price levels in the market, allowing transactions to occur smoothly.
🔶 USAGE
A Liquidity Sentiment Profile (Auto-Anchored) is a combination of liquidity and a sentiment profile, where the right side of the profile highlights the distribution of the traded activity at different price levels, and the left side of the profile highlights the market sentiment at those price levels
The liquidity profile is categorized by assigning different colors based on the significance of the traded activity of the specific price levels, allowing traders to reveal significant price levels, such as support and resistance levels, supply and demand zones, liquidity gaps, consolidation zones, etc
The Liquidity Sentiment Profiles aim to present Value Areas based on the significance of price levels, thus allowing users to identify value areas that can be formed more than once within the range of a single profile
Level of Significance Line - displays the changes in the price levels with the highest traded activity (developing POC)
Buyside & Sellside Liquidity Zones - displays Liquidity Levels, also known as Supply and Demand Zones
🔶 SETTINGS
The script takes into account user-defined parameters and plots the profiles, where detailed usage for each user-defined input parameter in indicator settings is provided with the related input's tooltip.
🔹 Liquidity Sentiment Profile
Anchor Period: The indicator resolution is set by the input of the Anchor Period.
Fixed Period: Applicable if the Anchor Period is set to 'Fixed Range' then the period of the profile is defined with this option
Swing Detection Length: Applicable if the Anchor Period is set to 'Swing High' or 'Swing Low' then the length required to detect the Swing Levels is defined with this option which is then used to determine the period of the profile
🔹 Liquidity Profile
Liquidity Profile: Toggles the visibility of the Liquidity Profiles
High Traded Nodes: Threshold and Color option for High Traded Nodes
Average Traded Nodes: Color option for Average Traded Nodes
Low Traded Nodes: Threshold and Color option for Low Traded Nodes
🔹 Sentiment Profile
Sentiment Profile: Toggles the visibility of the Sentiment Profiles
Bullish Nodes: Color option for Bullish Nodes
Bearish Nodes: Color option for Bearish Nodes
🔹 Buyside & Sellside Liquidity Zones
Buyside & Sellside Liquidity Zones: Toggles the visibility of the Liquidity Levels
Buyside Liquidity Nodes: Color option for Buyside Liquidity Nodes
Sellside Liquidity Nodes: Color option for Sellside Liquidity Nodes
🔹 Other Settings
Level of Significance: Toggles the visibility of the Level of Significance Line
Price Levels, Color: Toggles the visibility of the Profile Price Levels
Number of Rows: Specify how many rows each profile histogram will have. Caution, having it set to high values will quickly hit Pine Script™ drawing objects limit and fewer historical profiles will be displayed
Profile Width %: Alters the width of the rows in the histogram, relative to the profile length
Profile Range Background Fill: Toggles the visibility of the Profiles Range
🔶 RELATED SCRIPTS
Liquidity-Sentiment-Profile
Buyside-Sellside-Liquidity
ICT-Concepts

Liquidity Sentiment Profile [LuxAlgo]The Liquidity Sentiment Profile is an advanced charting tool that measures by combining PRICE and VOLUME data over specified anchored periods and highlights within a sequence of profiles the distribution of the liquidity and the market sentiment at specific price levels.
The Liquidity Sentiment Profile allows traders to reveal significant price levels, dominant market sentiment, support and resistance levels, supply and demand zones, liquidity availability levels, liquidity gaps, consolidation zones, and more based on price and volume data.
Liquidity refers to the availability of orders at specific price levels in the market, allowing transactions to occur smoothly.
🔶 USAGE
A Liquidity Sentiment Profile is a combination of a liquidity and a sentiment profile, where the right part of the profile displays the distribution of the traded activity at different price levels and the left part displays the market sentiment at those price levels.
The Liquidity Sentiment Profiles are visualized with different colors, where each color has a different meaning.
The Liquidity Sentiment Profiles aim to present Value Areas based on the significance of price levels, thus allowing users to identify value areas that can be formed more than once within the range of a single profile.
Level of Significance Line - displays the changes in the price levels with the highest traded activity (developing POC)
🔶 SETTINGS
The script takes into account user-defined parameters and plots the profiles, where detailed usage for each user-defined input parameter in indicator settings is provided with the related input's tooltip.
🔹 Liquidity Sentiment Profiles
Anchor Period: The indicator resolution is set by the input of the Anchor Period, the default option is AUTO.
🔹 Liquidity Profile Settings
Liquidity Profile: Toggles the visibility of the Liquidity Profiles
High Traded Nodes: Threshold and Color option for High Traded Nodes
Average Traded Nodes: Color option for Average Traded Nodes
Low Traded Nodes: Threshold and Color option for Low Traded Nodes
🔹 Sentiment Profile Settings
Sentiment Profile: Toggles the visibility of the Sentiment Profiles
Bullish Nodes: Color option for Bullish Nodes
Bearish Nodes: Color option for Bearish Nodes
🔹 Other Settings
Level of Significance: Toggles the visibility of the Level of Significance Line
Profile Price Levels: Toggles the visibility of the Profile Price Levels
Number of Rows: Specify how many rows each profile histogram will have. Caution, having it set to high values will quickly hit Pine Script™ drawing objects limit and fewer historical profiles will be displayed
Profile Width %: Alters the width of the rows in the histogram, relative to the profile length
Profile Range Background Fill: Toggles the visibility of the Profiles Range
🔶 LIMITATIONS
The amount of drawing objects that can be used is limited, as such using a high number of rows can display fewer historical profiles and occasionally incomplete profiles.
🔶 RELATED SCRIPTS
🔹 Buyside-Sellside-Liquidity
🔹 ICT-Concepts
🔹 Swing-Volume-Profiles

Market Structure CHoCH/BOS (Fractal) [LuxAlgo]The Market Structure CHoCH/BOS (Fractal) indicator is an experimental take on classical market structure, whereas fractal patterns are used for their construction instead of swing points.
Compared to utilizing swing points for highlighting market structure like our Smart Money Concepts indicator , fractal-based market structure can appear as more adaptive, however, it can also be more restrictive when it comes to returning swing points which can cause the indicator to miss reversals in some cases.
If enabled from within the settings, users can see support and resistance levels returned from the detected market structure with breakouts highlighted on the chart. Alongside this feature, an additional dashboard showing the structure to fractal structure percentage is also provided.
🔶 SETTINGS
Length: Length of the fractal patterns to detect.
🔹 Style
Bullish Structures: Show bullish structures.
Bearish Structures: Show bullish structures.
Support: Show support levels.
Resistance: Show resistance levels.
🔹 Dashboard
Show Dashboard: Show structure to fractal percentage dashboard on the chart.
Location: Location of the dashboard on the chart.
Size: Dashboard size.
🔶 USAGE
Market structure is commonly used to determine trend direction by using price positions relative to prior swing points. Using fractal patterns to determine market structure can allow users to obtain shorter, more frequent structure labels.
Market structure is commonly classified as follows:
Change of Character (CHoCH), also referred to as Market Structure Shift (MSS)
Break of Structure (BOS), also referred to as Market Structure Break (MSB)
Change of Characters indicate a shift in the market trend, confirming trend reversals. Break of Structures on the other hand occur once a trend is already determined, confirming new higher highs/lower lows.
Using higher length values allow users to detect longer-term fractals, thus highlighting longer-term market structures. The image above detects fractal patterns made of 7 candles, even if the increment is only of 2 bars this significantly reduces the amount of detected market structure labels.
The result obtained by utilizing fractals and higher settings can be a more dynamic view of market structure, however, as seen in the image above this can introduce very significant delay compared to utilizing pure swing points.
🔹 Support/Resistance
The indicator also returns support/resistance levels constructed from the market structure, these levels are obtained similarly to order blocks, finding the minimum on the interval of a bullish market structure and the maximum of a bearish market structure.
Price reaching a support/resistance level can be expected to bounce from it. Once a level is broken, the support/resistance level will no longer extend, and a circle will be displayed highlighting the break.
While utilizing this script for fractal-based market structure, these levels can be useful to ensure all swing points are still considered by the user with the possibility of the indicator missing reversals due to its calculation not being based on swing points themselves.
🔹 Dashboard
The dashboard reports the structure to fractal percentage, that is the amount of bullish/bearish market structures relative to the total amount of detected bullish/bearish fractal patterns.
This allows us to see how often a detected fractal pattern is used to display a market structure.
🔶 DETAILS
🔹 Fractals
In the context of technical analysis, Fractals refer to specific patterns that exhibit self-similarity at different scales or timeframes.
The most commonly known fractal pattern consists of a consecutive sequence of candles (more commonly 5), with the central candle being the lowest (in case of a bullish fractal) or highest (in case of a bearish fractal).
A bullish fractal has candles on the right side of the central candle with increasing lows, while candles on the left side have decreasing lows.
A bearish fractal has candles on the right side of the central candle with decreasing highs, while candles on the left side have increasing highs.
🔶 RELATED SCRIPTS
🔹 Smart Money Concepts
🔹 Market Structure Trailing Stop
🔹 ICT Concepts

30MIN CYCLE█ HOW DOES IT WORK?
The known 90 min cycle is used as one killzone. But actually all 18 min are relevant to search for a trade. All 18 min when a new box starts only then is the placement of an order valid. If the entry candle isn't in a box then it will probably fail. The boxes should only be used in the M1 or M5 timeframe. The best hitrate is in the M1 timeframe. Included are the last 48 "Mini-Killzones" für intraday trading and backtesting. These "Mini-Killzones" can be used with the "Liquidity Inducement Strategy".
█ WHAT MAKES IT UNIQUE?
This is the first indicator on tradingview that shows all mini-killzones for trading and backtesting a whole tradingday. The well-known killzones of ICT are from 08:00-11:00 and 14:00 - 17:00 (UTC+1) but with this indicator there is finally a refinement of the ICT Smart Money Concept killzones.
█ HOW TO USE IT?
For a proper use of this indicator we suggest to know already at least SMC or better Liquidity Indcuement Trading. This indicator is a further confluence before placing an order. After you made your setup you will have these mini-killzones as a confluence. We don't suggest to open a trade only according to this indicator.
█ ADDITIONAL INFO
This indicator is free to use for all tradingview users.
█ DISCLAIMER
This is not financial advice.

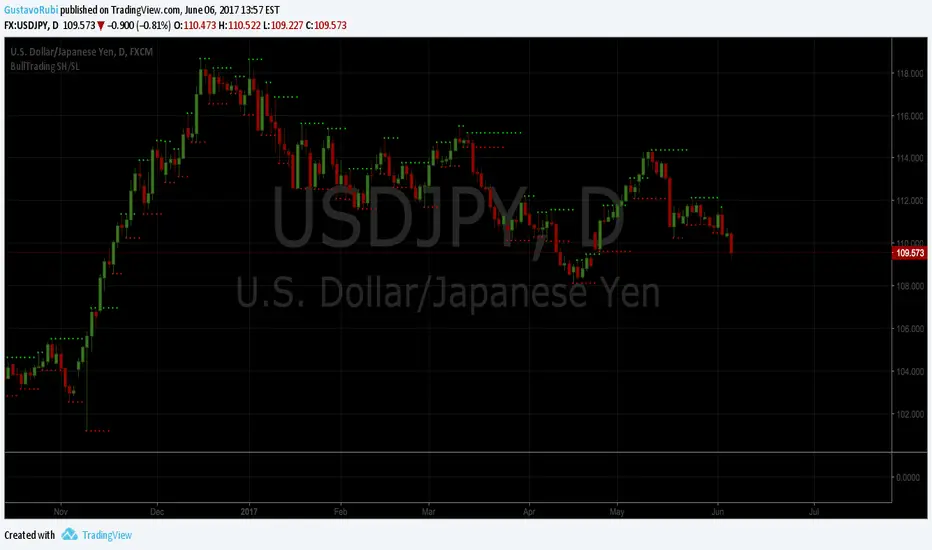
BullTrading SwingHigh/SwingLowTraders, good afternoon... are you in a mood for an excellent Institutional Trading Course?
Best of all for FREE!! (please use this valuable information with respect, there are people selling the information contained in this course as their own).
This guy has more than 20 years of trading experience under his belt. This information is a real gem for any trader, no matter the timeframe you trade. This script is a tribute for ICT production and shows the swing highs and swing lows used on institutional trading (Use it in D and 4H timeframes resolution for analysis in order to apply manual trading in lower timeframes).
Here is the link to the ICT Sniper Institutional Trading Course. Enjoy www.dropbox.com
ODR BoxThis indicator automates the Opening Range Definition (ODR) based on the Ali Khan / ICT Model 1 framework. By capturing the 07:00-09:25 AM Dealing Range, it projects institutional quadrants and standard deviation targets. It is designed to filter out 'retail noise' and highlight the mathematical levels where price delivery is most likely to accelerate or reverse.

Order Blocks & ImbalanceThis indicator automatically identifies and plots Order Blocks (also known as Fair Value Gaps or Imbalances) based on Smart Money Concepts (SMC) and ICT methodology. It detects significant price inefficiencies (gaps between candles) that often act as institutional supply or demand zones.
How It Works (Technical Methodology)
1. Fair Value Gap (FVG) Detection
The indicator identifies classic 3-candle imbalances:
- Bullish Order Block (Demand): When the low of the current candle is significantly below the high of the candle two bars ago (low - high ).
- Bearish Order Block (Supply): When the high of the current candle is significantly above the low of the candle two bars ago (low - high ).
A minimum size threshold is enforced using ATR(14) × user-defined multiplier (default 0.5) to filter out minor gaps and focus on meaningful inefficiencies.
2. Zone Creation
- Bullish zones are created at the candle two bars ago (the "origin" candle where inefficiency occurred).
- Bearish zones use the same origin candle.
- Zone boundaries:
Top = high of origin candle
Bottom = low of origin candle
This captures the full range where price moved aggressively, leaving an imbalance that institutions may later revisit.
3. Mitigation Detection
Zones can be mitigated in two ways (user-selectable):
- "Close": Zone is considered touched only if the close price enters the zone.
- "Wick": Zone is touched if any wick (high/low) enters the zone (more sensitive).
When mitigated:
- Background becomes more transparent
- Border turns dotted
- Label changes to "Mitigated"
Broken zones (price fully closes beyond the opposite side) are automatically deleted.
4. Zone Lifecycle Management
- Active Zone: Strong color fill (green for demand, red for supply) with solid border.
- Mitigated Zone: Faded color, dotted border – indicates partial fill or reduced strength.
- Broken Zone: Automatically removed from chart to reduce clutter.
Old zones are also pruned when exceeding 450 total to maintain performance.
5. Smart Visibility Engine (Optional)
When enabled:
- All zones are initially hidden.
- Only the closest relevant zones are shown:
- Up to user-defined limit (default 10) highest bullish zones (closest below price)
- Up to user-defined limit (default 10) lowest bearish zones (closest above price)
- Visible zones are automatically extended to the right and styled appropriately.
This keeps the chart clean while highlighting the most actionable zones near current price.
6. Visual Elements
- Demand Zones: Green fill, labeled "OB Demand"
- Supply Zones: Red fill, labeled "OB Supply"
- Tiny text size to minimize chart clutter
- Zones drawn as boxes using bar_index positioning
How to Use
Order Blocks represent areas of price inefficiency where smart money likely entered/exited positions aggressively.
- Demand Zones (Green): Potential long entry areas when price returns. Expect buying pressure to defend these levels. Best setups when price retests an active (non-mitigated) zone.
- Supply Zones (Red): Potential short entry areas when price returns. Expect selling pressure to emerge.
- Mitigated Zones: Lower probability – may act as weaker support/resistance.
- Smart Visibility: Highly recommended for cleaner charts. Focuses attention on zones most likely to be tested soon.
- Combine with:
- Break of Structure (BOS)/Change of Character (CHOCH)
- Liquidity grabs
- Higher timeframe confluence
- Volume or momentum confirmation
Use higher FVG threshold (e.g., 0.8–1.0) for fewer, higher-quality zones. Lower threshold for more aggressive detection.
Disclaimer
This indicator is a technical analysis tool and should be used in conjunction with other forms of analysis. Past performance does not guarantee future results. Always use proper risk management.

MTF Fair Value GapsMTF Fair Value Gaps (MTF FVGs) plots Fair Value Gaps from up to 4 user-selectable higher timeframes directly on your chart.
Multi-timeframe support: Enable/disable each timeframe independently (e.g., 15m / 1h / 4h / 1D).
Clean chart mode: Show only the N closest bullish + bearish gaps per timeframe (reduces clutter).
Mitigation options: Choose how/when gaps are considered filled and automatically removed.
CE (0.5) midpoint line: Optional display with customizable style and width.
Per-timeframe colors: One color per timeframe (bull/bear share the same color).
Right-edge extension: Shift the right edge by X chart candles to keep gaps visible ahead of price.


LockedEye Trading Navigator**LockedEye Trading Navigator — Summary**
This script is a real-time market decision dashboard designed to prevent impulsive trades by forcing structure, context, and confirmation checks into a single glance. It does not generate blind buy/sell signals. It evaluates market conditions, trend alignment, and risk context before allowing a trade bias.
**Core Purpose**
Acts as a pre-trade checklist, not a signal spammer.
Helps traders wait, filter, and align with structure.
Designed for scalping to intraday trading.
Optimized to reduce FOMO entries and late trades.
**Key Features**
**1. Market State Detection**
Classifies the market into TREND ↑, TREND ↓, or COOKING (ranging/compression).
Uses volatility compression and linear regression slope to prevent trading during low-quality conditions.
**2. Multi-Timeframe Moving Average Alignment**
Tracks trend alignment using EMA 6 & 21 (momentum bias), EMA 50 (mid-trend filter), EMA 200 (macro bias), and EMA 70 & 99 on M15 (higher-timeframe confirmation).
Each MA condition is displayed with directional arrows and color-coded backgrounds.
**3. Break of Structure (BOS)**
Detects bullish or bearish structure breaks based on recent range.
Flags BULL, BEAR, or NO.
Used as structural confirmation, not as a standalone signal.
**4. MACD Momentum Bias**
Evaluates MACD line versus signal line.
Outputs BULL, BEAR, or NONE.
Acts as momentum confirmation for trend continuation or exhaustion.
**5. RSI Divergence Detection**
Detects basic bullish and bearish divergence.
Highlights momentum disagreement with price.
Used as a boost factor, not a trigger.
**6. Candlestick Context**
Identifies bullish engulfing, bearish engulfing, and doji candles.
Used to validate entry timing rather than direction alone.
**7. Volume Behavior**
Compares current volume to a 20-period SMA.
Flags INCREASING or DECREASING to confirm whether price movement is supported by participation.
**8. ICT Candle Logic (Correctly Color-Coded)**
Evaluates the current close relative to the previous candle.
INSIDE: Close remains within the previous high/low, indicating consolidation.
OUTSIDE (Green): Close above previous high, indicating bullish expansion.
OUTSIDE (Red): Close below previous low, indicating bearish expansion.
Helps avoid misreading fake breakouts and inside bars.
**9. Price Location Awareness**
Determines whether price is at SUPPORT, at RESISTANCE, or in MID range.
Ensures trades are only considered where risk is logical.
**10. Final Trade Summary Engine**
Outputs one of four states: LONG OK, SHORT OK, WAIT, or NO TRADE.
Requires trend alignment, MACD agreement, structure and location validation, and at least one supporting confirmation.
**Design Philosophy**
No repainting by default.
No emotional signals.
No hindsight bias.
Forces discipline and patience.
Designed as a decision filter, not a prediction tool.
**Best Use Case**
Scalping and intraday trading.
Traders who struggle with overtrading.
Traders who want structure before execution.
Works best when combined with manual price action reading.

Killzones by (Pecurtoo)This indicator highlights key trading sessions on the chart in UTC+1 (Brussels) timezone. It allows traders to visually identify the Asian, London, New York AM, and New York PM sessions with customizable start and end times and colors. The sessions are displayed as shaded backgrounds on the chart, making it easier to spot periods of high market activity and potential volatility. All session times and colors can be fully edited by the user, providing flexibility to match different trading strategies.
It is ideal for traders using ICT Killzone concepts, intraday strategies, or those who want to track session-specific market activity.

IDX_TLKMPT Telkom Indonesia (Persero) Tbk (TLKM) is Indonesia's largest state-owned telecommunications and information and communication technology (ICT) services provider. The company provides a comprehensive range of services, including mobile, fixed-line, internet, and data communication services through its extensive infrastructure network. As of December 19, 2025, TLKM's stock price was IDR 3,430.0, with a market capitalization of approximately IDR 337.8 trillion.

GardFx - Fusion Pro FREE TrialFusion Pro - by GardFx
This script is a specialized session-trading system designed to capitalize on the Opening Range Breakout (ORB) by utilizing Fair Value Gaps (FVG) as entry confirmation zones. Unlike standard breakout indicators that signal immediately upon a range break, this system waits for a price retest (mitigation) of specific imbalances created during the breakout move.
Core Concept
The strategy operates on a three-step logic sequence:
Define the Range: It establishes the High and Low of the opening session (London or New York).
Identify Imbalance: Upon a breakout of this range, the script scans for the creation of a Fair Value Gap (FVG) on the 1-minute timeframe.
Confirm Entry: It waits for price to retrace into the FVG (mitigation) and looks for specific candle confirmation patterns before generating a signal.
Detailed Methodology
1. The Opening Range (ORB)
The script monitors the first 15 minutes of the session (configurable).
High Line: The highest price reached during the first 15m.
Low Line: The lowest price reached during the first 15m.
Breakout: A breakout is validated when a candle closes outside of this defined range.
2. Fair Value Gap (FVG) Detection
Shutterstock
Not all breakouts are valid. This script filters for momentum by requiring an FVG to form immediately following the breakout.
Bullish FVG: Defined when the Low of Candle 1 is higher than the High of Candle 3.
Bearish FVG: Defined when the High of Candle 1 is lower than the Low of Candle 3.
Note: If an FVG is not formed shortly after the breakout, the setup is considered low-probability and ignored.
3. Entry Confirmation Models Once an FVG is identified and price returns to mitigate it, the script offers three confirmation modes:
Instant (First Touch): Aggressive entry immediately when price touches the FVG box.
Reversal Close: Waits for a candle to close in the direction of the trend after touching the FVG (e.g., a green candle close after dipping into a bullish FVG).
Engulfing Candle: The most conservative filter. Requires a full engulfing candle pattern occurring within or bouncing off the FVG.
4. Advanced Filters To reduce false signals during choppy markets, two optional filters are included:
Volume Filter: Requires the breakout candle's volume to be higher than its Moving Average (multiplied by a user-defined factor).
Higher Timeframe (HTF) Trend: Checks the trend on a higher timeframe (e.g., 1H or 4H).
Logic: If the HTF Close is > HTF EMA 50, only Buy signals are permitted. If HTF Close < HTF EMA 50, only Sell signals are permitted.
5. Risk Management The script includes an automated Risk/Reward calculator.
Stop Loss (SL): Placed at the invalidation point of the FVG structure, plus an optional ATR buffer to account for volatility.
Take Profit (TP): Calculated based on a user-defined Risk:Reward ratio (e.g., 1:2) relative to the Stop Loss distance.
Dashboard A multi-timeframe dashboard is displayed to provide a "Glance View" of market bias across the Daily, 4H, 1H, and 15M timeframes, ensuring trades are aligned with macro momentum.
3 hours ago
Release Notes
🚀 GardFx - Fusion Pro V2: The Ultimate ORB & ICT Suite
Welcome to Version 2.0 of Fusion Pro. This update transforms the indicator from a simple breakout tool into a complete institutional trading system. We have integrated Multi-Timeframe (MTF) logic, Candlestick Pattern recognition, and Smart Exit management to filter out noise and catch high-probability moves.
🔥 NEW FEATURES IN V2:
1. 🧠 Smart MTF Bias & Voting System
No more guessing the trend. The script now checks Daily, 4H, 1H, and 15m timeframes.
Voting Logic: A trade is only signaled if the higher timeframes agree (e.g., 2 out of 3 votes).
Visuals: The dashboard displays the live bias for every timeframe.
2. 🎯 Advanced Entry Confirmations We have added specific trigger patterns to reduce fake-outs. You can now choose your entry style:
🦄 Unicorn Setup: ORB Level + FVG overlap.
🕯️ Candlestick Patterns: Pinbar, Engulfing, Tweezer Tops/Bottoms, and Inside Bar.
📉 FVG 50%: Wait for price to retrace to the 50% equilibrium of the gap before entering.
3. 🛡️ Entry Validation Modes Control exactly when the entry label fires:
Instant: Enters immediately upon touch.
Candle Close: Waits for the candle to close in your direction.
Break of High/Low: Places a pending order at the wick; only enters if momentum breaks that level.
Wait for MSS: Waits for a Market Structure Shift (local high/low break).
4. 💰 Dynamic Smart Exit (Secure TP)
A new Volume-Based Exit Manager detects sudden momentum shifts or volume spikes against your position.
It prints a "Secure TP" label to help you bank profits before a reversal occurs, even if the fixed TP hasn't been hit.
5. 📊 Enhanced Dashboard & Stats
Tracks Win/Loss rates separately for Asia, London, and New York sessions.
Weekly and Daily stats reset automatically.
Fully customizable size and position.
6. ⚡ Automated UK Sessions
Built-in timings for Asia, London, and New York based on UTC (London) time. No more timezone conversion headaches.

S_Sigma HTF Candles (UTC Draw / NY Labels)🕯️ S_Sigma HTF Candles (UTC Draw / NY Labels)
Multi-Timeframe Overlay with Session Labels & Imbalances
S_Sigma HTF Candles is a powerful, non-repainting overlay indicator that allows you to visualize up to 6 different Higher Timeframes (HTF) directly on your current chart.
Designed specifically for traders who need context without switching tabs, this tool draws accurate HTF candles using UTC time (standard for Crypto) while labeling them with New York Timezone data (standard for Stocks/Forex). It also detects Fair Value Gaps (FVG) and Volume Imbalances automatically.
🌟 Key Features
📊 6 Independent HTF Slots
Configure up to 6 different timeframes simultaneously (e.g., 15m, 1H, 4H, 1D, 1W). Each slot is customizable and can be toggled on/off independently.
🌍 UTC Drawing + NY Labels (The "Sigma" Edge)
Drawing: Candles are calculated strictly using UTC time to ensure wicks and bodies match exchange data (perfect for BTC/ETH).
Labels: Day of the Week (Mon/Tue/Wed) and Time labels are converted to America/New_York time. Never get confused by candle closes again.
#HTF Countdown Timer**
See exactly how much time is left until the Higher Timeframe candle closes. Essential for timing entries at the "Candle Close."
📈 Smart Imbalance Detection
FVG (Fair Value Gaps): Automatically highlights 3-candle reversal gaps.
VI (Volume Imbalance): Highlights wicks that pierce previous bodies.
🏗️ Custom Session Starts
Don't like the standard Daily candle? Force the Daily candle to open at 08:30 NY or 09:30 NY (Market Open) instead of Midnight UTC.
⚙️ Customization Options
Visuals: Full control over Bull/Bear colors, borders, wicks, and opacity.
Layout: Adjust padding, width, and spacing between timeframes to prevent overlap.
Trace Lines: Optional lines tracing the Open, High, Low, and Close of the forming HTF candle.
Labels: Toggle HTF names, Timers, and Day-of-Week labels on/off.
💡 How to Use
Add to Chart: The indicator draws candles to the right of the current price (offset) to keep your chart clean.
Check Alignment: Ensure the "Daily Name" matches your expected market session (NY Time).
Spot Entries: Look for price entering an FVG (Gray box) or hitting a HTF Support/Resistance level (Wick of the HTF candle).
Time Entries: Wait for the Timer to hit 00:00 for a confirmed candle close.
Perfect for: Smart Money Concepts (SMC), ICT, Wyckoff, and Multi-Timeframe Analysis.

Look Back Calculator Custom Lookbacks with Individual Colors (Accurate on All Timeframes)
A clean, monochrome-grey indicator that displays historical closing price levels from user-defined lookback periods.
Key Features:
• 4 Custom Hourly Levels (e.g., 1.5h, 3h, 6h, 9h or any value you choose) – fully accurate on 15-minute and lower timeframes
• 4 Custom Daily Levels (e.g., 20d, 40d, 60d, 90d or any number of days)
• Independent toggle for each level
• Individual color selection for every vertical line
• Table column backgrounds match the selected vertical line colors
• Optional candle highlighting (background/border/both) at lookback bars
• Dashed vertical lines at lookback points (toggleable)
• Current price row with automatic spanning
• Time row shown only for daily levels (cleaner layout for intraday)
• Alerts on price crossing any enabled level (with dynamic messages)
• Compact mode for shorter labels
Perfect for support/resistance analysis, order flow, or ICT/SMC concepts. Works seamlessly on any timeframe, including 15min charts.

CISD Engine with Alerts Pro |MC| CISD Engine with Alerts Pro |MC|
Credits go to TFlab 👍
💎 Understanding CISD (Change in the State of Delivery) 💎
A CISD occurs when one or multiple candlesticks form in a particular direction, followed immediately by candlesticks that close in the opposite direction, specifically closing below the opening price of the initial candlestick sequence. This phenomenon signals a change in market sentiment and potential price reversal.
Diagrammatic Representation of CISD
Illustrates the transition in price action signaling a shift in delivery state.
💎 Key Features of CISD 💎
Early Price Direction Change Identification:
CISD offers prompt signals of potential reversals before the confirmation of a Market Structure Shift (MSS).
Focus on Candlestick Open and Close Prices:
Analysis relies solely on candlestick open and close levels, disregarding the wicks or shadows to reduce noise.
Versatility Across Financial Markets:
Applicable universally to Forex, stocks, indices, cryptocurrencies, and other trading instruments.
💎 Technical Aspects of CISD 💎
The technical execution of CISD incorporates advanced data analytics to optimize trading decisions in the ICT framework.
Multi-Timeframe Analysis:
Use higher timeframes (daily, weekly) for confirming overall trend direction.
Employ lower timeframes (15-minute, 1-hour) for precise entry signals.
Combining multiple timeframes enhances signal reliability and trade timing accuracy.
Identification of Order Blocks:
Bullish Order Blocks emerge when bearish candles follow a bullish CISD, acting as strong support zones.
Bearish Order Blocks occur when bullish candles follow a bearish CISD, serving as resistance levels.
Market Timing Considerations:
CISD signals tend to be more reliable during major trading sessions such as London and New York open hours.
Occurrences near economic data releases often reflect the market’s response to fundamental news.
💎 Key Features Pro 💎
The Indicator plots the CISD+ and CISD- Lines on your chart (full customizable)
Difference to the most other CISD tools, ist the:
Pullback Candle Conviction: That means, the candle's body must be at least 50% (customizable) of its total range (high-low) to be valid. This helps to ignore weak or indecisive signals like Dojis.
A state display table is also provided.
Happy Trading!

SMT Divergence [Kodexius]SMT Divergence is a correlation-based divergence detector built around the Smart Money Technique concept: when two normally correlated instruments should be making similar swing progress, but one prints a new extreme while the other fails to confirm it. This “disagreement” can be a valuable contextual signal around liquidity runs, distribution phases, and potential reversal or continuation points.
The script compares the chart symbol (primary) with a user-selected comparison symbol (for example BTC vs ETH, ES vs NQ, EUR/USD vs GBP/USD) and automatically scans both instruments for confirmed swing highs and swing lows using pivot logic. Once swings are established, it checks for classic SMT conditions:
Primary makes a new swing extreme while the comparison symbol forms a non-confirming swing .
To support a wider range of markets, the indicator includes an Inverse Correlation option for pairs that typically move opposite to each other (for example DXY vs EUR/USD). With this enabled, the divergence rules are logically flipped so that the script still detects “non-confirmation” in a way that is consistent with the pair’s relationship.
The indicator is designed to be readable and actionable. It can draw divergence labels directly on the main chart, connect the relevant swing points with lines, show a compact information table with the last signal and settings, and optionally render the comparison symbol as a mini candle chart in the indicator pane for quick visual validation.
🔹 Features
🔸 Two-Symbol SMT Analysis (Primary vs Compare)
Select any comparison symbol to evaluate correlation structure and divergence. The script fetches the comparison OHLC data using the current chart timeframe to keep both series aligned for analysis.
🔸 Inverse Correlation Mode
For inversely correlated pairs, enable “Inverse Correlation” so the script interprets confirmation appropriately (for example, a higher low on the comparison instrument might be expected to correspond to a lower low on the primary, depending on the relationship). This helps avoid false conclusions when the pair naturally moves opposite.
🔸 Pivot-Based Swing with Adjustable Sensitivity
Swings are detected using confirmed pivots (left bars and right bars). This provides cleaner structural swing points compared with raw candle-to-candle comparisons, and it lets you control sensitivity for different market conditions and timeframes. The script also limits stored swing history to keep performance stable.
🔸 Flexible Detection Mode: Time Matched or Independent Swings
You can choose how swings are paired across instruments:
Time Matched searches for a comparison swing that occurred at the same pivot time as the primary swing.
Independent Swings compares each symbol’s own last two swings without requiring an exact time match.
🔸 Range Control and Noise Filtering
To reduce weak or irrelevant signals:
“Max Bars Between Swings” ensures the two swings being compared are close enough in structure to be meaningful.
“Min Price Diff (%)” can require a minimum percentage change between the primary’s last two swing prices to confirm the move is significant.
🔸 Clear Visual Output with Tooltips
When a divergence is detected, the script can print a label (“SMT”) with bullish or bearish styling and a tooltip that includes the symbol pair and the primary swing price for quick context.
🔸 Divergence Lines for Context
Optional lines connect the relevant swing points, making it easier to see the exact structure that triggered the signal. One line can be drawn on the main chart and another in the indicator pane for the comparison series.
🔸 Info Table (At a Glance)
A compact table can display the active symbols, correlation mode, total divergences stored, and the most recent signal type.
🔸 Alerts Included
Built-in alert conditions are provided for bullish SMT, bearish SMT, and any SMT event so you can automate notifications without editing the code.
🔸 Optional Comparison Candle Panel
If enabled, the indicator can plot the comparison symbol as candles in the indicator pane. This is useful for confirming whether the divergence is happening around major levels, consolidations, or impulsive legs on the secondary instrument.
🔹 Calculations
This section summarizes the core logic used by the script.
1. Data Synchronization (Comparison Symbol)
The comparison instrument is requested on the chart’s current timeframe so swing calculations are performed consistently:
=
request.security(compareSymbolInput, timeframe.period, )
This ensures pivots and swing times are derived from the same bar cadence as the primary chart.
2. Swing Detection via Confirmed Pivots
Swings are detected using pivot logic with user-defined left and right bars:
primaryPivotHigh = ta.pivothigh(high, pivotLeftBars, pivotRightBars)
primaryPivotLow = ta.pivotlow(low, pivotLeftBars, pivotRightBars)
Because pivots are confirmed only after the “right bars” have closed, the script stores each swing using an offset so the swing’s bar index and time reflect where the pivot actually occurred, not where it was confirmed.
3. Swing Storage and Retrieval
Both symbols maintain arrays of SwingPoint objects. Each new swing is pushed into the array, and older swings are dropped once the array exceeds the configured maximum. This makes the divergence engine predictable and prevents uncontrolled memory growth.
The script then retrieves the last and previous swing highs and lows (per symbol) to evaluate structure.
4. Matching Logic (Time Matched vs Independent)
When “Time Matched” is selected, the script searches the comparison swing array for a pivot that occurred at the exact same timestamp as the primary swing. When “Independent Swings” is selected, it simply uses the comparison symbol’s last two swings of the same type.
5. Bullish SMT Condition (LL vs HL)
A bullish SMT event is defined as:
Primary forms a lower low (last low < previous low)
Comparison forms a higher low (last low > previous low)
If inverse correlation is enabled, the comparison condition flips to maintain logical confirmation rules
The two primary swings must be within the configured bar distance window
Optional minimum percentage difference must be satisfied
A simple anti duplication rule prevents repeated triggers on the same structure
These checks are implemented directly in the bullish detection block.
6. Bearish SMT Condition (HH vs LH)
A bearish SMT event is defined as:
Primary forms a higher high (last high > previous high)
Comparison forms a lower high (last high < previous high)
Inverse correlation flips the comparison rule
Range checks, minimum difference filtering, and duplicate protection apply similarly
These checks are implemented in the bearish detection block.
7. Percentage Difference Filter
The optional “Min Price Diff (%)” filter measures the relative distance between the last two primary swing prices. This prevents very small structural changes from being treated as valid SMT signals.
priceDiffPerc = math.abs(lastSwing.price - prevSwing.price) / prevSwing.price * 100.0
The divergence condition is only allowed to trigger if this value exceeds the user defined threshold.
priceOk = priceDiffPerc >= minPriceDiff
This filter is especially useful on higher timeframes or during low volatility conditions, where micro structure noise can otherwise produce misleading signals.
8. Visualization and Output
When a divergence is confirmed, the script:
Stores the event in a divergence array (limited by “Max Divergences to Display”)
Draws a directional SMT label with a tooltip (optional)
Draws connecting lines using time based coordinates for clean alignment (optional)
It also updates an information table on the last bar only, and exposes alertconditions for automation workflows.

Midnight Opening RangeThis script uses the SMC/ICT midnight opening range to gain insight into the daily highs and lows.
It plots the opening range quadrants and the 0.5 and 1 standard deviations higher and lower.
These levels are often used as support/resistance at certain times of the day.
To be used in concert with other PD arrays.
