Covengers Ichimoku Cloud ver 0.4Covegers Ichimoku Cloud ver 0.4 Released !
Middle Price Line Updated !
IF,
High Price Line head Downward = Sell
Low Price Line head Upward = Buy
EASY WORK.
//
코벤져스 일목구름 0.4 버전이 출시되었습니다.
중간값 선이 추가되었습니다.
만약,
고가의 중간선이 하향한다면 매도
저가의 중간선이 상향한다면 매수
정말 간단한 개념인데 결과가 재밌습니다.
0.41 버전이 추가업데이트 될 예정입니다.
스크립트에서 "ichimoku"에 대해 찾기


Covengers Ichimoku Cloud ver0.3Covengers Ichimoku Cloud ver0.3
What's NEW?
ver 0.3 Plot Arrow When leadLine 1 and leadLine 2 CROSS
-END-
버전 0.3에서 변한 것
구름대 꼬임이 일어날 경우 화살표를 표시합니다.
끝

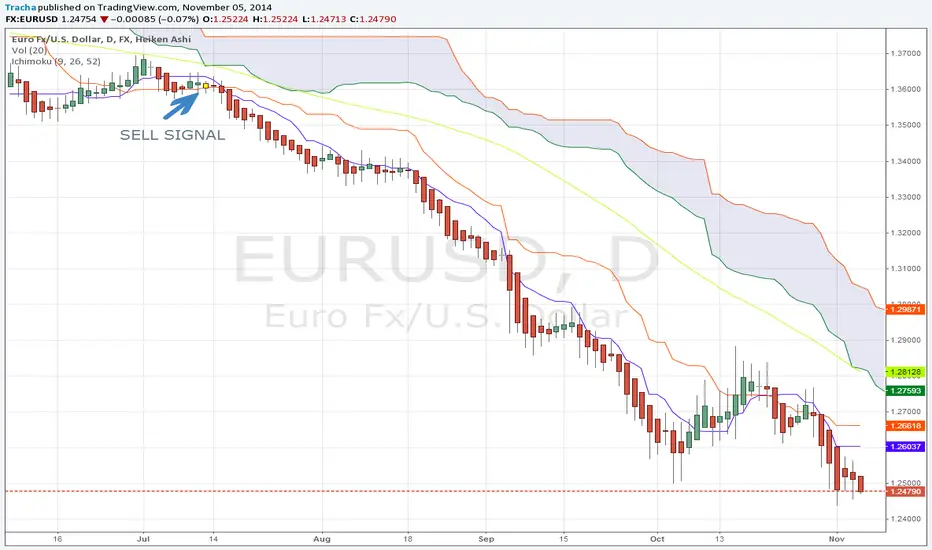
Heiken Ashi IchimokuWELCOME!
I want to share with you with my Heiken Ashi Ichimoku system
.
Remember to fallow me to get more startegy, or signals. Click like if u enjoy it :)
IMPORTANT:
System works with Heiken Ashi bars!!
The signals.
SELL SIGNAL:
1. When price is below:
a) cloud
b) blue line
2. When last bar was green, and now turn to red
3. When heiken ashi bar is close to SMA55, but its below SMA55
BUY SIGNAL:
1. When price is above:
a) cloud
b) blue line
2. When last bar was red, and now turn to green
3. When heiken ashi bar is close to SMA55, but its above SMA55
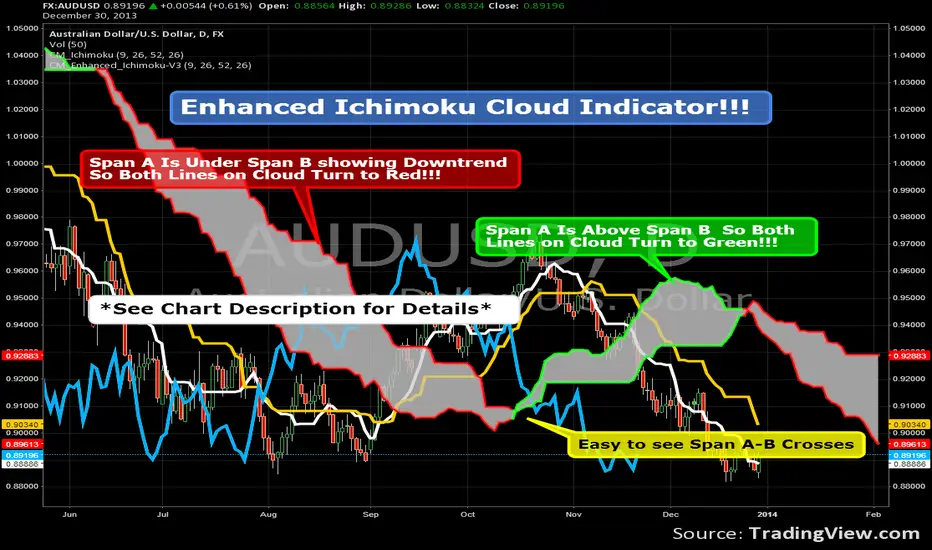
Enhanced Ichimoku Cloud Indicator!!!There are two Custom Ichimoku Indicators on the chart.
The one that is hidden is the Ichimoku Indicator with
The correct names for the lines Under the Style Tab.
The Indicator shown is coded so when the cloud is in
a down trend both lines turn Red.
When the Cloud is rising both lines turn to Green.
Because of the code used in order to switch the colors of
Both Lines at the same time I couldn't name Senkou Span A
and Senkou Span B in the "Styles" Tab.
You can still modify the colors to customize chart.
Ichimoku with Correct DisplacementThe default Ichimoku Cloud by TradingView is strange. The kumo is only displaced 25 periods forward, and the chikou is displaced 25 periods back. This is because TradingView had the correct value for displacement (26), but they decided to subtract this displacement by 1 when actually drawing the kumo and add 1 when drawing the chikou. This script fixes this and allows for easier customization of each line in the Ichimoku.

Open Source Ichimoku Kinkō hyō Keizen 改善Open Source Ichimoku Kinkō hyō Keizen 改善
First of all, thank you for using my work, making changes and continuing to share it for free.
I chose as indicator name Ichimoku Kinkō hyō Keizen logically simply by
what the word Keizen reflects a Japanese method which means continuous improvement and quality.
The goal here is to correct already any offset faults that should not be present and to try
to bring the indicator of new things that can serve and advance
and provide additional support for the decision.
A continuation will surely be planned which will bring its batch of new elements which will come
naturally be grafted to this tool.
Possibility of adding or not adding new lines Jun (76), Kan (226), Junkan A, B (676).
- Junakan To be calculated on the average of Jun / Kan 151 periods.
- Junkan B calculate over the 676 periods.
- Possibility of adding or not adding a new kinkohoyo calculate on Jun (76) and Kan (226).
- Possibility of adding or not adding a new Kumo calculate over 676 periods.
- Possibility of coloring or not the kumos or the kinkohyos.
- Possibility of adding or not Chikō 9,26,52,76,226,676.
- Ability to display or not passive lines in the future, 5 shots ahead of the movement of lines, provided that the extremes are not broken.
Thank you:
Thanks to TomQSD to have tested all the different versions of this project and to have contributed his criticism that helped me a lot to develop the tool.
Thanks to Herveo for having agreed to share his code
on the passive lines.
Remarks:
Not all options are activated at the same time.
Please do not uncheck the boxes in style, only change the colors.
To enable or disable lines, go to input parameters.
//////////////////////////////////////////////////////////////////////////////////////////////////////////////////////////////////////////////////////////////////////////////////////////////////////////////////////////////////
Open Source Ichimoku Kinkō hyō Keizen 改善
Tous d'abord, merci d'utiliser mon travail, d'apporter des modification et de continuer à le partager gratuitement.
J'ai choisi comme nom d’indicateur Ichimoku Kinkō hyō Keizen en toute logique tout simplement par
ce que le mot Keizen reflète une méthode Japonaise qui veut dire amélioration en continue et qualité.
Le but ici est de corriger déjà tout les défauts de décalage qui ne devraient pas être présents et d’essayer
d’apporter sans trop charger l’indicateur des choses nouvelles qui peuvent servir et faire progresser
et apporter une aide supplémentaire à la décision.
Une suite sera sûrement prévue qui apportera son lot d'éléments nouveaux qui viendront
naturellement se greffer à cet outil.
- Possibilité d’ajout ou non de nouvelles lignes Jun (76) , Kan (226) , Junkan A,B (676).
- Junakan A calculer sur la moyenne de Jun/Kan 151 périodes.
- Junkan B calculer sur les 676 périodes.
- Possibilité d’ajout ou non d’un nouveau kinkohoyo calculer sur le Jun (76) et le Kan (226).
- Possibilité d’ajout ou non d’un nouveau Kumo calculer sur 676 périodes.
- Possibilité de colorier ou non le ou les kumos et le ou les kinkohyos.
- Possibilité d’ajout ou non de Chikō 9,26,52,76,226,676.
- Possibilité d’afficher ou non de lignes passives dans le future, 5 coups d’avance sur les déplacement des lignes, a condition que les extrêmes ne soient pas rompu.
Remerciement :
Merci à TomQSD d'avoir tester toutes les différentes versions de ce projet et d’avoir apporter sa critique qui m'a beaucoup aidé à développer l’outil.
Merci à Herveo pour sont accord d’avoir bien voulu partager son code
sur les lignes passives.
Remarques:
Toutes les options ne sont pas toutes à activer en même temps.
Merci de ne pas décocher les cases dans style, modifiez seulement les couleurs.
Pour activer ou désactiver des lignes, allez dans paramètres en entrée.

Ichimoku Cloud Indicator [TradingFinder] Kinko Hyo Cross Alerts🔵 Introduction
The Ichimoku Cloud (Ichimoku Kinko Hyo) is one of the most powerful and complete trading indicators in technical analysis. Originally developed by Japanese journalist Goichi Hosoda, the Ichimoku system combines multiple tools in one indicator, providing traders with instant insights into trend direction, support and resistance levels, and momentum. Unlike simple moving averages (SMA – Simple Moving Average), the Ichimoku Cloud (Kumo – Cloud) integrates dynamic elements that help traders forecast potential price action with greater clarity.
The Ichimoku Indicator (Ichimoku Signal System) is widely used across global markets, from Forex trading (FX – Foreign Exchange) to stocks, indices, and even cryptocurrencies. Its popularity comes from its ability to generate clear buy signals and sell signals based on the interaction of its components: Tenkan Sen (Conversion Line), Kijun Sen (Base Line), Senkou Span A, Senkou Span B, and Chikou Span (Lagging Line). When combined, these lines create the Ichimoku Cloud, which visually represents the balance between price action and market structure.
Ichimoku Cloud Lines Formulas :
Conversion Line (Tenkan Sen / Conversion Line) : Average of the highest high and lowest low over the past 9 periods => (9-PH + 9-PL) ÷ 2
Base Line (Kijun Sen / Base Line) : Average of the highest high and lowest low over the past 26 periods => (26-PH + 26-PL) ÷ 2
Leading Span A (Senkou Span A / Leading Span A) : Average of the Conversion Line and Base Line, plotted 26 periods ahead => (Tenkan Sen + Kijun Sen) ÷ 2
Leading Span B (Senkou Span B / Leading Span B) : Average of the highest high and lowest low over the past 52 periods, plotted 26 periods ahead => (52-PH + 52-PL) ÷ 2
Lagging Span (Chikou Span / Lagging Span) : Current closing price, plotted 26 periods behind.
One of the biggest advantages of the Ichimoku Trading Strategy (Ichimoku Cloud Trading System) is that it allows traders to identify the market condition at a glance. When the price is above the Kumo (Cloud), it indicates a bullish trend (uptrend). When the price is below the Kumo, the market is in a bearish trend (downtrend). And when the price is inside the cloud, the market is ranging (sideways trend). This simplicity and visual clarity make Ichimoku an essential indicator for both beginner traders and professional analysts.
The Ichimoku Cloud Indicator (Ichimoku Technical Analysis Tool) continues to be one of the most reliable charting methods. Traders often consider it superior to basic moving averages (MA – Moving Average) or exponential moving averages (EMA – Exponential Moving Average), because it not only shows trend direction but also highlights potential future support and resistance levels. With its unique combination of trend analysis, price forecasting, and trading signals, Ichimoku remains a core strategy in modern trading systems.
🔵 How to Use
The Ichimoku Cloud is more than just a set of lines; it’s a complete trading system that helps traders identify trends, momentum, and key support and resistance levels. By combining its five lines Conversion Line, Base Line, Leading Span A, Leading Span B, and Lagging Span traders can develop clear buy and sell strategies.
🟣 Identifying Trend Direction
Bullish Trend (Uptrend) : Price is above the cloud (Kumo), and the cloud is green. Leading Span A is above Leading Span B, signaling strong upward momentum.
Bearish Trend (Downtrend) : Price is below the cloud, and the cloud is red. Leading Span A is below Leading Span B, confirming a downward momentum.
Ranging / Sideways Market : Price is inside the cloud, indicating indecision and consolidation. Traders often avoid opening strong positions during these periods.
🟣 Buy Strategies
Conversion/Base Line Crossover : A buy signal occurs when the Conversion Line (Tenkan Sen) crosses above the Base Line (Kijun Sen). The signal is strongest when this crossover happens above the cloud.
Price Above Base Line : If the price moves above the Base Line while in an uptrend, it confirms bullish momentum and provides a favorable entry point.
Cloud Support Pullback : During a pullback in an uptrend, the price may touch or slightly enter the cloud. Traders can use the cloud as a dynamic support zone for buying opportunities.
Lagging Span Confirmation : Ensure the Lagging Span (Chikou Span) is above the price of 26 periods ago to confirm the strength of the bullish trend.
🟣 Sell Strategies
Conversion/Base Line Crossover : A sell signal is generated when the Conversion Line (Tenkan Sen) crosses below the Base Line (Kijun Sen). This signal is strongest when it occurs below the cloud.
Price Below Base Line : If the price falls below the Base Line in a downtrend, it confirms bearish momentum and strengthens the sell setup.
Cloud Resistance Pullback : During a bounce in a downtrend, the cloud acts as a resistance zone. Traders can enter sell positions when price approaches or touches the cloud from below.
Lagging Span Confirmation : The Lagging Span should be below the price of 26 periods ago, confirming downward momentum.
🟣 Cloud Breakout Signals
A strong buy occurs when the price breaks above the cloud from below, signaling a potential trend reversal.
A strong sell occurs when the price breaks below the cloud from above, indicating a shift toward a bearish trend.
🟣 Combining Signals for Stronger Entries
For higher probability trades, combine multiple signals : trend direction (cloud color and position), crossovers (Tenkan/Kijun), and Lagging Span position.
Avoid trading against the overall trend. For example, avoid buying when price is below a red cloud or selling when price is above a green cloud.
🔵 Setting
Tenkan Sen Period : Lookback period for Conversion Line (default: 9).
Kijun Sen Period : Lookback period for Base Line (default: 26).
Span B Period : Lookback period for Leading Span B, forms one Cloud boundary (default: 52).
Shift Lines : Periods forward for Cloud / backward for Lagging Span (default: 26).
Cross Tenkan/Kijun Alert : Alert on Conversion/Base Line crossover.
Cross Price/Tenkan Alert : Alert when price crosses Tenkan Sen.
Cross Price/Kijun Alert : Alert when price crosses Kijun Sen
🔵 Conclusion
The Ichimoku Cloud (Ichimoku Kinko Hyo) is much more than a simple indicator it is a complete trading system that combines trend detection, momentum analysis, and support/resistance identification in one view. By interpreting the position of price relative to the cloud, the interaction between Tenkan Sen (Conversion Line) and Kijun Sen (Base Line), the leading spans (Senkou Span A and B), and the Chikou Span (Lagging Line), traders can identify potential buy and sell opportunities with higher confidence.
The main advantage of the Ichimoku Cloud is its ability to provide a “one-look equilibrium” snapshot of the market. It highlights bullish trends when the price is above the cloud, bearish conditions when the price is below it, and indecision or transition when the price is inside the cloud. Crossovers, cloud breakouts, and confirmations by the Chikou Span strengthen the trading signals.
However, traders should keep in mind the limitations of the Ichimoku system. It is based on historical data and should not be used in isolation. Combining it with other tools such as RSI, volume analysis, or candlestick patterns can significantly improve accuracy and reduce false signals.

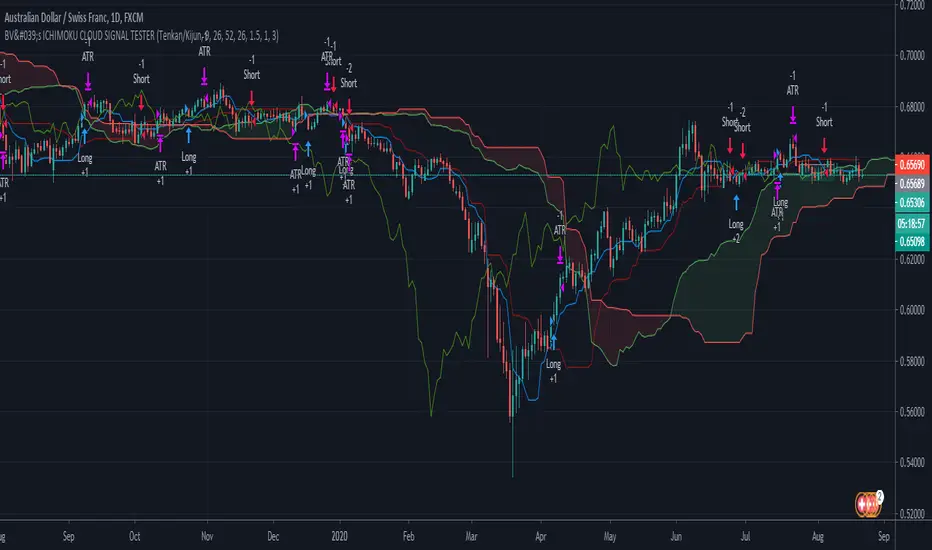
BV's ICHIMOKU CLOUD - All Signalshello traders,
With this script you will be able to test the different signals offered by the ichimoku cloud system.
Crossover Tenkan Kijun
Crossover Tenkan Kijun above Kumo
Crossover Price Kijun
Crossover Price Kijun above Kumo
Crossover Price Tenkan
Crossover Prince Tenkan aboce Kumo
Crossover price Kumo
Kumo Color Change
Remember to check the JPYPAIR checkbox if you test a JPY/xxx pair, this will adjust the stop loss and take profit calculation.
You can also adjust the TP and SL values in the parameters to change their ratio. I had good results in 1.5:1 with the :
SL = 2.25 x ATR(14)
TP = 1.5 x ATR(14)
At your tests, don't hesitate to share your results.
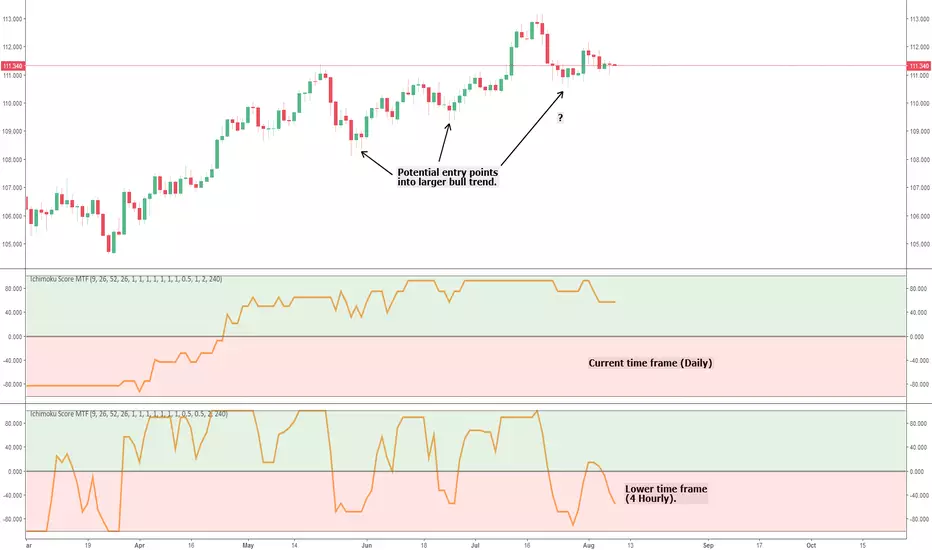
Ichimoku Cloud Score MTFThis is a simple multi time frame (MTF) conversion of the Ichimoku Cloud Score indicator.
All credit goes to the following users for the initial implementations:
- User @dashed :
- User @sjb933 :
This script calculates the Cloud Score based on the sjb933 version; all I've done is convert the script to Pinescript version 3 (to ensure the security function works as intended) and add MTF capability.
I'm a big fan of MTF analysis when using indicators (particularly oscillators). Using a higher time frame runs into the issue of the indicator repainting until the relevant higher time frame candle closes (this is inevitable and logical - so don't comment saying it repaints!). However, for lagging indicators such as this one, adding a lower time frame provides potential entry and exit signals into the larger trend, and also provides early warning of large trend shifts before the current time frame will. This can give you more control over your trades, and in my experience helps lagging indicators such as Ichimoku stay relevant in high volatility markets that are vastly different from when the indicators were conceived.
Any queries please let me know.
Cheers,
RJR
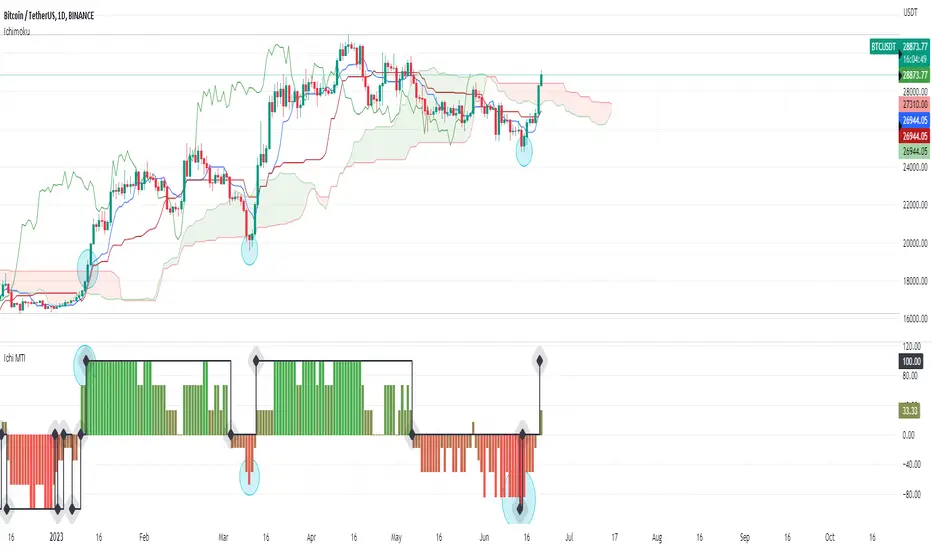
Ichimoku Cloud Momentum & Trend Indicator «NoaTrader»If you like Ichimoku cloud and use it in your analysis, or you are new to it and sometimes gets tricky to figure out all the details, this indicator tries to simplify that and visualize the change of trend and momentum relative to the past based on ichimoku.
The RED/GREEN columns are showing momentum strength while the black diamond line suggests the trend change. The conditions are simple enough to check them out on the script.
As you can see highlighted cyan circles on the chart as major important signals on the chart of Bitcoin daily timeframe.
This script tries to be complementary to the ichimoku cloud itself and cannot replace the levels represented by the cloud on chart.
Ichimoku Score Indicator [tanayroy]The Ichimoku Cloud is a comprehensive indicator that provides a clear view of market states through five key components. By analyzing the interaction between these components and the asset's price, traders can gain insights into trend direction, momentum, and potential reversals.
Introducing the Ichimoku Score System
I have developed a scoring system that quantifies these interactions, offering an objective method to evaluate market conditions. The score is calculated based on the relative positioning of Ichimoku components, with adjustable weightings via user input.
Scoring Criteria
Each component contributes to the overall score as follows:
Price vs. Cloud (Kumo) & Other Components
Price vs. Kumo → 2 Points
Price vs. Kumo Shadow → 0.5 Points
Tenkan vs. Kijun
Tenkan vs. Kijun → 2 Points
Tenkan vs. Kumo → 0.5 Points
Kijun vs. Kumo → 0.5 Points
Tenkan Slope → 0.5 Points
Kijun Slope → 0.5 Points
Chikou Span Interactions
Price vs. Chikou → 2 Points
Chikou vs. Kumo → 0.5 Points
Chikou Consolidation → 0.5 Points
Senkou Span Analysis
Senkou A vs. Senkou B → 2 Points
Senkou Slope → 0.5 Points
Price vs. Key Levels
Price vs. Tenkan → 2 Points
Price vs. Kijun → 2 Points
Interpreting the Score
The aggregate score functions as an oscillator, fluctuating between a range of ±16.0.
A higher score indicates strong bullish momentum.
A lower score suggests bearish market conditions.
To enhance readability and smooth fluctuations, a 9-period SMA is applied to the score.
Application in Algorithmic Trading
This scoring system helps integrate Ichimoku Cloud principles into algorithmic trading strategies by providing a structured and quantifiable method for assessing market conditions.
Would love to hear your feedback! 🚀 Let me know how this system works for you.

Multi Timeframe Silent IchimokuMulti Timeframe Silent Ichimoku
Is an upgrade on my previous Silent Ichimoku indicator witch attempts to filter out the noise from the Ichimoku indicator By only coloring the bars
Green if the Ichimoku spots an uptrend
Red if Ichimoku spots a downtrend
And Gray if Ichimoku spots consolidation
This Indicator adds the ability to filter out some bad signals by taking the Ichimoku from the higher time frame into consideration and providing a visual back test
Huge shout out to fareidzulkifli for the Quick Backtest Framework Awesome tool to add to your framework

Ichimoku Cloud and ADX with Trailing Stop Loss (by Coinrule)The Ichimoku Cloud is a collection of technical indicators that show support and resistance levels, as well as momentum and trend direction. It does this by taking multiple averages and plotting them on a chart. It also uses these figures to compute a “cloud” that attempts to forecast where the price may find support or resistance in the future.
The Ichimoku Cloud was developed by Goichi Hosoda, a Japanese journalist, and published in the late 1960s. It provides more data points than the standard candlestick chart. While it seems complicated at first glance, those familiar with how to read the charts often find it easy to understand with well-defined trading signals.
The Ichimoku Cloud is composed of five lines or calculations, two of which comprise a cloud where the difference between the two lines is shaded in.
The lines include a nine-period average, a 26-period average, an average of those two averages, a 52-period average, and a lagging closing price line.
The cloud is a key part of the indicator. When the price is below the cloud, the trend is down. When the price is above the cloud, the trend is up.
The above trend signals are strengthened if the cloud is moving in the same direction as the price. For example, during an uptrend, the top of the cloud is moving up, or during a downtrend, the bottom of the cloud is moving down.
DMI is simple to interpret. When +DI > - DI, it means the price is trending up. On the other hand, when -DI > +DI, the trend is weak or moving on the downside. The ADX does not give an indication of the direction but about the strength of the trend.
Typically values of ADX above 25 mean that the trend is steeply moving up or down, based on the -DI and +DI positioning. This script aims to capture swings in the DMI, and thus, in the trend of the asset, using a contrarian approach.
Trading on high values of ADX, the strategy tries to spot extremely oversold and overbought conditions. Values of ADX above 45 may suggest that the trend has overextended and is maybe about to reverse.
This strategy combines the Ichimoku Cloud with the ADX indicator to better enter trades.
Long orders are placed when these basic signals are triggered.
Long Position:
Tenkan-Sen is above the Kijun-Sen
Chikou-Span is above the close of 26 bars ago
Close is above the Kumo Cloud
MACD line crosses over the signal line
-DI is greater than +DI
ADX is greater than 45
Close Position:
3% increase trailing
3% decrease trailing
The script is backtested from December 2022 and provides good returns.
A trading fee of 0.1% is also taken into account and is aligned to the base fee applied on Binance.

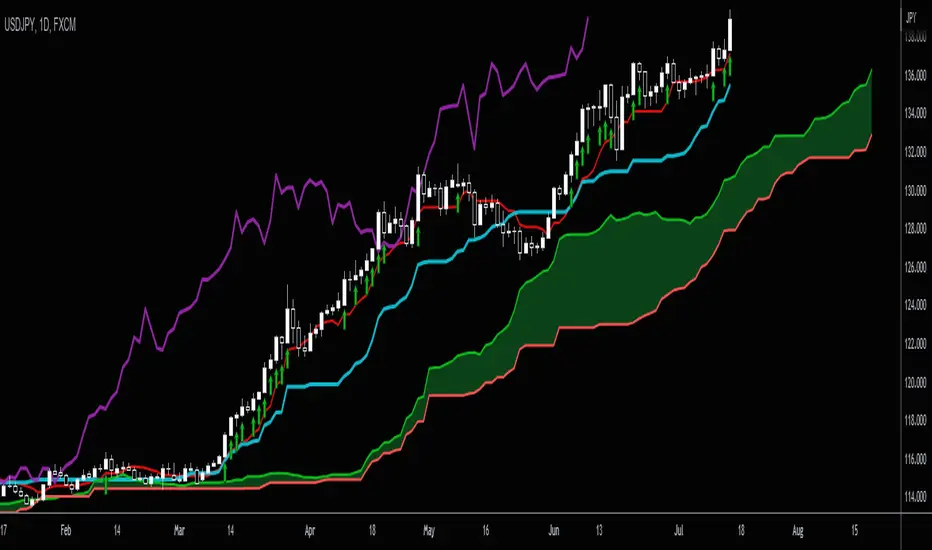
Equilibriums -- Based on Ichimoku Kinko HyoIntro:
Hello dear traders. Lately I have been studying Ichimoku for trading. Personaly I find myself in a long lasting quest of creating an automated trading strategy that works.
Let me tell you it aint easy. On this route I made countless of indicators some of which are worthless, others that have some potential. I did not publish these indicators as I do not want to bother people with sub par indicators that waste your time. My belief is strong and some day I will probably succeed in creating a working strategy.
About the indicator:
While researching Ichimoku Kinko Hyo (thanks chaostrader69 for providing such invaluable knowledge) I came across the numbers that define ichimoku. The Tenkan-sen and Kijun-sen lines and even the cloud are based on these numbers and create market equilibrium. The market always wants to return to this equilibrium. As a pine scripter and curious individual I made this indicator to expand the Tenkan and Kijun lines to more of these ichimoku number periods.
Ofcourse this creates a mess of an indicator especialy when combined with the real ichimoku which is already too much info to grasp and apply correctly for most traders. I can not recommend any strategy with this indicator and that is why I want to deliver this simple script to the public. Opinions and trading theorys regarding these lines are very welcome.
As you can see by the chart on the publication of this script the lines where nice and open and not crossing eachother in a clear uptrend. While when it was trading sideways the lines did not show direction at all and where close to eachother and crossing. Thx for taking the time to read this and possibly giving feedback. Feedback on the colors/line thickness is also welcome as I want my indicators to be beautiful!

Simple Ichimoku Signal v1Simple Ichimoku Signal v1 - Use Original Japanese Ichimoku System
You can set alert to get notify on your phone when the signals appear:
- BUY signal (green arrow): when all lines of Ichimoku system have bullish
- SELL signal (red arrow): when all lines of Ichimoku system have bearish
Very easy to use for everyone expecially people who has less time for trading. Simple but very effective!
Please remember: all trading system can be right/wrong so the risk management is super important!
Good luck!
Ichimoku Oscillator With Divergences [ChartPrime]The Ichimoku Oscillator is a trading indicator designed to streamline the interpretation of Ichimoku clouds. It aims to refine and condense the complexities of the Chikou (the lag line), presenting its implications in real-time through an oscillator format, beneficial for those familiar with Ichimoku components but to have a new interpretation of their indicators.
The basics of an Ichimoku:
Conversion Line (Tenkan-Sen): It represents a midpoint of the highest and lowest prices over a specific period, usually 9 periods, reflecting short-term price movements.
Base Line (Kijun-Sen): It acts similarly to the Conversion Line but over a longer period, typically 26 periods, representing medium-term price movements.
Leading Span A & B (Kumo): Span A is the average of the Conversion Line and Base Line, and Span B is the midpoint of the highest and lowest prices over a usually longer period, typically 52 periods. Their interaction denotes trend direction, and the cloud color changes depending on whether Span A is above or below Span B, indicating bullish or bearish market conditions, respectively.
Lagging Span (Chikou Span): It is the current closing price plotted 26 periods behind, assisting in confirming the trend direction and potential momentum.
Advantage of an Oscillator:
Utilizing the oscillator format allows traders to interpret market dynamics more efficiently by visualizing the momentum and trend strength in a bounded range, enabling quick assessments of overbought or oversold conditions. Creating this oscillator provides multiple advantageous; particularly in sideway markets, helping to identify potential reversal points and offering insights on market entries and exits. When building this oscillator we've put a focus on unique interpretations such as overbought and sold areas and divergences; otherwise not found in traditional Ichimoku techniques. It is important to note these divergences are naturally not 100% real time.
When the oscillator turns green; the market is in an uptrend, red for downtrend and yellow for a transitioning market. The center line and the inner most cloud represent a balanced market state.
Key Features & Input Parameters:
Signal Source: Allows the selection of the price data source for signal generation, such as closing prices, and it’s the foundational parameter upon which the oscillator functions.
Normalization Settings: Users can select the normalization mode (“All”, “Window”, or “Disabled”), influencing how the oscillator scales its values. When enabled, it will scale from 100 to -100, allowing the user to understand better the relative positioning of price data.
Smoothing: This indicator offers advanced smoothing features, with options for additional smoothing, allowing traders to adjust the signal's sensitivity to price movements.
Kumo & Chikou Visibility: Traders can customize the visibility settings of Kumo and Chikou, tailoring the display of each component to their preference, enabling a cleaner and more intuitive view of market conditions.
Color Coding: Each component and condition, like bullish or bearish states, can be color-coded, providing visual cues to enhance the interpretability of market trends and states.
Color on Conversion: The oscillator provides an option to color the signal based on the crossover of the conversion and base lines.
Divergence: The oscillator can detect and highlight regular and hidden bullish and bearish divergences between the signal and price, aiding traders in identifying potential trend reversals or continuations.
Alerts:
The list of inbuilt alerts are provided below:
Inside Cloud: The signal line is inside the cloud.
Up Out of Cloud: The signal line crossed above the cloud.
Down Out of Cloud: The signal line crossed below the cloud.
Future Kumo Cross Bullish: The future Kumo lines have crossed in a bullish manner.
Future Kumo Cross Bearish: The future Kumo lines have crossed in a bearish manner.
Current Kumo Cross Bullish: The current Kumo lines have crossed in a bullish manner.
Current Kumo Cross Bearish: The current Kumo lines have crossed in a bearish manner.
Conversion Base Bullish: The conversion line crossed above the base line.
Conversion Base Bearish: The conversion line crossed below the base line.
Signal Bullish on Conversion Base: The signal line crossed above the maximum of conversion and base lines.
Signal Bearish on Conversion Base: The signal line crossed below the minimum of conversion and base lines.
Chikou Bullish: The Chikou line crossed above zero.
Chikou Bearish: The Chikou line crossed below zero.
Signal Over Max: The signal line crossed above the max level.
Signal Over High: The signal line crossed above the high level.
Signal Under Min: The signal line crossed below the min level.
Signal Under Low: The signal line crossed below the low level.
Chikou Over Max: The Chikou line crossed above the max level.
Chikou Over High: The Chikou line crossed above the high level.
Chikou Under Min: The Chikou line crossed below the min level.
Chikou Under Low: The Chikou line crossed below the low level.
Signal Crossover MA: The signal line crossed over the moving average.
Signal Crossunder MA: The signal line crossed under the moving average.
Regular Bullish Divergence: Regular bullish divergence detected.
Hidden Bullish Divergence: Hidden bullish divergence detected.
Regular Bearish Divergence: Regular bearish divergence detected.
Hidden Bearish Divergence: Hidden bearish divergence detected.
Bounce off of Kumo Up: Bullish Bounce off of Kumo.
Bounce off of Kumo Down: Bearish Bounce off of Kumo.
By providing a cohesive visualization of the Ichimoku elements and market momentum within a bounded range, this oscillator is a unique tool and insight into markets.

Ichimoku Clouds Strong Bullish/Bearish signals and alertsIchimoku Clouds Strong Bullish/Bearish signals with allerts
The Ichimoku cloud was developed by Goichi Hosoda, a Japanese journalist, and published in the late 1960s. It provides more data points than the standard candlestick chart. While it seems complicated at first glance, those familiar with how to read the charts often find it easy to understand with well-defined trading signals.
We provide you easy-to-use script which helps to decrypt meaning of lines in the indicator. The script takes Ichimoku clouds indicator formulas to calculate Tenkan, Kijun, SenkouA, SenkouB values and examines them in order to produce buy ( Bullish ) and sell ( Bearish ) signals which are displayed at the chart
The most appropriate time frame is 30m
Custom alerts are added to send you a notice with a webhook when bullish or bearish signal arrives.
You can easily add weak and neutral signals alerts by removing "//" in a specified place
Feel free to copy and use this script for your ideas and trading. You can modify the script by adding Parabolic SAR in order to increase accuracy of positions closure

Ichimoku Cloud Signals [sgbpulse] Ichimoku Cloud Signals – Your Advanced Trading Tool
Meet Ichimoku Cloud Signals, the enhanced and interactive version of the classic Ichimoku Cloud indicator, designed specifically for TradingView traders seeking precision and flexibility in their trading decisions. This indicator allows you to maximize the Ichimoku's potential by customizing trend criteria, receiving clear visual signals for entering and exiting positions, and getting alerts to keep you informed.
Introduction to the Ichimoku Cloud
The Ichimoku Cloud, also known as Ichimoku Kinko Hyo, is a comprehensive technical analysis tool developed in Japan. It provides a broad view of the market: trend direction, momentum, and support and resistance levels. "Ichimoku Cloud Signals" takes this power and amplifies it with advanced features.
Key Components of the Ichimoku Cloud
The indicator displays all five familiar Ichimoku lines, along with the "Cloud" (Kumo):
Tenkan-sen (Conversion Line): Calculated as the average of the highest high and lowest low over the past 9 periods. A fast, short-term indicator used as a measure of immediate momentum.
Kijun-sen (Base Line): Calculated as the average of the highest high and lowest low over the past 26 periods. A medium-term reference line serving as a significant support/resistance level.
Senkou Span A (Leading Span A): The average of the Tenkan-sen and Kijun-sen, shifted 26 periods forward into the future.
Senkou Span B (Leading Span B): The average of the highest high and lowest low over the past 52 periods, also shifted 26 periods forward into the future.
Kumo (Cloud): The area between Senkou Span A and Senkou Span B. Its color changes: green for an uptrend (when Senkou Span A is above Senkou Span B) and red for a downtrend (when Senkou Span B is above Senkou Span A). The Cloud serves as a dynamic area of support/resistance and a tool for forecasting future trends.
Chikou Span (Lagging Span): The current closing price, shifted 26 periods backward into the past. It serves as a powerful trend confirmation tool.
How the Ichimoku Cloud Works and How to Interpret It
Trend Identification :
- Uptrend (Bullish): The price is above the Cloud. The higher the price is above the Cloud, the stronger the trend.
- Downtrend (Bearish): The price is below the Cloud. The lower the price is below the Cloud, the stronger the trend.
- Range/Consolidation: The price is within the Cloud. This indicates a market without a clear direction or one that is consolidating.
Support and Resistance:
- The Cloud itself acts as a dynamic area of support and resistance. In an uptrend, the Cloud serves as support. In a downtrend, it serves as resistance.
- A thick Cloud indicates stronger support/resistance levels, while a thin Cloud indicates weaker levels.
The Cloud as a Predictive Indicator:
The uniqueness of the Kumo (Cloud) lies in its ability to be shifted 26 periods forward. This part of the Cloud provides forecasts for future support and resistance levels and even suggests expected trend changes (like a "Kumo Twist" – a change in Cloud color), giving you a planning advantage.
Unique Advantages of Ichimoku Cloud Signals:
Ichimoku Cloud Signals takes the classic Ichimoku principles and gives you unprecedented control:
Focused Trend Selection:
Choose whether you want to analyze a bullish (uptrend) or bearish (downtrend) trend. The indicator will focus on the relevant criteria for your selection.
Customizable Trend Confirmation Criteria (8 Criteria):
The indicator relies on 8 key criteria for clear trend confirmation. You can enable or disable each criterion individually based on your trading strategy and desired risk level. Each criterion plays a vital role in confirming the strength of the trend:
- Price position relative to the Cloud (Kumo) (Default: true): Determines the main trend direction and whether it's bullish or bearish.
- Price position relative to Kijun-sen (Base Line) (Default: true): Indicates the medium-term trend and acts as a critical equilibrium level.
- Price position relative to Tenkan-sen (Conversion Line) (Default: false): Provides quick confirmation of current momentum and short-term market changes.
- Tenkan-sen (Conversion Line) / Kijun-sen (Base Line) Crossover (Default: true): A classic signal for momentum change, crucial for identifying entry points.
- Current Cloud trend (Kumo) (Default: false): Cloud color confirms the main trend direction in real-time.
- Projected Future Cloud trend (Kumo) (Default: true): Indicates an expected future change in the Cloud's trend, providing strong visual insight.
- Chikou Span (Lagging Span) position relative to the Cloud (Kumo) (Default: true): Confirms the current trend strength by comparing the price to the Ichimoku 26 periods ago.
- Chikou Span (Lagging Span) position relative to the Price (Default: false): Additional confirmation of trend strength, indicating buyer/seller dominance.
Full Customization of Ichimoku Parameters:
You can change the period lengths for each Ichimoku component, depending on your strategy:
- Conversion Line Length (Default: 9)
- Base Line Length (Default: 26)
- Leading Span Length (Default: 52)
- Cloud Lagging Length (Default: 26)
- Lagging Span Length (Default: 26)
Visual Criteria Table on the Chart:
Get immediate and clear feedback! A visual table is placed on the chart, showing in real-time which of the 8 criteria you have defined are met for your chosen trend. Criteria you have enabled will be highlighted with a blue color and a "➤" symbol, while disabled criteria will appear in a subtle gray shade. For each criterion, the table shows its real-time status with a "✔" symbol if the condition is met and an "✘" symbol if it is not met. This powerful visual tool provides a quick assessment, helps with learning, and allows for strategy optimization at the click of a button.
Precise Criteria Details in the Data Window:
Beyond the visual table, the indicator provides an additional critical layer of detail: for any point on the chart, you can hover over a candle and see in TradingView's Data Window the precise status and values of all eight criteria. For each criterion, you'll see a clear numerical value (1 or 0) indicating whether it's fully met (1) or not met (0). Additionally, you can inspect the exact numerical values of the Ichimoku lines (Tenkan-sen, Kijun-sen, etc.) at that specific moment. This comprehensive data supports in-depth analysis, strategy debugging, and long-term optimization, providing complete transparency regarding every component of the signal.
Smart and Customizable Alerts:
Ichimoku Cloud Signals provides a powerful alert system to keep you informed of key market movements, so you never miss an opportunity. There are eight unique alerts you can enable in TradingView's alert panel:
Uptrend Entry Alert: Triggers when all of your selected criteria for an uptrend are met on a new candle.
Uptrend Exit Alert: Triggers when one of your selected uptrend criteria is no longer met, signaling a potential exit point.
Downtrend Entry Alert: Triggers when all of your selected criteria for a downtrend are met on a new candle.
Downtrend Exit Alert: Triggers when one of your selected downtrend criteria is no longer met, signaling a potential exit point.
Bullish Crossover Alert: Triggers when the Conversion Line (Tenkan-sen) crosses above the Base Line (Kijun-sen), a classic signal for an upward momentum shift.
Bearish Crossover Alert: Triggers when the Conversion Line (Tenkan-sen) crosses below the Base Line (Kijun-sen), signaling a potential shift to downward momentum.
Bullish Cloud Breakout Alert: Triggers when the price closes above the Ichimoku Cloud (Kumo), indicating a strong bullish trend.
Bearish Cloud Breakout Alert: Triggers when the price closes below the Ichimoku Cloud (Kumo), indicating a strong bearish trend.
Each alert can be independently configured in TradingView's alert panel, allowing you to tailor your notifications to fit your exact trading strategy and risk management preferences.
Summary:
Ichimoku Cloud Signals is an essential tool for TradingView traders seeking control, clarity, and precision. It combines the power of the classic Ichimoku Cloud indicator with advanced customization capabilities, a convenient visual table, and clear signals, empowering you to make informed trading decisions and stay focused on managing your positions.
Important Note: Trading Risk
This indicator is intended for educational and informational purposes only and does not constitute investment advice or a recommendation for trading in any form whatsoever.
Trading in financial markets involves significant risk of capital loss. It is important to remember that past performance is not indicative of future results. All trading decisions are your sole responsibility. Never trade with money you cannot afford to lose.

SuperTrade Ichimoku Cloud StrategyUnlike SuperTrade's Super Trend the Ichimoku Cloud Strategy is a trend-following system derived from the Ichimoku Kinko Hyo indicator. It helps identify market direction, momentum, and potential support/resistance zones. This strategy uses key components of the Ichimoku Cloud to determine bullish or bearish trends and executes trades accordingly.
🔍 Key Components Used
Conversion Line (Tenkan-sen) – short-term average (9-period Donchian midpoint by default)
Base Line (Kijun-sen) – medium-term average (26-period Donchian midpoint)
Leading Span A (Senkou Span A) – average of Conversion Line and Base Line, plotted forward by 26 periods.
Leading Span B (Senkou Span B) – 52-period Donchian midpoint, plotted forward by 26 periods.
Lagging Span (Chikou Span) – current close price, plotted backward by 26 periods (for visual reference only in this version).
The cloud (Kumo) is the area between Leading Span A and B, representing trend direction and potential support/resistance.
📈 Entry Rules (Buy Condition)
A long trade is entered when:
LeadLine1 > LeadLine2 → This implies a bullish cloud.
Close > LeadLine1 and Close > LeadLine2 → The price is trading above the cloud, confirming upward momentum.
This combination indicates a strong bullish trend, so the strategy enters a long position.
📉 Exit Rules (Sell Condition / Close Position)
The long trade is closed when:
LeadLine1 < LeadLine2 → This implies a bearish cloud.
Close < LeadLine1 and Close < LeadLine2 → The price has fallen below the cloud, signaling trend weakness or reversal.
This confirms a bearish trend, prompting the strategy to exit the long position.
✅ Must-Have Elements in This Strategy
Entry Logic – based on price position relative to the cloud and cloud direction.
Exit Logic – closes the position when price shifts to a bearish trend.
Overlay Enabled – plotted over price for visual confirmation of signals.
Dynamic Parameters – inputs for conversion/base/cloud lengths and displacement.
Visualization – plots all Ichimoku components including cloud fill for clarity.
No Shorting Logic Yet – this version only handles long trades; shorting can be added optionally.
No Stop-Loss or Take-Profit – trades are closed purely based on Ichimoku trend reversal.

Ichimoku Cloud with MACD and Trailing Stop Loss (by Coinrule)The Ichimoku Cloud is a collection of technical indicators that show support and resistance levels, as well as momentum and trend direction. It does this by taking multiple averages and plotting them on a chart. It also uses these figures to compute a “cloud” that attempts to forecast where the price may find support or resistance in the future.
The Ichimoku Cloud was developed by Goichi Hosoda, a Japanese journalist, and published in the late 1960s. It provides more data points than the standard candlestick chart. While it seems complicated at first glance, those familiar with how to read the charts often find it easy to understand with well-defined trading signals.
The Ichimoku Cloud is composed of five lines or calculations, two of which comprise a cloud where the difference between the two lines is shaded in.
The lines include a nine-period average, a 26-period average, an average of those two averages, a 52-period average, and a lagging closing price line.
The cloud is a key part of the indicator. When the price is below the cloud, the trend is down. When the price is above the cloud, the trend is up.
The above trend signals are strengthened if the cloud is moving in the same direction as the price. For example, during an uptrend, the top of the cloud is moving up, or during a downtrend, the bottom of the cloud is moving down.
The MACD is a trend following momentum indicator and provides identification of short-term trend direction. In this variation it utilises the 12-period as the fast and 26-period as the slow length EMAs, with signal smoothing set at 9.
This strategy combines the Ichimoku Cloud with the MACD indicator to better enter trades.
Long/Exit orders are placed when three basic signals are triggered.
Long Position:
Tenkan-Sen is above the Kijun-Sen
Chikou-Span is above the close of 26 bars ago
Close is above the Kumo Cloud
MACD line crosses over the signal line
Exit Position:
Price increases 3% trailing
Price decreases 3% trailing
The script is backtested from 1 June 2022 and provides good returns.
The strategy assumes each order is using 30% of the available coins to make the results more realistic and to simulate you only ran this strategy on 30% of your holdings. A trading fee of 0.1% is also taken into account and is aligned to the base fee applied on Binance.

CVD Ichimoku(s)ENGLISH
What is this indicator?
This is a combination of two indicators: the CVD - Cumulative Volume Delta Candles published by TradingView (version v3 2022.07.11) with two Ichimoku clouds: one for the current time frame and another for a bigger time frame.
The user of the indicator can define that bigger time frame with a multiplier. By default it multiplies x6 the current TF (for example, if you watch at the 1 hour time frame the second kumo belongs to 6 hour TF).
Additionaly, an orange line replicates the senko span A without displacement. It is extra layer of visual information that can be hidded from settings.
How it should be used?
Delta Volume indicators can be hard to read. This format gives the trader an overview of where the agressive buyers/sellers are in relation to past market orders. And relative to price if used in combination with the classic Ichimoku indicator on price. I recommend to use it as a support for your ideas applying Ichimoku's calculations deep knowledge.
CATALÀ*
Què és aquest indicador?
És una combinació de dos indicadors: el CVD - Cumulative Volume Delta Candles publicat per TradingView (versió v3 2022.07.11) amb dos Ichimoku clouds: on pel time frame actual i un altre per un time frame superior.
L'usuari de l'indicador pot definir aquest time frame superior mitjançant un multiplicador. Per defecte multiplica x6 el TF actual (per exemple, si uses l'indicador al time frame d'1 hora, el segon kumo correspondrà al TF de 6 hores).
Adicionalment hi ha una línia taronja que replica el senko span A sense desplaçament. És una capa extra d'informació visual que pot ser amagada des de la configuració.
Com s'ha de fer servir?
Els indicadors de Delta Volume poden ser difícils de llegir. Aquest format dona al tradejador una visió global d'on són els compradors/venedors agressius en relació al mercat d'ordres passat. I relatiu al preu en combinació amb el clàssic indicdor Ichimoku sobre preu. Recomano usar-lo com a suport per les teves idees aplicant un profund coneixement dels càlculs d'Ichimoku.
*Catalan is a language speaked since 8th century in most eastern territories of the current Spain (Catalunya, Illes Balears, País Valencià), south of France and some zones of Italy. Catalan is spoken by some 9,000,000 people in Spain and some 125,000 in France, as well as by some 30,000 in Andorra and some 40,000 in Alghero.

Volume Based Ichimoku CloudIntroduction
This release focuses primarily on a volume-based Donchian. For some time I was looking for a volume-based Donchian, not finding anything that satisfied me I tried to apply one, and then I applied it to Ichimoku.
I found advantages especially in the lateralization phase, where the integration with the volume filters some false signals.
I have added some features:
- Check the conditions of buy/sell of classic Ichimoku
- Verified reverse buy/sell condition
- Alerts
- Entrance package
- possibility to choose the type of Donchian to use (classic, volume-based)
Settings
There are the classic parameters of Ichimoku, for scalping, I use setting like(6-17-34-17 or 5-14-28-14), the new parameters are:
Donchian Type : Classic / Volume Based
Show Condition : it shows green/red square on the bottom when all the conditions of Ichimoku are satisfied, without the checkmark the inputs or the alarms will not work for this type of signal
Show Reversal : it shows yellow/purple triangle on the bottom when all during short/long state condition of Ichimoku Tenkan cross the Kijun, without the checkmark the inputs or the alarms will not work for this type of signal
Trades Framework
Show Trade Lines : show the lines for Entry Point, TP1, TP2, SL
Per n Bars : For how many bars the sending lines will be drawn
Enter Gap : It's the gap, in percentage, from the last candle low/high. For example, the entry point will be set 0.1% higher than the last high of the candle, in a long situation, or 0.1% lower than the last low of the candle in a short situation.
Take Profit 1 : It's the gap, in percentage, from the entry point. For example, the first take profit will be set 0.5% higher/lower than the entry point.
Take Profit 2 : It's the gap, in percentage, from the entry point. For example, the second take profit will be set 0.5% higher/lower than the entry point.
Stop Loss : It's the gap, in percentage, from the entry point. For example, the stop loss will be set 0.5% higher/lower than the entry point.
How to use
The use will be like that for the classic Ichimoku, the combination with a volatility indicator or the volume analysis will certainly help to reduce false signals and therefore to select only the most profitable signals.
Remember that every statistical indicator is just a tool, it needs to be understood to be used at its best, otherwise, it is just a colored line in a colored graph.
