GKD-C Vulkan Profit [Loxx]Giga Kaleidoscope GKD-C Vulkan Profit is a Confirmation module included in Loxx's "Giga Kaleidoscope Modularized Trading System".
█ GKD-C Vulkan Profit
What is the Vulkan Profit Indicator?
The Vulkan Profit indicator is a trading tool that helps traders identify potential buy and sell signals in financial markets. It uses a combination of short-term and long-term moving averages to gauge the strength of trends and generate trading signals based on the interaction between these averages. The following explores the workings of the Vulkan Profit indicator, focusing on the concepts and calculations it uses to generate trading signals.
At the core of the Vulkan Profit indicator are two sets of moving averages: the short-term and the long-term. The short-term moving averages are calculated using weighted moving averages (WMA) with periods of 3 and 8. These short-term moving averages, referred to as STL1 and STL2, are designed to track the price movements more closely and respond faster to recent price changes.
The long-term moving averages, on the other hand, are calculated using exponential moving averages (EMA) with periods of 18 and 28. These long-term moving averages, referred to as LTL1 and LTL2, provide a smoother representation of the price movements and are less sensitive to recent price fluctuations. They represent the long-term trend in the market.
The buy and sell signals generated by the Vulkan Profit indicator are based on the relationship between the short-term and long-term moving averages. The indicator monitors the crossover between these two sets of moving averages to identify potential trend reversals.
A buy signal is generated when the minimum value of the short-term moving averages (STL1 and STL2) becomes greater than the maximum value of the long-term moving averages (LTL1 and LTL2), and this condition was not met in the previous candle. This scenario indicates that the short-term trend has shifted upwards, crossing above the long-term trend, and could be a sign of a potential bullish reversal.
Conversely, a sell signal is generated when the maximum value of the short-term moving averages (STL1 and STL2) becomes less than the minimum value of the long-term moving averages (LTL1 and LTL2), and this condition was not met in the previous candle. This indicates that the short-term trend has shifted downwards, crossing below the long-term trend, and could be a sign of a potential bearish reversal.
In summary, the Vulkan Profit indicator is a trading tool that uses a combination of short-term and long-term moving averages to identify potential buy and sell signals in financial markets. By monitoring the crossovers between these two sets of moving averages, the indicator provides traders with an easy-to-understand visual representation of the current trend and potential trend reversals. This information can be valuable for traders looking to time their entries and exits in the market and make more informed trading decisions.
Additional Features
This indicator allows you to select from 33 source types. They are as follows:
Close
Open
High
Low
Median
Typical
Weighted
Average
Average Median Body
Trend Biased
Trend Biased (Extreme)
HA Close
HA Open
HA High
HA Low
HA Median
HA Typical
HA Weighted
HA Average
HA Average Median Body
HA Trend Biased
HA Trend Biased (Extreme)
HAB Close
HAB Open
HAB High
HAB Low
HAB Median
HAB Typical
HAB Weighted
HAB Average
HAB Average Median Body
HAB Trend Biased
HAB Trend Biased (Extreme)
What are Heiken Ashi "better" candles?
Heiken Ashi "better" candles are a modified version of the standard Heiken Ashi candles, which are a popular charting technique used in technical analysis. Heiken Ashi candles help traders identify trends and potential reversal points by smoothing out price data and reducing market noise. The "better formula" was proposed by Sebastian Schmidt in an article published by BNP Paribas in Warrants & Zertifikate, a German magazine, in August 2004. The aim of this formula is to further improve the smoothing of the Heiken Ashi chart and enhance its effectiveness in identifying trends and reversals.
Standard Heiken Ashi candles are calculated using the following formulas:
Heiken Ashi Close = (Open + High + Low + Close) / 4
Heiken Ashi Open = (Previous Heiken Ashi Open + Previous Heiken Ashi Close) / 2
Heiken Ashi High = Max (High, Heiken Ashi Open, Heiken Ashi Close)
Heiken Ashi Low = Min (Low, Heiken Ashi Open, Heiken Ashi Close)
The "better formula" modifies the standard Heiken Ashi calculation by incorporating additional smoothing, which can help reduce noise and make it easier to identify trends and reversals. The modified formulas for Heiken Ashi "better" candles are as follows:
Better Heiken Ashi Close = (Open + High + Low + Close) / 4
Better Heiken Ashi Open = (Previous Better Heiken Ashi Open + Previous Better Heiken Ashi Close) / 2
Better Heiken Ashi High = Max (High, Better Heiken Ashi Open, Better Heiken Ashi Close)
Better Heiken Ashi Low = Min (Low, Better Heiken Ashi Open, Better Heiken Ashi Close)
Smoothing Factor = 2 / (N + 1), where N is the chosen period for smoothing
Smoothed Better Heiken Ashi Open = (Better Heiken Ashi Open * Smoothing Factor) + (Previous Smoothed Better Heiken Ashi Open * (1 - Smoothing Factor))
Smoothed Better Heiken Ashi Close = (Better Heiken Ashi Close * Smoothing Factor) + (Previous Smoothed Better Heiken Ashi Close * (1 - Smoothing Factor))
The smoothed Better Heiken Ashi Open and Close values are then used to calculate the smoothed Better Heiken Ashi High and Low values, resulting in "better" candles that provide a clearer representation of the market trend and potential reversal points.
It's important to note that, like any other technical analysis tool, Heiken Ashi "better" candles are not foolproof and should be used in conjunction with other indicators and analysis techniques to make well-informed trading decisions.
Heiken Ashi "better" candles, as mentioned previously, provide a clearer representation of market trends and potential reversal points by reducing noise and smoothing out price data. When using these candles in conjunction with other technical analysis tools and indicators, traders can gain valuable insights into market behavior and make more informed decisions.
To effectively use Heiken Ashi "better" candles in your trading strategy, consider the following tips:
Trend Identification: Heiken Ashi "better" candles can help you identify the prevailing trend in the market. When the majority of the candles are green (or another color, depending on your chart settings) and there are no or few lower wicks, it may indicate a strong uptrend. Conversely, when the majority of the candles are red (or another color) and there are no or few upper wicks, it may signal a strong downtrend.
Trend Reversals: Look for potential trend reversals when a change in the color of the candles occurs, especially when accompanied by longer wicks. For example, if a green candle with a long lower wick is followed by a red candle, it could indicate a bearish reversal. Similarly, a red candle with a long upper wick followed by a green candle may suggest a bullish reversal.
Support and Resistance: You can use Heiken Ashi "better" candles to identify potential support and resistance levels. When the candles are consistently moving in one direction and then suddenly change color with longer wicks, it could indicate the presence of a support or resistance level.
Stop-Loss and Take-Profit: Using Heiken Ashi "better" candles can help you manage risk by determining optimal stop-loss and take-profit levels. For instance, you can place your stop-loss below the low of the most recent green candle in an uptrend or above the high of the most recent red candle in a downtrend.
Confirming Signals: Heiken Ashi "better" candles should be used in conjunction with other technical indicators, such as moving averages, oscillators, or chart patterns, to confirm signals and improve the accuracy of your analysis.
In this implementation, you have the choice of AMA, KAMA, or T3 smoothing. These are as follows:
Kaufman Adaptive Moving Average (KAMA)
The Kaufman Adaptive Moving Average (KAMA) is a type of adaptive moving average used in technical analysis to smooth out price fluctuations and identify trends. The KAMA adjusts its smoothing factor based on the market's volatility, making it more responsive in volatile markets and smoother in calm markets. The KAMA is calculated using three different efficiency ratios that determine the appropriate smoothing factor for the current market conditions. These ratios are based on the noise level of the market, the speed at which the market is moving, and the length of the moving average. The KAMA is a popular choice among traders who prefer to use adaptive indicators to identify trends and potential reversals.
Adaptive Moving Average
The Adaptive Moving Average (AMA) is a type of moving average that adjusts its sensitivity to price movements based on market conditions. It uses a ratio between the current price and the highest and lowest prices over a certain lookback period to determine its level of smoothing. The AMA can help reduce lag and increase responsiveness to changes in trend direction, making it useful for traders who want to follow trends while avoiding false signals. The AMA is calculated by multiplying a smoothing constant with the difference between the current price and the previous AMA value, then adding the result to the previous AMA value.
T3
The T3 moving average is a type of technical indicator used in financial analysis to identify trends in price movements. It is similar to the Exponential Moving Average (EMA) and the Double Exponential Moving Average (DEMA), but uses a different smoothing algorithm.
The T3 moving average is calculated using a series of exponential moving averages that are designed to filter out noise and smooth the data. The resulting smoothed data is then weighted with a non-linear function to produce a final output that is more responsive to changes in trend direction.
The T3 moving average can be customized by adjusting the length of the moving average, as well as the weighting function used to smooth the data. It is commonly used in conjunction with other technical indicators as part of a larger trading strategy.
█ Giga Kaleidoscope Modularized Trading System
Core components of an NNFX algorithmic trading strategy
The NNFX algorithm is built on the principles of trend, momentum, and volatility. There are six core components in the NNFX trading algorithm:
1. Volatility - price volatility; e.g., Average True Range, True Range Double, Close-to-Close, etc.
2. Baseline - a moving average to identify price trend
3. Confirmation 1 - a technical indicator used to identify trends
4. Confirmation 2 - a technical indicator used to identify trends
5. Continuation - a technical indicator used to identify trends
6. Volatility/Volume - a technical indicator used to identify volatility/volume breakouts/breakdown
7. Exit - a technical indicator used to determine when a trend is exhausted
What is Volatility in the NNFX trading system?
In the NNFX (No Nonsense Forex) trading system, ATR (Average True Range) is typically used to measure the volatility of an asset. It is used as a part of the system to help determine the appropriate stop loss and take profit levels for a trade. ATR is calculated by taking the average of the true range values over a specified period.
True range is calculated as the maximum of the following values:
-Current high minus the current low
-Absolute value of the current high minus the previous close
-Absolute value of the current low minus the previous close
ATR is a dynamic indicator that changes with changes in volatility. As volatility increases, the value of ATR increases, and as volatility decreases, the value of ATR decreases. By using ATR in NNFX system, traders can adjust their stop loss and take profit levels according to the volatility of the asset being traded. This helps to ensure that the trade is given enough room to move, while also minimizing potential losses.
Other types of volatility include True Range Double (TRD), Close-to-Close, and Garman-Klass
What is a Baseline indicator?
The baseline is essentially a moving average, and is used to determine the overall direction of the market.
The baseline in the NNFX system is used to filter out trades that are not in line with the long-term trend of the market. The baseline is plotted on the chart along with other indicators, such as the Moving Average (MA), the Relative Strength Index (RSI), and the Average True Range (ATR).
Trades are only taken when the price is in the same direction as the baseline. For example, if the baseline is sloping upwards, only long trades are taken, and if the baseline is sloping downwards, only short trades are taken. This approach helps to ensure that trades are in line with the overall trend of the market, and reduces the risk of entering trades that are likely to fail.
By using a baseline in the NNFX system, traders can have a clear reference point for determining the overall trend of the market, and can make more informed trading decisions. The baseline helps to filter out noise and false signals, and ensures that trades are taken in the direction of the long-term trend.
What is a Confirmation indicator?
Confirmation indicators are technical indicators that are used to confirm the signals generated by primary indicators. Primary indicators are the core indicators used in the NNFX system, such as the Average True Range (ATR), the Moving Average (MA), and the Relative Strength Index (RSI).
The purpose of the confirmation indicators is to reduce false signals and improve the accuracy of the trading system. They are designed to confirm the signals generated by the primary indicators by providing additional information about the strength and direction of the trend.
Some examples of confirmation indicators that may be used in the NNFX system include the Bollinger Bands, the MACD (Moving Average Convergence Divergence), and the MACD Oscillator. These indicators can provide information about the volatility, momentum, and trend strength of the market, and can be used to confirm the signals generated by the primary indicators.
In the NNFX system, confirmation indicators are used in combination with primary indicators and other filters to create a trading system that is robust and reliable. By using multiple indicators to confirm trading signals, the system aims to reduce the risk of false signals and improve the overall profitability of the trades.
What is a Continuation indicator?
In the NNFX (No Nonsense Forex) trading system, a continuation indicator is a technical indicator that is used to confirm a current trend and predict that the trend is likely to continue in the same direction. A continuation indicator is typically used in conjunction with other indicators in the system, such as a baseline indicator, to provide a comprehensive trading strategy.
What is a Volatility/Volume indicator?
Volume indicators, such as the On Balance Volume (OBV), the Chaikin Money Flow (CMF), or the Volume Price Trend (VPT), are used to measure the amount of buying and selling activity in a market. They are based on the trading volume of the market, and can provide information about the strength of the trend. In the NNFX system, volume indicators are used to confirm trading signals generated by the Moving Average and the Relative Strength Index. Volatility indicators include Average Direction Index, Waddah Attar, and Volatility Ratio. In the NNFX trading system, volatility is a proxy for volume and vice versa.
By using volume indicators as confirmation tools, the NNFX trading system aims to reduce the risk of false signals and improve the overall profitability of trades. These indicators can provide additional information about the market that is not captured by the primary indicators, and can help traders to make more informed trading decisions. In addition, volume indicators can be used to identify potential changes in market trends and to confirm the strength of price movements.
What is an Exit indicator?
The exit indicator is used in conjunction with other indicators in the system, such as the Moving Average (MA), the Relative Strength Index (RSI), and the Average True Range (ATR), to provide a comprehensive trading strategy.
The exit indicator in the NNFX system can be any technical indicator that is deemed effective at identifying optimal exit points. Examples of exit indicators that are commonly used include the Parabolic SAR, the Average Directional Index (ADX), and the Chandelier Exit.
The purpose of the exit indicator is to identify when a trend is likely to reverse or when the market conditions have changed, signaling the need to exit a trade. By using an exit indicator, traders can manage their risk and prevent significant losses.
In the NNFX system, the exit indicator is used in conjunction with a stop loss and a take profit order to maximize profits and minimize losses. The stop loss order is used to limit the amount of loss that can be incurred if the trade goes against the trader, while the take profit order is used to lock in profits when the trade is moving in the trader's favor.
Overall, the use of an exit indicator in the NNFX trading system is an important component of a comprehensive trading strategy. It allows traders to manage their risk effectively and improve the profitability of their trades by exiting at the right time.
How does Loxx's GKD (Giga Kaleidoscope Modularized Trading System) implement the NNFX algorithm outlined above?
Loxx's GKD v1.0 system has five types of modules (indicators/strategies). These modules are:
1. GKD-BT - Backtesting module (Volatility, Number 1 in the NNFX algorithm)
2. GKD-B - Baseline module (Baseline and Volatility/Volume, Numbers 1 and 2 in the NNFX algorithm)
3. GKD-C - Confirmation 1/2 and Continuation module (Confirmation 1/2 and Continuation, Numbers 3, 4, and 5 in the NNFX algorithm)
4. GKD-V - Volatility/Volume module (Confirmation 1/2, Number 6 in the NNFX algorithm)
5. GKD-E - Exit module (Exit, Number 7 in the NNFX algorithm)
(additional module types will added in future releases)
Each module interacts with every module by passing data between modules. Data is passed between each module as described below:
GKD-B => GKD-V => GKD-C(1) => GKD-C(2) => GKD-C(Continuation) => GKD-E => GKD-BT
That is, the Baseline indicator passes its data to Volatility/Volume. The Volatility/Volume indicator passes its values to the Confirmation 1 indicator. The Confirmation 1 indicator passes its values to the Confirmation 2 indicator. The Confirmation 2 indicator passes its values to the Continuation indicator. The Continuation indicator passes its values to the Exit indicator, and finally, the Exit indicator passes its values to the Backtest strategy.
This chaining of indicators requires that each module conform to Loxx's GKD protocol, therefore allowing for the testing of every possible combination of technical indicators that make up the six components of the NNFX algorithm.
What does the application of the GKD trading system look like?
Example trading system:
Backtest: Strategy with 1-3 take profits, trailing stop loss, multiple types of PnL volatility, and 2 backtesting styles
Baseline: Hull Moving Average
Volatility/Volume: Hurst Exponent
Confirmation 1: Vulkan Profit as shown on the chart above
Confirmation 2: Williams Percent Range
Continuation: Vulkan Profit
Exit: Rex Oscillator
Each GKD indicator is denoted with a module identifier of either: GKD-BT, GKD-B, GKD-C, GKD-V, or GKD-E. This allows traders to understand to which module each indicator belongs and where each indicator fits into the GKD protocol chain.
Giga Kaleidoscope Modularized Trading System Signals (based on the NNFX algorithm)
Standard Entry
1. GKD-C Confirmation 1 Signal
2. GKD-B Baseline agrees
3. Price is within a range of 0.2x Volatility and 1.0x Volatility of the Goldie Locks Mean
4. GKD-C Confirmation 2 agrees
5. GKD-V Volatility/Volume agrees
Baseline Entry
1. GKD-B Baseline signal
2. GKD-C Confirmation 1 agrees
3. Price is within a range of 0.2x Volatility and 1.0x Volatility of the Goldie Locks Mean
4. GKD-C Confirmation 2 agrees
5. GKD-V Volatility/Volume agrees
6. GKD-C Confirmation 1 signal was less than 7 candles prior
Volatility/Volume Entry
1. GKD-V Volatility/Volume signal
2. GKD-C Confirmation 1 agrees
3. Price is within a range of 0.2x Volatility and 1.0x Volatility of the Goldie Locks Mean
4. GKD-C Confirmation 2 agrees
5. GKD-B Baseline agrees
6. GKD-C Confirmation 1 signal was less than 7 candles prior
Continuation Entry
1. Standard Entry, Baseline Entry, or Pullback; entry triggered previously
2. GKD-B Baseline hasn't crossed since entry signal trigger
3. GKD-C Confirmation Continuation Indicator signals
4. GKD-C Confirmation 1 agrees
5. GKD-B Baseline agrees
6. GKD-C Confirmation 2 agrees
1-Candle Rule Standard Entry
1. GKD-C Confirmation 1 signal
2. GKD-B Baseline agrees
3. Price is within a range of 0.2x Volatility and 1.0x Volatility of the Goldie Locks Mean
Next Candle:
1. Price retraced (Long: close < close or Short: close > close )
2. GKD-B Baseline agrees
3. GKD-C Confirmation 1 agrees
4. GKD-C Confirmation 2 agrees
5. GKD-V Volatility/Volume agrees
1-Candle Rule Baseline Entry
1. GKD-B Baseline signal
2. GKD-C Confirmation 1 agrees
3. Price is within a range of 0.2x Volatility and 1.0x Volatility of the Goldie Locks Mean
4. GKD-C Confirmation 1 signal was less than 7 candles prior
Next Candle:
1. Price retraced (Long: close < close or Short: close > close )
2. GKD-B Baseline agrees
3. GKD-C Confirmation 1 agrees
4. GKD-C Confirmation 2 agrees
5. GKD-V Volatility/Volume Agrees
1-Candle Rule Volatility/Volume Entry
1. GKD-V Volatility/Volume signal
2. GKD-C Confirmation 1 agrees
3. Price is within a range of 0.2x Volatility and 1.0x Volatility of the Goldie Locks Mean
4. GKD-C Confirmation 1 signal was less than 7 candles prior
Next Candle:
1. Price retraced (Long: close < close or Short: close > close)
2. GKD-B Volatility/Volume agrees
3. GKD-C Confirmation 1 agrees
4. GKD-C Confirmation 2 agrees
5. GKD-B Baseline agrees
PullBack Entry
1. GKD-B Baseline signal
2. GKD-C Confirmation 1 agrees
3. Price is beyond 1.0x Volatility of Baseline
Next Candle:
1. Price is within a range of 0.2x Volatility and 1.0x Volatility of the Goldie Locks Mean
2. GKD-C Confirmation 1 agrees
3. GKD-C Confirmation 2 agrees
4. GKD-V Volatility/Volume Agrees
]█ Setting up the GKD
The GKD system involves chaining indicators together. These are the steps to set this up.
Use a GKD-C indicator alone on a chart
1. Inside the GKD-C indicator, change the "Confirmation Type" setting to "Solo Confirmation Simple"
Use a GKD-V indicator alone on a chart
**nothing, it's already useable on the chart without any settings changes
Use a GKD-B indicator alone on a chart
**nothing, it's already useable on the chart without any settings changes
Baseline (Baseline, Backtest)
1. Import the GKD-B Baseline into the GKD-BT Backtest: "Input into Volatility/Volume or Backtest (Baseline testing)"
2. Inside the GKD-BT Backtest, change the setting "Backtest Special" to "Baseline"
Volatility/Volume (Volatility/Volume, Backte st)
1. Inside the GKD-V indicator, change the "Testing Type" setting to "Solo"
2. Inside the GKD-V indicator, change the "Signal Type" setting to "Crossing" (neither traditional nor both can be backtested)
3. Import the GKD-V indicator into the GKD-BT Backtest: "Input into C1 or Backtest"
4. Inside the GKD-BT Backtest, change the setting "Backtest Special" to "Volatility/Volume"
5. Inside the GKD-BT Backtest, a) change the setting "Backtest Type" to "Trading" if using a directional GKD-V indicator; or, b) change the setting "Backtest Type" to "Full" if using a directional or non-directional GKD-V indicator (non-directional GKD-V can only test Longs and Shorts separately)
6. If "Backtest Type" is set to "Full": Inside the GKD-BT Backtest, change the setting "Backtest Side" to "Long" or "Short
7. If "Backtest Type" is set to "Full": To allow the system to open multiple orders at one time so you test all Longs or Shorts, open the GKD-BT Backtest, click the tab "Properties" and then insert a value of something like 10 orders into the "Pyramiding" settings. This will allow 10 orders to be opened at one time which should be enough to catch all possible Longs or Shorts.
Solo Confirmation Simple (Confirmation, Backtest)
1. Inside the GKD-C indicator, change the "Confirmation Type" setting to "Solo Confirmation Simple"
1. Import the GKD-C indicator into the GKD-BT Backtest: "Input into Backtest"
2. Inside the GKD-BT Backtest, change the setting "Backtest Special" to "Solo Confirmation Simple"
Solo Confirmation Complex without Exits (Baseline, Volatility/Volume, Confirmation, Backtest)
1. Inside the GKD-V indicator, change the "Testing Type" setting to "Chained"
2. Import the GKD-B Baseline into the GKD-V indicator: "Input into Volatility/Volume or Backtest (Baseline testing)"
3. Inside the GKD-C indicator, change the "Confirmation Type" setting to "Solo Confirmation Complex"
4. Import the GKD-V indicator into the GKD-C indicator: "Input into C1 or Backtest"
5. Inside the GKD-BT Backtest, change the setting "Backtest Special" to "GKD Full wo/ Exits"
6. Import the GKD-C into the GKD-BT Backtest: "Input into Exit or Backtest"
Solo Confirmation Complex with Exits (Baseline, Volatility/Volume, Confirmation, Exit, Backtest)
1. Inside the GKD-V indicator, change the "Testing Type" setting to "Chained"
2. Import the GKD-B Baseline into the GKD-V indicator: "Input into Volatility/Volume or Backtest (Baseline testing)"
3. Inside the GKD-C indicator, change the "Confirmation Type" setting to "Solo Confirmation Complex"
4. Import the GKD-V indicator into the GKD-C indicator: "Input into C1 or Backtest"
5. Import the GKD-C indicator into the GKD-E indicator: "Input into Exit"
6. Inside the GKD-BT Backtest, change the setting "Backtest Special" to "GKD Full w/ Exits"
7. Import the GKD-E into the GKD-BT Backtest: "Input into Backtest"
Full GKD without Exits (Baseline, Volatility/Volume, Confirmation 1, Confirmation 2, Continuation, Backtest)
1. Inside the GKD-V indicator, change the "Testing Type" setting to "Chained"
2. Import the GKD-B Baseline into the GKD-V indicator: "Input into Volatility/Volume or Backtest (Baseline testing)"
3. Inside the GKD-C 1 indicator, change the "Confirmation Type" setting to "Confirmation 1"
4. Import the GKD-V indicator into the GKD-C 1 indicator: "Input into C1 or Backtest"
5. Inside the GKD-C 2 indicator, change the "Confirmation Type" setting to "Confirmation 2"
6. Import the GKD-C 1 indicator into the GKD-C 2 indicator: "Input into C2"
7. Inside the GKD-C Continuation indicator, change the "Confirmation Type" setting to "Continuation"
8. Inside the GKD-BT Backtest, change the setting "Backtest Special" to "GKD Full wo/ Exits"
9. Import the GKD-E into the GKD-BT Backtest: "Input into Exit or Backtest"
Full GKD with Exits (Baseline, Volatility/Volume, Confirmation 1, Confirmation 2, Continuation, Exit, Backtest)
1. Inside the GKD-V indicator, change the "Testing Type" setting to "Chained"
2. Import the GKD-B Baseline into the GKD-V indicator: "Input into Volatility/Volume or Backtest (Baseline testing)"
3. Inside the GKD-C 1 indicator, change the "Confirmation Type" setting to "Confirmation 1"
4. Import the GKD-V indicator into the GKD-C 1 indicator: "Input into C1 or Backtest"
5. Inside the GKD-C 2 indicator, change the "Confirmation Type" setting to "Confirmation 2"
6. Import the GKD-C 1 indicator into the GKD-C 2 indicator: "Input into C2"
7. Inside the GKD-C Continuation indicator, change the "Confirmation Type" setting to "Continuation"
8. Import the GKD-C Continuation indicator into the GKD-E indicator: "Input into Exit"
9. Inside the GKD-BT Backtest, change the setting "Backtest Special" to "GKD Full w/ Exits"
10. Import the GKD-E into the GKD-BT Backtest: "Input into Backtest"
Baseline + Volatility/Volume (Baseline, Volatility/Volume, Backtest)
1. Inside the GKD-V indicator, change the "Testing Type" setting to "Baseline + Volatility/Volume"
2. Inside the GKD-V indicator, make sure the "Signal Type" setting is set to "Traditional"
3. Import the GKD-B Baseline into the GKD-V indicator: "Input into Volatility/Volume or Backtest (Baseline testing)"
4. Inside the GKD-BT Backtest, change the setting "Backtest Special" to "Baseline + Volatility/Volume"
5. Import the GKD-V into the GKD-BT Backtest: "Input into C1 or Backtest"
6. Inside the GKD-BT Backtest, change the setting "Backtest Type" to "Full". For this backtest, you must test Longs and Shorts separately
7. To allow the system to open multiple orders at one time so you can test all Longs or Shorts, open the GKD-BT Backtest, click the tab "Properties" and then insert a value of something like 10 orders into the "Pyramiding" settings. This will allow 10 orders to be opened at one time which should be enough to catch all possible Longs or Shorts.
Requirements
Inputs
Confirmation 1: GKD-V Volatility / Volume indicator
Confirmation 2: GKD-C Confirmation indicator
Continuation: GKD-C Confirmation indicator
Solo Confirmation Simple: GKD-B Baseline
Solo Confirmation Complex: GKD-V Volatility / Volume indicator
Solo Confirmation Super Complex: GKD-V Volatility / Volume indicator
Stacked 1: None
Stacked 2+: GKD-C, GKD-V, or GKD-B Stacked 1
Outputs
Confirmation 1: GKD-C Confirmation 2 indicator
Confirmation 2: GKD-C Continuation indicator
Continuation: GKD-E Exit indicator
Solo Confirmation Simple: GKD-BT Backtest
Solo Confirmation Complex: GKD-BT Backtest or GKD-E Exit indicator
Solo Confirmation Super Complex: GKD-C Continuation indicator
Stacked 1: GKD-C, GKD-V, or GKD-B Stacked 2+
Stacked 2+: GKD-C, GKD-V, or GKD-B Stacked 2+ or GKD-BT Backtest
Additional features will be added in future releases.
스크립트에서 "high low"에 대해 찾기

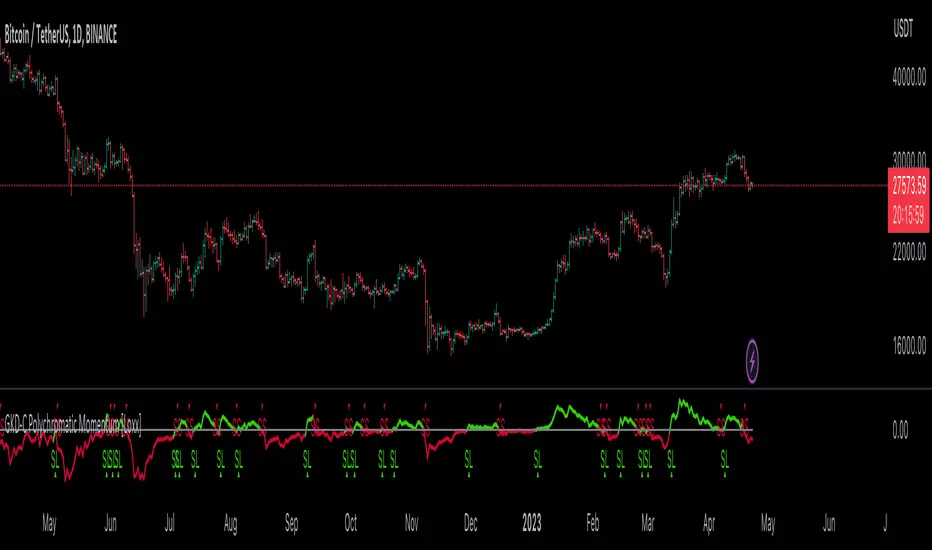
GKD-C Polychromatic Momentum [Loxx]Giga Kaleidoscope GKD-C Polychromatic Momentum is a Confirmation module included in Loxx's "Giga Kaleidoscope Modularized Trading System".
█ GKD-C Polychromatic Momentum
Polychromatic Momentum: A Refined Approach to Momentum Calculation in Technical Analysis
In the world of finance and trading, technical analysis plays a crucial role in understanding price movements and making informed decisions. One popular method in technical analysis is calculating momentum, which indicates the strength of a trend by analyzing the rate of change in prices. The following explains a specific implementation of momentum calculation known as Polychromatic Momentum, highlighting its features and potential advantages over traditional momentum calculations.
Polychromatic Momentum Calculation
Polychromatic Momentum enhances the traditional momentum calculation by employing a weighted approach to momentum values. This method begins by initializing two variables to store the cumulative momentum values and their respective weights throughout the calculation process.
The calculation iterates through the range of the price data. For each iteration, a weight is calculated as the square root of the index plus one. The weight serves as a scaling factor, emphasizing more recent price changes over older ones. This allows the Polychromatic Momentum to account for the significance of recent trends in the market.
Next, the momentum value for the current index is calculated by finding the difference between the current source price and the source price at the previous index. This difference is then divided by the calculated weight. The momentum value is added to the cumulative sum, and the weight is added to the sum of weights.
Once the iteration is complete, the Polychromatic Momentum is obtained by dividing the cumulative sum of momentum values by the sum of weights. This calculation method provides a more nuanced understanding of the momentum by taking into account the varying importance of price changes over time.
Polychromatic Momentum offers a different approach to momentum calculation compared to regular momentum. While both methods aim to measure the strength of a trend by analyzing the rate of change in prices, their calculations differ in certain aspects, which may result in advantages for Polychromatic Momentum.
Regular momentum is calculated by subtracting the price value at a specific period in the past from the current price value. This method provides a simple and straightforward way to determine the price change over a fixed period.
Polychromatic Momentum, on the other hand, employs a weighted approach to momentum values. It calculates the momentum by considering a range of price changes over time and assigning weights to each change based on their recency. This approach aims to capture the varying importance of price changes over time, which can be beneficial in certain market conditions.
Some potential advantages of Polychromatic Momentum over regular momentum include:
1. Responsiveness: Polychromatic Momentum places greater emphasis on recent price changes, making it more responsive to new trends in the market. This responsiveness could provide timely signals for traders to capitalize on emerging trends.
2. Enhanced Trend Analysis: By considering a range of price changes over time and assigning weights to each change, Polychromatic Momentum can provide a more comprehensive analysis of the market trends. This can help traders better understand the overall momentum and make more informed decisions.
3. Flexibility: Polychromatic Momentum's weighted approach allows for greater flexibility in adapting to different market conditions and timeframes. Traders can experiment with different weighting schemes to optimize the momentum calculation for their specific trading strategies and goals.
In conclusion, Polychromatic Momentum offers a more refined approach to momentum calculation in technical analysis compared to traditional methods. By using a weighted approach, it effectively takes into account the varying importance of price changes over time, providing traders with a more insightful and responsive measure of market trends.
What is Double Smoothed Exponential Moving Average?
In financial markets and trading, technical analysis serves as a critical tool for evaluating price trends and making strategic decisions. A key component of technical analysis is the moving average, which averages price data over a specified period to smooth out fluctuations and identify market trends. While the Exponential Moving Average (EMA) is a popular moving average variant that emphasizes recent data points, the Double Smoothed Exponential Moving Average (DSEMA) takes it a step further by incorporating two layers of EMA calculations for more advanced smoothing. The following delve into the DSEMA methodology, explaining its working mechanism and the logic behind the technique without referring to specific code variables.
Double Smoothed Exponential Moving Average Explanation
DSEMA is a function that processes source price data and the length of the smoothing period as its inputs. Its primary objective is to minimize noise in the price data and generate a smoother output, which can be advantageous for detecting trends and making informed trading decisions.
The DSEMA calculation begins by determining the alpha value, which is the smoothing factor for the EMA. The alpha value is derived from the square root of the length of the smoothing period, ensuring that it falls between 0 and 1. A higher alpha value leads to a more responsive EMA, while a lower alpha value results in a slower-moving EMA that is less affected by recent price fluctuations.
The core of the DSEMA calculation involves applying two layers of EMA. The first layer calculates the initial EMA using the source price data and the alpha value. This first EMA places more weight on recent price data points, similar to a regular EMA.
The second layer calculates another EMA using the initial EMA values and the same alpha value. This second layer of EMA provides additional smoothing to the price data, resulting in a smoother output curve that is less prone to noise and sudden market changes. The final output of the DSEMA is the result of the second EMA layer.
In summary, the Double Smoothed Exponential Moving Average (DSEMA) offers an advanced approach to price data smoothing in technical analysis by applying two successive layers of EMA calculations. This technique enhances the detection of market trends and helps reduce the impact of noise in price data, providing traders with a more reliable representation of price movements to support their decision-making process.
Combining DSEMA and Polychromatic Momentum
DSEMA is an advanced smoothing technique that applies two layers of Exponential Moving Average (EMA) calculations to reduce noise in price data and produce a smoother representation of the market trends. On the other hand, Polychromatic Momentum is a momentum calculation method that employs a weighted approach to assess the strength of trends by analyzing the rate of change in prices over time.
By combining the two techniques, DSEMA can be used to smooth the source price data before inputting it into the Polychromatic Momentum calculation. This combination allows for a more accurate representation of price movements, as the smoothed price data provided by DSEMA minimizes the impact of sudden market fluctuations and noise on the momentum calculation.
The result is an enhanced technical analysis tool that leverages the benefits of advanced price smoothing from DSEMA and the refined trend assessment of Polychromatic Momentum. This integrated approach can help traders gain a deeper understanding of market dynamics and make more informed decisions based on reliable, noise-reduced price data and nuanced momentum calculations.
For our purposes here, only the source price can be smoothed and it's turned off by default. The smoothing period is zero by default. Any period above 0 and the smoothing will kick in. Try a period of 5.
Additional Features
This indicator allows you to select from 33 source types. They are as follows:
Close
Open
High
Low
Median
Typical
Weighted
Average
Average Median Body
Trend Biased
Trend Biased (Extreme)
HA Close
HA Open
HA High
HA Low
HA Median
HA Typical
HA Weighted
HA Average
HA Average Median Body
HA Trend Biased
HA Trend Biased (Extreme)
HAB Close
HAB Open
HAB High
HAB Low
HAB Median
HAB Typical
HAB Weighted
HAB Average
HAB Average Median Body
HAB Trend Biased
HAB Trend Biased (Extreme)
What are Heiken Ashi "better" candles?
Heiken Ashi "better" candles are a modified version of the standard Heiken Ashi candles, which are a popular charting technique used in technical analysis. Heiken Ashi candles help traders identify trends and potential reversal points by smoothing out price data and reducing market noise. The "better formula" was proposed by Sebastian Schmidt in an article published by BNP Paribas in Warrants & Zertifikate, a German magazine, in August 2004. The aim of this formula is to further improve the smoothing of the Heiken Ashi chart and enhance its effectiveness in identifying trends and reversals.
Standard Heiken Ashi candles are calculated using the following formulas:
Heiken Ashi Close = (Open + High + Low + Close) / 4
Heiken Ashi Open = (Previous Heiken Ashi Open + Previous Heiken Ashi Close) / 2
Heiken Ashi High = Max (High, Heiken Ashi Open, Heiken Ashi Close)
Heiken Ashi Low = Min (Low, Heiken Ashi Open, Heiken Ashi Close)
The "better formula" modifies the standard Heiken Ashi calculation by incorporating additional smoothing, which can help reduce noise and make it easier to identify trends and reversals. The modified formulas for Heiken Ashi "better" candles are as follows:
Better Heiken Ashi Close = (Open + High + Low + Close) / 4
Better Heiken Ashi Open = (Previous Better Heiken Ashi Open + Previous Better Heiken Ashi Close) / 2
Better Heiken Ashi High = Max (High, Better Heiken Ashi Open, Better Heiken Ashi Close)
Better Heiken Ashi Low = Min (Low, Better Heiken Ashi Open, Better Heiken Ashi Close)
Smoothing Factor = 2 / (N + 1), where N is the chosen period for smoothing
Smoothed Better Heiken Ashi Open = (Better Heiken Ashi Open * Smoothing Factor) + (Previous Smoothed Better Heiken Ashi Open * (1 - Smoothing Factor))
Smoothed Better Heiken Ashi Close = (Better Heiken Ashi Close * Smoothing Factor) + (Previous Smoothed Better Heiken Ashi Close * (1 - Smoothing Factor))
The smoothed Better Heiken Ashi Open and Close values are then used to calculate the smoothed Better Heiken Ashi High and Low values, resulting in "better" candles that provide a clearer representation of the market trend and potential reversal points.
It's important to note that, like any other technical analysis tool, Heiken Ashi "better" candles are not foolproof and should be used in conjunction with other indicators and analysis techniques to make well-informed trading decisions.
Heiken Ashi "better" candles, as mentioned previously, provide a clearer representation of market trends and potential reversal points by reducing noise and smoothing out price data. When using these candles in conjunction with other technical analysis tools and indicators, traders can gain valuable insights into market behavior and make more informed decisions.
To effectively use Heiken Ashi "better" candles in your trading strategy, consider the following tips:
Trend Identification: Heiken Ashi "better" candles can help you identify the prevailing trend in the market. When the majority of the candles are green (or another color, depending on your chart settings) and there are no or few lower wicks, it may indicate a strong uptrend. Conversely, when the majority of the candles are red (or another color) and there are no or few upper wicks, it may signal a strong downtrend.
Trend Reversals: Look for potential trend reversals when a change in the color of the candles occurs, especially when accompanied by longer wicks. For example, if a green candle with a long lower wick is followed by a red candle, it could indicate a bearish reversal. Similarly, a red candle with a long upper wick followed by a green candle may suggest a bullish reversal.
Support and Resistance: You can use Heiken Ashi "better" candles to identify potential support and resistance levels. When the candles are consistently moving in one direction and then suddenly change color with longer wicks, it could indicate the presence of a support or resistance level.
Stop-Loss and Take-Profit: Using Heiken Ashi "better" candles can help you manage risk by determining optimal stop-loss and take-profit levels. For instance, you can place your stop-loss below the low of the most recent green candle in an uptrend or above the high of the most recent red candle in a downtrend.
Confirming Signals: Heiken Ashi "better" candles should be used in conjunction with other technical indicators, such as moving averages, oscillators, or chart patterns, to confirm signals and improve the accuracy of your analysis.
In this implementation, you have the choice of AMA, KAMA, or T3 smoothing. These are as follows:
Kaufman Adaptive Moving Average (KAMA)
The Kaufman Adaptive Moving Average (KAMA) is a type of adaptive moving average used in technical analysis to smooth out price fluctuations and identify trends. The KAMA adjusts its smoothing factor based on the market's volatility, making it more responsive in volatile markets and smoother in calm markets. The KAMA is calculated using three different efficiency ratios that determine the appropriate smoothing factor for the current market conditions. These ratios are based on the noise level of the market, the speed at which the market is moving, and the length of the moving average. The KAMA is a popular choice among traders who prefer to use adaptive indicators to identify trends and potential reversals.
Adaptive Moving Average
The Adaptive Moving Average (AMA) is a type of moving average that adjusts its sensitivity to price movements based on market conditions. It uses a ratio between the current price and the highest and lowest prices over a certain lookback period to determine its level of smoothing. The AMA can help reduce lag and increase responsiveness to changes in trend direction, making it useful for traders who want to follow trends while avoiding false signals. The AMA is calculated by multiplying a smoothing constant with the difference between the current price and the previous AMA value, then adding the result to the previous AMA value.
T3
The T3 moving average is a type of technical indicator used in financial analysis to identify trends in price movements. It is similar to the Exponential Moving Average (EMA) and the Double Exponential Moving Average (DEMA), but uses a different smoothing algorithm.
The T3 moving average is calculated using a series of exponential moving averages that are designed to filter out noise and smooth the data. The resulting smoothed data is then weighted with a non-linear function to produce a final output that is more responsive to changes in trend direction.
The T3 moving average can be customized by adjusting the length of the moving average, as well as the weighting function used to smooth the data. It is commonly used in conjunction with other technical indicators as part of a larger trading strategy.
█ Giga Kaleidoscope Modularized Trading System
Core components of an NNFX algorithmic trading strategy
The NNFX algorithm is built on the principles of trend, momentum, and volatility. There are six core components in the NNFX trading algorithm:
1. Volatility - price volatility; e.g., Average True Range, True Range Double, Close-to-Close, etc.
2. Baseline - a moving average to identify price trend
3. Confirmation 1 - a technical indicator used to identify trends
4. Confirmation 2 - a technical indicator used to identify trends
5. Continuation - a technical indicator used to identify trends
6. Volatility/Volume - a technical indicator used to identify volatility/volume breakouts/breakdown
7. Exit - a technical indicator used to determine when a trend is exhausted
What is Volatility in the NNFX trading system?
In the NNFX (No Nonsense Forex) trading system, ATR (Average True Range) is typically used to measure the volatility of an asset. It is used as a part of the system to help determine the appropriate stop loss and take profit levels for a trade. ATR is calculated by taking the average of the true range values over a specified period.
True range is calculated as the maximum of the following values:
-Current high minus the current low
-Absolute value of the current high minus the previous close
-Absolute value of the current low minus the previous close
ATR is a dynamic indicator that changes with changes in volatility. As volatility increases, the value of ATR increases, and as volatility decreases, the value of ATR decreases. By using ATR in NNFX system, traders can adjust their stop loss and take profit levels according to the volatility of the asset being traded. This helps to ensure that the trade is given enough room to move, while also minimizing potential losses.
Other types of volatility include True Range Double (TRD), Close-to-Close, and Garman-Klass
What is a Baseline indicator?
The baseline is essentially a moving average, and is used to determine the overall direction of the market.
The baseline in the NNFX system is used to filter out trades that are not in line with the long-term trend of the market. The baseline is plotted on the chart along with other indicators, such as the Moving Average (MA), the Relative Strength Index (RSI), and the Average True Range (ATR).
Trades are only taken when the price is in the same direction as the baseline. For example, if the baseline is sloping upwards, only long trades are taken, and if the baseline is sloping downwards, only short trades are taken. This approach helps to ensure that trades are in line with the overall trend of the market, and reduces the risk of entering trades that are likely to fail.
By using a baseline in the NNFX system, traders can have a clear reference point for determining the overall trend of the market, and can make more informed trading decisions. The baseline helps to filter out noise and false signals, and ensures that trades are taken in the direction of the long-term trend.
What is a Confirmation indicator?
Confirmation indicators are technical indicators that are used to confirm the signals generated by primary indicators. Primary indicators are the core indicators used in the NNFX system, such as the Average True Range (ATR), the Moving Average (MA), and the Relative Strength Index (RSI).
The purpose of the confirmation indicators is to reduce false signals and improve the accuracy of the trading system. They are designed to confirm the signals generated by the primary indicators by providing additional information about the strength and direction of the trend.
Some examples of confirmation indicators that may be used in the NNFX system include the Bollinger Bands, the MACD (Moving Average Convergence Divergence), and the MACD Oscillator. These indicators can provide information about the volatility, momentum, and trend strength of the market, and can be used to confirm the signals generated by the primary indicators.
In the NNFX system, confirmation indicators are used in combination with primary indicators and other filters to create a trading system that is robust and reliable. By using multiple indicators to confirm trading signals, the system aims to reduce the risk of false signals and improve the overall profitability of the trades.
What is a Continuation indicator?
In the NNFX (No Nonsense Forex) trading system, a continuation indicator is a technical indicator that is used to confirm a current trend and predict that the trend is likely to continue in the same direction. A continuation indicator is typically used in conjunction with other indicators in the system, such as a baseline indicator, to provide a comprehensive trading strategy.
What is a Volatility/Volume indicator?
Volume indicators, such as the On Balance Volume (OBV), the Chaikin Money Flow (CMF), or the Volume Price Trend (VPT), are used to measure the amount of buying and selling activity in a market. They are based on the trading volume of the market, and can provide information about the strength of the trend. In the NNFX system, volume indicators are used to confirm trading signals generated by the Moving Average and the Relative Strength Index. Volatility indicators include Average Direction Index, Waddah Attar, and Volatility Ratio. In the NNFX trading system, volatility is a proxy for volume and vice versa.
By using volume indicators as confirmation tools, the NNFX trading system aims to reduce the risk of false signals and improve the overall profitability of trades. These indicators can provide additional information about the market that is not captured by the primary indicators, and can help traders to make more informed trading decisions. In addition, volume indicators can be used to identify potential changes in market trends and to confirm the strength of price movements.
What is an Exit indicator?
The exit indicator is used in conjunction with other indicators in the system, such as the Moving Average (MA), the Relative Strength Index (RSI), and the Average True Range (ATR), to provide a comprehensive trading strategy.
The exit indicator in the NNFX system can be any technical indicator that is deemed effective at identifying optimal exit points. Examples of exit indicators that are commonly used include the Parabolic SAR, the Average Directional Index (ADX), and the Chandelier Exit.
The purpose of the exit indicator is to identify when a trend is likely to reverse or when the market conditions have changed, signaling the need to exit a trade. By using an exit indicator, traders can manage their risk and prevent significant losses.
In the NNFX system, the exit indicator is used in conjunction with a stop loss and a take profit order to maximize profits and minimize losses. The stop loss order is used to limit the amount of loss that can be incurred if the trade goes against the trader, while the take profit order is used to lock in profits when the trade is moving in the trader's favor.
Overall, the use of an exit indicator in the NNFX trading system is an important component of a comprehensive trading strategy. It allows traders to manage their risk effectively and improve the profitability of their trades by exiting at the right time.
How does Loxx's GKD (Giga Kaleidoscope Modularized Trading System) implement the NNFX algorithm outlined above?
Loxx's GKD v1.0 system has five types of modules (indicators/strategies). These modules are:
1. GKD-BT - Backtesting module (Volatility, Number 1 in the NNFX algorithm)
2. GKD-B - Baseline module (Baseline and Volatility/Volume, Numbers 1 and 2 in the NNFX algorithm)
3. GKD-C - Confirmation 1/2 and Continuation module (Confirmation 1/2 and Continuation, Numbers 3, 4, and 5 in the NNFX algorithm)
4. GKD-V - Volatility/Volume module (Confirmation 1/2, Number 6 in the NNFX algorithm)
5. GKD-E - Exit module (Exit, Number 7 in the NNFX algorithm)
(additional module types will added in future releases)
Each module interacts with every module by passing data between modules. Data is passed between each module as described below:
GKD-B => GKD-V => GKD-C(1) => GKD-C(2) => GKD-C(Continuation) => GKD-E => GKD-BT
That is, the Baseline indicator passes its data to Volatility/Volume. The Volatility/Volume indicator passes its values to the Confirmation 1 indicator. The Confirmation 1 indicator passes its values to the Confirmation 2 indicator. The Confirmation 2 indicator passes its values to the Continuation indicator. The Continuation indicator passes its values to the Exit indicator, and finally, the Exit indicator passes its values to the Backtest strategy.
This chaining of indicators requires that each module conform to Loxx's GKD protocol, therefore allowing for the testing of every possible combination of technical indicators that make up the six components of the NNFX algorithm.
What does the application of the GKD trading system look like?
Example trading system:
Backtest: Strategy with 1-3 take profits, trailing stop loss, multiple types of PnL volatility, and 2 backtesting styles
Baseline: Hull Moving Average
Volatility/Volume: Hurst Exponent
Confirmation 1: Polychromatic Momentum as shown on the chart above
Confirmation 2: Williams Percent Range
Continuation: Polychromatic Momentum
Exit: Rex Oscillator
Each GKD indicator is denoted with a module identifier of either: GKD-BT, GKD-B, GKD-C, GKD-V, or GKD-E. This allows traders to understand to which module each indicator belongs and where each indicator fits into the GKD protocol chain.
Giga Kaleidoscope Modularized Trading System Signals (based on the NNFX algorithm)
Standard Entry
1. GKD-C Confirmation 1 Signal
2. GKD-B Baseline agrees
3. Price is within a range of 0.2x Volatility and 1.0x Volatility of the Goldie Locks Mean
4. GKD-C Confirmation 2 agrees
5. GKD-V Volatility/Volume agrees
Baseline Entry
1. GKD-B Baseline signal
2. GKD-C Confirmation 1 agrees
3. Price is within a range of 0.2x Volatility and 1.0x Volatility of the Goldie Locks Mean
4. GKD-C Confirmation 2 agrees
5. GKD-V Volatility/Volume agrees
6. GKD-C Confirmation 1 signal was less than 7 candles prior
Volatility/Volume Entry
1. GKD-V Volatility/Volume signal
2. GKD-C Confirmation 1 agrees
3. Price is within a range of 0.2x Volatility and 1.0x Volatility of the Goldie Locks Mean
4. GKD-C Confirmation 2 agrees
5. GKD-B Baseline agrees
6. GKD-C Confirmation 1 signal was less than 7 candles prior
Continuation Entry
1. Standard Entry, Baseline Entry, or Pullback; entry triggered previously
2. GKD-B Baseline hasn't crossed since entry signal trigger
3. GKD-C Confirmation Continuation Indicator signals
4. GKD-C Confirmation 1 agrees
5. GKD-B Baseline agrees
6. GKD-C Confirmation 2 agrees
1-Candle Rule Standard Entry
1. GKD-C Confirmation 1 signal
2. GKD-B Baseline agrees
3. Price is within a range of 0.2x Volatility and 1.0x Volatility of the Goldie Locks Mean
Next Candle:
1. Price retraced (Long: close < close or Short: close > close )
2. GKD-B Baseline agrees
3. GKD-C Confirmation 1 agrees
4. GKD-C Confirmation 2 agrees
5. GKD-V Volatility/Volume agrees
1-Candle Rule Baseline Entry
1. GKD-B Baseline signal
2. GKD-C Confirmation 1 agrees
3. Price is within a range of 0.2x Volatility and 1.0x Volatility of the Goldie Locks Mean
4. GKD-C Confirmation 1 signal was less than 7 candles prior
Next Candle:
1. Price retraced (Long: close < close or Short: close > close )
2. GKD-B Baseline agrees
3. GKD-C Confirmation 1 agrees
4. GKD-C Confirmation 2 agrees
5. GKD-V Volatility/Volume Agrees
1-Candle Rule Volatility/Volume Entry
1. GKD-V Volatility/Volume signal
2. GKD-C Confirmation 1 agrees
3. Price is within a range of 0.2x Volatility and 1.0x Volatility of the Goldie Locks Mean
4. GKD-C Confirmation 1 signal was less than 7 candles prior
Next Candle:
1. Price retraced (Long: close < close or Short: close > close)
2. GKD-B Volatility/Volume agrees
3. GKD-C Confirmation 1 agrees
4. GKD-C Confirmation 2 agrees
5. GKD-B Baseline agrees
PullBack Entry
1. GKD-B Baseline signal
2. GKD-C Confirmation 1 agrees
3. Price is beyond 1.0x Volatility of Baseline
Next Candle:
1. Price is within a range of 0.2x Volatility and 1.0x Volatility of the Goldie Locks Mean
2. GKD-C Confirmation 1 agrees
3. GKD-C Confirmation 2 agrees
4. GKD-V Volatility/Volume Agrees
]█ Setting up the GKD
The GKD system involves chaining indicators together. These are the steps to set this up.
Use a GKD-C indicator alone on a chart
1. Inside the GKD-C indicator, change the "Confirmation Type" setting to "Solo Confirmation Simple"
Use a GKD-V indicator alone on a chart
**nothing, it's already useable on the chart without any settings changes
Use a GKD-B indicator alone on a chart
**nothing, it's already useable on the chart without any settings changes
Baseline (Baseline, Backtest)
1. Import the GKD-B Baseline into the GKD-BT Backtest: "Input into Volatility/Volume or Backtest (Baseline testing)"
2. Inside the GKD-BT Backtest, change the setting "Backtest Special" to "Baseline"
Volatility/Volume (Volatility/Volume, Backte st)
1. Inside the GKD-V indicator, change the "Testing Type" setting to "Solo"
2. Inside the GKD-V indicator, change the "Signal Type" setting to "Crossing" (neither traditional nor both can be backtested)
3. Import the GKD-V indicator into the GKD-BT Backtest: "Input into C1 or Backtest"
4. Inside the GKD-BT Backtest, change the setting "Backtest Special" to "Volatility/Volume"
5. Inside the GKD-BT Backtest, a) change the setting "Backtest Type" to "Trading" if using a directional GKD-V indicator; or, b) change the setting "Backtest Type" to "Full" if using a directional or non-directional GKD-V indicator (non-directional GKD-V can only test Longs and Shorts separately)
6. If "Backtest Type" is set to "Full": Inside the GKD-BT Backtest, change the setting "Backtest Side" to "Long" or "Short
7. If "Backtest Type" is set to "Full": To allow the system to open multiple orders at one time so you test all Longs or Shorts, open the GKD-BT Backtest, click the tab "Properties" and then insert a value of something like 10 orders into the "Pyramiding" settings. This will allow 10 orders to be opened at one time which should be enough to catch all possible Longs or Shorts.
Solo Confirmation Simple (Confirmation, Backtest)
1. Inside the GKD-C indicator, change the "Confirmation Type" setting to "Solo Confirmation Simple"
1. Import the GKD-C indicator into the GKD-BT Backtest: "Input into Backtest"
2. Inside the GKD-BT Backtest, change the setting "Backtest Special" to "Solo Confirmation Simple"
Solo Confirmation Complex without Exits (Baseline, Volatility/Volume, Confirmation, Backtest)
1. Inside the GKD-V indicator, change the "Testing Type" setting to "Chained"
2. Import the GKD-B Baseline into the GKD-V indicator: "Input into Volatility/Volume or Backtest (Baseline testing)"
3. Inside the GKD-C indicator, change the "Confirmation Type" setting to "Solo Confirmation Complex"
4. Import the GKD-V indicator into the GKD-C indicator: "Input into C1 or Backtest"
5. Inside the GKD-BT Backtest, change the setting "Backtest Special" to "GKD Full wo/ Exits"
6. Import the GKD-C into the GKD-BT Backtest: "Input into Exit or Backtest"
Solo Confirmation Complex with Exits (Baseline, Volatility/Volume, Confirmation, Exit, Backtest)
1. Inside the GKD-V indicator, change the "Testing Type" setting to "Chained"
2. Import the GKD-B Baseline into the GKD-V indicator: "Input into Volatility/Volume or Backtest (Baseline testing)"
3. Inside the GKD-C indicator, change the "Confirmation Type" setting to "Solo Confirmation Complex"
4. Import the GKD-V indicator into the GKD-C indicator: "Input into C1 or Backtest"
5. Import the GKD-C indicator into the GKD-E indicator: "Input into Exit"
6. Inside the GKD-BT Backtest, change the setting "Backtest Special" to "GKD Full w/ Exits"
7. Import the GKD-E into the GKD-BT Backtest: "Input into Backtest"
Full GKD without Exits (Baseline, Volatility/Volume, Confirmation 1, Confirmation 2, Continuation, Backtest)
1. Inside the GKD-V indicator, change the "Testing Type" setting to "Chained"
2. Import the GKD-B Baseline into the GKD-V indicator: "Input into Volatility/Volume or Backtest (Baseline testing)"
3. Inside the GKD-C 1 indicator, change the "Confirmation Type" setting to "Confirmation 1"
4. Import the GKD-V indicator into the GKD-C 1 indicator: "Input into C1 or Backtest"
5. Inside the GKD-C 2 indicator, change the "Confirmation Type" setting to "Confirmation 2"
6. Import the GKD-C 1 indicator into the GKD-C 2 indicator: "Input into C2"
7. Inside the GKD-C Continuation indicator, change the "Confirmation Type" setting to "Continuation"
8. Inside the GKD-BT Backtest, change the setting "Backtest Special" to "GKD Full wo/ Exits"
9. Import the GKD-E into the GKD-BT Backtest: "Input into Exit or Backtest"
Full GKD with Exits (Baseline, Volatility/Volume, Confirmation 1, Confirmation 2, Continuation, Exit, Backtest)
1. Inside the GKD-V indicator, change the "Testing Type" setting to "Chained"
2. Import the GKD-B Baseline into the GKD-V indicator: "Input into Volatility/Volume or Backtest (Baseline testing)"
3. Inside the GKD-C 1 indicator, change the "Confirmation Type" setting to "Confirmation 1"
4. Import the GKD-V indicator into the GKD-C 1 indicator: "Input into C1 or Backtest"
5. Inside the GKD-C 2 indicator, change the "Confirmation Type" setting to "Confirmation 2"
6. Import the GKD-C 1 indicator into the GKD-C 2 indicator: "Input into C2"
7. Inside the GKD-C Continuation indicator, change the "Confirmation Type" setting to "Continuation"
8. Import the GKD-C Continuation indicator into the GKD-E indicator: "Input into Exit"
9. Inside the GKD-BT Backtest, change the setting "Backtest Special" to "GKD Full w/ Exits"
10. Import the GKD-E into the GKD-BT Backtest: "Input into Backtest"
Baseline + Volatility/Volume (Baseline, Volatility/Volume, Backtest)
1. Inside the GKD-V indicator, change the "Testing Type" setting to "Baseline + Volatility/Volume"
2. Inside the GKD-V indicator, make sure the "Signal Type" setting is set to "Traditional"
3. Import the GKD-B Baseline into the GKD-V indicator: "Input into Volatility/Volume or Backtest (Baseline testing)"
4. Inside the GKD-BT Backtest, change the setting "Backtest Special" to "Baseline + Volatility/Volume"
5. Import the GKD-V into the GKD-BT Backtest: "Input into C1 or Backtest"
6. Inside the GKD-BT Backtest, change the setting "Backtest Type" to "Full". For this backtest, you must test Longs and Shorts separately
7. To allow the system to open multiple orders at one time so you can test all Longs or Shorts, open the GKD-BT Backtest, click the tab "Properties" and then insert a value of something like 10 orders into the "Pyramiding" settings. This will allow 10 orders to be opened at one time which should be enough to catch all possible Longs or Shorts.
Requirements
Inputs
Confirmation 1: GKD-V Volatility / Volume indicator
Confirmation 2: GKD-C Confirmation indicator
Continuation: GKD-C Confirmation indicator
Solo Confirmation Simple: GKD-B Baseline
Solo Confirmation Complex: GKD-V Volatility / Volume indicator
Solo Confirmation Super Complex: GKD-V Volatility / Volume indicator
Stacked 1: None
Stacked 2+: GKD-C, GKD-V, or GKD-B Stacked 1
Outputs
Confirmation 1: GKD-C Confirmation 2 indicator
Confirmation 2: GKD-C Continuation indicator
Continuation: GKD-E Exit indicator
Solo Confirmation Simple: GKD-BT Backtest
Solo Confirmation Complex: GKD-BT Backtest or GKD-E Exit indicator
Solo Confirmation Super Complex: GKD-C Continuation indicator
Stacked 1: GKD-C, GKD-V, or GKD-B Stacked 2+
Stacked 2+: GKD-C, GKD-V, or GKD-B Stacked 2+ or GKD-BT Backtest
Additional features will be added in future releases.
GKD-C RSI T3 [Loxx]Giga Kaleidoscope GKD-C RSI T3 is a Confirmation module included in Loxx's "Giga Kaleidoscope Modularized Trading System".
█ GKD-C RSI T3
RSI T3 vs. Original RSI
The Relative Strength Index (RSI), developed by J. Welles Wilder Jr. in 1978, is a widely used momentum oscillator for determining overbought and oversold market conditions. The T3 Relative Strength Index (RSI T3) builds on the original RSI by incorporating the T3 Moving Average to provide enhanced smoothing and responsiveness. This article delves into the history of the T3 Moving Average, outlines the differences between the RSI T3 and the original RSI, and highlights the benefits of using the RSI T3 for trading purposes.
Original RSI: Foundation and Limitations
The original RSI measures the speed and magnitude of price changes to identify overbought and oversold market conditions. The RSI oscillates between 0 and 100, with values above 70 suggesting overbought conditions and values below 30 indicating oversold conditions. Despite its widespread use, the original RSI has some limitations, including its sensitivity to price fluctuations, which can lead to false signals.
T3 Moving Average: History and Characteristics
The T3 Moving Average was developed by Tim Tillson in 1998 to address the limitations of traditional moving averages, such as lag and overshoot. Tillson's T3 Moving Average is a more responsive and smoother moving average, using a unique recursive calculation to minimize lag and overshoot. This enhanced performance is achieved through a combination of exponential moving averages and a volume factor that adjusts the degree of smoothing.
RSI T3: Integrating T3 Moving Average into RSI
The RSI T3 combines the original RSI formula with the T3 Moving Average to overcome the limitations of the original RSI. By integrating the T3 Moving Average, the RSI T3 offers traders a smoother and more responsive momentum oscillator that is less prone to false signals and erratic movements.
Comparing RSI T3 and Original RSI
The key differences between the RSI T3 and the original RSI lie in their calculation methods and responsiveness. The RSI T3 incorporates the T3 Moving Average, leading to improved smoothing and a more accurate representation of price momentum. This integration results in a momentum oscillator that is less sensitive to sudden price fluctuations, thus reducing the occurrence of false signals and allowing for more reliable trading decisions.
Benefits of RSI T3 for Traders
Traders, regardless of their programming expertise, can benefit from using the RSI T3 in various ways:
1. Improved signal reliability: The RSI T3's enhanced smoothing reduces false signals and erratic movements, leading to more dependable buy and sell signals.
2. Enhanced responsiveness: The RSI T3 is more responsive to price changes, making it easier to identify trend reversals and market momentum shifts.
3. Divergence analysis: Like the original RSI, the RSI T3 can be used to spot divergences between price and the oscillator, potentially signaling reversals or trend exhaustion.
The RSI T3 is an advanced momentum oscillator that builds on the original RSI by incorporating the T3 Moving Average. Its historical roots in addressing the limitations of traditional moving averages make it a valuable tool for traders seeking a more responsive and reliable momentum indicator. By understanding the differences between the RSI T3 and the original RSI, traders can make more informed decisions and enhance their overall trading performance.
Additional Features
This indicator allows you to select from 33 source types. They are as follows:
Close
Open
High
Low
Median
Typical
Weighted
Average
Average Median Body
Trend Biased
Trend Biased (Extreme)
HA Close
HA Open
HA High
HA Low
HA Median
HA Typical
HA Weighted
HA Average
HA Average Median Body
HA Trend Biased
HA Trend Biased (Extreme)
HAB Close
HAB Open
HAB High
HAB Low
HAB Median
HAB Typical
HAB Weighted
HAB Average
HAB Average Median Body
HAB Trend Biased
HAB Trend Biased (Extreme)
What are Heiken Ashi "better" candles?
Heiken Ashi "better" candles are a modified version of the standard Heiken Ashi candles, which are a popular charting technique used in technical analysis. Heiken Ashi candles help traders identify trends and potential reversal points by smoothing out price data and reducing market noise. The "better formula" was proposed by Sebastian Schmidt in an article published by BNP Paribas in Warrants & Zertifikate, a German magazine, in August 2004. The aim of this formula is to further improve the smoothing of the Heiken Ashi chart and enhance its effectiveness in identifying trends and reversals.
Standard Heiken Ashi candles are calculated using the following formulas:
Heiken Ashi Close = (Open + High + Low + Close) / 4
Heiken Ashi Open = (Previous Heiken Ashi Open + Previous Heiken Ashi Close) / 2
Heiken Ashi High = Max (High, Heiken Ashi Open, Heiken Ashi Close)
Heiken Ashi Low = Min (Low, Heiken Ashi Open, Heiken Ashi Close)
The "better formula" modifies the standard Heiken Ashi calculation by incorporating additional smoothing, which can help reduce noise and make it easier to identify trends and reversals. The modified formulas for Heiken Ashi "better" candles are as follows:
Better Heiken Ashi Close = (Open + High + Low + Close) / 4
Better Heiken Ashi Open = (Previous Better Heiken Ashi Open + Previous Better Heiken Ashi Close) / 2
Better Heiken Ashi High = Max (High, Better Heiken Ashi Open, Better Heiken Ashi Close)
Better Heiken Ashi Low = Min (Low, Better Heiken Ashi Open, Better Heiken Ashi Close)
Smoothing Factor = 2 / (N + 1), where N is the chosen period for smoothing
Smoothed Better Heiken Ashi Open = (Better Heiken Ashi Open * Smoothing Factor) + (Previous Smoothed Better Heiken Ashi Open * (1 - Smoothing Factor))
Smoothed Better Heiken Ashi Close = (Better Heiken Ashi Close * Smoothing Factor) + (Previous Smoothed Better Heiken Ashi Close * (1 - Smoothing Factor))
The smoothed Better Heiken Ashi Open and Close values are then used to calculate the smoothed Better Heiken Ashi High and Low values, resulting in "better" candles that provide a clearer representation of the market trend and potential reversal points.
It's important to note that, like any other technical analysis tool, Heiken Ashi "better" candles are not foolproof and should be used in conjunction with other indicators and analysis techniques to make well-informed trading decisions.
Heiken Ashi "better" candles, as mentioned previously, provide a clearer representation of market trends and potential reversal points by reducing noise and smoothing out price data. When using these candles in conjunction with other technical analysis tools and indicators, traders can gain valuable insights into market behavior and make more informed decisions.
To effectively use Heiken Ashi "better" candles in your trading strategy, consider the following tips:
Trend Identification: Heiken Ashi "better" candles can help you identify the prevailing trend in the market. When the majority of the candles are green (or another color, depending on your chart settings) and there are no or few lower wicks, it may indicate a strong uptrend. Conversely, when the majority of the candles are red (or another color) and there are no or few upper wicks, it may signal a strong downtrend.
Trend Reversals: Look for potential trend reversals when a change in the color of the candles occurs, especially when accompanied by longer wicks. For example, if a green candle with a long lower wick is followed by a red candle, it could indicate a bearish reversal. Similarly, a red candle with a long upper wick followed by a green candle may suggest a bullish reversal.
Support and Resistance: You can use Heiken Ashi "better" candles to identify potential support and resistance levels. When the candles are consistently moving in one direction and then suddenly change color with longer wicks, it could indicate the presence of a support or resistance level.
Stop-Loss and Take-Profit: Using Heiken Ashi "better" candles can help you manage risk by determining optimal stop-loss and take-profit levels. For instance, you can place your stop-loss below the low of the most recent green candle in an uptrend or above the high of the most recent red candle in a downtrend.
Confirming Signals: Heiken Ashi "better" candles should be used in conjunction with other technical indicators, such as moving averages, oscillators, or chart patterns, to confirm signals and improve the accuracy of your analysis.
In this implementation, you have the choice of AMA, KAMA, or T3 smoothing. These are as follows:
Kaufman Adaptive Moving Average (KAMA)
The Kaufman Adaptive Moving Average (KAMA) is a type of adaptive moving average used in technical analysis to smooth out price fluctuations and identify trends. The KAMA adjusts its smoothing factor based on the market's volatility, making it more responsive in volatile markets and smoother in calm markets. The KAMA is calculated using three different efficiency ratios that determine the appropriate smoothing factor for the current market conditions. These ratios are based on the noise level of the market, the speed at which the market is moving, and the length of the moving average. The KAMA is a popular choice among traders who prefer to use adaptive indicators to identify trends and potential reversals.
Adaptive Moving Average
The Adaptive Moving Average (AMA) is a type of moving average that adjusts its sensitivity to price movements based on market conditions. It uses a ratio between the current price and the highest and lowest prices over a certain lookback period to determine its level of smoothing. The AMA can help reduce lag and increase responsiveness to changes in trend direction, making it useful for traders who want to follow trends while avoiding false signals. The AMA is calculated by multiplying a smoothing constant with the difference between the current price and the previous AMA value, then adding the result to the previous AMA value.
T3
The T3 moving average is a type of technical indicator used in financial analysis to identify trends in price movements. It is similar to the Exponential Moving Average (EMA) and the Double Exponential Moving Average (DEMA), but uses a different smoothing algorithm.
The T3 moving average is calculated using a series of exponential moving averages that are designed to filter out noise and smooth the data. The resulting smoothed data is then weighted with a non-linear function to produce a final output that is more responsive to changes in trend direction.
The T3 moving average can be customized by adjusting the length of the moving average, as well as the weighting function used to smooth the data. It is commonly used in conjunction with other technical indicators as part of a larger trading strategy.
█ Giga Kaleidoscope Modularized Trading System
Core components of an NNFX algorithmic trading strategy
The NNFX algorithm is built on the principles of trend, momentum, and volatility. There are six core components in the NNFX trading algorithm:
1. Volatility - price volatility; e.g., Average True Range, True Range Double, Close-to-Close, etc.
2. Baseline - a moving average to identify price trend
3. Confirmation 1 - a technical indicator used to identify trends
4. Confirmation 2 - a technical indicator used to identify trends
5. Continuation - a technical indicator used to identify trends
6. Volatility/Volume - a technical indicator used to identify volatility/volume breakouts/breakdown
7. Exit - a technical indicator used to determine when a trend is exhausted
What is Volatility in the NNFX trading system?
In the NNFX (No Nonsense Forex) trading system, ATR (Average True Range) is typically used to measure the volatility of an asset. It is used as a part of the system to help determine the appropriate stop loss and take profit levels for a trade. ATR is calculated by taking the average of the true range values over a specified period.
True range is calculated as the maximum of the following values:
-Current high minus the current low
-Absolute value of the current high minus the previous close
-Absolute value of the current low minus the previous close
ATR is a dynamic indicator that changes with changes in volatility. As volatility increases, the value of ATR increases, and as volatility decreases, the value of ATR decreases. By using ATR in NNFX system, traders can adjust their stop loss and take profit levels according to the volatility of the asset being traded. This helps to ensure that the trade is given enough room to move, while also minimizing potential losses.
Other types of volatility include True Range Double (TRD), Close-to-Close, and Garman-Klass
What is a Baseline indicator?
The baseline is essentially a moving average, and is used to determine the overall direction of the market.
The baseline in the NNFX system is used to filter out trades that are not in line with the long-term trend of the market. The baseline is plotted on the chart along with other indicators, such as the Moving Average (MA), the Relative Strength Index (RSI), and the Average True Range (ATR).
Trades are only taken when the price is in the same direction as the baseline. For example, if the baseline is sloping upwards, only long trades are taken, and if the baseline is sloping downwards, only short trades are taken. This approach helps to ensure that trades are in line with the overall trend of the market, and reduces the risk of entering trades that are likely to fail.
By using a baseline in the NNFX system, traders can have a clear reference point for determining the overall trend of the market, and can make more informed trading decisions. The baseline helps to filter out noise and false signals, and ensures that trades are taken in the direction of the long-term trend.
What is a Confirmation indicator?
Confirmation indicators are technical indicators that are used to confirm the signals generated by primary indicators. Primary indicators are the core indicators used in the NNFX system, such as the Average True Range (ATR), the Moving Average (MA), and the Relative Strength Index (RSI).
The purpose of the confirmation indicators is to reduce false signals and improve the accuracy of the trading system. They are designed to confirm the signals generated by the primary indicators by providing additional information about the strength and direction of the trend.
Some examples of confirmation indicators that may be used in the NNFX system include the Bollinger Bands, the MACD (Moving Average Convergence Divergence), and the MACD Oscillator. These indicators can provide information about the volatility, momentum, and trend strength of the market, and can be used to confirm the signals generated by the primary indicators.
In the NNFX system, confirmation indicators are used in combination with primary indicators and other filters to create a trading system that is robust and reliable. By using multiple indicators to confirm trading signals, the system aims to reduce the risk of false signals and improve the overall profitability of the trades.
What is a Continuation indicator?
In the NNFX (No Nonsense Forex) trading system, a continuation indicator is a technical indicator that is used to confirm a current trend and predict that the trend is likely to continue in the same direction. A continuation indicator is typically used in conjunction with other indicators in the system, such as a baseline indicator, to provide a comprehensive trading strategy.
What is a Volatility/Volume indicator?
Volume indicators, such as the On Balance Volume (OBV), the Chaikin Money Flow (CMF), or the Volume Price Trend (VPT), are used to measure the amount of buying and selling activity in a market. They are based on the trading volume of the market, and can provide information about the strength of the trend. In the NNFX system, volume indicators are used to confirm trading signals generated by the Moving Average and the Relative Strength Index. Volatility indicators include Average Direction Index, Waddah Attar, and Volatility Ratio. In the NNFX trading system, volatility is a proxy for volume and vice versa.
By using volume indicators as confirmation tools, the NNFX trading system aims to reduce the risk of false signals and improve the overall profitability of trades. These indicators can provide additional information about the market that is not captured by the primary indicators, and can help traders to make more informed trading decisions. In addition, volume indicators can be used to identify potential changes in market trends and to confirm the strength of price movements.
What is an Exit indicator?
The exit indicator is used in conjunction with other indicators in the system, such as the Moving Average (MA), the Relative Strength Index (RSI), and the Average True Range (ATR), to provide a comprehensive trading strategy.
The exit indicator in the NNFX system can be any technical indicator that is deemed effective at identifying optimal exit points. Examples of exit indicators that are commonly used include the Parabolic SAR, the Average Directional Index (ADX), and the Chandelier Exit.
The purpose of the exit indicator is to identify when a trend is likely to reverse or when the market conditions have changed, signaling the need to exit a trade. By using an exit indicator, traders can manage their risk and prevent significant losses.
In the NNFX system, the exit indicator is used in conjunction with a stop loss and a take profit order to maximize profits and minimize losses. The stop loss order is used to limit the amount of loss that can be incurred if the trade goes against the trader, while the take profit order is used to lock in profits when the trade is moving in the trader's favor.
Overall, the use of an exit indicator in the NNFX trading system is an important component of a comprehensive trading strategy. It allows traders to manage their risk effectively and improve the profitability of their trades by exiting at the right time.
How does Loxx's GKD (Giga Kaleidoscope Modularized Trading System) implement the NNFX algorithm outlined above?
Loxx's GKD v1.0 system has five types of modules (indicators/strategies). These modules are:
1. GKD-BT - Backtesting module (Volatility, Number 1 in the NNFX algorithm)
2. GKD-B - Baseline module (Baseline and Volatility/Volume, Numbers 1 and 2 in the NNFX algorithm)
3. GKD-C - Confirmation 1/2 and Continuation module (Confirmation 1/2 and Continuation, Numbers 3, 4, and 5 in the NNFX algorithm)
4. GKD-V - Volatility/Volume module (Confirmation 1/2, Number 6 in the NNFX algorithm)
5. GKD-E - Exit module (Exit, Number 7 in the NNFX algorithm)
(additional module types will added in future releases)
Each module interacts with every module by passing data between modules. Data is passed between each module as described below:
GKD-B => GKD-V => GKD-C(1) => GKD-C(2) => GKD-C(Continuation) => GKD-E => GKD-BT
That is, the Baseline indicator passes its data to Volatility/Volume. The Volatility/Volume indicator passes its values to the Confirmation 1 indicator. The Confirmation 1 indicator passes its values to the Confirmation 2 indicator. The Confirmation 2 indicator passes its values to the Continuation indicator. The Continuation indicator passes its values to the Exit indicator, and finally, the Exit indicator passes its values to the Backtest strategy.
This chaining of indicators requires that each module conform to Loxx's GKD protocol, therefore allowing for the testing of every possible combination of technical indicators that make up the six components of the NNFX algorithm.
What does the application of the GKD trading system look like?
Example trading system:
Backtest: Strategy with 1-3 take profits, trailing stop loss, multiple types of PnL volatility, and 2 backtesting styles
Baseline: Hull Moving Average
Volatility/Volume: Hurst Exponent
Confirmation 1: RSI T3 as shown on the chart above
Confirmation 2: Williams Percent Range
Continuation: Fisher Transform
Exit: Rex Oscillator
Each GKD indicator is denoted with a module identifier of either: GKD-BT, GKD-B, GKD-C, GKD-V, or GKD-E. This allows traders to understand to which module each indicator belongs and where each indicator fits into the GKD protocol chain.
Giga Kaleidoscope Modularized Trading System Signals (based on the NNFX algorithm)
Standard Entry
1. GKD-C Confirmation 1 Signal
2. GKD-B Baseline agrees
3. Price is within a range of 0.2x Volatility and 1.0x Volatility of the Goldie Locks Mean
4. GKD-C Confirmation 2 agrees
5. GKD-V Volatility/Volume agrees
Baseline Entry
1. GKD-B Baseline signal
2. GKD-C Confirmation 1 agrees
3. Price is within a range of 0.2x Volatility and 1.0x Volatility of the Goldie Locks Mean
4. GKD-C Confirmation 2 agrees
5. GKD-V Volatility/Volume agrees
6. GKD-C Confirmation 1 signal was less than 7 candles prior
Volatility/Volume Entry
1. GKD-V Volatility/Volume signal
2. GKD-C Confirmation 1 agrees
3. Price is within a range of 0.2x Volatility and 1.0x Volatility of the Goldie Locks Mean
4. GKD-C Confirmation 2 agrees
5. GKD-B Baseline agrees
6. GKD-C Confirmation 1 signal was less than 7 candles prior
Continuation Entry
1. Standard Entry, Baseline Entry, or Pullback; entry triggered previously
2. GKD-B Baseline hasn't crossed since entry signal trigger
3. GKD-C Confirmation Continuation Indicator signals
4. GKD-C Confirmation 1 agrees
5. GKD-B Baseline agrees
6. GKD-C Confirmation 2 agrees
1-Candle Rule Standard Entry
1. GKD-C Confirmation 1 signal
2. GKD-B Baseline agrees
3. Price is within a range of 0.2x Volatility and 1.0x Volatility of the Goldie Locks Mean
Next Candle:
1. Price retraced (Long: close < close or Short: close > close )
2. GKD-B Baseline agrees
3. GKD-C Confirmation 1 agrees
4. GKD-C Confirmation 2 agrees
5. GKD-V Volatility/Volume agrees
1-Candle Rule Baseline Entry
1. GKD-B Baseline signal
2. GKD-C Confirmation 1 agrees
3. Price is within a range of 0.2x Volatility and 1.0x Volatility of the Goldie Locks Mean
4. GKD-C Confirmation 1 signal was less than 7 candles prior
Next Candle:
1. Price retraced (Long: close < close or Short: close > close )
2. GKD-B Baseline agrees
3. GKD-C Confirmation 1 agrees
4. GKD-C Confirmation 2 agrees
5. GKD-V Volatility/Volume Agrees
1-Candle Rule Volatility/Volume Entry
1. GKD-V Volatility/Volume signal
2. GKD-C Confirmation 1 agrees
3. Price is within a range of 0.2x Volatility and 1.0x Volatility of the Goldie Locks Mean
4. GKD-C Confirmation 1 signal was less than 7 candles prior
Next Candle:
1. Price retraced (Long: close < close or Short: close > close)
2. GKD-B Volatility/Volume agrees
3. GKD-C Confirmation 1 agrees
4. GKD-C Confirmation 2 agrees
5. GKD-B Baseline agrees
PullBack Entry
1. GKD-B Baseline signal
2. GKD-C Confirmation 1 agrees
3. Price is beyond 1.0x Volatility of Baseline
Next Candle:
1. Price is within a range of 0.2x Volatility and 1.0x Volatility of the Goldie Locks Mean
2. GKD-C Confirmation 1 agrees
3. GKD-C Confirmation 2 agrees
4. GKD-V Volatility/Volume Agrees
]█ Setting up the GKD
The GKD system involves chaining indicators together. These are the steps to set this up.
Use a GKD-C indicator alone on a chart
1. Inside the GKD-C indicator, change the "Confirmation Type" setting to "Solo Confirmation Simple"
Use a GKD-V indicator alone on a chart
**nothing, it's already useable on the chart without any settings changes
Use a GKD-B indicator alone on a chart
**nothing, it's already useable on the chart without any settings changes
Baseline (Baseline, Backtest)
1. Import the GKD-B Baseline into the GKD-BT Backtest: "Input into Volatility/Volume or Backtest (Baseline testing)"
2. Inside the GKD-BT Backtest, change the setting "Backtest Special" to "Baseline"
Volatility/Volume (Volatility/Volume, Backte st)
1. Inside the GKD-V indicator, change the "Testing Type" setting to "Solo"
2. Inside the GKD-V indicator, change the "Signal Type" setting to "Crossing" (neither traditional nor both can be backtested)
3. Import the GKD-V indicator into the GKD-BT Backtest: "Input into C1 or Backtest"
4. Inside the GKD-BT Backtest, change the setting "Backtest Special" to "Volatility/Volume"
5. Inside the GKD-BT Backtest, a) change the setting "Backtest Type" to "Trading" if using a directional GKD-V indicator; or, b) change the setting "Backtest Type" to "Full" if using a directional or non-directional GKD-V indicator (non-directional GKD-V can only test Longs and Shorts separately)
6. If "Backtest Type" is set to "Full": Inside the GKD-BT Backtest, change the setting "Backtest Side" to "Long" or "Short
7. If "Backtest Type" is set to "Full": To allow the system to open multiple orders at one time so you test all Longs or Shorts, open the GKD-BT Backtest, click the tab "Properties" and then insert a value of something like 10 orders into the "Pyramiding" settings. This will allow 10 orders to be opened at one time which should be enough to catch all possible Longs or Shorts.
Solo Confirmation Simple (Confirmation, Backtest)
1. Inside the GKD-C indicator, change the "Confirmation Type" setting to "Solo Confirmation Simple"
1. Import the GKD-C indicator into the GKD-BT Backtest: "Input into Backtest"
2. Inside the GKD-BT Backtest, change the setting "Backtest Special" to "Solo Confirmation Simple"
Solo Confirmation Complex without Exits (Baseline, Volatility/Volume, Confirmation, Backtest)
1. Inside the GKD-V indicator, change the "Testing Type" setting to "Chained"
2. Import the GKD-B Baseline into the GKD-V indicator: "Input into Volatility/Volume or Backtest (Baseline testing)"
3. Inside the GKD-C indicator, change the "Confirmation Type" setting to "Solo Confirmation Complex"
4. Import the GKD-V indicator into the GKD-C indicator: "Input into C1 or Backtest"
5. Inside the GKD-BT Backtest, change the setting "Backtest Special" to "GKD Full wo/ Exits"
6. Import the GKD-C into the GKD-BT Backtest: "Input into Exit or Backtest"
Solo Confirmation Complex with Exits (Baseline, Volatility/Volume, Confirmation, Exit, Backtest)
1. Inside the GKD-V indicator, change the "Testing Type" setting to "Chained"
2. Import the GKD-B Baseline into the GKD-V indicator: "Input into Volatility/Volume or Backtest (Baseline testing)"
3. Inside the GKD-C indicator, change the "Confirmation Type" setting to "Solo Confirmation Complex"
4. Import the GKD-V indicator into the GKD-C indicator: "Input into C1 or Backtest"
5. Import the GKD-C indicator into the GKD-E indicator: "Input into Exit"
6. Inside the GKD-BT Backtest, change the setting "Backtest Special" to "GKD Full w/ Exits"
7. Import the GKD-E into the GKD-BT Backtest: "Input into Backtest"
Full GKD without Exits (Baseline, Volatility/Volume, Confirmation 1, Confirmation 2, Continuation, Backtest)
1. Inside the GKD-V indicator, change the "Testing Type" setting to "Chained"
2. Import the GKD-B Baseline into the GKD-V indicator: "Input into Volatility/Volume or Backtest (Baseline testing)"
3. Inside the GKD-C 1 indicator, change the "Confirmation Type" setting to "Confirmation 1"
4. Import the GKD-V indicator into the GKD-C 1 indicator: "Input into C1 or Backtest"
5. Inside the GKD-C 2 indicator, change the "Confirmation Type" setting to "Confirmation 2"
6. Import the GKD-C 1 indicator into the GKD-C 2 indicator: "Input into C2"
7. Inside the GKD-C Continuation indicator, change the "Confirmation Type" setting to "Continuation"
8. Inside the GKD-BT Backtest, change the setting "Backtest Special" to "GKD Full wo/ Exits"
9. Import the GKD-E into the GKD-BT Backtest: "Input into Exit or Backtest"
Full GKD with Exits (Baseline, Volatility/Volume, Confirmation 1, Confirmation 2, Continuation, Exit, Backtest)
1. Inside the GKD-V indicator, change the "Testing Type" setting to "Chained"
2. Import the GKD-B Baseline into the GKD-V indicator: "Input into Volatility/Volume or Backtest (Baseline testing)"
3. Inside the GKD-C 1 indicator, change the "Confirmation Type" setting to "Confirmation 1"
4. Import the GKD-V indicator into the GKD-C 1 indicator: "Input into C1 or Backtest"
5. Inside the GKD-C 2 indicator, change the "Confirmation Type" setting to "Confirmation 2"
6. Import the GKD-C 1 indicator into the GKD-C 2 indicator: "Input into C2"
7. Inside the GKD-C Continuation indicator, change the "Confirmation Type" setting to "Continuation"
8. Import the GKD-C Continuation indicator into the GKD-E indicator: "Input into Exit"
9. Inside the GKD-BT Backtest, change the setting "Backtest Special" to "GKD Full w/ Exits"
10. Import the GKD-E into the GKD-BT Backtest: "Input into Backtest"
Baseline + Volatility/Volume (Baseline, Volatility/Volume, Backtest)
1. Inside the GKD-V indicator, change the "Testing Type" setting to "Baseline + Volatility/Volume"
2. Inside the GKD-V indicator, make sure the "Signal Type" setting is set to "Traditional"
3. Import the GKD-B Baseline into the GKD-V indicator: "Input into Volatility/Volume or Backtest (Baseline testing)"
4. Inside the GKD-BT Backtest, change the setting "Backtest Special" to "Baseline + Volatility/Volume"
5. Import the GKD-V into the GKD-BT Backtest: "Input into C1 or Backtest"
6. Inside the GKD-BT Backtest, change the setting "Backtest Type" to "Full". For this backtest, you must test Longs and Shorts separately
7. To allow the system to open multiple orders at one time so you can test all Longs or Shorts, open the GKD-BT Backtest, click the tab "Properties" and then insert a value of something like 10 orders into the "Pyramiding" settings. This will allow 10 orders to be opened at one time which should be enough to catch all possible Longs or Shorts.
Requirements
Inputs
Confirmation 1: GKD-V Volatility / Volume indicator
Confirmation 2: GKD-C Confirmation indicator
Continuation: GKD-C Confirmation indicator
Solo Confirmation Simple: GKD-B Baseline
Solo Confirmation Complex: GKD-V Volatility / Volume indicator
Solo Confirmation Super Complex: GKD-V Volatility / Volume indicator
Stacked 1: None
Stacked 2+: GKD-C, GKD-V, or GKD-B Stacked 1
Outputs
Confirmation 1: GKD-C Confirmation 2 indicator
Confirmation 2: GKD-C Continuation indicator
Continuation: GKD-E Exit indicator
Solo Confirmation Simple: GKD-BT Backtest
Solo Confirmation Complex: GKD-BT Backtest or GKD-E Exit indicator
Solo Confirmation Super Complex: GKD-C Continuation indicator
Stacked 1: GKD-C, GKD-V, or GKD-B Stacked 2+
Stacked 2+: GKD-C, GKD-V, or GKD-B Stacked 2+ or GKD-BT Backtest
Additional features will be added in future releases.
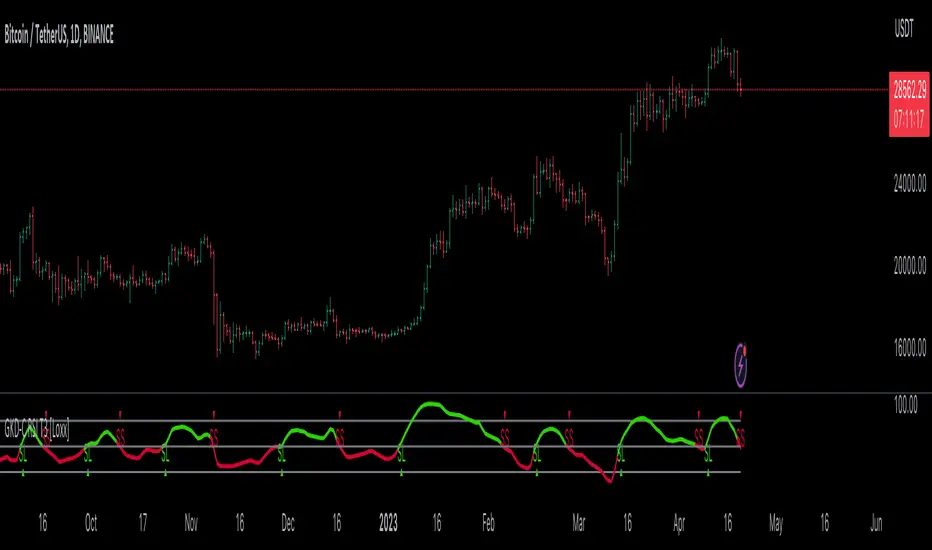
GKD-C RSI DEMA [Loxx]Giga Kaleidoscope GKD-C RSI DEMA is a Confirmation module included in Loxx's "Giga Kaleidoscope Modularized Trading System".
█ GKD-C RSI DEMA
Exploring RSI-DEMA: A Novel Indicator for Technical Analysis in Trading
The world of trading has evolved considerably with the advent of technology and the development of various technical analysis tools. These tools assist traders in making informed decisions based on the historical price movements of financial instruments. One such tool is the Relative Strength Index (RSI), which has been widely used to gauge the momentum of price movements. However, the following explores a new variation of RSI, calculated using the Double Exponential Moving Average (DEMA), which we will refer to as RSI-DEMA.
Background on RSI
The Relative Strength Index (RSI) is a momentum oscillator developed by J. Welles Wilder in 1978. It measures the speed and change of price movements, oscillating between 0 and 100. The RSI is typically used to identify overbought or oversold conditions in a market. An RSI value above 70 suggests an overbought condition, whereas a value below 30 indicates an oversold condition. This information can be valuable for traders in determining potential entry and exit points.
Introducing RSI-DEMA
The RSI-DEMA is a modified version of the traditional RSI that incorporates the Double Exponential Moving Average (DEMA) in its calculation. DEMA, developed by Patrick Mulloy, is a type of moving average that reacts more quickly to recent price changes compared to other moving averages like Simple Moving Average (SMA) and Exponential Moving Average (EMA). By combining RSI with DEMA, the RSI-DEMA aims to provide a more sensitive and responsive momentum oscillator for traders to analyze market conditions.
RSI-DEMA Calculation
The RSI-DEMA formula calculates the RSI-DEMA value for a given input price (src) and period (per). The first step is to compute the alpha value, which is inversely proportional to the square root of the period. Next, the price change is calculated and separated into positive and negative changes. These changes are then smoothed using the DEMA method, which involves two stages of exponential smoothing.
Finally, the smoothed positive and negative changes are divided, and the result is scaled by 50 to obtain the RSI-DEMA value, which oscillates between 0 and 100. This value provides insight into the strength of the price momentum and can be used similarly to the traditional RSI to identify overbought and oversold conditions in the market.
Advantages of RSI-DEMA
The primary advantage of RSI-DEMA over the traditional RSI is its increased sensitivity to recent price changes. By incorporating the DEMA in its calculation, RSI-DEMA reacts more quickly to sudden price movements, potentially providing traders with more timely signals for entry or exit points. This may prove beneficial, especially in fast-paced or volatile market conditions.
In summary, RSI-DEMA is a novel technical indicator that combines the strengths of both RSI and DEMA to provide a more sensitive and responsive momentum oscillator. While the traditional RSI remains a popular and widely-used tool in technical analysis, the RSI-DEMA offers an interesting alternative for traders who seek a more responsive indicator to capture market opportunities in fast-paced and dynamic environments. As with any trading tool, the RSI-DEMA should be used in conjunction with other technical analysis methods and risk management strategies to achieve optimal trading outcomes.
Additional Features
This indicator allows you to select from 33 source types. They are as follows:
Close
Open
High
Low
Median
Typical
Weighted
Average
Average Median Body
Trend Biased
Trend Biased (Extreme)
HA Close
HA Open
HA High
HA Low
HA Median
HA Typical
HA Weighted
HA Average
HA Average Median Body
HA Trend Biased
HA Trend Biased (Extreme)
HAB Close
HAB Open
HAB High
HAB Low
HAB Median
HAB Typical
HAB Weighted
HAB Average
HAB Average Median Body
HAB Trend Biased
HAB Trend Biased (Extreme)
What are Heiken Ashi "better" candles?
Heiken Ashi "better" candles are a modified version of the standard Heiken Ashi candles, which are a popular charting technique used in technical analysis. Heiken Ashi candles help traders identify trends and potential reversal points by smoothing out price data and reducing market noise. The "better formula" was proposed by Sebastian Schmidt in an article published by BNP Paribas in Warrants & Zertifikate, a German magazine, in August 2004. The aim of this formula is to further improve the smoothing of the Heiken Ashi chart and enhance its effectiveness in identifying trends and reversals.
Standard Heiken Ashi candles are calculated using the following formulas:
Heiken Ashi Close = (Open + High + Low + Close) / 4
Heiken Ashi Open = (Previous Heiken Ashi Open + Previous Heiken Ashi Close) / 2
Heiken Ashi High = Max (High, Heiken Ashi Open, Heiken Ashi Close)
Heiken Ashi Low = Min (Low, Heiken Ashi Open, Heiken Ashi Close)
The "better formula" modifies the standard Heiken Ashi calculation by incorporating additional smoothing, which can help reduce noise and make it easier to identify trends and reversals. The modified formulas for Heiken Ashi "better" candles are as follows:
Better Heiken Ashi Close = (Open + High + Low + Close) / 4
Better Heiken Ashi Open = (Previous Better Heiken Ashi Open + Previous Better Heiken Ashi Close) / 2
Better Heiken Ashi High = Max (High, Better Heiken Ashi Open, Better Heiken Ashi Close)
Better Heiken Ashi Low = Min (Low, Better Heiken Ashi Open, Better Heiken Ashi Close)
Smoothing Factor = 2 / (N + 1), where N is the chosen period for smoothing
Smoothed Better Heiken Ashi Open = (Better Heiken Ashi Open * Smoothing Factor) + (Previous Smoothed Better Heiken Ashi Open * (1 - Smoothing Factor))
Smoothed Better Heiken Ashi Close = (Better Heiken Ashi Close * Smoothing Factor) + (Previous Smoothed Better Heiken Ashi Close * (1 - Smoothing Factor))
The smoothed Better Heiken Ashi Open and Close values are then used to calculate the smoothed Better Heiken Ashi High and Low values, resulting in "better" candles that provide a clearer representation of the market trend and potential reversal points.
It's important to note that, like any other technical analysis tool, Heiken Ashi "better" candles are not foolproof and should be used in conjunction with other indicators and analysis techniques to make well-informed trading decisions.
Heiken Ashi "better" candles, as mentioned previously, provide a clearer representation of market trends and potential reversal points by reducing noise and smoothing out price data. When using these candles in conjunction with other technical analysis tools and indicators, traders can gain valuable insights into market behavior and make more informed decisions.
To effectively use Heiken Ashi "better" candles in your trading strategy, consider the following tips:
Trend Identification: Heiken Ashi "better" candles can help you identify the prevailing trend in the market. When the majority of the candles are green (or another color, depending on your chart settings) and there are no or few lower wicks, it may indicate a strong uptrend. Conversely, when the majority of the candles are red (or another color) and there are no or few upper wicks, it may signal a strong downtrend.
Trend Reversals: Look for potential trend reversals when a change in the color of the candles occurs, especially when accompanied by longer wicks. For example, if a green candle with a long lower wick is followed by a red candle, it could indicate a bearish reversal. Similarly, a red candle with a long upper wick followed by a green candle may suggest a bullish reversal.
Support and Resistance: You can use Heiken Ashi "better" candles to identify potential support and resistance levels. When the candles are consistently moving in one direction and then suddenly change color with longer wicks, it could indicate the presence of a support or resistance level.
Stop-Loss and Take-Profit: Using Heiken Ashi "better" candles can help you manage risk by determining optimal stop-loss and take-profit levels. For instance, you can place your stop-loss below the low of the most recent green candle in an uptrend or above the high of the most recent red candle in a downtrend.
Confirming Signals: Heiken Ashi "better" candles should be used in conjunction with other technical indicators, such as moving averages, oscillators, or chart patterns, to confirm signals and improve the accuracy of your analysis.
In this implementation, you have the choice of AMA, KAMA, or T3 smoothing. These are as follows:
Kaufman Adaptive Moving Average (KAMA)
The Kaufman Adaptive Moving Average (KAMA) is a type of adaptive moving average used in technical analysis to smooth out price fluctuations and identify trends. The KAMA adjusts its smoothing factor based on the market's volatility, making it more responsive in volatile markets and smoother in calm markets. The KAMA is calculated using three different efficiency ratios that determine the appropriate smoothing factor for the current market conditions. These ratios are based on the noise level of the market, the speed at which the market is moving, and the length of the moving average. The KAMA is a popular choice among traders who prefer to use adaptive indicators to identify trends and potential reversals.
Adaptive Moving Average
The Adaptive Moving Average (AMA) is a type of moving average that adjusts its sensitivity to price movements based on market conditions. It uses a ratio between the current price and the highest and lowest prices over a certain lookback period to determine its level of smoothing. The AMA can help reduce lag and increase responsiveness to changes in trend direction, making it useful for traders who want to follow trends while avoiding false signals. The AMA is calculated by multiplying a smoothing constant with the difference between the current price and the previous AMA value, then adding the result to the previous AMA value.
T3
The T3 moving average is a type of technical indicator used in financial analysis to identify trends in price movements. It is similar to the Exponential Moving Average (EMA) and the Double Exponential Moving Average (DEMA), but uses a different smoothing algorithm.
The T3 moving average is calculated using a series of exponential moving averages that are designed to filter out noise and smooth the data. The resulting smoothed data is then weighted with a non-linear function to produce a final output that is more responsive to changes in trend direction.
The T3 moving average can be customized by adjusting the length of the moving average, as well as the weighting function used to smooth the data. It is commonly used in conjunction with other technical indicators as part of a larger trading strategy.
█ Giga Kaleidoscope Modularized Trading System
Core components of an NNFX algorithmic trading strategy
The NNFX algorithm is built on the principles of trend, momentum, and volatility. There are six core components in the NNFX trading algorithm:
1. Volatility - price volatility; e.g., Average True Range, True Range Double, Close-to-Close, etc.
2. Baseline - a moving average to identify price trend
3. Confirmation 1 - a technical indicator used to identify trends
4. Confirmation 2 - a technical indicator used to identify trends
5. Continuation - a technical indicator used to identify trends
6. Volatility/Volume - a technical indicator used to identify volatility/volume breakouts/breakdown
7. Exit - a technical indicator used to determine when a trend is exhausted
What is Volatility in the NNFX trading system?
In the NNFX (No Nonsense Forex) trading system, ATR (Average True Range) is typically used to measure the volatility of an asset. It is used as a part of the system to help determine the appropriate stop loss and take profit levels for a trade. ATR is calculated by taking the average of the true range values over a specified period.
True range is calculated as the maximum of the following values:
-Current high minus the current low
-Absolute value of the current high minus the previous close
-Absolute value of the current low minus the previous close
ATR is a dynamic indicator that changes with changes in volatility. As volatility increases, the value of ATR increases, and as volatility decreases, the value of ATR decreases. By using ATR in NNFX system, traders can adjust their stop loss and take profit levels according to the volatility of the asset being traded. This helps to ensure that the trade is given enough room to move, while also minimizing potential losses.
Other types of volatility include True Range Double (TRD), Close-to-Close, and Garman-Klass
What is a Baseline indicator?
The baseline is essentially a moving average, and is used to determine the overall direction of the market.
The baseline in the NNFX system is used to filter out trades that are not in line with the long-term trend of the market. The baseline is plotted on the chart along with other indicators, such as the Moving Average (MA), the Relative Strength Index (RSI), and the Average True Range (ATR).
Trades are only taken when the price is in the same direction as the baseline. For example, if the baseline is sloping upwards, only long trades are taken, and if the baseline is sloping downwards, only short trades are taken. This approach helps to ensure that trades are in line with the overall trend of the market, and reduces the risk of entering trades that are likely to fail.
By using a baseline in the NNFX system, traders can have a clear reference point for determining the overall trend of the market, and can make more informed trading decisions. The baseline helps to filter out noise and false signals, and ensures that trades are taken in the direction of the long-term trend.
What is a Confirmation indicator?
Confirmation indicators are technical indicators that are used to confirm the signals generated by primary indicators. Primary indicators are the core indicators used in the NNFX system, such as the Average True Range (ATR), the Moving Average (MA), and the Relative Strength Index (RSI).
The purpose of the confirmation indicators is to reduce false signals and improve the accuracy of the trading system. They are designed to confirm the signals generated by the primary indicators by providing additional information about the strength and direction of the trend.
Some examples of confirmation indicators that may be used in the NNFX system include the Bollinger Bands, the MACD (Moving Average Convergence Divergence), and the MACD Oscillator. These indicators can provide information about the volatility, momentum, and trend strength of the market, and can be used to confirm the signals generated by the primary indicators.
In the NNFX system, confirmation indicators are used in combination with primary indicators and other filters to create a trading system that is robust and reliable. By using multiple indicators to confirm trading signals, the system aims to reduce the risk of false signals and improve the overall profitability of the trades.
What is a Continuation indicator?
In the NNFX (No Nonsense Forex) trading system, a continuation indicator is a technical indicator that is used to confirm a current trend and predict that the trend is likely to continue in the same direction. A continuation indicator is typically used in conjunction with other indicators in the system, such as a baseline indicator, to provide a comprehensive trading strategy.
What is a Volatility/Volume indicator?
Volume indicators, such as the On Balance Volume (OBV), the Chaikin Money Flow (CMF), or the Volume Price Trend (VPT), are used to measure the amount of buying and selling activity in a market. They are based on the trading volume of the market, and can provide information about the strength of the trend. In the NNFX system, volume indicators are used to confirm trading signals generated by the Moving Average and the Relative Strength Index. Volatility indicators include Average Direction Index, Waddah Attar, and Volatility Ratio. In the NNFX trading system, volatility is a proxy for volume and vice versa.
By using volume indicators as confirmation tools, the NNFX trading system aims to reduce the risk of false signals and improve the overall profitability of trades. These indicators can provide additional information about the market that is not captured by the primary indicators, and can help traders to make more informed trading decisions. In addition, volume indicators can be used to identify potential changes in market trends and to confirm the strength of price movements.
What is an Exit indicator?
The exit indicator is used in conjunction with other indicators in the system, such as the Moving Average (MA), the Relative Strength Index (RSI), and the Average True Range (ATR), to provide a comprehensive trading strategy.
The exit indicator in the NNFX system can be any technical indicator that is deemed effective at identifying optimal exit points. Examples of exit indicators that are commonly used include the Parabolic SAR, the Average Directional Index (ADX), and the Chandelier Exit.
The purpose of the exit indicator is to identify when a trend is likely to reverse or when the market conditions have changed, signaling the need to exit a trade. By using an exit indicator, traders can manage their risk and prevent significant losses.
In the NNFX system, the exit indicator is used in conjunction with a stop loss and a take profit order to maximize profits and minimize losses. The stop loss order is used to limit the amount of loss that can be incurred if the trade goes against the trader, while the take profit order is used to lock in profits when the trade is moving in the trader's favor.
Overall, the use of an exit indicator in the NNFX trading system is an important component of a comprehensive trading strategy. It allows traders to manage their risk effectively and improve the profitability of their trades by exiting at the right time.
How does Loxx's GKD (Giga Kaleidoscope Modularized Trading System) implement the NNFX algorithm outlined above?
Loxx's GKD v1.0 system has five types of modules (indicators/strategies). These modules are:
1. GKD-BT - Backtesting module (Volatility, Number 1 in the NNFX algorithm)
2. GKD-B - Baseline module (Baseline and Volatility/Volume, Numbers 1 and 2 in the NNFX algorithm)
3. GKD-C - Confirmation 1/2 and Continuation module (Confirmation 1/2 and Continuation, Numbers 3, 4, and 5 in the NNFX algorithm)
4. GKD-V - Volatility/Volume module (Confirmation 1/2, Number 6 in the NNFX algorithm)
5. GKD-E - Exit module (Exit, Number 7 in the NNFX algorithm)
(additional module types will added in future releases)
Each module interacts with every module by passing data between modules. Data is passed between each module as described below:
GKD-B => GKD-V => GKD-C(1) => GKD-C(2) => GKD-C(Continuation) => GKD-E => GKD-BT
That is, the Baseline indicator passes its data to Volatility/Volume. The Volatility/Volume indicator passes its values to the Confirmation 1 indicator. The Confirmation 1 indicator passes its values to the Confirmation 2 indicator. The Confirmation 2 indicator passes its values to the Continuation indicator. The Continuation indicator passes its values to the Exit indicator, and finally, the Exit indicator passes its values to the Backtest strategy.
This chaining of indicators requires that each module conform to Loxx's GKD protocol, therefore allowing for the testing of every possible combination of technical indicators that make up the six components of the NNFX algorithm.
What does the application of the GKD trading system look like?
Example trading system:
Backtest: Strategy with 1-3 take profits, trailing stop loss, multiple types of PnL volatility, and 2 backtesting styles
Baseline: Hull Moving Average
Volatility/Volume: Hurst Exponent
Confirmation 1: RSI DEMA as shown on the chart above
Confirmation 2: Williams Percent Range
Continuation: Fisher Transform
Exit: Rex Oscillator
Each GKD indicator is denoted with a module identifier of either: GKD-BT, GKD-B, GKD-C, GKD-V, or GKD-E. This allows traders to understand to which module each indicator belongs and where each indicator fits into the GKD protocol chain.
Giga Kaleidoscope Modularized Trading System Signals (based on the NNFX algorithm)
Standard Entry
1. GKD-C Confirmation 1 Signal
2. GKD-B Baseline agrees
3. Price is within a range of 0.2x Volatility and 1.0x Volatility of the Goldie Locks Mean
4. GKD-C Confirmation 2 agrees
5. GKD-V Volatility/Volume agrees
Baseline Entry
1. GKD-B Baseline signal
2. GKD-C Confirmation 1 agrees
3. Price is within a range of 0.2x Volatility and 1.0x Volatility of the Goldie Locks Mean
4. GKD-C Confirmation 2 agrees
5. GKD-V Volatility/Volume agrees
6. GKD-C Confirmation 1 signal was less than 7 candles prior
Volatility/Volume Entry
1. GKD-V Volatility/Volume signal
2. GKD-C Confirmation 1 agrees
3. Price is within a range of 0.2x Volatility and 1.0x Volatility of the Goldie Locks Mean
4. GKD-C Confirmation 2 agrees
5. GKD-B Baseline agrees
6. GKD-C Confirmation 1 signal was less than 7 candles prior
Continuation Entry
1. Standard Entry, Baseline Entry, or Pullback; entry triggered previously
2. GKD-B Baseline hasn't crossed since entry signal trigger
3. GKD-C Confirmation Continuation Indicator signals
4. GKD-C Confirmation 1 agrees
5. GKD-B Baseline agrees
6. GKD-C Confirmation 2 agrees
1-Candle Rule Standard Entry
1. GKD-C Confirmation 1 signal
2. GKD-B Baseline agrees
3. Price is within a range of 0.2x Volatility and 1.0x Volatility of the Goldie Locks Mean
Next Candle:
1. Price retraced (Long: close < close or Short: close > close )
2. GKD-B Baseline agrees
3. GKD-C Confirmation 1 agrees
4. GKD-C Confirmation 2 agrees
5. GKD-V Volatility/Volume agrees
1-Candle Rule Baseline Entry
1. GKD-B Baseline signal
2. GKD-C Confirmation 1 agrees
3. Price is within a range of 0.2x Volatility and 1.0x Volatility of the Goldie Locks Mean
4. GKD-C Confirmation 1 signal was less than 7 candles prior
Next Candle:
1. Price retraced (Long: close < close or Short: close > close )
2. GKD-B Baseline agrees
3. GKD-C Confirmation 1 agrees
4. GKD-C Confirmation 2 agrees
5. GKD-V Volatility/Volume Agrees
1-Candle Rule Volatility/Volume Entry
1. GKD-V Volatility/Volume signal
2. GKD-C Confirmation 1 agrees
3. Price is within a range of 0.2x Volatility and 1.0x Volatility of the Goldie Locks Mean
4. GKD-C Confirmation 1 signal was less than 7 candles prior
Next Candle:
1. Price retraced (Long: close < close or Short: close > close)
2. GKD-B Volatility/Volume agrees
3. GKD-C Confirmation 1 agrees
4. GKD-C Confirmation 2 agrees
5. GKD-B Baseline agrees
PullBack Entry
1. GKD-B Baseline signal
2. GKD-C Confirmation 1 agrees
3. Price is beyond 1.0x Volatility of Baseline
Next Candle:
1. Price is within a range of 0.2x Volatility and 1.0x Volatility of the Goldie Locks Mean
2. GKD-C Confirmation 1 agrees
3. GKD-C Confirmation 2 agrees
4. GKD-V Volatility/Volume Agrees
]█ Setting up the GKD
The GKD system involves chaining indicators together. These are the steps to set this up.
Use a GKD-C indicator alone on a chart
1. Inside the GKD-C indicator, change the "Confirmation Type" setting to "Solo Confirmation Simple"
Use a GKD-V indicator alone on a chart
**nothing, it's already useable on the chart without any settings changes
Use a GKD-B indicator alone on a chart
**nothing, it's already useable on the chart without any settings changes
Baseline (Baseline, Backtest)
1. Import the GKD-B Baseline into the GKD-BT Backtest: "Input into Volatility/Volume or Backtest (Baseline testing)"
2. Inside the GKD-BT Backtest, change the setting "Backtest Special" to "Baseline"
Volatility/Volume (Volatility/Volume, Backte st)
1. Inside the GKD-V indicator, change the "Testing Type" setting to "Solo"
2. Inside the GKD-V indicator, change the "Signal Type" setting to "Crossing" (neither traditional nor both can be backtested)
3. Import the GKD-V indicator into the GKD-BT Backtest: "Input into C1 or Backtest"
4. Inside the GKD-BT Backtest, change the setting "Backtest Special" to "Volatility/Volume"
5. Inside the GKD-BT Backtest, a) change the setting "Backtest Type" to "Trading" if using a directional GKD-V indicator; or, b) change the setting "Backtest Type" to "Full" if using a directional or non-directional GKD-V indicator (non-directional GKD-V can only test Longs and Shorts separately)
6. If "Backtest Type" is set to "Full": Inside the GKD-BT Backtest, change the setting "Backtest Side" to "Long" or "Short
7. If "Backtest Type" is set to "Full": To allow the system to open multiple orders at one time so you test all Longs or Shorts, open the GKD-BT Backtest, click the tab "Properties" and then insert a value of something like 10 orders into the "Pyramiding" settings. This will allow 10 orders to be opened at one time which should be enough to catch all possible Longs or Shorts.
Solo Confirmation Simple (Confirmation, Backtest)
1. Inside the GKD-C indicator, change the "Confirmation Type" setting to "Solo Confirmation Simple"
1. Import the GKD-C indicator into the GKD-BT Backtest: "Input into Backtest"
2. Inside the GKD-BT Backtest, change the setting "Backtest Special" to "Solo Confirmation Simple"
Solo Confirmation Complex without Exits (Baseline, Volatility/Volume, Confirmation, Backtest)
1. Inside the GKD-V indicator, change the "Testing Type" setting to "Chained"
2. Import the GKD-B Baseline into the GKD-V indicator: "Input into Volatility/Volume or Backtest (Baseline testing)"
3. Inside the GKD-C indicator, change the "Confirmation Type" setting to "Solo Confirmation Complex"
4. Import the GKD-V indicator into the GKD-C indicator: "Input into C1 or Backtest"
5. Inside the GKD-BT Backtest, change the setting "Backtest Special" to "GKD Full wo/ Exits"
6. Import the GKD-C into the GKD-BT Backtest: "Input into Exit or Backtest"
Solo Confirmation Complex with Exits (Baseline, Volatility/Volume, Confirmation, Exit, Backtest)
1. Inside the GKD-V indicator, change the "Testing Type" setting to "Chained"
2. Import the GKD-B Baseline into the GKD-V indicator: "Input into Volatility/Volume or Backtest (Baseline testing)"
3. Inside the GKD-C indicator, change the "Confirmation Type" setting to "Solo Confirmation Complex"
4. Import the GKD-V indicator into the GKD-C indicator: "Input into C1 or Backtest"
5. Import the GKD-C indicator into the GKD-E indicator: "Input into Exit"
6. Inside the GKD-BT Backtest, change the setting "Backtest Special" to "GKD Full w/ Exits"
7. Import the GKD-E into the GKD-BT Backtest: "Input into Backtest"
Full GKD without Exits (Baseline, Volatility/Volume, Confirmation 1, Confirmation 2, Continuation, Backtest)
1. Inside the GKD-V indicator, change the "Testing Type" setting to "Chained"
2. Import the GKD-B Baseline into the GKD-V indicator: "Input into Volatility/Volume or Backtest (Baseline testing)"
3. Inside the GKD-C 1 indicator, change the "Confirmation Type" setting to "Confirmation 1"
4. Import the GKD-V indicator into the GKD-C 1 indicator: "Input into C1 or Backtest"
5. Inside the GKD-C 2 indicator, change the "Confirmation Type" setting to "Confirmation 2"
6. Import the GKD-C 1 indicator into the GKD-C 2 indicator: "Input into C2"
7. Inside the GKD-C Continuation indicator, change the "Confirmation Type" setting to "Continuation"
8. Inside the GKD-BT Backtest, change the setting "Backtest Special" to "GKD Full wo/ Exits"
9. Import the GKD-E into the GKD-BT Backtest: "Input into Exit or Backtest"
Full GKD with Exits (Baseline, Volatility/Volume, Confirmation 1, Confirmation 2, Continuation, Exit, Backtest)
1. Inside the GKD-V indicator, change the "Testing Type" setting to "Chained"
2. Import the GKD-B Baseline into the GKD-V indicator: "Input into Volatility/Volume or Backtest (Baseline testing)"
3. Inside the GKD-C 1 indicator, change the "Confirmation Type" setting to "Confirmation 1"
4. Import the GKD-V indicator into the GKD-C 1 indicator: "Input into C1 or Backtest"
5. Inside the GKD-C 2 indicator, change the "Confirmation Type" setting to "Confirmation 2"
6. Import the GKD-C 1 indicator into the GKD-C 2 indicator: "Input into C2"
7. Inside the GKD-C Continuation indicator, change the "Confirmation Type" setting to "Continuation"
8. Import the GKD-C Continuation indicator into the GKD-E indicator: "Input into Exit"
9. Inside the GKD-BT Backtest, change the setting "Backtest Special" to "GKD Full w/ Exits"
10. Import the GKD-E into the GKD-BT Backtest: "Input into Backtest"
Baseline + Volatility/Volume (Baseline, Volatility/Volume, Backtest)
1. Inside the GKD-V indicator, change the "Testing Type" setting to "Baseline + Volatility/Volume"
2. Inside the GKD-V indicator, make sure the "Signal Type" setting is set to "Traditional"
3. Import the GKD-B Baseline into the GKD-V indicator: "Input into Volatility/Volume or Backtest (Baseline testing)"
4. Inside the GKD-BT Backtest, change the setting "Backtest Special" to "Baseline + Volatility/Volume"
5. Import the GKD-V into the GKD-BT Backtest: "Input into C1 or Backtest"
6. Inside the GKD-BT Backtest, change the setting "Backtest Type" to "Full". For this backtest, you must test Longs and Shorts separately
7. To allow the system to open multiple orders at one time so you can test all Longs or Shorts, open the GKD-BT Backtest, click the tab "Properties" and then insert a value of something like 10 orders into the "Pyramiding" settings. This will allow 10 orders to be opened at one time which should be enough to catch all possible Longs or Shorts.
Requirements
Inputs
Confirmation 1: GKD-V Volatility / Volume indicator
Confirmation 2: GKD-C Confirmation indicator
Continuation: GKD-C Confirmation indicator
Solo Confirmation Simple: GKD-B Baseline
Solo Confirmation Complex: GKD-V Volatility / Volume indicator
Solo Confirmation Super Complex: GKD-V Volatility / Volume indicator
Stacked 1: None
Stacked 2+: GKD-C, GKD-V, or GKD-B Stacked 1
Outputs
Confirmation 1: GKD-C Confirmation 2 indicator
Confirmation 2: GKD-C Continuation indicator
Continuation: GKD-E Exit indicator
Solo Confirmation Simple: GKD-BT Backtest
Solo Confirmation Complex: GKD-BT Backtest or GKD-E Exit indicator
Solo Confirmation Super Complex: GKD-C Continuation indicator
Stacked 1: GKD-C, GKD-V, or GKD-B Stacked 2+
Stacked 2+: GKD-C, GKD-V, or GKD-B Stacked 2+ or GKD-BT Backtest
Additional features will be added in future releases.

NSDT Lattice WebThis script creates a "web" by connecting different points of candles. All configurable by the trader.
There are 4 basic parts to a candle:
Open, High, Low, and Close
With this script, you can connect any point of one candle in the past to any point of another current candle.
For example:
High to High, High to Low, High to Open, High to close
Low to High, Low to Low, Low to Open, Low to Close
Open to High, Open to Low, Open to Open, Open to Close
Close to High, Close to Low, Close to Open, Close to Close
The script will change the line colors based on whether the current plot is higher or lower than the previous plot.
Try out different connection points to see what works for you. Connecting High to High and Low to Low, might easily show you when the market is making higher highs or lower lows, indicating a potential movement.
Run it on replay at a higher speed and see how it may potentially help identify area of congestion or trends.

Bar metrics / quantifytools— Overview
Rather than eyeball evaluating bullishness/bearishness in any given bar, bar metrics allow a quantified approach using three basic fundamental data points: relative close, relative volatility and relative volume. These data points are visualized in a discreet data dashboard form, next to all real-time bars. Each value also has a dot in front, representing color coded extremes in the values.
Relative close represents position of bar's close relative to high and low, high of bar being 100% and low of bar being 0%. Relative close indicates strength of bulls/bears in a given bar, the higher the better for bulls, the lower the better for bears. Relative volatility (bar range, high - low) and relative volume are presented in a form of a multiplier, relative to their respective moving averages (SMA 20). A value of 1x indicates volume/volatility being on par with moving average, 2x indicates volume/volatility being twice as much as moving average and so on. Relative volume and volatility can be used for measuring general market participant interest, the "weight of the bar" as it were.
— Features
Users can gauge past bar metrics using lookback via input menu. Past bars, especially recent ones, are helpful for giving context for current bar metrics. Lookback bars are highlighted on the chart using a yellow box and metrics presented on the data dashboard with lookback symbols:
To inspect bar metric data and its implications, users can highlight bars with specified bracket values for each metric:
When bar highlighter is toggled on and desired bar metric values set, alert for the specified combination can be toggled on via alert menu. Note that bar highlighter must be enabled in order for alerts to function.
— Visuals
Bar metric dots are gradient colored the following way:
Relative volatility & volume
0x -> 1x / Neutral (white) -> Light (yellow)
1x -> 1.7x / Light (yellow) -> Medium (orange)
1.7x -> 2.4x / Medium (orange) -> Heavy (red)
Relative close
0% -> 25% / Heavy bearish (red) -> Light bearish (dark red)
25% -> 45% / Light bearish (dark red) -> Neutral (white)
45% - 55% / Neutral (white)
55% -> 75% / Neutral (white) -> Light bullish (dark green)
75% -> 100% / Light bullish (dark green) -> Heavy bullish (green)
All colors can be adjusted via input menu. Label size, label distance from bar (offset) and text format (regular/stealth) can be adjusted via input menu as well:
— Practical guide
As interpretation of bar metrics is highly contextual, it is especially important to use other means in conjunction with the metrics. Levels, oscillators, moving averages, whatever you have found useful for your process. In short, relative close indicates directional bias and relative volume/volatility indicates "weight" of directional bias.
General interpretation
High relative close, low relative volume/volatility = mildly bullish, bias up/consolidation
High relative close, medium relative volume/volatility = bullish, bias up
High relative close, high relative volume/volatility = exuberantly bullish, bias up/down depending on context
Medium relative close, low relative volume/volatility = noise, no bias
Medium relative close, medium to high relative volume/volatility = indecision, further evidence needed to evaluate bias
Low relative close, low relative volume/volatility = mildly bearish, bias down/consolidation
Low relative close, medium relative volume/volatility = bearish, bias down
Low relative close, high relative volume/volatility = exuberantly bearish, bias down/up depending on context
Nuances & considerations
As to relative close, it's important to note that each bar is a trading range when viewed on a lower timeframe, ES 1W vs. ES 4H:
When relative close is high, bulls were able to push price to range high by the time of close. When relative close is low, bears were able to push price to range low by the time of close. In other words, bulls/bears were able to gain the upper hand over a given trading range, hinting strength for the side that made the final push. When relative close is around middle range (40-60%), it can be said neither side is clearly dominating the range, hinting neutral/indecision bias from a relative close perspective.
As to relative volume/volatility, low values (less than ~0.7x) imply bar has low market participant interest and therefore is likely insignificant, as it is "lacking weight". Values close to or above 1x imply meaningful market participant interest, whereas values well above 1x (greater than ~1.3x) imply exuberance. This exuberance can manifest as initiation (beginning of a trend) or as exhaustion (end of a trend):
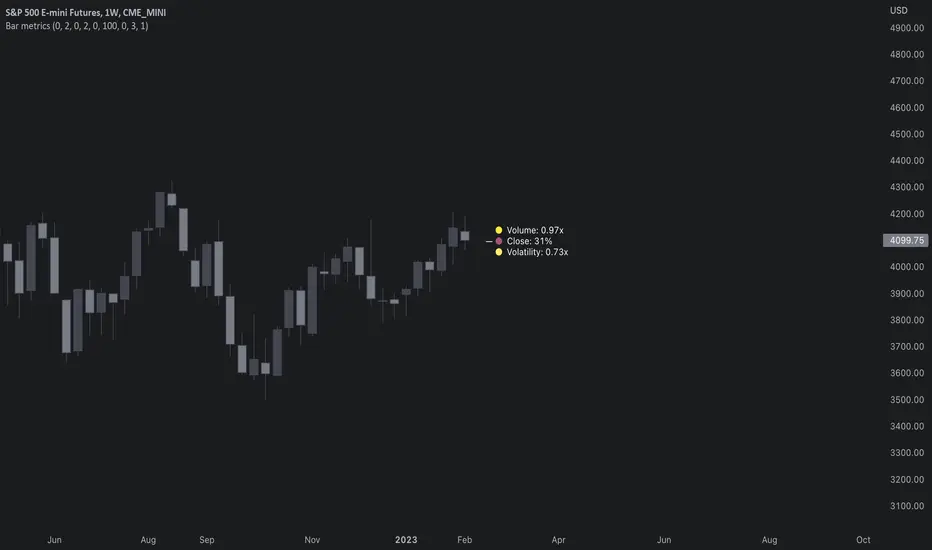
Vision Essentials - RSIVision Essentials - RSI is the first indicator from our essentials pack we have planned. It's our twist on the highly popular RSI (Relative Strength Index) Oscillator.
What makes this indicator different?
Based on community feedback we provided users with a visual + adjustable oversold and overbought range to avoid having to redraw boxes during session. Adjusting the settings will update the box positioning on the chart to match.
We utilize custom inputs to allow users to select HA based open, high, low, and close as well as the usual open, high, low, close, hl2, hlc3, and ohlc4 inputs (more coming soon)
The indicator will track the values of the recent high & low points of the RSI based on the distance setting. These values are displayed as text floating at the end of the pane, as well as plotted lines for a visual of the past and current high/low points
The user has complete customization of the color schemes used by: The oversold box, the overbought box, the RSI lower color, the RSI higher color, the recent low color, the recent high color, and the text color. The user can also control the distance that is utilized for finding the recent High & Low points.
How do I use this indicator?
To start using this indicator simply apply it to your chart. We use pre-defined values matching the most common RSI configuration however, you're encouraged to view the settings to fully understand how to adjust the various settings as well as learn how the indicator changes under each individual setting.
RSI Source - This is the input source the RSI calculation is based on. Close is the most common, and default which utilizes the closing price of candles
RSI Length - This setting provides the indicator the length (distance) you want the RSI outlook to be based on. The most common is a 14-day timeframe, but keep in mind that the value of 14 on a 15min chart isn't the same as the value of 14 on a 1day chart. The simple way to view this setting is to consider how many candles back you want the calculation to be based on
RSI Oversold - This setting is considered the "low" level of the RSI. 30 is the most common setting. The lower the RSI, the more momentum that is considered to be in place
RSI Overbought - This setting is considered the "high" level of the RSI. 70 is the most common setting. The higher the RSI, the more momentum that is considered to be in place
High/Low Distance - This setting defines the number of candles back that the indicator will look to determine the recent high/low values
Visual Style - Gradient provides you with a gradient fill between 2 RSI lines. The first is the root RSI based on your RSI settings, and the second is a doubled value which creates the fill gap. Gradient + Highlight is the same as Gradient, but enables coloring on the root RSI edge of the gradient. Highlight Only provides you with a single line based on your RSI settings
Highlight Color - This setting controls the color of your root RSI plot when using one of the highlight based Visual Styles
RSI Lower - This setting controls the color used by the indicator when the RSI value is on the lower end of the spectrum
RSI Higher - This setting controls the color used by the indicator when the RSI value is on the higher end of the spectrum
Recent Low Color - This setting controls the color used by the indicator for plotting the recent low line
Recent High Color - This setting controls the color used by the indicator for plotting the recent high line
Text Color - This setting controls the text color used for the recent high low values at the end of the pane

coates moving averages (cma)This indicator uses three moving averages:
2 period low simple ma
2 period high simple ma
9 period least squares ma
The trend is determined by the angle of the moving averages, current close relative the the 9 least squares ma (lsm) and the current close relative to the prior two periods high and low.
When there are consecutive closes inside the prior two candles high and low then a range is signaled:
In ranges the buy zone is between the lowest low and the lowest close of the current range. The sell zone is between the highest high and the highest close. The zones are adjusted as long as the new close is within the prior two candles range:
When price closes above the 2 high ma and the 9 lsm then a bull trend is signaled if all moving averages are angled upward (as seen at #4 in the chart above and #1 the chart below ). If the 9 lsm and / or the 2 low ma continue to angle downward, following a close above the 2 high ma and 9 lsm, then a prolonged range or reversal is expected (#2 in the chart below):
During a bull trend the buy zone is between the 2 low ma and the 9 lsm. The profit target is the 2 high ma:
During dip buying opportunities price should resist closing below the 9 lsm. If there is one close below the 9 lsm then it is a canary in the coalmine that tells us to proceed with caution. This will often signal a range, based on the conditions outlined above. To avoid a prolonged range, or reversal, price needs to immediately react in the direction of the prevailing trend:
If the moving averages are angled down and the most recent close is below the 2 low ma and 9 lsm then trend is fully bearish:
During a bear trend the short zone is between the 2 high ma and 9 lsm. The profit target is the 2 low ma:
When the 2 high ma angles down and the 2 low ma angles up while price closes inside both mas then it indicates a cma squeeze:
Volatility is expected in the direction of the breakout following the squeeze. In this situation traps / shakeouts are common. If there is a wick outside the cma, with a close inside, then it indicates a trap / shakeout. If there is a close outside the 2 high / low ma then it signals a breakout.
A trend is considered balanced when the 9 lsm is roughly equidistant from the 2 low and 2 high mas. If the 9 lsm crosses the 2 high or 2 low ma then it signals exhaustion / imbalance.
For a stop loss I use the prior three periods low, for bull trends, and the prior three periods high for bear trends. I would expect other reliable stops, such as the parabolic sar or bill williams fractal, to be effective as well. The default moving averages should be very effective on all timeframes and assets classes, however this indicator was developed for bitcoin with a focus on higher timeframes such as the 4h, daily and weekly.
As with any other technical indicator there will be bad signals. Proceed with caution and never risk more than you are willing to lose.

MAPS - HiLo DivergenceThe High/Low indicator utilizes the measuring of local highs and lows as well as local peaks and troughs to identify possible divergence in the price action.
Purple oscillator = Higher Timeframe's price measurement
Purple high triangle = A local high on the higher timeframe has been made
Purple low triangle = A local low on the higher timeframe has been made
Red high triangle on the purple oscillator = A local high on the higher timeframe has been made and is deemed a bearish divergent high
Green low triangle on the purple oscillator = A local low on the higher timeframe has been made and is deemed a bullish divergent low
Orange oscillator = Current Timeframe's price measurement
Orange high triangle = A local high on the current timeframe has been made
Orange low triangle = A local low on the current timeframe has been made
Red high triangle on the orange oscillator = A local high on the current timeframe has been made and is deemed a bearish divergent high
Green low triangle on the orange oscillator = A local low on the current timeframe has been made and is deemed a bullish divergent low
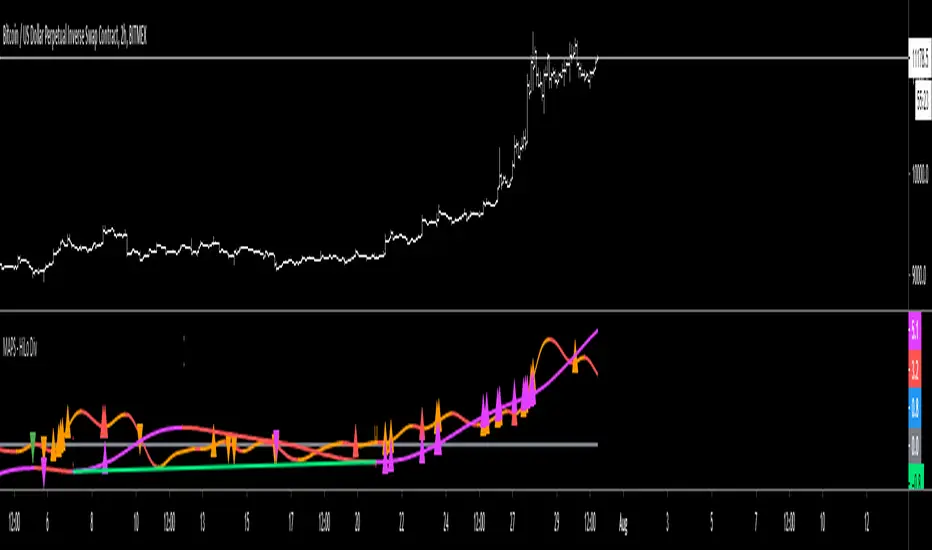
20 Pips & Dip™ Indicator20 Pips & Dipp script based on a few different indicators which together provides powerful help for all level of traders, especially beginners. Also, script have toggles to switch on/off: Renko Reversal, EMA, HHLL, Support/Resistance, Daily Open modules.
1st Module – Renko Reversal Alerts Indicator. The Indicator point out a spot where the revers are happens. Any changes in Price that do not reach a minimum amount are usually filtered. This helps to keep attention on larger, significant moves, and helps not to avoid the minute fluctuations in the market.
How it’s works?
- ENTER a trade JUST AFTER 1 Renko brick is printed. BUY triangle (green buy text with green triangle) is generated if a bearish Renko Brick is followed by a bullish brick. In other words, a buy signal happens when a white block is drawn after a black one. The buy happens then at the closing price that may be higher than the top of the last brick. It can go two bricks up minus a tick or pip.
- EXIT that trade, and open a new reverse position, just after 1 Renko brick is printed in the opposite direction. SELL triangle (red sell text with red triangle) is generated if a bullish brick is followed by a bearish brick. In other words, a sell signal happens when a black block is drawn, after a white block. The same situation as with a buy signal happens on sell signals. There is an uncertainty on the close price that may go as far as one tick above the next potential bearish block.
How to create custom ALERTS? Right click on a sell or buy triangle > Add Alert > 20 Pips & Dipp > Choose between Long or Short opportunity. In options field choose ONCE PER BAR. All other options you can choose according to your personal needs. If you want alert for another option (i.e. Short opportunity) just add one more.
Just to know! To understand how those module work better to switch to Renko chart. But Renko Chart with Renko brick size & Timeframe less than 1 day available only for PRO+ accounts and better. Also, we need to say that TradingView platform do not provide TICK data as we know. So, it may confuse you. Be careful!
2nd Module – Moving Average Exponential. The exponential moving average (EMA) is a weighted moving average (WMA) that gives more weighting, or importance, to recent price data than the simple moving average (SMA) does. The EMA responds more quickly to recent price changes than the SMA. The formula for calculating the EMA just involves using a multiplier and starting with the SMA. Like all moving averages, this technical indicator is used to produce buy and sell signals based on crossovers and divergences from the historical average. By default, our EMA have 50 period. The 50 moving average is the standard swing-trading moving average and very popular. Most traders use it to ride trends because it’s the ideal compromise between too short and too long term. Some people call it medium-term.
How to use it? EMAs are commonly used in conjunction with other indicators to confirm significant market moves and to gauge their validity. For traders who trade intraday and fast-moving markets, the EMA is more applicable. Quite often, traders use EMAs to determine a trading bias. For example, if an EMA on a daily chart shows a strong upward trend, an intraday trader’s strategy may be to trade only from the long side on an intraday chart.
Limitations of EMA! An EMA relies wholly on historical data. Many people believe that markets are efficient - that is, that current market prices already reflect all available information. If markets are indeed efficient, using historical data should tell us nothing about the future direction of asset prices.
3rd Module - Pivot Points (High/Low). Also known as Bar Count Reversals, are used to anticipate potential price reversals. Pivot Point Highs are determined by the number of bars with lower highs on either side of a Pivot Point High. Pivot Point Lows are determined by the number of bars with higher lows on either side of a Pivot Point Low. Default period is 10.
How this indicator works? The longer the trend (the higher the period selected) before and after the Pivot Point, the more significant the Pivot Point. Pivot Points can be used to help determine where to draw trendlines in order to visualize price patterns.
Calculation! Pivot Point Highs are determined by the number of bars with lower highs on either side of a Pivot Point High. Pivot Point Lows are determined by the number of bars with higher lows on either side of a Pivot Point Low.
4th Module - Higher High Lower Low indicator. Higher high and higher lows and Lower lows and lower highs are trends in a chart. Stocks in general never go up or down in linear fashion, every rise is followed by correction and then again it may either go up or down, same is true for downtrend every fall is followed by a correction in the upward direction and then new downtrend or uptrend is followed. After every rise, the stock took breather corrected to some extent and then new uptrend began, when you see the correction every low is higher than the previous lows and every next peak is higher than it’s previous peak. This is higher highs and higher lows trend.
How it’s work? This script finds pivot highs and pivot lows then calculates Higher Highs, Higher Lows & Lower Lows, Lower Highs. And it calculates support/resistance by using HH-HL-LL-LH points. Generally, HH and HL shows up-trend, LL and LH shows down-trend. If price breaks resistance levels it means the trend is up or if price breaks support level it means the trend is down, so the script can change bar colour blue or black by default. if there is up-trend then bar colour is blue, or if down-trend then bar colour is black. Support and resistance levels change dynamically.
Trick! If you use smaller numbers for Left Hand/Right Hand sides then it will be more sensitive!
5th Module - Daily Open Price. The opening price is the price at which a security first trades upon the opening of an exchange on a trading day; for example, the New York Stock Exchange (NYSE) opens at precisely 9:30 a.m. Eastern time. The price of the first trade for any listed stock is its daily opening price. The opening price is an important marker for that day's trading activity, particularly for those interested in measuring short-term results such as day traders.
Important! If daily open price was higher than current price, crosses will be red. And if daily open price lower than current price crosses will be green. Colours change dynamically.
You need to know it! An opening price is not identical to the previous day's closing price. There are several day-trading strategies based on the opening price of a market or security. Research “Gap Fade and Fill” or “Fade”.
Author – Christian Kopachelli . Huge thanks and credits to peoples which ideas, formulas, calculations, code snippets and code parts were used: Robert Nance, CryptoJoncis , FritzHaber , vacalo69 , Molle de Jong, Baris Yakut, LonesomeTheBlue , ChrisMoody , Robert N. ~~~ THANK you all! You are awesome!
DISCLAIMER! RISK WARNING!
PAST PERFORMANCE IS NOT NECESSARILY INDICATIVE OF FUTURE RESULTS. TRADERS SHOULD NOT BASE THEIR DECISION ON INVESTING IN ANY TRADING PROGRAM SOLELY ON THE PAST PERFORMANCE PRESENTED, ADDITIONALLY, IN MAKING AN INVESTMENT DECISION, TRADERS MUST ALSO RELY ON THEIR OWN EXAMINATION OF THE PERSON // OR ENTITY MAKING THE TRADING DECISIONS.
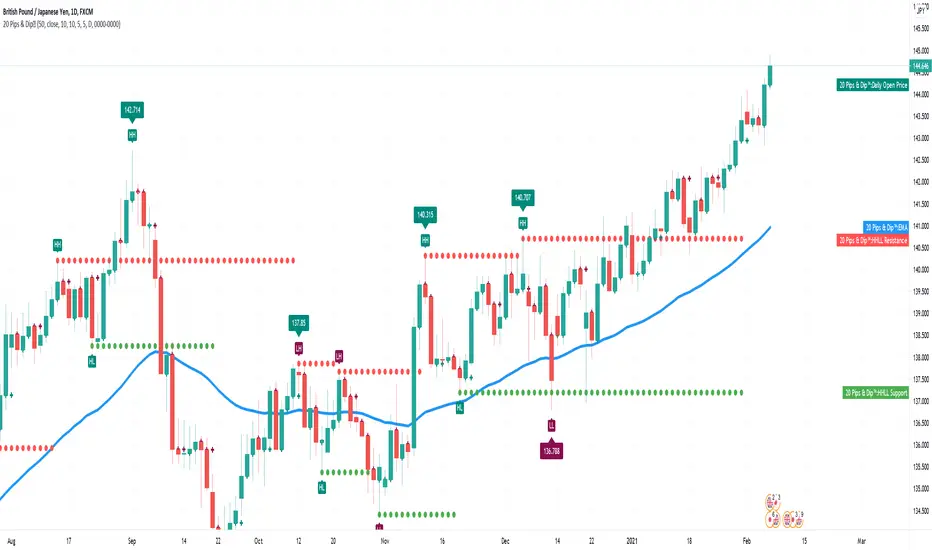
Killzones & DoL's by @mohtradesThe KillZones & DoLs indicator is a comprehensive tool designed for ICT and institutional traders. It provides a clean, customizable way to visualize key time-based levels, killzone sessions, and daily/weekly/monthly statistics directly on your chart.
Key Features
1. Killzones & Sessions
Visualize the three major trading sessions with customizable boxes and time ranges:
Asia Range: Default 20:00 - 00:00 (NY Time)
London Killzone: Default 02:00 - 05:00 (NY Time)
New York Killzone: Default 09:30 - 16:00 (NY Time)
Killzone Tools:
Boxes: Draw highlighted boxes for each session.
Pivots: Automatically mark the High and Low of each session.
Midpoints: Optionally show the 50% equilibrium level of the session range.
Extensions: Extend pivot lines until they are mitigated (price touches them) or keep them for a set duration.
Alerts: Get notified when a session High or Low is broken.
2. Highs & Lows (HTF Levels)
Track significant liquidity levels from higher timeframes without switching charts:
Previous Day High/Low (PDH/PDL)
Previous Week High/Low (PWH/PWL)
Previous Month High/Low (PMH/PML)
Current High/Low of Day (HOD/LOD): Tracks the developing high and low of the current day.
Current High/Low of Week (HOW/LOW): Tracks the developing high and low of the current week.
3. Opening Price Lines
Mark key opening prices to use as support/resistance or bias confirmation:
True Day Open (00:00 NY)
Week Open
Month Open
Custom Open Lines: Configure up to 8 custom time-based open price lines (e.g., 06:00, 10:00, 14:00).
4. Separators & Statistics
Period Separators: Vertical lines marking the start of new Days, Weeks, or Months.
Range Table: Display the range (in pips/points) of recent sessions and their average to gauge volatility.
Customization
Timezone: Fully adjustable to your preferred timezone (default America/New_York).
Styling: Customize colors, line styles, widths, and label sizes for all elements.
Drawing Limits: Optimize chart cleanliness by limiting historical drawings to the last N days.
How to Use
Add the indicator to your chart.
Open Settings to enable/disable specific Killzones (Asia, London, NY).
Enable "Show PDH/PDL" or "Show HOW/LOW" to track liquidity.
Set your convenient timezone (typically NY for ICT concepts).
Use alerts to catch liquidity runs on session pivots.

SMT Divergence [Kodexius]SMT Divergence is a correlation-based divergence detector built around the Smart Money Technique concept: when two normally correlated instruments should be making similar swing progress, but one prints a new extreme while the other fails to confirm it. This “disagreement” can be a valuable contextual signal around liquidity runs, distribution phases, and potential reversal or continuation points.
The script compares the chart symbol (primary) with a user-selected comparison symbol (for example BTC vs ETH, ES vs NQ, EUR/USD vs GBP/USD) and automatically scans both instruments for confirmed swing highs and swing lows using pivot logic. Once swings are established, it checks for classic SMT conditions:
Primary makes a new swing extreme while the comparison symbol forms a non-confirming swing .
To support a wider range of markets, the indicator includes an Inverse Correlation option for pairs that typically move opposite to each other (for example DXY vs EUR/USD). With this enabled, the divergence rules are logically flipped so that the script still detects “non-confirmation” in a way that is consistent with the pair’s relationship.
The indicator is designed to be readable and actionable. It can draw divergence labels directly on the main chart, connect the relevant swing points with lines, show a compact information table with the last signal and settings, and optionally render the comparison symbol as a mini candle chart in the indicator pane for quick visual validation.
🔹 Features
🔸 Two-Symbol SMT Analysis (Primary vs Compare)
Select any comparison symbol to evaluate correlation structure and divergence. The script fetches the comparison OHLC data using the current chart timeframe to keep both series aligned for analysis.
🔸 Inverse Correlation Mode
For inversely correlated pairs, enable “Inverse Correlation” so the script interprets confirmation appropriately (for example, a higher low on the comparison instrument might be expected to correspond to a lower low on the primary, depending on the relationship). This helps avoid false conclusions when the pair naturally moves opposite.
🔸 Pivot-Based Swing with Adjustable Sensitivity
Swings are detected using confirmed pivots (left bars and right bars). This provides cleaner structural swing points compared with raw candle-to-candle comparisons, and it lets you control sensitivity for different market conditions and timeframes. The script also limits stored swing history to keep performance stable.
🔸 Flexible Detection Mode: Time Matched or Independent Swings
You can choose how swings are paired across instruments:
Time Matched searches for a comparison swing that occurred at the same pivot time as the primary swing.
Independent Swings compares each symbol’s own last two swings without requiring an exact time match.
🔸 Range Control and Noise Filtering
To reduce weak or irrelevant signals:
“Max Bars Between Swings” ensures the two swings being compared are close enough in structure to be meaningful.
“Min Price Diff (%)” can require a minimum percentage change between the primary’s last two swing prices to confirm the move is significant.
🔸 Clear Visual Output with Tooltips
When a divergence is detected, the script can print a label (“SMT”) with bullish or bearish styling and a tooltip that includes the symbol pair and the primary swing price for quick context.
🔸 Divergence Lines for Context
Optional lines connect the relevant swing points, making it easier to see the exact structure that triggered the signal. One line can be drawn on the main chart and another in the indicator pane for the comparison series.
🔸 Info Table (At a Glance)
A compact table can display the active symbols, correlation mode, total divergences stored, and the most recent signal type.
🔸 Alerts Included
Built-in alert conditions are provided for bullish SMT, bearish SMT, and any SMT event so you can automate notifications without editing the code.
🔸 Optional Comparison Candle Panel
If enabled, the indicator can plot the comparison symbol as candles in the indicator pane. This is useful for confirming whether the divergence is happening around major levels, consolidations, or impulsive legs on the secondary instrument.
🔹 Calculations
This section summarizes the core logic used by the script.
1. Data Synchronization (Comparison Symbol)
The comparison instrument is requested on the chart’s current timeframe so swing calculations are performed consistently:
=
request.security(compareSymbolInput, timeframe.period, )
This ensures pivots and swing times are derived from the same bar cadence as the primary chart.
2. Swing Detection via Confirmed Pivots
Swings are detected using pivot logic with user-defined left and right bars:
primaryPivotHigh = ta.pivothigh(high, pivotLeftBars, pivotRightBars)
primaryPivotLow = ta.pivotlow(low, pivotLeftBars, pivotRightBars)
Because pivots are confirmed only after the “right bars” have closed, the script stores each swing using an offset so the swing’s bar index and time reflect where the pivot actually occurred, not where it was confirmed.
3. Swing Storage and Retrieval
Both symbols maintain arrays of SwingPoint objects. Each new swing is pushed into the array, and older swings are dropped once the array exceeds the configured maximum. This makes the divergence engine predictable and prevents uncontrolled memory growth.
The script then retrieves the last and previous swing highs and lows (per symbol) to evaluate structure.
4. Matching Logic (Time Matched vs Independent)
When “Time Matched” is selected, the script searches the comparison swing array for a pivot that occurred at the exact same timestamp as the primary swing. When “Independent Swings” is selected, it simply uses the comparison symbol’s last two swings of the same type.
5. Bullish SMT Condition (LL vs HL)
A bullish SMT event is defined as:
Primary forms a lower low (last low < previous low)
Comparison forms a higher low (last low > previous low)
If inverse correlation is enabled, the comparison condition flips to maintain logical confirmation rules
The two primary swings must be within the configured bar distance window
Optional minimum percentage difference must be satisfied
A simple anti duplication rule prevents repeated triggers on the same structure
These checks are implemented directly in the bullish detection block.
6. Bearish SMT Condition (HH vs LH)
A bearish SMT event is defined as:
Primary forms a higher high (last high > previous high)
Comparison forms a lower high (last high < previous high)
Inverse correlation flips the comparison rule
Range checks, minimum difference filtering, and duplicate protection apply similarly
These checks are implemented in the bearish detection block.
7. Percentage Difference Filter
The optional “Min Price Diff (%)” filter measures the relative distance between the last two primary swing prices. This prevents very small structural changes from being treated as valid SMT signals.
priceDiffPerc = math.abs(lastSwing.price - prevSwing.price) / prevSwing.price * 100.0
The divergence condition is only allowed to trigger if this value exceeds the user defined threshold.
priceOk = priceDiffPerc >= minPriceDiff
This filter is especially useful on higher timeframes or during low volatility conditions, where micro structure noise can otherwise produce misleading signals.
8. Visualization and Output
When a divergence is confirmed, the script:
Stores the event in a divergence array (limited by “Max Divergences to Display”)
Draws a directional SMT label with a tooltip (optional)
Draws connecting lines using time based coordinates for clean alignment (optional)
It also updates an information table on the last bar only, and exposes alertconditions for automation workflows.

Math by Thomas SMC Buy and Sell Model📖 DESCRIPTION
This indicator is built on Smart Money Concepts (SMC) and focuses on how institutions actually execute trades.
Instead of predicting direction, it identifies three critical market states:
Acceptance (Sideways / Consolidation)
Liquidity Location (PDH / PDL / Swing High–Low)
Volatility Release (Breakout with intent)
The model waits for price compression (inventory build) near liquidity and triggers trades only when price breaks in the direction of liquidity.
This approach is especially suitable for index option buying, where timing and expansion matter more than prediction.
🧠 CORE LOGIC (SIMPLE EXPLANATION)
1️⃣ Sideways / Acceptance Phase
The indicator detects periods where price accepts value
These zones represent institutional inventory building
Shown as blue boxes on the chart
2️⃣ Liquidity Context
The indicator tracks:
Previous Day High (PDH)
Previous Day Low (PDL)
Swing Highs & Swing Lows
These levels act as liquidity targets for institutional moves.
3️⃣ Buy / Sell Signal
A signal appears only when:
Price breaks out of a sideways box
The breakout is towards liquidity
This avoids:
Random breakouts
Counter-trend trades
Low-probability entries
🟢 BUY SIGNAL RULES
A BUY (CALL) signal is generated when:
A valid sideways box is present
Candle closes above the box high
Liquidity exists above price
PDH or Swing High above
📌 The signal appears after candle close (no repaint).
🔴 SELL SIGNAL RULES
A SELL (PUT) signal is generated when:
A valid sideways box is present
Candle closes below the box low
Liquidity exists below price
PDL or Swing Low below
📌 The signal appears after candle close (no repaint).
⏱️ BEST TIMEFRAME
✅ Recommended timeframe: 5 MINUTE
Why 5-minute works best:
Cleaner acceptance zones
Meaningful liquidity reactions
Less noise than 1-minute
Faster execution than higher timeframes
⚠️ 1-minute charts may produce noisy signals.
⚠️ Higher timeframes may delay option entries.
🕒 BEST MARKET TIME
For index trading (NIFTY / BANKNIFTY):
✅ 9:30 AM – 2:45 PM
❌ Avoid late entries after 3:10 PM
🎯 WHO SHOULD USE THIS INDICATOR
✔️ Index option buyers
✔️ Traders using SMC / price action
✔️ Traders who want logic-based entries
✔️ Those avoiding prediction-based trading
❌ WHAT THIS INDICATOR IS NOT
❌ Not a scalping indicator
❌ Not a trend-following MA system
❌ Not for blind signal trading
This is a context-based execution tool.
🎓 EDUCATIONAL NOTE
This indicator does not predict the market.
It helps identify when institutions are likely executing after inventory build-up.
Always combine with:
Proper risk management
Market context
Discipline
⚠️ DISCLAIMER
This indicator is for educational purposes only.
Trading involves risk.
The author is not responsible for financial losses.
📖 விளக்கம் (DESCRIPTION)
இந்த இன்டிகேட்டர் Smart Money Concepts (SMC) அடிப்படையில் உருவாக்கப்பட்டது.
மார்க்கெட் எந்த திசைக்கு போகும் என்று ஊகிப்பதில்லை;
இன்ஸ்டிடியூஷன்கள் எப்போது உண்மையாக செயல்படுகின்றன என்பதை கண்டறிவதே இதன் நோக்கம்.
இந்த மாடல் மார்க்கெட்டின் மூன்று முக்கிய நிலைகளை கவனிக்கிறது:
1️⃣ Acceptance / Sideways (கன்சாலிடேஷன்)
2️⃣ Liquidity Location (PDH / PDL / Swing High–Low)
3️⃣ Volatility Release (Breakout with intent)
Sideways நிலையில் இன்ஸ்டிடியூஷன்கள் inventory build செய்கிறார்கள்.
அந்த acceptance முடிந்து, liquidity நோக்கி பிரேக் ஏற்பட்டால் மட்டுமே
Buy / Sell signal கொடுக்கப்படுகிறது.
👉 இது Index Option Buying-க்கு மிகவும் பொருத்தமானது.
🧠 மைய லாஜிக் (எளிய விளக்கம்)
1️⃣ Sideways / Acceptance Phase
விலை ஒரு ரேஞ்சில் சுழலும் போது இந்த பகுதி கண்டறியப்படுகிறது
இது inventory build ஆகும் பகுதி
சார்ட்டில் நீல நிற Box ஆக காட்டப்படும்
2️⃣ Liquidity Context
இந்த இன்டிகேட்டர் கீழ்கண்ட liquidity லெவல்களை கவனிக்கிறது:
Previous Day High (PDH)
Previous Day Low (PDL)
Swing High / Swing Low
இந்த லெவல்கள் தான் இன்ஸ்டிடியூஷன்களின் இலக்கு (destination).
3️⃣ Buy / Sell Signal
Signal வரும் போது:
Sideways box இருக்க வேண்டும்
Box-ஐ உடைத்து CLOSE ஆக வேண்டும்
அந்த பிரேக் liquidity இருக்கும் திசையில் இருக்க வேண்டும்
இதனால்:
தவறான பிரேக்குகள் தவிர்க்கப்படும்
Counter-trend trades குறையும்
🟢 BUY SIGNAL (CALL)
BUY signal வரும் நிலை:
Sideways box உருவாகி இருக்க வேண்டும்
Candle, box high-க்கு மேலே close ஆக வேண்டும்
Liquidity மேலே இருக்க வேண்டும்
PDH மேலே
அல்லது Swing High மேலே
📌 Candle close ஆன பிறகே signal வரும்
👉 No repaint
🔴 SELL SIGNAL (PUT)
SELL signal வரும் நிலை:
Sideways box உருவாகி இருக்க வேண்டும்
Candle, box low-க்கு கீழே close ஆக வேண்டும்
Liquidity கீழே இருக்க வேண்டும்
PDL கீழே
அல்லது Swing Low கீழே
📌 Candle close ஆன பிறகே signal வரும்
👉 No repaint
⏱️ சிறந்த Timeframe
✅ 5-Minute Timeframe – BEST
ஏன் 5-minute சிறந்தது?
Sideways zones தெளிவாக உருவாகும்
Liquidity reaction நல்லதாக இருக்கும்
1-minute போல noise இல்லை
Option buying-க்கு சரியான timing
⚠️ 1-minute – அதிக noise
⚠️ Higher timeframe – entry தாமதம்
🕒 சிறந்த Trading Time
Index (NIFTY / BANKNIFTY):
✅ காலை 9:30 – மதியம் 2:45
❌ 3:10க்கு பிறகு புதிய entry தவிர்க்கவும்
🎯 யாருக்கு இந்த இன்டிகேட்டர்?
✔️ Index Option Buyers
✔️ SMC / Price Action Traders
✔️ Prediction-ஐ விட logic விரும்புபவர்கள்
✔️ Clean entries தேடும் traders
❌ இது என்ன அல்ல?
❌ Scalping indicator அல்ல
❌ Moving Average system அல்ல
❌ Blind signal trading-க்கு அல்ல
👉 இது context-based execution tool.
🎓 கல்வி குறிப்பு
இந்த இன்டிகேட்டர் மார்க்கெட்டை predict செய்யாது.
Inventory build ஆன பிறகு, இன்ஸ்டிடியூஷன்கள் execute செய்யும் இடங்களை
காட்டுவதே இதன் நோக்கம்.
எப்போதும்:
Risk management
Discipline
Market context
கண்டிப்பாக பயன்படுத்த வேண்டும்.
⚠️ மறுப்பு அறிவிப்பு (Disclaimer)
இந்த இன்டிகேட்டர் கல்வி நோக்கத்திற்காக மட்டுமே.
Trading-ல் risk உள்ளது.
ஏதேனும் இழப்புகளுக்கு உருவாக்குநர் பொறுப்பல்ல.

Intermarket SSMT Table [Pogiest]General
Intermarket Sequential Smart Money Technique (IMSSMT) is a Quarterly Theory concept that identifies divergences (extreme highs/lows) when comparing different market triads to another market triad in two consecutive quarters.
SSMT involves identifying divergences in a correlated asset triad that occurs consecutively from the previous quarter to the current quarter to predict new phases of price, a shift in market sentiment, and also potential trend reversals. An SSMT divergence occurs when one or two assets makes a new high or low, but the other asset or assets does not, signaling a potential shift in market direction. A Hidden SSMT Divergence occurs when one or two assets’ closing price closes higher or lower than the other one or two assets’ closing price. However, with potential gaps in price, an opening price can also be the extreme when comparing assets for divergences. Hidden SSMT divergence compares the candle bodies while a Standard SSMT divergence compares the highs and lows. Both types of SSMTs are considered to be cracks in correlation and can be used to identify potential new phases of price whether it be a reversal, retracement, consolidation, and continuation.
Credit of concepts/ideas: ICT & TraderDaye
What Makes This Indicator Unique
The indicator table is designed to be used on any symbol the trader is viewing. For example, the indicator is shown on an NQ chart while selecting three symbols in the Forex triad in settings. The indicator will request the separate data from the symbols selected and display the data within the table. The table does not rely on data on the chart being viewed. Instead of switching charts, the table is used to track other market triads for SSMTs (standard & hidden) while viewing other markets simultaneously.
The indicator has the ability to display Standard SSMTs, Hidden SSMTs, or both simultaneously in real-time, tick by tick in the time period selected in a correlated asset triad within the table. Toggle modes for each type of SSMT will run independently (runs when enabled) and therefore, optimizes performance. The user is able to select three different tickers in settings instead of limiting to pairs. In addition, the indicator has “Invert” toggle options to track both Standard and Hidden SSMTs for assets with negative correlations.
How the Indicator Table Works
The indicator functions to track any divergences from the previous quarter to the current quarter. In addition, the indicator tracks the current status even when there are no divergences (see phase column below).
Timeframe Column:
1. Displays up to two different timeframes to monitor.
Asset Columns:
1. Display up to three different assets to monitor.
2. Cells display “Bull” in green background color or “Bear” in red background color showing the current state of each candle and updates in real-time tick by tick.
Phase Column:
Displays the current status from the previous quarter to the current quarter. The status updates in real-time tick by tick.
1. “F/S” indicates there are no current SSMT divergences between the previous quarter to the current quarter and all assets have not swept the previous quarter, a “failure swing”.
2. “HH” is displayed when all assets have swept the previous quarter’s extreme high. (Higher High)
3. “LL” is displayed when all assets have swept the previous quarter’s extreme low. (Lower Low) See screenshot with drawings below.
4. SSMT indicates there is an SSMT from the previous quarter to the current quarter. Red background is a bearish SSMT (divergence at the highs) or green background is a bullish SSMT (divergence at the lows). If the SSMT becomes invalid (i.e. the last asset sweeps the extreme high/low), then the table will update to display either “HH” or “LL” depending on the extreme it swept. See screenshot with drawings below.
5. “Both” indicates there are SSMT divergences at both the extremes highs and lows. If an SSMT on one side gets deleted, then the cell will automatically update to display the SSMT that is still intact. See screenshot with drawings below.
Invert Toggle Option:
When this setting is turned on, the asset column cells will display the inverted color of the live chart to show assets are in-sync. It will track the inverted swing points for SSMTs, higher highs, lower lows, etc. For example, if EUR and GBP are making lower highs, while DXY (Inverted toggle on), makes a lower low on the actual live chart, it will display “SSMT”.
NOTE:
Scanning function per timeframe to detect SSMTs:
Weekly HTF: Scans 4HR bars
Daily HTF: Scans 1HR bars
6HR/4HR HTF: Scans 15m bars
1HR HTF: Scans 5m bars
5m HTF: Scans 1m bars
The script has fixed lookback periods for bars to ensure the appropriate data is being captured. The higher the timeframe the user selects in settings while viewing on an extremely lower timeframe, the indicator may give inaccurate readings:
Recommended Chart Timeframes:
For best performance and accuracy, view your chart on a timeframe close to or lower than the scan timeframe:
Weekly HTF → View on 1H-4H chart
Daily HTF → View on 1H-4H chart
6HR/4HR HTF → View on 5m-15m chart
90M HTF → View on 3m-15m chart
1H HTF → View on 1m-15m chart
The indicator will attempt to scan further back if needed, but extremely low chart timeframes (e.g., 1m) with high HTF (e.g., Weekly) may still have limitations.
In addition, the indicator bases the SSMT off the previous quarter’s time range to the current quarter’s time range. If there are discrepancies in the time ranges (start to end of higher timeframe period selected), the SSMTs may display differently than what is viewed on the chart. For example, indices open at 18:00 est on a new trading day, so the time ranges matches throughout the day. However, in Forex, EUR and GBP opens at 17:00 est while DXY opens later, so the time ranges may be off (i.e. 6 hour timeframe). For best use, select time periods that matches throughout the day.
Usage
Traders can use both types of SSMT divergences to anticipate potential reversals in points of interest such as higher timeframe swing points, supply/demand zones, higher timeframe imbalances, key levels, etc. This indicator can also be beneficial in identifying cracks in correlation via Hidden SSMT when there are no divergences off the highs and lows. Divergences can come in different forms relating to Intermarket SSMT. For example, if one market triad is all making lower lows while the other market triad is making higher highs, this can be deemed a divergence between the two markets. Another example would be one market triad all makes lower lows while another market triad makes a bullish SSMT. This can potentially signal a bullish move up. SSMT divergences (standard and hidden) can be used as a confirmation tool with other confluences to identify trend direction with respect to points of interest, higher timeframe order-flow, lower timeframe order-flow, etc. In addition, having both a Standard SSMT and Hidden SSMT divergence display could potentially signal a reversal. It is up to the trader to gauge the price action at the time.
Settings
1. Choose up to three different assets to monitor.
Note: If only two are selected, the indicator will only display the two selected and compare the two assets for divergences. If one is selected, a warning sign will be displayed to select at least two assets.
2. Choose up to two different timeframes. Option to deselect timeframes.
3. Enable/disable standard or hidden SSMT.
4. Option to enable alerts. Alerts include the different phases in the table (i.e. SSMT, HH, LL, and Dual SSMT [both standard & hidden) for each timeframe.
5. Toggle option to show/hide the table. Toggle option to show/hide the “Title Row” which is the first row at the top of the table.
6. Adjust the table positioning to be displayed on the chart.
7. Option to change text size in the table cells. This will also increase/decrease the size of the table.
Risk Disclaimer
This indicator is for educational and informational purposes only and does not constitute financial advice. All trading and investment decisions remain solely the responsibility of the user.
Trading involves a high degree of risk, and past performance is not indicative of future results.
Always conduct your own research and consult with a qualified financial professional before making any trading decisions.
By using this indicator, users acknowledge they understand these risks and accept full responsibility for their trading decisions and outcomes.

Market Structure Pivots with BOS & CHoCH [zazenio]What is Market Structure?
Market structure is simply the pattern of highs and lows that price creates as it moves. When you look at any chart, you'll notice price doesn't move in a straight line — it swings up, pulls back, swings up again (in an uptrend), or the opposite in a downtrend.
These swing points — the peaks and valleys — are what traders call pivots . Identifying them correctly is the foundation of understanding where a market has been and where it might go next.
What This Indicator Does
Swing Pivots automatically marks these peaks and valleys on your chart so you don't have to draw them manually. It works on any market — stocks, crypto, forex, futures, indices — and on any timeframe.
Beyond just marking pivots, this indicator also draws BOS (Break of Structure) and CHoCH (Change of Character) lines — two essential concepts that help you understand when a trend is continuing or potentially reversing.
How Pivots Are Detected
This indicator confirms pivots based on price structure, not a fixed bar count.
Here's how it works:
A swing high is confirmed when price breaks below the previous swing low. At that moment, we know the high was real — price tried to go higher, failed, and reversed. The market "proved" that level was a genuine turning point.
A swing low is confirmed when price breaks above the previous swing high. The same logic applies — price tried to go lower, failed, and reversed direction.
This creates a natural alternation: high, low, high, low. Each pivot is validated by the market's actual behavior, not by waiting for an arbitrary number of bars to pass.
Understanding BOS and CHoCH
Once you can identify pivots, the next step is understanding what happens when price breaks through them. This is where BOS and CHoCH come in.
BOS (Break of Structure)
A Break of Structure occurs when price continues in the direction of the current trend by breaking a previous pivot level.
In an uptrend : Price breaks above a previous swing high → This signals strength. Buyers are pushing price to new highs, and the trend is likely to continue.
In a downtrend : Price breaks below a previous swing low → This signals weakness. Sellers are pushing price to new lows, and the trend is likely to continue.
Think of BOS as the market saying "the trend is still intact." Each BOS confirms that the dominant side (buyers or sellers) remains in control.
CHoCH (Change of Character)
A Change of Character occurs when price breaks a pivot level in the opposite direction of the current trend. This is an early warning signal that the trend may be reversing.
In an uptrend : Price breaks below a previous swing low → This is unexpected. In a healthy uptrend, lows should hold. When they don't, it suggests buyers are losing control and sellers may be taking over.
In a downtrend : Price breaks above a previous swing high → This is unexpected. In a healthy downtrend, highs should hold. When they don't, it suggests sellers are losing control and buyers may be stepping in.
Think of CHoCH as the market's behavior "changing character" — it's no longer acting the way it should if the trend were healthy.
Why BOS and CHoCH Matter
These concepts give you a framework for reading what the market is actually doing:
BOS tells you the trend is continuing — stay with it or look for entries in that direction
CHoCH warns you the trend may be ending — time to be cautious, take profits, or look for trades in the new direction
By visualizing these breaks directly on your chart, you don't have to guess. You can see at a glance whether the market is trending smoothly (consecutive BOS) or showing signs of reversal (CHoCH).
Why This Approach Works
Most pivot indicators use a "lookback" method — they wait for a certain number of bars (say, 5 or 10) on each side of a candle before confirming it as a pivot. This creates a fixed delay. By the time the pivot appears on your chart, price has already moved on.
This indicator doesn't wait. It confirms pivots the moment price structure proves them. The result is pivots that align with how traders actually read charts — based on breaks of structure, not arbitrary countdowns.
Settings
Configuration
Swing Width : Controls how sensitive the detection is. Higher numbers show only major swings; lower numbers capture smaller moves within the structure.
Pivot Settings
High/Low Color : Customize the colors of swing high and swing low markers
Style : Choose between Triangle or Circle markers
Size : Adjust the size of pivot markers (Auto, Tiny, Small, Normal)
Structure Lines
Show CHoCH : Toggle Change of Character lines on/off
CHoCH Color : Customize the color of CHoCH lines
CHoCH Label : Show/hide the "CHoCH" text label
Show BOS : Toggle Break of Structure lines on/off
BOS Color : Customize the color of BOS lines
BOS Label : Show/hide the "BOS" text label
Use Cases
See the "skeleton" of price action at a glance
Identify potential support and resistance levels
Understand if the market is trending or ranging
Spot trend continuations with BOS lines
Catch early reversal signals with CHoCH lines
Build a foundation for more advanced trading strategies
━━━━━━━━━━━━━━━━━━━━━━
Version History
v1.1
Added BOS (Break of Structure) lines to visualize trend continuation
Added CHoCH (Change of Character) lines to identify potential trend reversals
Added toggle options for BOS and CHoCH visibility
Added customizable colors for structure lines
Added optional labels for BOS and CHoCH
v1.0
Initial release
Automatic swing high and swing low detection
Structure-based pivot confirmation (not fixed lookback)
Customizable pivot markers (style, size, colors)
Adjustable swing width sensitivity
━━━━━━━━━━━━━━━━━━━━━━
Disclaimer:
This script is provided for educational and informational purposes only. It is not financial advice and does not constitute a recommendation to buy or sell any financial instrument. Always do your own research and trade at your own risk.

Cold Brew Ranges🧭 Core Logic and Calculation
The fundamental logic for each range (OR and CR) is identical:
Time Definition: Each range is defined by a specific Start Time and a fixed 30-second duration. The timestamp function, using the "America/New_York" time zone, is used to calculate the exact start time in Unix milliseconds for the current day.
Example: t0200 = timestamp(TZ, yC, mC, dC, 2, 0, 0) sets the start time for the 02:00 OR to 2:00:00 AM NY time.
Range Data Collection: The indicator uses the request.security_lower_tf() function to collect the High (hArr) and Low (lArr) prices of all bars that fall within the defined 30-second window, using a user-specified, sub-chart-timeframe (openrangetime, defaulted to "1" second, "30S", or "5" minutes). This ensures high precision in capturing the exact high and low during the 30-second window.
High/Low Determination: It iteratively finds the absolute highest price (OR_high) and the absolute lowest price (OR_low) recorded by the bars during that 30-second window.
Range Locking: Once the current chart bar's time (lastTs) passes the 30-second End Time (tEnd), the High and Low are locked (OR_locked = true), meaning the range calculation is complete for the day.
Drawing: Upon locking, the range is drawn on the chart using line.new for the High, Low, and Equilibrium, and box.new for the shaded fill. The lines are extended to a subsequent time anchor point (e.g., the 02:00 OR is extended to 08:20, the 09:30 OR is extended to 16:00).
Equilibrium (EQ): This is calculated as the simple average (midpoint) of the High and Low of the range.
EQ=
2
OR_High+OR_Low
⏰ Defined Trading Ranges
The indicator defines and tracks the following specific 30-second ranges:
Range Name Type Start Time (NY) Line Extension End Time (NY) Common Market Context
02:00 OR Opening 02:00:00 08:20:00 Asian/European Market Overlap
08:20 OR Opening 08:20:00 16:00:00 Pre-New York Open
09:30 OR Opening 09:30:00 16:00:00 New York Stock Exchange Open (Most significant OR)
18:00 OR Opening 18:00:00 20:00:00 Futures Market Open (Sunday/Monday)
20:00 OR Opening 20:00:00 Next Day's session start Asian Session Start
15:50 CR Closing 15:50:00 20:00:00 New York Close Range
⚙️ Key User Inputs and Customization
The script offers extensive control over which ranges are displayed and how they are visualized:
Range Time & History
openrangetime: Sets the sub-timeframe (e.g., "1" for 1 second) used to calculate the precise High/Low of the 30-second range. Crucial for accuracy.
showHistory: A toggle to show the ranges from previous days (up to a histCap of 50 days).
Range Toggles and Styling
On/Off Toggles: Independent input.bool (e.g., OR_0200_on) to enable or disable the display of each individual range.
Colors & Width: Separate color and width inputs for the High/Low lines (hlC), the Equilibrium line (eqC), and the background fill (fillC) for each range.
Line Styles: Global inputs for the line styles of High/Low (lineStyleInput) and Equilibrium (eqLineStyleInput) lines (Solid, Dotted, or Dashed).
showFill: Global toggle to enable the shaded background box that highlights the area between the High and Low.
Extensions
The script calculates and plots extensions (multiples of the initial range) above the High and below the Low.
showExt: Toggles the visibility of the extension lines.
useRangeMultiples: If true, the step size for each extension level is equal to the initial range size:
Step=Range=OR_High−OR_Low
If false, the step size is a fixed value defined by stepPts (e.g., 60.0 points, which is a common value for NQ futures).
stepCnt: Determines how many extension levels (multiples) are drawn above and below the range (default is 10).
📈 Trading Strategy Implications
The Cold Brew Ranges indicator is a tool for session-based support and resistance and range breakout/reversal strategies.
Key Support/Resistance: The High and Low of these defined opening ranges often act as strong, predefined price levels. Traders look for price rejection off these boundaries or a breakout with conviction.
Equilibrium (Midpoint): The EQ often represents a fair value for that specific session's opening. Movements away from it are seen as opportunities, and a return to it is common.
Extensions: The range extensions serve as potential profit targets or stronger, layered support/resistance levels if the market trends aggressively after the opening range is set.
The core idea is that the activity in the first 30 seconds of a significant trading session (like the NYSE or a market session open) sets a bias and initial boundary for the trading period that follows.

Session Highs and Lows🔑 Key Levels: Session Liquidity & Structure Mapper
The Key Levels indicator is an essential tool for traders as it automatically plots and projects critical Highs and Lows established during key trading sessions. These levels represent major liquidity pools and define the current market structure, serving as high-probability targets, support, or resistance for the remainder of the trading day.
⚙️ Core Functionality
The indicator operates in two distinct modes, tailored for different asset classes:
1. Asset Class Mode (Toggle)
You can switch between two predefined setups depending on the asset you are trading:
Stock Mode (RTH/ETH): Designed for US stocks and futures (e.g., NQ, ES, YM). It tracks and projects levels for Regular Trading Hours (RTH) (09:30-16:00) and Extended Hours (ETH) (16:00-09:30).
Forex/Default Mode (Asia/London/NY): Designed for global markets (e.g., currency pairs). It tracks and projects levels for the three major liquidity sessions: Asia (19:00-03:00), London (03:00-09:30), and New York (09:30-16:00).
🗺️ Key Levels Mapped
The script continuously tracks and plots the most significant structural levels:
Current Session High/Low: The running high and low of the currently active session.
Previous Session High/Low: The confirmed high and low from the most recently completed session. These are often targeted by market makers.
Previous Day High/Low (PDH/PDL): The high and low of the prior 24-hour day, acting as major structural boundaries and a crucial macro market filter.
🎛️ Advanced Liquidity Management
The indicator is built with specific controls for high-level liquidity analysis:
Extend Through Sweeps (Critical Setting):
OFF (Recommended): The projected line is automatically stopped or deleted the moment the price candle wicks or closes past it. This visually confirms that the liquidity at that level has been "swept" or "mitigated."
ON: The line extends indefinitely, treating the level as simple support/resistance, regardless of interaction.
Previous vs. Current View: You can select a checkbox (e.g., Use PREVIOUS London Level) to hide the current session's running levels and only display the static, confirmed high/low from the prior completed session. This helps declutter the chart and focus only on the confirmed structural levels.
Show Older History: Toggle to keep lines from prior days visible, allowing you to track multi-day structural context.
🎯 Trading Application
The lines plotted by the Key Levels indicator provide immediate, actionable information:
Bias Filter: Use the PDH/PDL to determine the overall market context. Trading above the PDH suggests a bullish bias, while trading below the PDL suggests a bearish bias.
Manipulation/Entry: Wait for price to aggressively sweep a Previous Session High/Low (line stops extending). This often signals a liquidity grab or "manipulation" phase. Look for entries in the opposite direction for the main move (Distribution).
Targets: Key levels (especially unmitigated ones) serve as excellent, objective take-profit targets for active trades.

Market Structure Pro + (@JP7FX)Market Structure Pro Plus (JP7FX)
Market Structure Pro Plus identifies swing highs and swing lows using a three candle confirmation method. It highlights liquidity behaviour and market structure shifts without manual marking.
Swing Point Detection
The indicator marks swing highs and lows when the middle candle in a three candle sequence forms the highest high or lowest low.
This approach reacts to local price behaviour and does not rely on a large lookback period.
Liquidity Grab Signals
The indicator highlights when price trades beyond a previous swing high or swing low and then returns.
These events help users review how liquidity is taken around prior highs and lows.
Break of Structure Signals
The indicator marks a break of structure when a candle closes beyond a previous swing point.
Bullish structure change signals occur when price closes above a prior swing high.
Bearish structure change signals occur when price closes below a prior swing low.
Deviation Stats and Projections
The script tracks how far price extends beyond the last confirmed swing high or swing low, in pips, after liquidity is taken.
It keeps a rolling history of these extensions and calculates an average combined extension for recent moves.
This average is shown in a small stats table as “Avg SD High/Low”.
Using this value, the indicator projects two reference levels from the latest confirmed swing:
• a “Deviation High” line projected from the last swing high
• a “Deviation Low” line projected from the last swing low
These projection lines are drawn as dotted levels with labels and can be used as reference zones based on recent extension behaviour.
Features
• Automatic swing high and swing low detection
• Liquidity grab marking
• Break of structure marking
• Deviation stats table with average extension value
• Projection lines for Deviation High and Deviation Low
• Alerts for liquidity grabs and structure changes
• Market type setting for forex, stock, crypto, commodity and futures
• Customisable colours, line styles and visibility options
• Works across all timeframes and assets
Use Cases
Useful for traders who study market structure, track trend shifts, or review liquidity and extension behaviour around highs and lows.
The indicator reduces manual chart work by highlighting swing points, structure changes and typical extension zones in real time.

Week high / Week low (Mo–Fr)The indicator tracks the weekly high and low levels of the market starting from Monday 00:00 and updates them throughout the week until Friday. It draws horizontal lines across the chart representing:
Weekly High
Weekly Low
Each level also displays a label that can be positioned in different ways depending on user settings.
🧠 How it works step-by-step
1. Every Monday a new week starts
When a new week begins:
The script stores the current candle’s high as the initial weekHigh
And the current candle’s low as weekLow
Previous week's lines and labels are deleted
New horizontal lines are created and extended to the right
Labels (for high & low) are placed initially at the start of the week
2. During Monday–Friday
On every candle:
If a new higher price is reached → weekly high updates
If a new lower price is reached → weekly low updates
The horizontal line moves to the new value
A saved index remembers where that high/low was created
3. Label Position Control
The user can choose how labels should be anchored:
Mode Meaning
Update point Label stays where the high/low occurred
Right edge Label always moves to the current bar (right end of week)
Right offset Like Right edge but shifted further right by X bars
You can also customize:
label background color
label text color
label size
whether the label points up/down (above or below the line)
line color, style, and width
4. Weekend behavior
On Saturday, the script stops extending the lines, effectively freezing the weekly high and low for that completed week.
Summary
This indicator is useful for traders who want automatic weekly levels, visually clean chart structure, and customizable label placement. It tracks market structure weekly, keeps levels persistent across the chart, and lets you choose exactly how those levels appear.
If you want, I can also create:
✔ previous week high/low
✔ midline (50% of the range)
✔ alerts when price breaks the weekly high/low
✔ highlight liquidity sweeps

ICC + Trident ORB UltimateICC + Trident ORB Ultimate – Indication / Correction / Continuation using multi-session ORB + confluence scoring
This tool is an intraday framework built around ICT-style Indication → Correction → Continuation (ICC) logic, using three coordinated Opening Range Boxes (“Trident ORB”) plus a confluence engine to grade breakouts and reversals.
It is not just a mashup of indicators. Each module has a specific role:
________________________________________
1. Core concept
The script combines:
• Three ORBs (“Trident”):
o European session ORB (bias & magnets)
o US Futures ORB (8:30 “engine” for the day)
o Cash session ORB (9:30 volatility filter)
• ICC structure:
o Indication – Directional bias from how price behaves around the Euro ORB (above = BULL, below = BEAR, inside = NEUTRAL).
o Correction – A dynamic Correction Zone built from the US Futures ORB (discount/premium area between ORB midline and range).
o Continuation – Qualified breakouts of the 8:30 ORB high/low, graded by a confluence score (A+/A/B/C).
• Confluence engine:
Optional filters (VWAP, RSI, FVG, SMT, swing structure, PDH/PDL, EMA stack, RTH) are combined into a single score and grade to highlight higher-probability continuation moves.
The goal is to give you one integrated view of:
session structure → day type → volatility → confluence → actionable breakouts/sweeps.
________________________________________
2. Trident ORB structure & day types
The script draws three configurable ORB boxes in your chosen timezone:
• Euro ORB (default 03:00–04:00)
o Defines early “indication” bias:
Above Euro high = BULL
Below Euro low = BEAR
Inside = NEUT
o On confirmed trend days, Euro high/low can be plotted as magnet levels (targets).
• US Futures ORB (8:30 ORB) (default 08:30–09:00)
o Main intraday “engine” box.
o The script tracks:
Breaks above/below the ORB
Rejections around the ORB midline
Sweeps – wicks that push past ORB high/low by a configurable % of the range, then close back inside.
• Cash ORB (default 09:30–10:00)
o Used as a volatility check: if the Cash ORB range is much wider than the 8:30 ORB, the day is flagged as “HIGH” volatility, and the confluence score is penalized.
Using the 8:30 ORB behavior, the script classifies the day type:
• TREND – multiple clean breaks and holding above/below the 8:30 ORB.
• RANGE – repeated rejections at the 8:30 midline with no clean break.
• TRAP – ORB sweeps (fake outs) that reverse back inside the range.
• TREND? / WAIT – early or uncertain structure.
Day type is shown both as a label on the chart and in the info table, and can optionally adjust the confluence score (e.g., penalty on TRAP/RANGE days, bonus on TREND days).
________________________________________
3. Confluence scoring (what feeds the A+/A/B/C grades)
For both long (BULL) and short (BEAR) directions, the indicator builds a score from several components:
• VWAP filter – price above/below VWAP.
• RSI filter – RSI within user-defined bullish/bearish bands.
• FVG detection – recent 3-bar Fair Value Gaps (weighted +2).
• SMT divergence – comparison vs. a second symbol (default ES1!):
o Bearish SMT = your chart makes a higher high while SMT ticker doesn’t confirm.
o Bullish SMT = your chart makes a lower low while SMT ticker doesn’t confirm.
• Swing / PDH-PDL proximity – recent swing highs/lows and prior-day high/low.
• EMA stack – 9/21/50 EMA alignment in trend direction.
• RTH session – optional extra point when inside regular trading hours.
On top of this base score, two modifiers can be applied:
• Day type modifier – e.g., +1 on TREND days, −1 on RANGE, −2 on TRAP (optional).
• Cash ORB volatility modifier – penalty when Cash ORB is abnormally wide.
The final result is:
• 0+ score per side (bull/bear)
• Letter grade:
o 5+ = A+
o 4 = A
o 3 = B
o <3 = C
Each label includes both the grade and the factors that contributed (e.g. A BULL (4pts) VWAP✓ RSI✓ FVG+2 ), so you can see why a signal printed.
________________________________________
4. Signals, sweeps & targets
Continuation signals (main entries)
• Bull continuation:
o Price crosses above the US Futures ORB high.
o Bull confluence score ≥ your Minimum Score to Show Signal.
o Not blocked by TRAP logic if ORB priority is enabled.
• Bear continuation:
o Price crosses below the US Futures ORB low.
o Bear confluence score meets the same threshold.
On these bars, the script plots BULL/BEAR labels with grade and factor list, colored by score. Optional alerts fire with the same information and day type included.
Sweep reversal signals (trap fades)
Separately from continuation, the script can highlight sweep reversals:
• Bull sweep signal:
o The 8:30 ORB low is swept (wick extends beyond low by X% of the ORB range and closes back inside).
o Euro indication is neutral or bullish.
• Bear sweep signal:
o The 8:30 ORB high is swept and price closes back inside, with a neutral or bearish indication.
These plot SWEEP↑ / SWEEP↓ labels and can trigger alerts, giving you a structured way to see trap-style reversals rather than random wicks.
Targets & correction zone
• Correction Zone:
o A shaded box extending right from the 8:30 ORB that marks the “correction” area between ORB midline and range boundary (different placement for long vs short bias).
o This is your primary pullback zone within the ICC framework.
• Expansion targets:
o Optional T1/T2/T3 lines at ±1.0, ±1.5 and ±2.0 times the 8:30 ORB range from the ORB high/low.
o These serve as simple volatility-based reference targets for partials or exhaustion zones.
________________________________________
5. Info table & optional overlays
A compact table in the top-right corner summarizes the environment at the latest bar:
• VWAP (above/below)
• RSI value (color-coded)
• FVG / SMT state (Bull/Bear/none)
• EMA stack (Bull/Bear/flat)
• Day type (TREND/TRAP/RANGE/etc.)
• Cash volatility (HIGH/OK)
• RTH (Yes/No)
• Last sweep (High/Low/none)
• Current bull/bear grades
Optional visual layers can be toggled on/off:
• FVG boxes
• SMT labels
• EMA lines
• VWAP line
• Prior Day High/Low lines
• Euro magnet levels
• ORB history, midlines, correction zone and targets
This allows you to keep the chart clean or fully instrumented depending on your preference.
________________________________________
6. How to use (practical workflow)
1. Load on an intraday timeframe (e.g., 1–5 minutes) and set the ORB times to match your broker/session if needed.
2. Watch the Trident ORBs form:
o Note the Euro “Indication” (BULL/BEAR/NEUT).
o Once the 8:30 ORB completes, monitor day type classification and Cash ORB volatility.
3. During the session:
o On trend days, focus on A+/A BULL/BEAR continuation labels that break the 8:30 ORB in the direction of Euro indication, ideally from inside the Correction Zone.
o On trap/range days, pay more attention to SWEEP↑ / SWEEP↓ signals and be conservative with continuation.
4. Use expansion targets as objective reference areas for partials and risk-to-reward planning.
5. Adapt filters & thresholds:
o Tighten Minimum Score to Show Signal for fewer, higher-quality signals.
o Turn specific filters on/off (FVG, SMT, EMA, VWAP, etc.) to match your own testing and market.
This script does not place trades or manage risk. It is a discretionary decision-support tool and should be combined with your own risk management and testing. Nothing here is financial advice.

EMA Market Structure [BOSWaves]EMA Market Structure - Trend-Driven Structural Mapping with Adaptive Swing Detection
Overview
The EMA Market Structure indicator provides an advanced framework for visualizing market structure through dynamically filtered trend and swing analysis.
Unlike conventional EMA overlays, which merely indicate average price direction, this model integrates trend acceleration, swing highs/lows, and break-of-structure (BOS) logic into a unified, visually intuitive display.
Each element adapts in real time to price movement, offering traders a living map of support, resistance, and trend bias that reacts fluidly to market momentum.
The result is a comprehensive, trend-aware representation of price structure.
EMA slope and acceleration guide trend perception, while swing points identify key inflection zones.
Breaks of prior highs or lows are highlighted with visual BOS labels and stop-loss projections, giving traders actionable context for continuation or reversal setups.
Unlike static lines or simple moving averages, the EMA Market Structure indicator fuses dynamic trend analysis with structural awareness to provide a clear picture of market bias and potential turning points.
Theoretical Foundation
The EMA Market Structure builds on principles of momentum filtering and structural analysis.
Standard moving averages track average price but ignore acceleration and context; this indicator captures both the directional slope of the EMA and its rate of change, providing a proxy for trend strength.
Simultaneously, swing detection identifies statistically significant highs and lows, while BOS logic flags decisive breaks in structure, aligned with trend direction.
At its core are three interacting components:
EMA Trend & Acceleration : Smooths price data while highlighting acceleration changes, producing gradient-driven color cues for trend momentum.
Swing Detection Engine : Identifies swing highs and lows over configurable bar lengths, ensuring key turning points are captured with minimal clutter.
Break-of-Structure Logic : Detects price breaches of previous swings and aligns them with EMA trend for actionable BOS signals, including projected stop-loss levels for tactical decision-making.
By integrating these elements, the system scales effectively across timeframes and assets, maintaining structural clarity while visualizing trend dynamics in real time. Traders receive both macro and micro perspectives of market movement, with clear cues for trend continuation or reversal.
How It Works
The EMA Market Structure indicator operates through layered processing stages:
EMA Slope & Acceleration : Calculates the EMA and its rate of change, normalizing via ATR and a smoothing function to produce gradient color coding. This allows instant visual identification of bullish or bearish momentum.
Swing Identification : Swing highs and lows are computed using configurable left/right bar lengths, filtered through a cool-off mechanism to prevent redundant signals and maintain chart clarity.
Structural Lines & Zones : Swing points are connected with lines, and shaded zones are drawn between successive highs/lows to highlight key support and resistance regions.
Break-of-Structure Detection : BOS events occur when price breaches a prior swing in alignment with the EMA trend. Bullish and bearish BOS signals include enhanced label effects and projected stop-loss lines and zones, providing immediate tactical reference.
Dynamic Background Mapping : The chart background adapts to EMA trend direction, reinforcing trend context with subtle visual cues.
Through these processes, the indicator creates a living, adaptive map of market structure that reflects both trend strength and swing-based inflection points.
Interpretation
The EMA Market Structure reframes market reading from simple trend following to structured awareness of price behavior:
Uptrend Phases : EMA is rising with positive acceleration, swings confirm higher lows, and BOS events occur above prior highs, signaling trend continuation.
Downtrend Phases : EMA slope is negative, swings form lower highs, and BOS events occur below prior lows, confirming bearish bias.
Trend Reversals : Flat or decelerating EMA with BOS failures may indicate impending structural change.
Critical Zones : Swing-based lines and shaded zones highlight areas where price may pause, reverse, or accelerate, providing high-probability decision points.
Visually, EMA color gradients, structural lines, and BOS labels combine to provide both statistical trend confirmation and actionable structural cues.
Strategy Integration
EMA Market Structure integrates seamlessly into trend-following and swing-based trading systems:
Trend Alignment : Confirm higher-timeframe EMA slope before entering continuation trades.
BOS Entry Triggers : Use BOS events aligned with EMA trend for tactical entries and stop placement.
Support/Resistance Mapping : Swing lines and zones help define areas for scaling, exits, or reversals.
Volatility Context : ATR-based smoothing and stop-loss buffers accommodate varying market volatility, ensuring robustness across conditions.
Multi-Timeframe Coordination : Combine higher-timeframe EMA trend and swings with lower-timeframe structural events for precision entries.
Technical Implementation Details
Core Engine : EMA slope and ATR-normalized acceleration for gradient-driven trend visualization.
Swing Framework : Pivot-based high/low detection with configurable bar lengths and cool-off intervals.
Structural Visualization : Lines, zones, and labels for high-fidelity mapping of support/resistance and BOS events.
BOS Engine : Detects structural breaks aligned with EMA trend, automatically plotting stop-loss lines and visual cues.
Performance Profile : Lightweight, optimized for real-time responsiveness across multiple timeframes.
Optimal Application Parameters
Timeframe Guidance:
1 - 5 min : Ideal for intraday swing spotting and microstructure trend tracking.
15 - 60 min : Medium-range structural analysis and BOS-driven entries.
4H - Daily : Macro trend mapping and key swing-based support/resistance identification.
Suggested Configuration:
EMA Length : 50
Swing Length : 5
Swing Cooloff : 10 bars
BOS Cooloff : 15 bars
SL Buffer : 0.1%
These suggested parameters should be used as a baseline; their effectiveness depends on the asset volatility, liquidity, and preferred entry frequency, so fine-tuning is expected for optimal performance.
Performance Characteristics
High Effectiveness:
Trending markets with defined swings and structural consistency.
Markets where EMA slope and acceleration reliably indicate momentum changes.
Reduced Effectiveness:
Choppy or sideways markets with minimal swing definition.
Random walk assets lacking clear structural anchors.
Integration Guidelines
Confluence Framework : Combine with volume, momentum, or BOSWaves structural indicators
to validate entries.
Directional Control: Follow EMA slope and BOS alignment for high-conviction trades.
Risk Calibration: Use SL projections for disciplined exposure management.
Multi-Timeframe Synergy: Confirm higher-timeframe trend before executing lower-timeframe structural trades.
Disclaimer
The EMA Market Structure is a professional-grade trend and structure visualization tool. It is not predictive or guaranteed profitable; performance depends on parameter tuning, market regime, and disciplined execution. BOSWaves recommends using it as part of a comprehensive analytical stack integrating trend, liquidity, and structural context.

Auto 5-Wave Fixed Channel + Wave 5 Top / Wave 2-ABC BottomAuto 5-Wave Fixed Channel + Wave 5 Top / Wave 2-ABC Bottom
by Ron999
1. What this indicator does
This tool automatically hunts for bullish 5-wave impulse structures and then:
Labels the waves: W1, W2, W3, W4, W5
Draws a fixed “acceleration” channel based on the wave structure
Projects a Wave-5 target zone using a 1.618 extension
Marks the Wave-2 level as an ABC correction target
Triggers optional alerts when:
A new Wave-5 top completes
An ABC bottom forms back near the Wave-2 low
It’s designed as a mechanical, rule-based approximation of Elliott 5-wave impulses – built for traders who like the idea of wave structure but want something objective and programmable.
2. How the wave logic works
The script continuously scans for pivot highs and lows using a user-defined Pivot Length.
It only keeps the last 5 alternating pivots (high → low → high → low → high).
When those last 5 pivots form this pattern:
Pivot 1 → High (W1)
Pivot 2 → Low (W2)
Pivot 3 → High (W3)
Pivot 4 → Low (W4)
Pivot 5 → High (W5)
…the indicator treats this as a bullish 5-wave impulse.
When such a structure is detected, it “locks in” the wave prices and bars and draws the channels and labels.
Note: Pivots are only confirmed after Pivot Length bars, so swings are slightly delayed by design (standard pivot logic).
3. Channels & levels
Once a valid bullish 5-wave structure is found, the script builds three key pieces:
a) Base Acceleration Channel (Blue)
Anchored from Wave-2 low toward Wave-3 high.
This forms a rising acceleration channel that represents the impulse leg.
The channel extends to the right, so you can see how price interacts with it after W3–W5.
b) Wave-5 Target Line (Red, dashed)
Uses the height from Wave-2 low to Wave-3 high.
Projects a 1.618 extension of that height above Wave-3.
This line acts as a potential Wave-5 exhaustion zone (take-profit / reversal watch area).
c) Wave-2 / ABC Bottom Level (Green, dotted)
Horizontal line drawn at the Wave-2 low.
This acts as a retest / corrective target for the ABC correction after the impulse completes.
When price later revisits this area (within a tolerance), the script can mark it as a potential ABC bottom.
4. Labels & signals
If labels are enabled:
W1, W2, W3, W4, W5 are plotted directly on their corresponding pivot bars.
When an ABC-style retest is detected near the Wave-2 level, an “ABC” label is printed at that low.
Wave-5 Top Event
Triggered when a new valid bullish 5-wave structure is completed.
The last pivot high in the pattern is flagged as Wave-5.
ABC Bottom Event
After a Wave-5 impulse, the script watches for new low pivots.
If a new low forms within ABC Bottom Proximity (%) of the Wave-2 price, it is treated as an ABC bottom near Wave-2 and marked on the chart.
5. Inputs & customization
Show Fixed Channels
Toggle all channel drawing on/off.
Label Waves
Toggle plotting of W1–W5 and ABC labels.
Alerts: Wave-5 Top & ABC Bottom
Master switch for enabling the script’s alert conditions.
Pivot Length
Controls how “swingy” the detection is.
Smaller values → more frequent, smaller waves
Larger values → fewer, larger structural waves
ABC Bottom Proximity (%)
Allowed percentage distance between the ABC low and the Wave-2 price.
Example: 5% means any ABC low within ±5% of Wave-2 is considered valid.
6. Alerts (how to use them)
The script exposes two alertcondition() events:
Wave-5 Top (Bullish Impulse)
Fires when a new 5-wave bullish structure completes.
Use this to watch for potential exhaustion tops or to tighten stops.
ABC Bottom near Wave-2 Low
Fires when an ABC-style correction prints a low near the Wave-2 level.
Use this to stalk potential end-of-correction entries in the direction of the original impulse.
On TradingView, add an alert to the script and choose the desired condition from the dropdown.
7. How to use it in your trading
This tool is best used as a structural context layer, not a standalone system:
Identify bullish impulsive trends when a Wave-5 structure completes.
Use the Wave-5 target line as a potential area for:
Scaling out
Watching for exhaustion / divergences / reversal patterns
Use the Wave-2/ABC level and ABC Bottom signal:
To look for end of correction entries back in the trend direction
To align with your own confluence (support/resistance, volume, RSI, etc.)
It works well on crypto, FX, indices, and stocks, especially on higher timeframes where structure is cleaner.
8. Limitations & notes
This is a mechanical approximation of Elliott 5-wave theory — it will not match every analyst’s discretionary count.
Pivots are confirmed after Pivot Length bars, so signals are not instant; they’re based on completed swings.
The indicator currently focuses on bullish impulses (upward 5-wave structures).
As always, this is not financial advice. Combine it with your own strategy, risk management, and confirmation tools.
Created & coded by: Ron999
Built for traders who want wave structure + fixed channels, without the subjective Elliott argument on every chart. files.catbox.moe

Morning ORB FVG Trigger✅ Overview
Morning ORB FVG Trigger is a complete intraday trading framework built around:
A Morning Opening Range Breakout (ORB)
The first Fair Value Gap (FVG) after that breakout
Strict risk management and position sizing
Optional HTF trend filter (Daily / Weekly / Monthly)
Optional Daily ATR filter to avoid extreme days
The script is designed for futures / indices / FX on intraday charts up to 15 minutes and for traders who want a clean, mechanical entry framework with clear risk.
🧠 Core idea
Define a morning opening range (e.g. 09:30–09:45).
Wait for a clean breakout above/below that range.
After the breakout, wait for the first FVG in breakout direction,
confirmed by the next candle (no immediate full reclaim).
Use a chosen stop logic + R:R factor to build risk/reward boxes.
Calculate position size based on your account risk.
(Optional) Only take trades:
In the direction of the HTF EMA trend (D/W/M).
On days where the morning range is within a band of the Daily ATR.
You can also disable all signals/boxes and use the script just as a visual ORB tool.
⏰ 1. ORB / Morning Range
Inputs (Main section)
Morning Range Session
Time window of the opening range in exchange time
Example: 09:30–09:45 for a 15-minute ORB.
You can type custom ranges (e.g. 09:30–09:35 for a 5-minute ORB).
Risk/Reward (TP factor)
Multiplier for the take-profit distance relative to the stop.
2.0 = TP is 2× the stop distance
1.5 = TP is 1.5× the stop distance
Show ORB range
If enabled, draws:
ORB high/low lines
ORB labels (e.g. 15min ORB high / low)
Optional midline
Extend ORB lines to the right (bars)
How many bars to extend the ORB high/low horizontally beyond the ORB itself.
Trade box width (bars)
Horizontal width (in bars) of:
Red risk box (entry–stop)
Green reward box (entry–TP)
Implementation details
The ORB is always calculated on 1-minute data internally, so it stays precise even on 5m/15m charts.
The script only works on intraday timeframes up to 15 minutes.
📦 2. FVG Block
Group: “FVG”
Threshold %
Minimum size of an FVG in % of price.
0 = every FVG
Higher values = only larger gaps
Auto threshold (from volatility)
If enabled, the minimum FVG size is derived from historical volatility
instead of a fixed percentage.
Allow breakout FVG partly inside ORB
Off (default): the FVG must lie fully outside the ORB.
On: the breakout FVG itself may still overlap the ORB a bit,
as long as it is the first one attached to the breakout move.
Enable FVG entry signals, boxes & alerts
On: full system – FVG detection, entry labels, risk/TP boxes, alerts.
Off: no entries, no risk/TP boxes, no alerts.
You only get the ORB and (optionally) the HTF dashboard, so you can trade your own setups.
Entry mode
Entry mode (Mid / Edge / NextOpen)
Mid – Entry at the midpoint of the FVG.
Edge – Long at the upper FVG edge, short at the lower FVG edge.
NextOpen – No limit order in the gap. Entry is placed at the next bar open after FVG confirmation.
Edge offset (ticks)
Additional offset for Edge entries:
Long:
+ticks = a bit above the FVG (more conservative)
-ticks = deeper into the FVG (more aggressive)
Short:
+ticks = a bit below the FVG
-ticks = deeper into the FVG
FVG detection logic
Uses a LuxAlgo-style 3-candle FVG pattern (gap between candle 1 and 3).
Only one FVG is taken: the first valid FVG after the ORB breakout in breakup direction.
The FVG candle is the middle bar; the script:
Detects the FVG on the previous bar.
Waits for the current bar to confirm it:
Bullish: current low must stay above the lower FVG boundary
Bearish: current high must stay below the upper FVG boundary
Only then an entry signal is generated.
🛑 3. Stop Logic
Group: “Stop Logic”
Stop mode (PrevBar / Pivot / FVG Candle)
PrevBar – Stop at the low/high of the candle before the FVG
(tight/aggressive).
FVG Candle – Stop at the low/high of the FVG candle itself
(medium).
Pivot – Stop at the most recent swing high/low
using pivotLeft / pivotRight pivots (more conservative).
Ticks (stop buffer)
Offset (in ticks) from the selected stop level.
> 0 = further away (more room, more risk)
< 0 = closer (tighter stop)
Pivot left / Pivot right
Number of candles left/right to define a swing high/low
when using Pivot stop mode.
Typical intraday values: 2–3.
The script also sanity-checks the stop:
if the calculated stop would be invalid (e.g. above entry in a long), it moves it by a minimal distance (2 ticks) to keep a valid risk.
📈 4. HTF Trend Filter (Daily / Weekly / Monthly)
Group: “HTF Trend Filter”
Enable HTF trend filter
If enabled, trades are only allowed:
Long when at least 2 of D/W/M closes are above their EMA
Short when at least 2 of D/W/M closes are below their EMA
EMA length (D/W/M)
EMA length for all three higher timeframes (Daily, Weekly, Monthly).
This helps focus entries in the direction of the dominant higher-timeframe trend.
📊 5. ATR Filter (Daily)
Group: “ATR Filter (Daily)”
Use daily ATR filter
If enabled, the height of the ORB (ORB high – ORB low) must be within
a band of the Daily ATR to allow any signals.
Daily ATR length
ATR period on the Daily timeframe.
Min ORB size vs ATR
Lower bound:
Example: 0.3 → ORB must be at least 0.3 × Daily ATR
0.0 = no minimum.
Max ORB size vs ATR
Upper bound:
Example: 1.5 → ORB must be ≤ 1.5 × Daily ATR
0.0 = no maximum.
If the ORB is too small (choppy) or too large (exhausted move), no breakout or FVG signal will be generated on that day.
🧭 6. HTF Dashboard & Signal Labels
Group: “HTF Trend Dashboard”
Show HTF dashboard
Draws a small label at the top of the chart showing:
HTF Trend (EMA X)
D: UP/FLAT/DOWN
W: UP/FLAT/DOWN
M: UP/FLAT/DOWN
Dashboard position
Top Right, Top Center, Top Left – places the dashboard at the top.
Over Risk Info – no top dashboard; instead, the HTF trend info is shown as a label near the risk box when a new signal appears.
Lookback (bars) for top anchor
How many bars to use to determine the top price level for dashboard placement.
Show HTF trend above risk box on signal
Only relevant if Dashboard position = Over Risk Info.
When enabled, a small HTF label appears near the risk box for each new trade.
Signal label vertical offset (ticks)
Vertical spacing between risk info label and HTF label.
Minimum spacing HTF/Risk (ticks)
Ensures a minimum vertical distance so the two labels don’t overlap.
HTF signal label X offset (bars)
Horizontal offset (left/right) relative to the risk info label.
⏳ 7. ORB–FVG Filters (Session & Time Window)
Group: “ORB FVG Filter”
Only same session day
If enabled, FVG entries are only allowed on the same calendar day
as the ORB. When the date changes, all state & drawings are reset.
Limit hours after ORB
Enables a time window after the ORB end.
Trading window after ORB (hours)
Length of that window in hours.
Example: 2.0 → FVG signals only in the first 2 hours after ORB end.
💰 8. Risk Management & Position Sizing
Group: “Risk Management”
Calculate position size
If enabled, the script computes suggested mini and micro contract size for you.
Account size
Your trading account size (in account currency).
Risk mode
Percent – risk is a % of account size (Account risk %).
Fixed amount – risk is a fixed dollar amount (Fixed risk ($)).
Account risk %
Risk per trade as a percentage of account size (e.g. 1.0 for 1%).
Fixed risk ($)
Fixed risk per trade in dollars when using Fixed amount mode.
Micro factor (vs mini)
How much a micro contract is worth relative to a mini.
Example:
0.1 → one micro moves 1/10 of one mini.
Risk Info label
For each new trade, a label is shown above the boxes with:
Stop distance in price and $ risk per mini
Max risk allowed for the trade
Suggested mini and micro size
Text like:
Suggested: 2 mini
Suggested: 5 micro
or Suggested: no trade
This makes the script especially useful for prop-firm rules or strict risk discipline.
🎨 9. Visual Style (Boxes, Labels, ORB Lines)
Group: “Box & Label Style (Trade)”
Label font size (Very small, Small, Normal, Large)
Entry label BG / text color
Stop label BG / text color
TP label BG / text color
Risk info BG / text color
Risk box color (entry–stop zone)
Reward box color (entry–TP zone)
Group: “ORB Style”
ORB high line color
ORB low line color
ORB line width
ORB label font size
ORB label background color
ORB label text color
Show ORB midline
ORB midline color / width / style (Solid / Dashed / Dotted)
⚠️ 10. Alerts
Group: “Alerts”
The script defines three alert conditions:
Long entry FVG breakout
Triggered when a new long signal appears.
Short entry FVG breakout
Triggered when a new short signal appears.
FVG entry (long/short)
Generic alert for any new signal (long or short).
To use them:
Add the indicator to the chart.
Open the Alerts dialog → “Condition”.
Select this script and one of the alert conditions.
Set your preferred expiration and notification settings.
Alerts only fire when Enable FVG entry signals, boxes & alerts is on.
🧩 11. How the trading logic flows (summary)
Build ORB on 1-minute data during the selected session.
Optionally reject the day if ORB is outside the ATR bounds.
Wait for a breakout (close above high or below low), respecting HTF trend filter.
After breakout, look for the first valid FVG in that direction:
Outside the ORB (unless breakout FVG allowed inside)
Confirmed by the next candle (no full reclaim)
Once confirmed:
Compute entry, stop, target.
Draw risk/reward boxes and all labels.
Optionally show HTF signal label over the risk info.
Trigger alerts if enabled.
If you disable FVG signals, only steps 1–3 (plus dashboard) are effectively active.
⚠️ 12. Notes & Disclaimer
Script is intended for intraday trading up to 15-minute timeframes.
All signals are mechanical and do not guarantee profitability.
Always backtest and forward-test on your own data before risking real money.
This script is for educational purposes only and is not financial advice.
🚀 Quick-start guide
Add the script to your chart
Use an intraday timeframe ≤ 15 minutes (1m, 3m, 5m, 15m).
Works best on liquid indices, futures, FX and large-cap stocks.
Set the Morning Range
In “Morning Range Session” choose the exchange’s opening window.
Examples
US index futures (CME): 08:30–08:45 or 08:30–08:35
US stocks (NYSE/Nasdaq): 09:30–09:45 or 09:30–09:35
The ORB is always calculated on 1-minute data internally, so the range stays accurate on higher intraday charts.
Keep the default filters at first
HTF Trend Filter: ON
EMA length = 20
This will only allow trades in the direction of the dominant D/W/M trend.
ATR Filter: OFF (optional; you can enable later once you’re comfortable).
Use the full trade system
In the FVG group leave
“Enable FVG entry signals, boxes & alerts” = ON
Entry mode: Mid
Stop mode: FVG Candle or PrevBar
Risk/Reward: 2.0 as a starting point.
Set your risk
Turn on “Calculate position size”.
Enter your Account size and choose either:
Risk mode = Percent (e.g. 1.0 = 1% per trade), or
Risk mode = Fixed amount (e.g. $250 per trade).
The risk info label will show:
Stop distance in price and $/contract
Max allowed risk
Suggested mini and micro contract size.
Enable alerts (optional)
Open the Alerts dialog → Condition: this script.
Choose one of:
Long entry FVG breakout
Short entry FVG breakout
FVG entry (long/short)
Choose “Once per bar” or “Once per bar close”, and your preferred notification type.
Replay & journal
Use the TradingView bar replay tool to step through past days.
Focus on:
How the ORB defines the structure.
How the first confirmed FVG outside the ORB behaves.
Whether the risk/TP levels fit your own style and product.
🎛 Recommended settings & profiles
These are starting points, not rules. Always adapt to the instrument and your own risk tolerance.
1. Conservative / Trend-following
Timeframe: 5m or 15m
Morning Range Session: 15-minute ORB around the cash or futures open
FVG
Threshold %: 0.05–0.1 (filter out very small gaps)
Auto threshold: OFF (keep it simple)
Allow breakout FVG partly inside ORB: OFF
Enable FVG entry signals/boxes/alerts: ON
Entry mode: Mid
Stop Logic
Stop mode: Pivot
Pivot left/right: 2–3
Stop buffer: +1–2 ticks
HTF Trend Filter
Enabled: ON
EMA length: 20
ATR Filter
Enabled: ON
Daily ATR length: 14
Min ORB vs ATR: 0.3–0.4
Max ORB vs ATR: 1.2–1.5
Risk Management
Risk mode: Percent
Account risk: 0.5–1.0%
Idea: Only trade when the higher-timeframe trend supports the move and the opening range is of a “normal” size for the current volatility.
2. Balanced / Intraday directional
Timeframe: 3m or 5m
FVG
Threshold %: 0.02–0.05
Auto threshold: ON (lets the script adapt to volatility)
Allow breakout FVG partly inside ORB: ON
(first breakout FVG may partly sit inside the ORB)
Entry mode: Edge
Edge offset (ticks): 0 or +1
Stop Logic
Stop mode: FVG Candle
Stop buffer: 0–1 ticks
HTF Trend Filter
Enabled: ON
ATR Filter
Enabled: OFF (optional)
Risk Management
Risk mode: Percent
Account risk: 1.0–1.5% (if this fits your plan)
Idea: Slightly more aggressive entries at the gap edge, still aligned with HTF trend, but with more flexibility on ATR.
3. Aggressive / Scalping around the ORB
Timeframe: 1m or 3m
FVG
Threshold %: 0.0–0.02
Auto threshold: ON
Allow breakout FVG partly inside ORB: ON
Entry mode: NextOpen or Edge with a negative offset (deeper into the gap)
Stop Logic
Stop mode: PrevBar
Stop buffer: 0 or -1 tick
HTF Trend Filter
Enabled: OFF (or ON but treat as soft guidance)
ATR Filter
Enabled: OFF
Risk Management
Risk mode: Percent
Account risk: lower, e.g. 0.25–0.5% per trade
Idea: More trades and tighter stops. Best for experienced traders who understand the limitations of scalping and whipsaw risk.
Final reminder
All of these are templates, not guarantees:
Always check how the system behaves on your market and session.
Start on replay and demo before trading real money.
Adjust filters (HTF, ATR, thresholds) until the signals fit your personal approach.
