스크립트에서 "high low"에 대해 찾기
High Low priceThis indicator automatically shows the close price on the chart.
The highest and lowest close prices for the last 20 days are set by default but can be changed.


Highs Lows (with offset) + Median with ATR bandsScript shows Highest and Lowest values (default 10) for given bars back with possible offset on time assis (default 3) with their Median Line + ATR bands around it (no offset here).


High/Low Support FilterPreliminary version of a long support filter for use in future strategies.
V28: Release


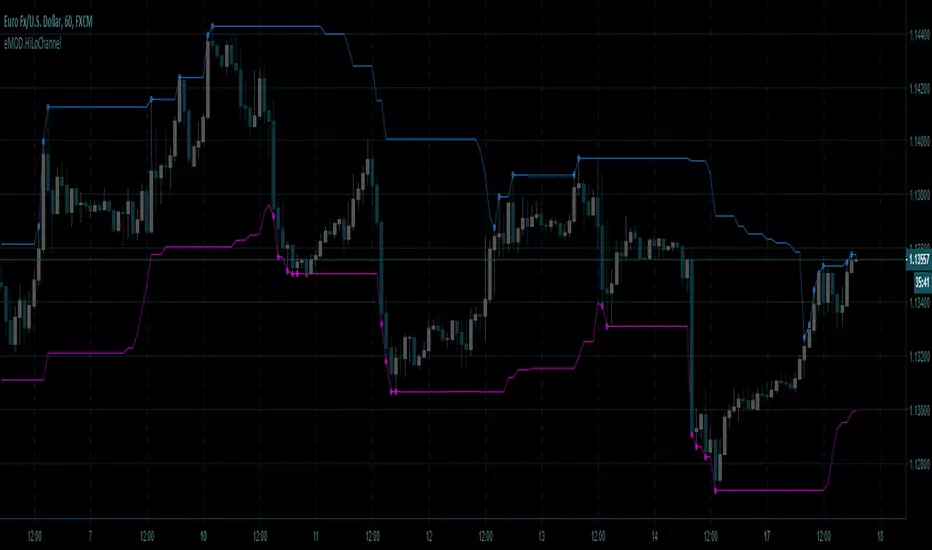
eMOD.HiLoChannel [enigma_trader]High / Low Channel Indicator for the last 'Period' bars
Version: 1.0.0
Created: 2018.12.17
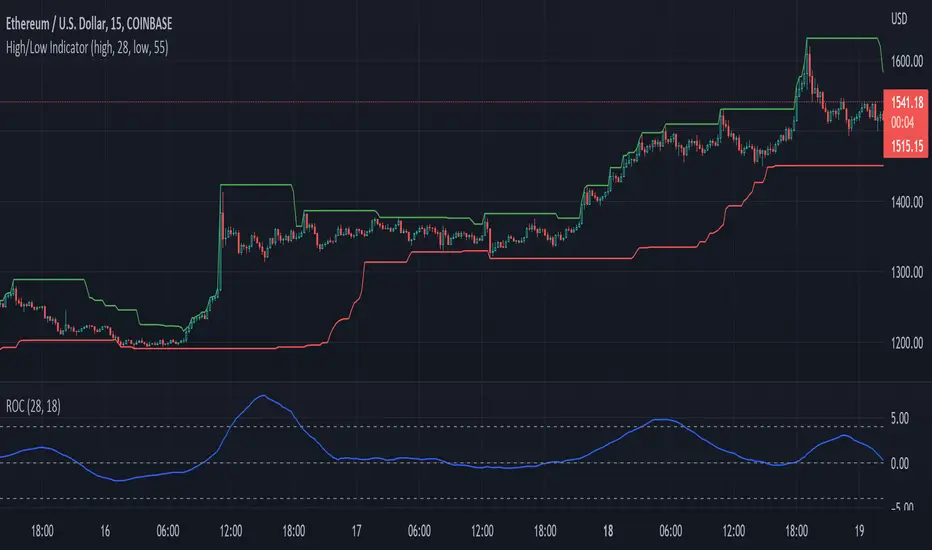
HIGH LOW by KIVANC fr3762Indicator plots the highest and lowest price levels in a certain period of user defined length EXCEPT LAST BAR!
the default value of bars counting back is 50 which can be optimized.


High_Low_ProjectionHigh Low Projections of daily/weekly/quarterly/yearly price movement. Dark/night mode version. Green when broken through to upside, red when broken through to bottom side.

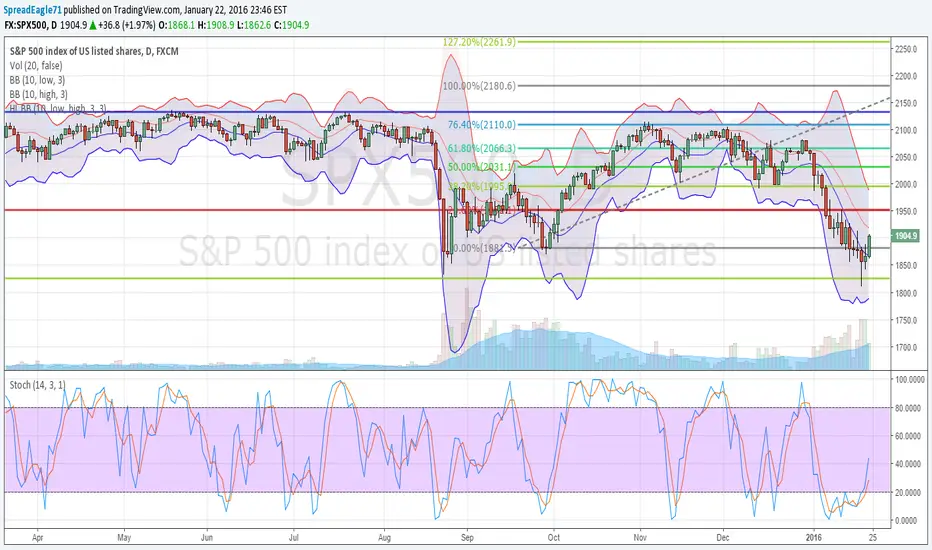
High Low Bollinger Bands Better than Bollinger Bands for finding extreme points timed by an oscillator where the price is statistically likely to stay inside the boundaries.
Good for setting credit spreads such as call and put vertical spreads.

Opening Power Bar Strategy (Trade Your Edge)💎 GENERAL OVERVIEW:
The Opening Power Bar Strategy indicator identifies high-momentum “Power Bars” during the first 60 minutes of the New York session and generates Long/Short signals using levels from the pre-market session. The indicator plots Stop-Loss and three Take-Profit levels, manages dynamic trailing stop-loss logic (optional), displays pre-market levels, and supports alerts.
This indicator was developed by Flux Charts in collaboration with Steven Adams (Trade Your Edge).
🔹What is the purpose of the Opening Power Bar Strategy?:
The purpose of the Opening Power Bar Strategy is to trade the most active and meaningful part of the trading day, the opening move. It’s designed to take advantage of the volume and volatility that happens right after the market opens, when traders react to overnight news and pre-market movement. The indicator helps identify when that early move has real strength by looking for a large, decisive candle (a Power Bar) forming around key pre-market levels. Once it detects one, it builds a full trade plan automatically with entry, stop-loss, and take-profits.
🔹Why are signals only during the first 60 minutes?:
Most of the day’s total trading volume happens within the first 60 minutes after the market opens. This period usually sets the high or low of the day and defines the bias: whether the market will trend or stay in a range. After this first hour, volume and volatility typically decrease, and price movement becomes less consistent.
🔹What’s the theory behind the Opening Power Bar Strategy?:
The Opening Power Bar Strategy is built on a simple principle: the first hour after the market open sets the tone for the rest of the day. This period consistently shows the highest trading volume, as traders react to overnight news, economic data releases, pre-market movements, etc.
These early reactions often establish the day’s high/low, revealing where buyers or sellers are strongest. When a large, decisive candle (a Power Bar) forms during this time near the pre-market high or low, it confirms that one side is taking control. The pre-market high and low define the range that institutions and short-term traders had already reacted to before the market open. Thus, when a Power Bar forms near one of these levels during the first hour, it often marks the start of a breakout or rejection that shapes the rest of the session.
🎯 OPENING POWER BAR STRATEGY FEATURES:
The Opening Power Bar Strategy indicator includes 5 main features:
Power Bars
Pre-Market High / Low / Mid Levels
Long / Short Signals + Risk Management
Simple Moving Average (SMA)
Alerts
1️⃣ Power Bars:
🔹What are Power Bars?:
Power Bars are large, high-momentum candles that show strength in one direction of the market. They form when a candle’s body (the distance between open and close) dominates most of the candle’s total range (the distance between high and low), meaning price moved strongly in one direction with little to no pullback. To qualify, the candle must also be large relative to nearby candles. This size difference confirms that the candle is a true burst of momentum. In short, Power Bars reveal where real strength has just entered the market and where momentum is most likely to continue.
🔹How to interpret and use Power Bars:
When a Power Bar forms, it signals that price just made a strong directional move with little to no pullback. Traders can use these bars to identify momentum shifts and potential trade setups during the opening session.
A bullish Power Bar means buyers controlled the entire candle, often marking the start of upward momentum. A bearish Power Bar means sellers were in control the entire candle, often signaling the start of downwards momentum. In the Opening Power Bar Strategy, these candles are only used for signals when they appear within the pre-market high and low range. Their location relative to the pre-market midline determines direction bias:
Bullish Power Bars forming near the pre-market low can signal potential long opportunities.
Bearish Power Bars forming near the pre-market high can signal potential short opportunities.
🔹How are Power Bars identified?:
Power Bars are detected and confirmed only after the candle closes, ensuring that the full candlestick body and range can be measured. The indicator does not repaint or change past bars. Once a Power Bar is confirmed, it stays fixed on the chart. Power Bars can be detected on any timeframe or symbol that produces standard candlestick data. However, since the Opening Power Bar Strategy focuses on the first 60 minutes of the trading session, they’re most meaningful on lower intraday timeframes such as 1-minute to 5-minute charts.
The indicator identifies Power Bars using two user-defined inputs: Sensitivity and Body %.
🔹Sensitivity:
The Sensitivity setting determines how large a candle’s body must be relative to nearby candles. It uses the Average True Range (ATR) to compare the current candle’s size with recent candles, and the Sensitivity value acts as a multiplier of that ATR. A higher Sensitivity value means the candle must be much larger than recent candles to qualify, so fewer Power Bars will form. A lower value makes the filter less strict, allowing more candles to qualify.
🔹Body %:
The Body % setting controls what percentage of the candle’s total range must be body rather than Wick. A higher value requires the body to take up more of the candle’s total range, so fewer candles pass the filter. A lower value allows candles with more wick to qualify, so more Power Bars will form.
Body % Example:
If Body % is set to 50, the candle body must cover at least half of the candle’s total range. For example, if a candle’s high is $11, its low is $10, its open is $10.20, and its close is $10.80, then the total range is $1 ($11 - $10) and the body is $0.60 ($10.80 - $10.20). Body % = (Body / Total Range) * 100 = (0.60 ÷ 1.00 × 100) = 60%. Since 60% is greater than the input of 50%, this candle passes the Body % criteria.
Once a candlestick closes and it meets both the Sensitivity and Body % requirements, it will be plotted in a different color, using barcolor() function. Users can adjust the bullish/bearish colors of Power Bars by adjusting the ‘Candle Coloring’ setting. The Power Bar candle coloring is purely visual and does not affect signal logic or strategy calculations.
🔹Do Power Bars form outside the first 60 minutes?:
Power Bars can technically form at any time of day, but the Opening Power Bar Strategy only uses those formed between 9:30 AM and 10:30 AM ET for trade signals.
2️⃣ Pre-Market Levels
The indicator tracks pre-market price action from 4:10 AM EST until 9:29 AM EST to determine the session’s High and Low. When pre-market ends, both levels are drawn and continuously projected to the right throughout the regular session. A midline is calculated as the midpoint between those levels and is used to determine bullish or bearish bias at the open. This midline is calculated in the indicator’s background and not visually plotted.
Long signals require price to be positioned below the midline before breaking upward, and Short signals require price to be positioned above the midline before breaking downward.
Users can enable retest labels, which appear if price touches the pre-market low, and closes above it, or if price touches the pre-market high, and closes below it. Users can also enable/disable the pre-market levels. If disabled, the pre-market high and pre-market low levels will not be displayed.
3️⃣Long/Short Signals:
Long and Short signals only trigger during the first hour of the New York trading session, between 9:30 AM and 10:30 AM EST. These signals form between the Pre-Market Low (PML) and Pre-Market High (PMH).
▫️ A Long entry requires:
1) A bullish power bar forms
1.a) The candle’s low is < the 50% area or Midpoint of the PML/PMH range
1.b) The candle closes above the PML, but below the PMH
2) If this candle occurs between 09:30 AM and 10:30 AM, a long signal will appear.
▫️ A Short Entry requires:
1) A bearish power bar forms
1a) The candle’s high is > the 50% area or Midpoint of the PML/PMH range
1b) The candle closes below the PMH, but above the PML
2) If this candle occurs between 09:30 AM and 10:30 AM, a short signal will appear.
Only one trade can be active at a time. Users can enable or disable Long Signals and Short Signals independently. Entry markers appear directly on the chart at confirmation.
When a signal is plotted on the Power Bar’s candle close, the indicator automatically builds a rule-based trade structure and plots the following information:
Stop-Loss (SL)
Take-Profit 1 (TP 1)
Take-Profit 2 (TP 2)
Take-Profit 3 (TP 3)
For Long signals, the SL is placed at the low of the bullish Power Bar and TP 1 is placed at the PMH. The distances for TP 2 and TP 3 are then measured using the move from the entry price to TP 1. That same distance is added once above TP 1 to set TP 2, and added again above TP 2 to set TP 3.
For Short signals, the SL is placed at the high of the bearish Power Bar, and TP 1 is placed at the PML. The distances for TP 2 and TP 3 are then measured using the absolute value of the move from the entry price to TP 1. That same distance is subtracted once below TP 1 to set TP 2, and subtracted again below TP 2 to set TP 3.
🔹Trailing Stop-Loss Feature:
When the Trailing Stop-Loss setting is enabled, the Stop-Loss (SL) automatically adjusts as price reaches take-profit levels. This feature helps secure profits while keeping the trade logic completely rule-based and non-discretionary.
Here’s exactly how it works step-by-step:
▫️ Initial Stop-Loss placement:
For a Long trade, the initial SL is set at the low of the Power Bar that triggered the entry.
For a Short trade, the initial SL is set at the high of the Power Bar that triggered the entry.
This level stays fixed until one of the Take-Profit targets is reached.
▫️ After TP 1 is hit:
The SL automatically moves to the entry price (breakeven).
This eliminates all downside risk on the trade.
▫️ After TP2 is hit:
The SL automatically moves to TP 1
This locks in a partial profit while allowing the trade to continue toward TP 3.
▫️ Final exit condition:
The trade is considered complete once either the trailing Stop-Loss or TP 3 is reached.
4️⃣Simple Moving Average (SMA)
In addition to the core trade logic, the indicator includes an optional Simple Moving Average (SMA) that provides extra confirmation and context for interpreting Power Bar signals. The SMA is not related to any of the signal generation logic. It does not influence when or where Power Bars or trade signals appear. Instead, it serves as a contextual confirmation tool and should be used as an additional way to interpret the strength and quality of a setup once a signal is triggered.
There are a few ways the SMA can be used for extra context with the Opening Power Bar Strategy:
▫️ #1 Directional Confirmation:
The SMA is mainly used as a confirmation tool for countertrend Power Bar setups. It helps traders identify when a strong reversal may be developing against the prior trend.
When the SMA is sloping downward but a bullish Power Bar closes above it, that can signal a potential shift from bearish to bullish momentum.
When the SMA is sloping upward but a bearish Power Bar closes below it, that can indicate a possible transition from bullish to bearish conditions.
▫️ #2 Timing Entries
When a large Power Bar prints a signal far away from the SMA, it often indicates that price has moved quickly and temporarily extended away from its average level. In these cases, the SMA can be used as a pullback area where price may retrace before resuming its move. Waiting for this pullback can often lead to a better risk-to-reward trade setup.
For example, in the chart below, a strong bullish Power Bar formed and triggered a Long signal while closing well above the SMA. Entering immediately after the signal would have produced a 0.22 risk-to-reward to TP 1. However, waiting for price to retrace back toward the SMA before entering would have resulted in a much stronger 2.46 risk-to-reward ratio.
The SMA provides a simple way to identify areas for safer pullback entries when a Power Bar signal forms too far from its average level. This helps traders maintain consistency with their risk-to-reward targets and align entries with their trading plan.
▫️ #3 Risk/Trade Management:
During active trades, the SMA can also be used to gauge the healthiness of a trend.
If price continues to respect the SMA after entry, it supports holding the position toward later Take-Profit levels. Additionally, the SMA can highlight areas where traders may consider adding to existing positions if price respects it.
If price closes strongly back through the SMA in the opposite direction, traders may use that as an early exit or a signal that momentum has shifted.
▫️ Optional and Visual Only:
The SMA is an optional visual overlay that can be turned on or off in the indicator’s settings. It is purely there for traders who want an added layer of confirmation and structure when evaluating setups from the Opening Power Bar Strategy.
Users can customize the length of the SMA and the color within the settings.
📢 Alerts:
The indicator supports alerts, so you never miss a key market move. You can choose to receive alerts for each of the following conditions:
Long Signal
Short Signal
TP 1 (Take-Profit 1)
TP 2 (Take-Profit 2)
TP 3 (Take-Profit 3)
SL (Stop-Loss)
Pre-Market Low Retest
Pre-Market High Retest
🚩UNIQUENESS:
This indicator automates a structured opening-range strategy that traders typically manage manually each morning. It identifies valid Power Bars only when they occur inside the pre-market high/low range, confirms direction using pre-market midline context, and automatically builds risk targets using the pre-market range itself. Once a valid trigger occurs during the defined trade window, the indicator immediately generates a complete trade idea (entry/SL/TP 1-3) with built-in trailing logic and alerts.

GardFx - Fusion Pro FREE TrialFusion Pro - by GardFx
This script is a specialized session-trading system designed to capitalize on the Opening Range Breakout (ORB) by utilizing Fair Value Gaps (FVG) as entry confirmation zones. Unlike standard breakout indicators that signal immediately upon a range break, this system waits for a price retest (mitigation) of specific imbalances created during the breakout move.
Core Concept
The strategy operates on a three-step logic sequence:
Define the Range: It establishes the High and Low of the opening session (London or New York).
Identify Imbalance: Upon a breakout of this range, the script scans for the creation of a Fair Value Gap (FVG) on the 1-minute timeframe.
Confirm Entry: It waits for price to retrace into the FVG (mitigation) and looks for specific candle confirmation patterns before generating a signal.
Detailed Methodology
1. The Opening Range (ORB)
The script monitors the first 15 minutes of the session (configurable).
High Line: The highest price reached during the first 15m.
Low Line: The lowest price reached during the first 15m.
Breakout: A breakout is validated when a candle closes outside of this defined range.
2. Fair Value Gap (FVG) Detection
Shutterstock
Not all breakouts are valid. This script filters for momentum by requiring an FVG to form immediately following the breakout.
Bullish FVG: Defined when the Low of Candle 1 is higher than the High of Candle 3.
Bearish FVG: Defined when the High of Candle 1 is lower than the Low of Candle 3.
Note: If an FVG is not formed shortly after the breakout, the setup is considered low-probability and ignored.
3. Entry Confirmation Models Once an FVG is identified and price returns to mitigate it, the script offers three confirmation modes:
Instant (First Touch): Aggressive entry immediately when price touches the FVG box.
Reversal Close: Waits for a candle to close in the direction of the trend after touching the FVG (e.g., a green candle close after dipping into a bullish FVG).
Engulfing Candle: The most conservative filter. Requires a full engulfing candle pattern occurring within or bouncing off the FVG.
4. Advanced Filters To reduce false signals during choppy markets, two optional filters are included:
Volume Filter: Requires the breakout candle's volume to be higher than its Moving Average (multiplied by a user-defined factor).
Higher Timeframe (HTF) Trend: Checks the trend on a higher timeframe (e.g., 1H or 4H).
Logic: If the HTF Close is > HTF EMA 50, only Buy signals are permitted. If HTF Close < HTF EMA 50, only Sell signals are permitted.
5. Risk Management The script includes an automated Risk/Reward calculator.
Stop Loss (SL): Placed at the invalidation point of the FVG structure, plus an optional ATR buffer to account for volatility.
Take Profit (TP): Calculated based on a user-defined Risk:Reward ratio (e.g., 1:2) relative to the Stop Loss distance.
Dashboard A multi-timeframe dashboard is displayed to provide a "Glance View" of market bias across the Daily, 4H, 1H, and 15M timeframes, ensuring trades are aligned with macro momentum.
3 hours ago
Release Notes
🚀 GardFx - Fusion Pro V2: The Ultimate ORB & ICT Suite
Welcome to Version 2.0 of Fusion Pro. This update transforms the indicator from a simple breakout tool into a complete institutional trading system. We have integrated Multi-Timeframe (MTF) logic, Candlestick Pattern recognition, and Smart Exit management to filter out noise and catch high-probability moves.
🔥 NEW FEATURES IN V2:
1. 🧠 Smart MTF Bias & Voting System
No more guessing the trend. The script now checks Daily, 4H, 1H, and 15m timeframes.
Voting Logic: A trade is only signaled if the higher timeframes agree (e.g., 2 out of 3 votes).
Visuals: The dashboard displays the live bias for every timeframe.
2. 🎯 Advanced Entry Confirmations We have added specific trigger patterns to reduce fake-outs. You can now choose your entry style:
🦄 Unicorn Setup: ORB Level + FVG overlap.
🕯️ Candlestick Patterns: Pinbar, Engulfing, Tweezer Tops/Bottoms, and Inside Bar.
📉 FVG 50%: Wait for price to retrace to the 50% equilibrium of the gap before entering.
3. 🛡️ Entry Validation Modes Control exactly when the entry label fires:
Instant: Enters immediately upon touch.
Candle Close: Waits for the candle to close in your direction.
Break of High/Low: Places a pending order at the wick; only enters if momentum breaks that level.
Wait for MSS: Waits for a Market Structure Shift (local high/low break).
4. 💰 Dynamic Smart Exit (Secure TP)
A new Volume-Based Exit Manager detects sudden momentum shifts or volume spikes against your position.
It prints a "Secure TP" label to help you bank profits before a reversal occurs, even if the fixed TP hasn't been hit.
5. 📊 Enhanced Dashboard & Stats
Tracks Win/Loss rates separately for Asia, London, and New York sessions.
Weekly and Daily stats reset automatically.
Fully customizable size and position.
6. ⚡ Automated UK Sessions
Built-in timings for Asia, London, and New York based on UTC (London) time. No more timezone conversion headaches.

SMC Structure & Expectation [WavesUnchained]SMC Structure & Expectation - Professional Context & Confirmation Tool
A sophisticated Smart Money Concepts indicator that combines objective market structure analysis with intelligent expectation logic and professional order block validation. Built for traders who value context over signal spam.
4-LAYER ARCHITECTURE
Layer 1: Market Structure
✓ Objective HH/HL/LH/LL detection based on confirmed pivot swings
✓ Internal structure tracking (micro swings within major legs)
✓ Structure alignment detection (Internal + External agreement)
✓ No predictions - pure price action description
Layer 2: Expectation/Bias
✓ Logical hypotheses derived from current structure
✓ "Expect HL" in bullish structure / "Expect LH" in bearish structure
✓ "Expect Continuation" after BOS events
✓ Expectation ≠ Signal (can be wrong, that's the point)
Layer 3: Confirmation (BOS + Order Blocks)
✓ Break of Structure (BOS) detection with 2 modes:
• Conservative: Close-cross (default)
• Aggressive: High/Low-cross with optional close confirmation
✓ Professional Order Block System with 8 intelligent filters
✓ Only creates OBs when expectation is met
✓ Maximum 1 OB per direction (quality over quantity)
Layer 4: Optional Warnings
✓ Trendline break detection
✓ Early Top/Bottom warnings (volume + volatility divergence)
✓ Can be disabled for clean chart focus
PROFESSIONAL ORDER BLOCK SYSTEM
8 Quality Filters (Cascade Logic):
1. BOS-Only Guard : No OB without confirmed Break of Structure
2. Displacement Filter : Minimum 1.0 ATR momentum (customizable)
3. Location Filter : Must be in Premium (bearish) or Discount (bullish) zone
4. Size Filter : 3 modes available:
• Hard Limit: Reject oversized OBs (strict)
• Score Penalty: Allow but reduce priority (balanced, default)
• Disabled: No size filtering (permissive)
5. Volume Filter : Optional relative volume threshold
6. FVG Filter : Optional Fair Value Gap requirement
7. Mitigation Tracking : 30% penetration = mitigated (score penalty)
8. TTL (Time-To-Live) : Auto-delete after 80 bars (prevents chart clutter)
Priority Scoring System (0-100):
• HIGH Priority (>80) : Bright colors, zero transparency
• MED Priority (50-80) : Normal colors, 30% transparency
• LOW Priority (<50) : Faded colors, 60% transparency
Score Components:
✓ Displacement strength (10-30 points)
✓ FVG confluence (+20 points)
✓ Relative volume (+5-15 points)
✓ Premium/Discount location (+10-20 points)
✓ Structure alignment (+30 points if aligned, -15 if conflict)
✓ Leg strength (+15-25 points for strong impulse vs correction ratio)
✓ Size penalty (-0 to -30 points if oversized, Score Penalty mode only)
BAR COLORING MODES
Choose your preferred visual feedback:
1. Off : No bar coloring
2. Structure : Bullish/Bearish/Neutral structure states
3. Expectation : Continuation zones (green = expect bullish, red = expect bearish)
4. BOS + OB Priority (Default):
• Highlights active Order Blocks by priority
• BOS events in bright neon
• Faded structure colors when no OB active
5. Multi-Layer : Combines structure + priority intensity
6. Alignment : Shows Internal/External structure alignment (orange = conflict warning)
INTELLIGENT LOGGING SYSTEM
Priority-based log filtering to reduce noise:
• All : Every event (debug mode)
• MED+ : Only medium and high priority events
• HIGH Only : Only high priority setups
• Smart (Default): Adaptive filtering based on priority + context
Logs include:
✓ Structure changes (HH/HL/LH/LL)
✓ Expectation updates
✓ BOS events with confirmation status
✓ OB creation with full scoring breakdown
✓ OB reactions (Tap/Deep/Failure classification)
✓ Rejection reasons with "Potential Lost" analysis
CONFIGURATION HIGHLIGHTS
Layer 1: Structure
• Pivot detection length: 5 (left) / 5 (right)
• Internal structure: Optional micro-swing tracking
• Swing confirmation: Closes beyond pivot required
Layer 2: Expectation
• Expectation expiry: 40 bars (auto-reset after timeout)
• Visual feedback: Labels + optional expectation zones
Layer 3: Confirmation
• BOS Mode: Close-cross (conservative) / High/Low-cross (aggressive)
• Close Confirmation: Optional 3-bar window for aggro mode
• Displacement: Min 1.0 ATR (customizable)
• Size Filter Mode: Hard Limit / Score Penalty / Disabled
• OB Location: 38% discount / 62% premium thresholds
• OB Size Range: 0.3-1.2 ATR (customizable)
• TTL: 80 bars default
• Volume Filter: Optional, 1.0x minimum
• FVG Requirement: Optional
Layer 4: Warnings
• Trendline break detection
• Early Top/Bottom signals
• Can be fully disabled
BEST USE CASES
✓ Context Tool : Understand where you are in the market cycle
✓ Confirmation Filter : Validate trade ideas with structure alignment
✓ Order Block Trading : High-probability zones with priority scoring
✓ Educational : Learn SMC concepts with transparent logic
✓ Multi-Timeframe Analysis : Combine with HTF structure for confluence
Optimized for:
• Commodities (NatGas, Gold, Oil)
• 1H - 4H timeframes
• Swing trading / Intraday positioning
KEY FEATURES SUMMARY
✓ Zero signal spam - only high-conviction setups
✓ Transparent scoring system - know why each OB matters
✓ Adaptive to market conditions - structure alignment detection
✓ Flexible filtering - customize to your risk tolerance
✓ Priority-based visuals - instantly identify best opportunities
✓ Professional logging - learn from rejections and acceptances
✓ Clean chart - auto-cleanup with TTL system
✓ Bar coloring modes - choose your visual feedback style
✓ Size Filter Mode - prevent blocking of high-quality oversized setups
PHILOSOPHY
This indicator follows the principle: "Context over signals, quality over quantity"
Expectations can be wrong - that's the point. They help you stay aware of the most likely scenario while remaining open to structure changes. When expectation is met AND confirmed by BOS + quality OB, you get a high-conviction setup.
Not a holy grail. Not a signal service. A professional analysis tool.
Version: 1.0.0
Author: WavesUnchained
Pine Script: v6

QuantCrawler ORB Break & Retest 15m - Opening Range StrategyThis indicator automates the 15-minute Opening Range Breakout and Retest strategy. It captures the high, low, and midpoint of the first 15-minute candle, then monitors for confirmed breakouts followed by midpoint retests to generate entry signals.
HOW IT WORKS
1. Captures the high, low, and midpoint of the first 15-minute candle (default 8:00-8:15 premarket)
2. Waits for price to close beyond the OR high or low by your specified breakout distance
3. After breakout confirmation, monitors for price to pull back and touch the midpoint
4. Signals LONG after bullish breakout + midpoint retest
5. Signals SHORT after bearish breakout + midpoint retest
6. Resets after each signal allowing multiple setups per session
WHY 15-MINUTE ORB
The 15-minute Opening Range captures more price action than a 5-minute OR, often providing stronger support/resistance levels. The 8:00 AM default captures premarket activity before the 9:30 open, giving you levels established before the crowd arrives.
WHY BREAKOUT + RETEST
Entering on the initial breakout often results in chop and false signals. This indicator requires confirmation - price must first prove direction by closing beyond the breakout distance, then offer a pullback entry at the midpoint. This filters out many failed breakouts.
SETTINGS
- Breakout Distance - Points beyond OR zone required to confirm breakout
- Timezone - Select your market timezone
- Opening Range Time - Customizable (default 8:00-8:15)
- Session End Time - When to stop monitoring (default 4:00 PM)
VISUAL OUTPUT
- Green line - OR High
- Red line - OR Low
- Orange dotted line - OR Midpoint
- Status box displays current state (Watching, Active, Closed)
ALERTS
Built-in alerts for Long Entry, Short Entry, or Any Entry.
Works on any timeframe chart. The indicator pulls 15-minute data automatically using request.security().
