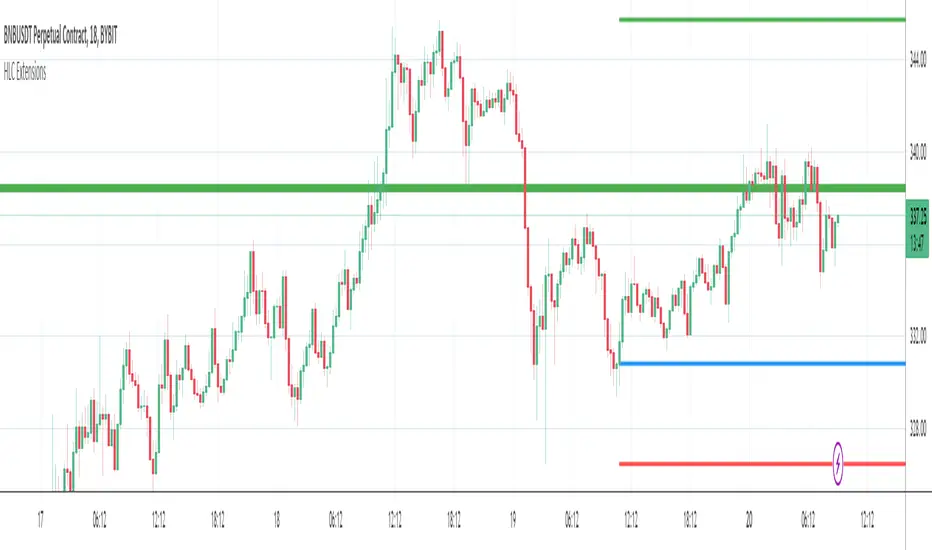
Yesterdays & Last Weeks High Low Close ExtensionsPlots the Extensions of Yesterdays and Last Weeks High Low Close
Unfortunately all of the levels wont always show therefore it is good use this in conjunction with my Levels script
I tried to combine the 2 scripts but doing so gave me memory overload errors in Tradingview thats why I have made them separate
스크립트에서 "high low"에 대해 찾기
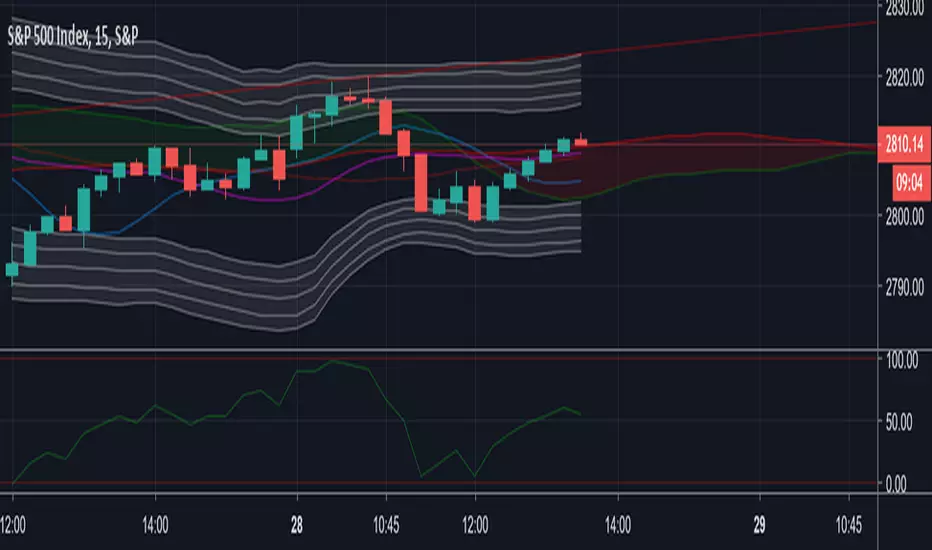
Peak Profit v2 (Reversal Points & High/Low Waveform)This script includes two different methods of indication.
It includes a High/Low Waveform . It is a technical indicator that is best performed when using a trailing stop, it also works well as a trend line.
Trade with caution however the general idea is to buy when line turns green, and sell when the line turns red.
This can be disabled by clicking the checkmark in the visual settings of the script.
Second Feature is an indicator for Reversal points . These show a price to "enter long" and "take profit"
This part of the script looks for a series of consecutive closes greater than or less four closing price bars to define an underlying uptrend or downtrend.
In general, minor price reversals are associated with the completion of the trend and major market turning points are identified by the completion of a trend of a specific series of bar openings/closes.
As always, this script should not be relied upon alone for your sole indication of buying and selling. Use your own intuition and other indicators along with this one for the best results.

QMWD RangerThis script will display the previouse Highs, Lows and Mid of the last:
- Quarter
- Month
- Week
- Day
Ranges
Its pretty good in finding potential pivot areas.

Open/High/Low/Close (OHLC) Lines with Configurable TimeframeThis script draws open/high/low/close (OHLC) lines for the previous bar from the configured timeframe. This enables you to use higher timeframes, like a daily chart and OHLC lines of the previous week.

Pivot point with CPR, historical, high low and openThis script generates pivot points up to 10 level with CPR levels for Daily, Weekly, Monthly & Yearly
along with resolution for Daily, Weekly, Monthly & Yearly
along with High, low and close for that resolution
can check historical levels for the resolution as well.
the pivot auto adjusts even when you change the chart pattern to heikin ashi, renko or any other.. unlike system pivot.
change the time frame & resolution to required setting like
"Daily" & "D"
"Weekly" & "W"
"Monthly" & "M"
"Yearly" & "12M"


[Angelhouse]_Ichimoku_Pivot(High/Low)HI^^
A trend band was created using the ichimoku baseline.
The top is the line that follows the peak of 26 peaks.
The bottom line follows the lowest point of 26 sticks.
Interruption is an existing baseline.
The cloud display has been changed to the 1 day.
We also added a Pivot (High/Low) line.

Haru High Low Box ALLHere is an an indicator for showing Monthly, Weekly, Daily high low box.
It shows indication when you select each one.
You can select Daily only, Monthly, Weekly, Daily, or even all of them.
This one indicates Daily Box per 15 min.
小さな足のチャートにも、月足と週足と日足の高値安値ボックスが表示できるインジケーターになります。
それぞれ選択して描写することが可能です。
日足だけだったり、月足週足日足全てだったり複数選択も可能。
こちらは15分足に日足のボックスを表示させたものになります。

Yearly OHLplots Yearly Open, High, Low levels
Interesting interactions to note at previous yearly opens

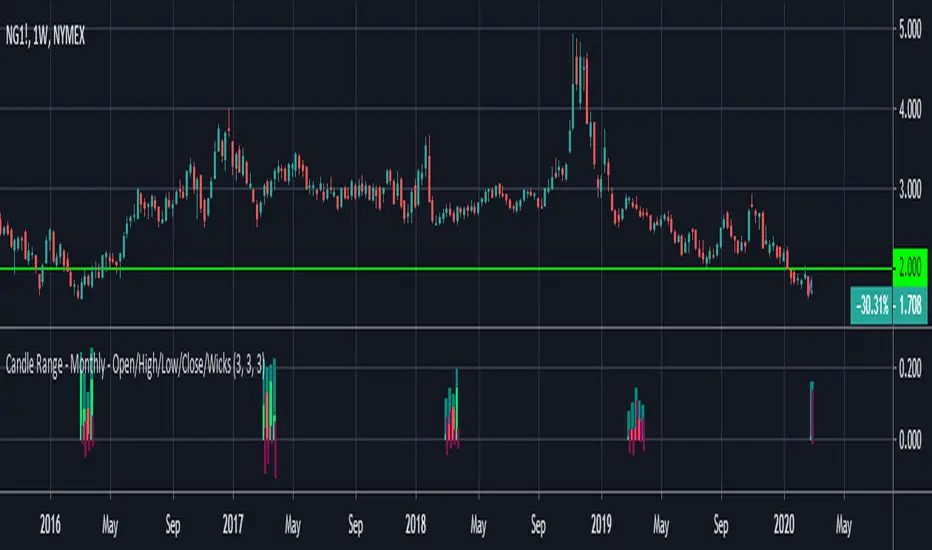
Candle Range - Monthly - Open/High/Low/Close/Wicks (Oldinvestor)This candle range comparison is similar to my original script Candle Range Compare .
This script is to compares the size of open/close high/low and wick size side by side. This version of the script allows you to only show a chosen month of each year to compare. I hadn't even thought to try and vanish the part of the chart I'm not looking at. I'll consider that later (may never happen, I am limited on time).
I have also included check boxes to turn on/off certain candles. This part is pretty self explanatory. For example: if you wish to not see wicks in front of the open/close, go to the settings for the study and uncheck the box for "Show Wicks".
Warning: The script does not work so well on monthly candles? Some of the candles are missing...
Good luck
Oldinvestor

Custom Time ranges. Daily price ranges.Addition to previous time range script, now containing daily ranges. You can select a day of the week, and have it show the high, low, mid, and open of that day.
For the time bands:
Monday = 2
Tuesday = 3
Wednesday = 4
Thursday = 5
Friday = 6
Saturday = 7
Sunday = 1
Example 1:
1500-1800:2
This will colour the background between 3pm and 6pm on Mondays.
Example 2:
0000-0600:247
This will colour the background between midnight and 6am on Mondays, Wednesdays, and Saturdays.
For the Daily price ranges:
Just select the tick-box forthe day, and then the price levels you'd like to see.
I want to add specific weekly levels to this, for example: week 06 of year 2020, but I've not figured out how to do it yet. If anyone knows, I'd appreciate it if you let me know. I'll then update this script.
As always, any questions you may have, please leave in comments below and I'll respond when I have time.
If you notice anything good with this indicator, let me know. We are all in this to make money after all! ;)

MB DAILY CPR, HIGH, LOW, RESISTANCE AND SUPPORTThis script is based on Franklin O. Ochoa's "Secrets of a Pivot Boss". This script shows daily CPR with R1 to R4 and S1 to S4, previous day high, low, This script mostly works for swing, scalping and intraday.
Recommended to back test before use.
By using this script I will not accept liability for any loss or damage, including without limitation any loss of profit.

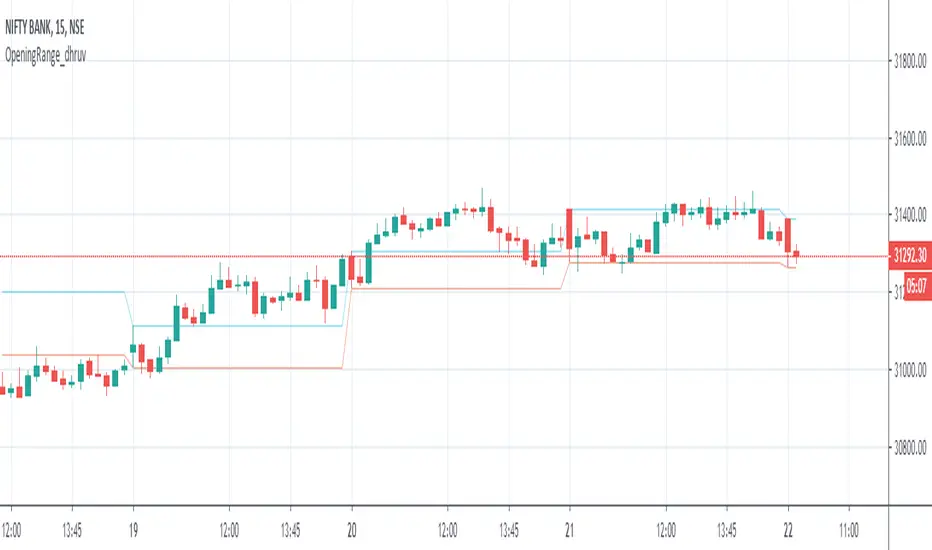
Opening Range_dhruvHello Traders ..
this is the strategy for opening range 15 min high low auto marking tool
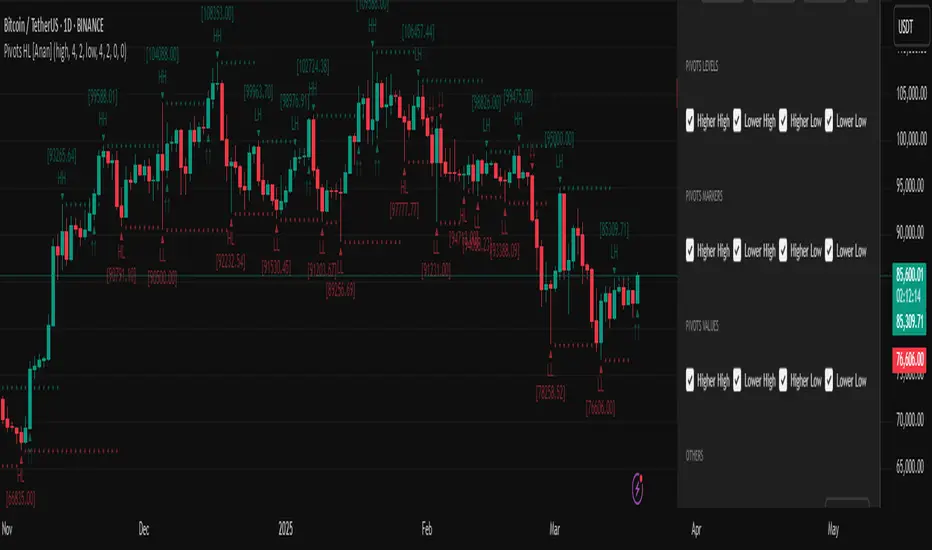
Pivot Points High Low (HH/HL/LH/LL) [Anan]Hello Friends,
This is my own version of ( Pivot Hilo Support n Resistance Levels R3-3 by JustUncleL )
- V4 Pinescript
- Removed MA dependency filters
- Add some arrows

Previous OHLC LevelsQuick dirty code for personal use. Plots previous OHLC levels based on a selected time-frame on the chart.
Not bad if you want to see different time-frame levels.
Fill function can serve to highlight the daily range (high-low or open-close) on non-standard charts
Uses base code from JayRogers

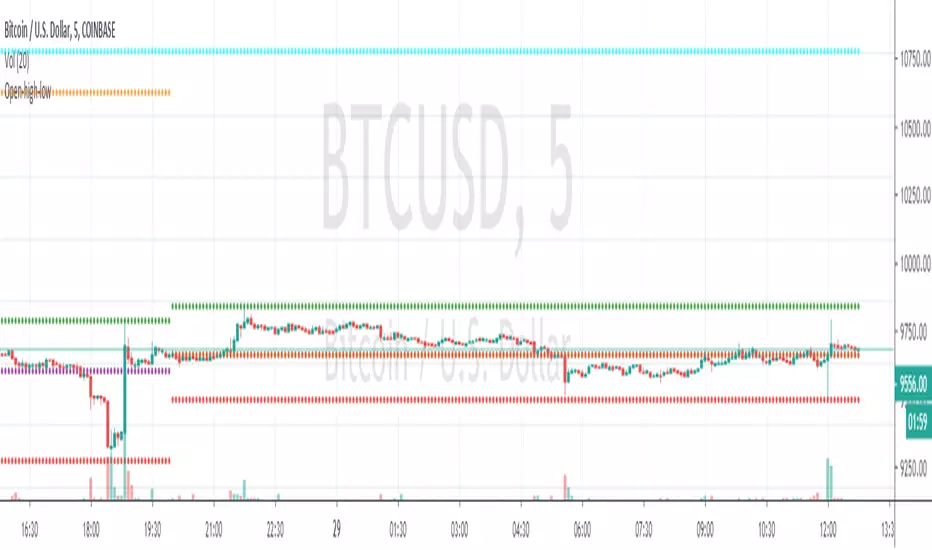
Open-high-lowmodified @traderXO's original daily open/high/low script to include monthly and weekly open.
Standard Deviation using high, low, closeEvery standard deviation tools just only consider one source to compute std, but this tool also consider close, high, low to publish std

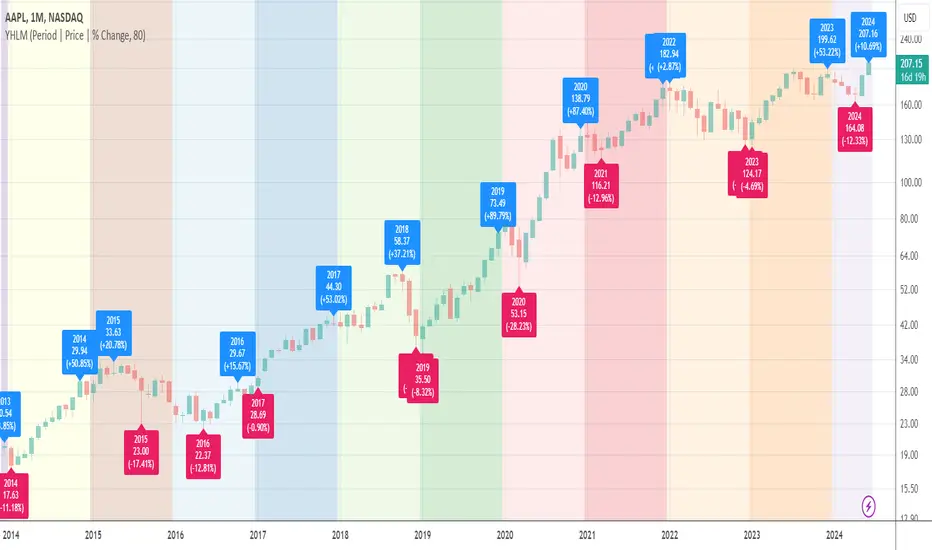
Yearly High/Low MarksAn utility tool for analysts. It marks the highest and lowest prices for each year down to 1989.
Works everywhere and doesn't use any calls of built-in functions that relate to the data extraction.
AAPL, D
AAPL, M
BLX, D
BLX, W
BLX, M

Pivot High Low Pointsby using this script you can find Pivot High-Low Points. This script works like Tradingview pivothigh & pivotlow functions.
If you find my works useful, please consider a donation
BTC: 16XRqyS3Vgh1knAU1tCcruqhUrVm4QWWmR
by LonesomeTheBlue

Volume Weighted High / Low IchimokuSame Idea as standard Ichimoku except using volume-weighted average high / low for the corresponding periods. adjustable displacement / time period inputs.