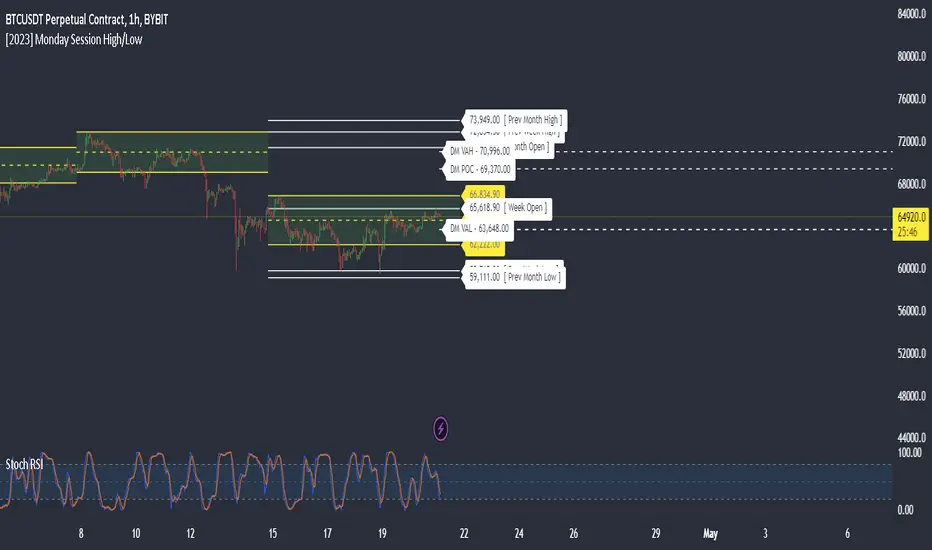
Monday Session High/LowThis script tracks and draw the High and the Low for Monday session across the whole week period.
Many crypto traders use the high and low extremes for Monday session as an confluence on how the price action during the week reacts against it.
스크립트에서 "high low"에 대해 찾기
Visible Range Streaks of Unbroken Prior Highs/Lows [vnhilton](OVERVIEW)
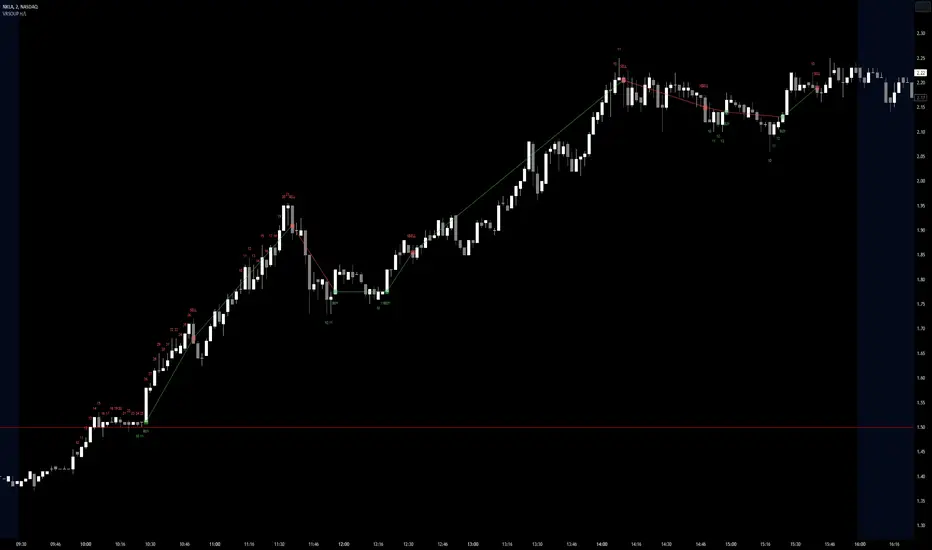
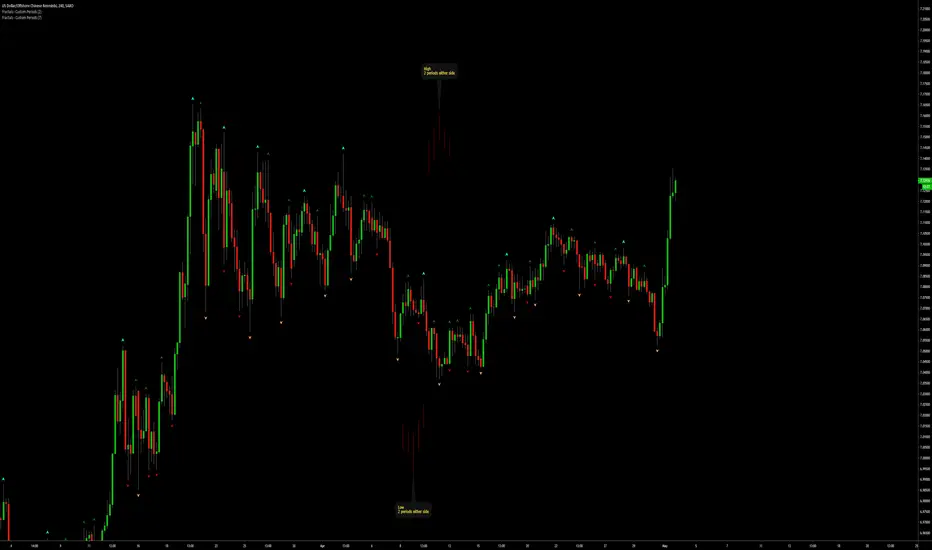
This indicator keeps track of the number of unbroken prior highs/lows (unbroken being no price closes above/below the prior high/low). Great for entries and take profits. The indicator calculates on visible bars for convenience when looking back into the history without having to use bar replay, which those on the TradingView free plan cannot use intraday bar replay, so the visible range is a perfect work-around. The 2 minute chart above shows NASDAQ:NKLA on Thursday 13th July, 2023, with a significant level of $1.5 leading to a breakout. Streaks lower than 10 were hidden in the chart.
(FEATURES)
- Custom minimum streak size to start displaying plots (the smaller the size the more signals)
- Ability to show/hide numbers (that keep count of unbroken streaks), text signals (for when a streak is broken), break shapes (where the prior high/low was broken), and Zig Zag (lines between break shapes)
- Customisable Zig Zag line width, style, and colours (1 colour for a positive gradient line, and another for a negative gradient line)
- Customisable text signal text
- Customisable numbers, text signal, break shape, number label & text signal label colours
- Customisable number label, text signal label and break shape styles and sizes (number and text signal label share the same size)
Pivot Points High Low & Missed Reversal Levels [LuxAlgo]Pivot Points High/Low, sometimes referred to as "Bar Count Reversals" allows highlighting market prices local tops and bottoms. This method compares the price value at a certain index within a user-specified window length and tests whether it is the highest (pivot high) or lowest (pivot low).
This method can return successive pivots of the same type, thus missing certain reversals, as such, we aimed to highlight those missed reversals and provide a level at their location to determine if they had any significant role to play. A zig-zag is additionally built, connecting regular pivots with missed reversals.
Settings
Pivot Length: Determine the "Bar Count Reversals" window size. higher values will highlight more significant reversals.
Other settings control the look of the displayed graphical elements within the indicator.
Usage
Missed reversals are highlighted by labels with a ghost emoji, a Zig-Zag line connecting a missed reversal is dashed. Note that labels are offset by -Pivot Length bars (with the exception of the most recent one), and as such are detected further ahead of their location.
When a missed reversal is detected, a level is displayed, starting at the location of the missed reversal and ending when a new missed reversal is detected.
These levels can be used as support and resistance.
The most recent label estimates the possible location of a confirmed reversal, and will continuously readjust whether price makes a new higher high/lower low depending on the type of previously detected pivot. A level is also made out of this estimated reversal.

Sessions with High/Low DiffThe main purpose of this indicator is to facilitate backtesting, but it may also be useful for traders to easily identify the current
active/open trading sessions on lower-timeframe charts.
This indicator also tracks the session high/low difference and plots it as a label on the last candle of the session once the last
bar of that session has finished printing and a new candle opened. The position and direction of the label is based on the
session open and close - if the session open is greater than the session close (which would equate to the equivalent of a red candle),
the label will be printed UNDER the last candle, and vice versa if the session close is above the session open.
The number printed inside the label is the difference between the session high and the session low, scaled to the minimum tick value of the chart.
Note #1: There is a Pinescript maximum of 500 labels allowed on any chart. While I could have gotten fancy and done some wizardry with label arrays,
I didn't really see a point to it. If labels are enabled for all 4 sessions at the same time, that would still have them available for the past 125
sessions, which would be about 6 months (approx 252 trading days per year, and this would cover 125 of them). If you limit to 2 sessions, you double
your potential look-back to almost a year (250 days out of the 252 average trading days each year), and for a single session, you double it yet again
to just under 2 years.
Note #2: As this indicator tracks open, high, low, and close for each session, it can potentially be enhanced (or forked) to construct "session candles".
I'm not sure what use this would be to anyone, but the pieces are there should someone find a use for it.
While it would be easy to add alerts on sessions opening/closing, I didn't see a purpose or value in that as it would be little more than a
glorified alarm clock. If I get enough demand to add them, I will gladly consider it.

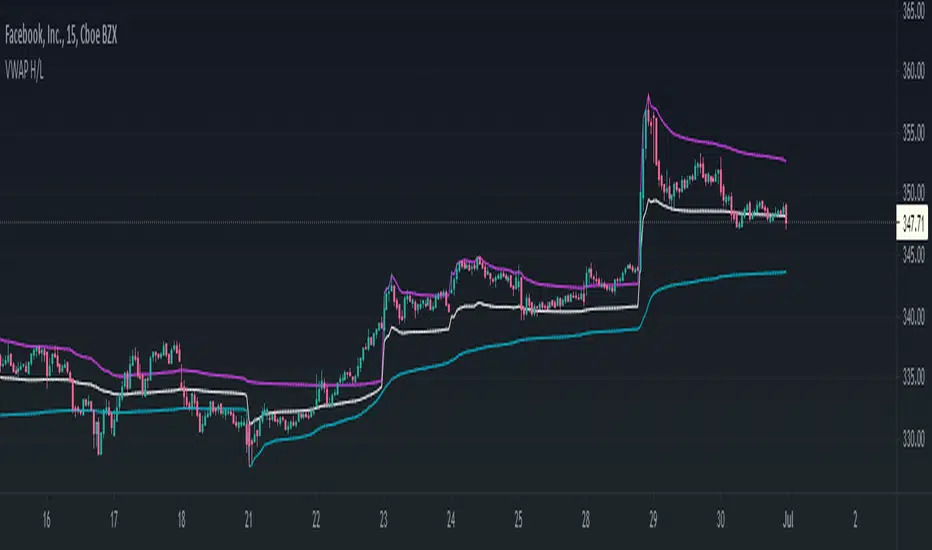
VWAP High/Low ChannelIn short, the VWAP High/Low Channel is based on VWAP "newsession" on swing high/low, with a basis of the two.
The VWAP High/Low channel seems to act like Bollinger bands or Donchain Channels when squeezing for a breakout, while also acting as a pivot after a breakout.
ALL TIME HIGH/LOW AND 52 WEEKS HIGH/LOWThis script show:
1. All time high/low line shown in maroon color
2. 52weeks high/low line shown in red color
3. 25% below 52wh and 30% upper 52wl as per Mark Minervini suggset in his book "Trade Like a Stock Market Wizard: How to Achieve Super Performance in Stocks in Any
Market"
Thats all, hope benefit tou you all.
Thank you.

Cumulative High Low IndexThis indicator tells how many days it is making new HighLowPeriod highs or lows in Lookback period.
If bar makes new HighLowPeriod high, HighLow index for that bar is +1
If bar makes new HighLowPeriod low, HighLow index for that bar is -1
Cumulative high low index is sum of HighLow index for Lookback periods.
Optional moving average can also be applied on this index

X Period High/Low/MidToday we have a simple, but endlessly versatile, indicator that plots the X Period High/Low/Mid of your chosen market.
Traditionally the 52 week High/Low is used as a breakout signal. However, by changing to an X period, and adding a midway line, we create a more versatile indicator that can be tailored to various markets.
By default it's set at 250 periods (because I like the 250 period moving average), and I generally trade H4 and Daily time frames. But tweak it to your liking, you just have to modify the length periods by your desired time frame and lookback length. E.g. to create a 52 week indicator on the daily time frame, enter a length of 260 in the indicator (5 days per week * 52 weeks = 260).
For the above reason, I haven't made this indicator MTF, as there's no real need. However, if users find it easier I can look at adding it later.
Also, the mid point between an X period high/low is often a good trend-follower, as well as acting as support/resistance . I encourage you to experiment with different ways of using this indicator. Entire systems (if your risk management is correct) can be built and traded from this one indicator.
Good luck.
DD

Triple Coppock CurveThe Coppock Curve is a zero-centered momentum oscillator that relies primarily on rate of change calculations. The Coppock Curve in its most basic form is already a great indicator, especially for spotting shifts in momentum. But, we wanted to see how we could modify it to get some better performance out of it.
As the ‘cop’ function demonstrates, the Coppock Curve has a pretty simple calculation. The first step is to calculate the rate of change at a longer and shorter window length. Next, the sum of the two rate of change values is calculated and finally a weighted moving average of a user defined length is calculated(this is the Coppock Curve).
The ‘cop()’ function set the foundation to allow us to implement our modifications. As you can see in the graph, there are 3 different lines (2 histogram and 1 normal line) comprising the Coppock values based on the rate of change of high, low, and closing prices. We liked this layout because it allows traders to easily identify the curve’s pivots and the balance of negative vs. positive momentum.
The Coppock Curve based on high prices is plotted as the teal histogram, wile the pink histogram represents the Coppock Curve of low prices. The curve based on closing prices is the red and green alternating line plotted on top of the two histograms.
We included some notes on the chart to help with interpreting the three curves.
There are two common approaches traders can take when trading with the indicator:
1. Trade based on closing price curve: Go long when line changes from bearish(red) to bullish(green). Then, go short when same line changes from bullish to bearish.
2. Trade based on crossings of the zero-line. This could be based on the high, low, or closing price curves, but closing price is the safest bet. So, go long when it crosses from negative into positive territory and short when it crosses under the zero line from positive into negative territory.

HTF High/LowThis simple script draws the previous higher timeframe candle high/low to your chart.
You can also make the script paint the zone between the low/open and the high/close.

New Highs-Lows NASDAQ-Buschi
English:
This indicator shows the NASDAQ's new highs (green) and new lows (red).
Extreme trading days with more than 99 % new highs relative to new lows vice versa are marked via lines (theoretically values) and triangles (breaches).
Deutsch:
Dieser Indikator zeigt die neuen Hochs (grün) und neuen Tiefs (rot) der NASDAQ.
Extreme Handelstage mit mehr als 99 % neuen Hochs relativ zu den neuen Tiefs und andersherum sind gekennzeichnet über Linien (theoretische Werte) und Dreiecke (Überschreitungen).
New Highs-Lows NYSE-Buschi
English:
This indicator shows the NYSE's new highs (green) and new lows (red).
Extreme trading days with more than 99 % new highs relative to new lows vice versa are marked via lines (theoretically values) and triangles (breaches).
Deutsch:
Dieser Indikator zeigt die neuen Hochs (grün) und neuen Tiefs (rot) der NYSE.
Extreme Handelstage mit mehr als 99 % neuen Hochs relativ zu den neuen Tiefs und andersherum sind gekennzeichnet über Linien (theoretische Werte) und Dreiecke (Überschreitungen).

anas Bollinger Bands high low normal bb use normally close in its calculation not considering high and low , and the channel is based on 2 std div , with will present 93% of the close reading with in the band .
my new design will calculate the upper band based on high values , and the lower band based on low values , and the center line on close values
, and 1,65 std will represent 90 % of all reading (high , low , close ) to fall with in the band .
up trend will be considered if close price exceeded the top band lower values (within or outside the band )
down trend will be considered if close price exceeded the lower band higher values (within or outside the band )

[RG9]High Low RibbonsThis indicator shows the 9 different period highs and lows dynamically spaced based off of fibonacci numbers. The parameter fib_start gives the script the starting iteration for the first ribbon period. EX. fib_start of 5 = period of 5. It then also shows 8 more Fibonacci numbers up for high low periods. Ex. 5 8 13 21 34 55 89 144 233 period highs and lows. The white lines are space 1/4, 2/4, and 3/4 of the distance between the longest period low and high.

Day High/Low with Fibs for chartmojoFor chartmojo
- TODO: Switch up/down trend automatically, for now you will need to toggle it in the script settings
- The orange 'prediction' line can be toggled in the settings, it will show a new high/low based on the current high/low becoming the new 0.236 fib, look for flat areas to the left, those might become a potential new high/low in the future

CM Gann Swing High Low V2CM Gann Swing High Low V2
Added Improvements:
Used PineScript “linebr" code so solid lines plot only when condition = true.
Via Inputs Tab:
Ability to Turn On/Off Highlight Bars When Crossing Above/Below Swing High Low
Ability to Turn On/Off Back Ground Highlights When Crossing Above/Below Swing High Low
Ability to Turn On/Off linebr plots.
Other Features: All Available Via Inputs Tab
Ability to Adjust Moving Average Values to adjust Sensitivity.
Ability to Turn On/Off Triangles Above/Below Bars based on Indicator.
Ability to Turn On/Off Triangles at Top And Bottom Of Screen Showing Direction of Indicator.
***Basically you have Option to View Indicator about every way possible.
***Special Thanks to Glaz for Original Code.

Sessions High/LowIndicator lines to show the prior days NY high/low, overnight Asian high/low, and recent London high/low. Time frame variables are included as well as the option to change colors for both the high and low. Good luck.

Fractals | Swing Points | Highs & Lows | Custom PeriodsSimple script which marks out key swing highs & lows.
One of the only indicators I have on the chart most days
- perfect for naked charting
- quickly helps you to visually identify key areas of interest
An extension of Bill Williams fractals
- aka short term swing points
Allows you to filter for only the most prominent swing points
- you can even overlay multiple swingpoint filters in different colours (as per example chart)
The number ( Fractal Periods) is simply:
- the number of less prominent points either side of your swing high/low
- example shown on the chart
Otherwise make a fist
- look at your 5 knuckles
- swing high is your middle knuckle
- 2 lower points either side
Bill Williams Original Fractal:
Fractal Periods = 2
Your Fractal Period for Filtering:
3, 4, 5, 30, 365, etc
Allows you to find swing points down to:
Fractal Periods = 1
Simple, easy, shared to enjoy =)

Fractals | Swing Points | Highs & Lows | Custom PeriodsSimple script which marks out key swing highs & lows.
One of the only indicators I have on the chart most days
- perfect for naked charting
- quickly helps you to visually identify key areas of interest
An extension of Bill Williams fractals
- aka short term swing points
Allows you to filter for only the most prominent swing points
- you can even overlay multiple swingpoint filters in different colours (as per example chart)
The number (Fractal Periods) is simply:
- the number of less prominent points either side of your swing high/low
- example shown on the chart
Otherwise make a fist
- look at your 5 knuckles
- swing high is your middle knuckle
- 2 lower points either side
Bill Williams Original Fractal:
Fractal Periods = 2
Your Fractal Period for Filtering:
3, 4, 5, 30, 365, etc
Simple, easy, shared to enjoy =)
Session First 5-Min High/LowHere's a professional description for your indicator:
Session First 5-Min High/Low Marker
This indicator automatically identifies and marks the high and low price levels established during the first 5 minutes of major trading sessions, helping traders identify key intraday support and resistance zones.
Key Features:
Tracks three major trading sessions in IST (Indian Standard Time):
Asian Session: 5:30 AM - 5:35 AM
London Session: 12:30 PM - 12:35 PM
New York Session: 5:30 PM - 5:35 PM
Draws horizontal lines at the highest and lowest prices reached during each session's opening 5-minute window
Color-coded for easy identification (Yellow for Asian, Blue for London, Red for New York)
Lines extend across the chart to help track price reactions throughout the day
Clean, minimal design with optional labels
Best Used For:
Identifying key intraday support and resistance levels
Session breakout trading strategies
Understanding institutional order flow at market opens
Works on 1-minute timeframe for precise tracking
Customizable Settings:
Toggle line extensions on/off
Adjust line width (1-5)
Change colors for each session
Show/hide session labels
Perfect for day traders and scalpers who trade around major session openings and want to identify high-probability support/resistance zones established during peak liquidity periods.
This description explains what the indicator does, its practical applications, and its key features in a way that's clear for TradingView users.RetryClaude can make mistakes. Please double-check responses.

[DEM] No High/Low Bars No High/Low Bars is a simple yet effective price action indicator that identifies potential reversal points by marking bars where the closing price equals either the session's high or low. The indicator generates buy signals (blue triangles below the bar) when the close equals the high, suggesting strong bullish momentum that pushed price to its peak by session end, and sell signals (red triangles above the bar) when the close equals the low, indicating bearish pressure that drove price to its lowest point. This approach captures moments of decisive directional movement where buyers or sellers maintained control throughout the entire session, effectively filtering out indecisive price action and highlighting bars with clear directional commitment. The simplicity of this method makes it particularly useful for identifying momentum shifts and potential continuation or reversal points based purely on the relationship between closing prices and session extremes.
Previous Day/Week High, Low, Midpoint LinesI put together this script as I couldn’t find exactly what I was looking for on Tradingview.
The script plots the previous day and week high and low as well as the midpoint of the range between the daily and weekly high and low. These lines stop printing once a price candle crosses the lines.
This may be of use to you. Enjoy!

Previous Day High Low Close By Anil ChawraHow Users Can Make Profit Using This Script:
1. Calculate the difference between the previous day's high and low prices to determine the price range.
2. Identify if today's close price is significantly higher or lower than the previous day's close price.
3. If today's close price is at least 10 points higher than the previous close, consider a potential buy signal.
4. If today's close price is at least 10 points lower than the previous close, consider a potential sell signal.
5. These signals indicate potential profit opportunities based on significant price movements.
6. Users should verify market conditions and perform additional analysis before executing trades.
7. Monitoring price action and volume can help confirm the validity of these signals.
8. Implementing stop-loss orders can help mitigate risks associated with trading based on price movements.
9. Regularly reviewing and adjusting trading strategies based on market conditions is essential for long-term success.
10. Exercise caution and discipline when trading, and consider seeking advice from financial professionals if needed.
How the Script Works:
1. The strategy analyzes the high, low, and close prices of the previous trading day.
2. It calculates the range of prices by subtracting the low from the high.
3. The close price of the current trading day is compared to the previous day's close.
4. If today's close is significantly higher than yesterday's close, it could indicate bullish sentiment.
5. Conversely, if today's close is significantly lower, it could suggest bearish sentiment.
6. A threshold, typically 10 points, is set to identify significant price movements.
7. If today's close is at least 10 points higher, it triggers a potential buy signal.
8. If it's at least 10 points lower, it triggers a potential sell signal.
9. Users can act on these signals to enter or exit trades for potential profit.
10. Regular monitoring, risk management, and market analysis are essential for effective implementation of this strategy.
