[BMAX] Daily Gaps(ENGLISH)
This indicator was built to allow traders to observe the open gaps between sessions in the Market. It can be used either on daily or weekly timeframes. Also it incluses a standard deviation band (such as bollinger band) in order to verify the gaps variance. This indicator can be used to check what is the variance on the session open gaps and prepare to protect the positions against market volatility when swing or position trading.
(PORTUGUÊS)
Este indicador foi construído para permitir que traders observem os gaps de abertura de seção no Mercado. Ele pode ser utilizado no tempo gráfico Diário ou Semanal. Também inclui uma banda de desvio padrão (assim como usado nas Bandas de Bolinger) que permite verifcar a variância dos gaps. Este indicador pode ser usado para se preparar para proteger uma posição em swing ou position trading onde o mercado pode abrir com forte gap em situações de alta volatilidade.
스크립트에서 "gaps"에 대해 찾기

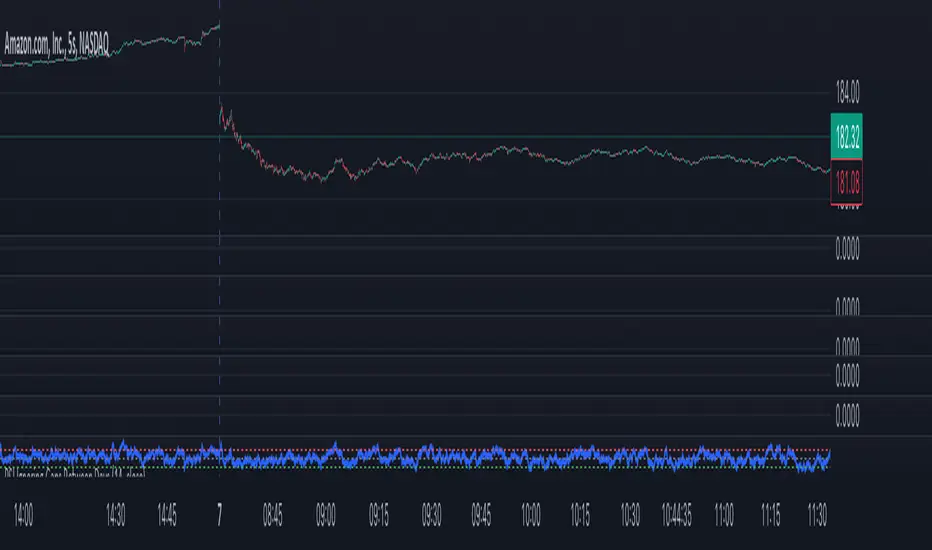
RSI Ignoring Gaps Between DaysThe RSI Ignoring Gaps Between Days indicator is an advanced modification of the traditional Relative Strength Index (RSI) designed to exclude price gaps that occur between the last bar of one trading day and the first bar of the next. This ensures that the RSI calculations remain focused on the actual price action during the trading session, avoiding distortions caused by overnight price gaps.
Key Features:
Gap Ignoring Mechanism: The indicator detects when a new day begins and skips the price change between the last bar of the previous day and the first bar of the current day. This ensures that only the intra-day price changes are included in the RSI calculation.
Intra-day Price Movement: The RSI calculations are based on real price changes within each trading day, providing a clearer reflection of momentum without interference from overnight events.
Dynamic RSI Calculation: The traditional RSI formula is preserved, but gains and losses are recalculated based on price changes from bar to bar within the same day.
Overbought/Oversold Levels: The indicator retains standard RSI overbought (70) and oversold (30) levels, allowing traders to easily identify potential reversal zones.
Alerts for Crossovers: Built-in alert conditions trigger when the RSI crosses key levels (30 or 70), signaling potential buying or selling opportunities.
This indicator is particularly useful for traders looking to focus on intra-day price action and avoid the influence of gaps caused by overnight market activity. It is suitable for intraday trading strategies where consistency in price movement measurement is crucial.
ICT Fair Value Gaps [Zero-Noise Edition]ICT Fair Value Gaps
Overview
In the Smart Money Concepts (SMC) framework, clarity is the ultimate edge. Most FVG indicators clutter your screen with "ghost boxes" that remain long after they have been filled. This professional-grade tool identifies high-displacement institutional imbalances and automatically dissolves them the moment they are mitigated.
Key Features
Precision Detection : Uses the classic 3-candle displacement logic to identify institutional gaps.
Auto-Mitigation : Boxes are removed the moment price retraces and "fills" the imbalance, keeping your chart 100% clean.
High Performance : Optimized with array-based logic for zero-lag performance on all timeframes.
Built-in Alerts : Stay informed with real-time notifications when new institutional displacement occurs.
How to Trade This Tool
The Trigger : A new FVG box appears, confirming institutional "intent."
The Draw : Treat the open boxes as magnets for price (Draw on Liquidity).
The Entry : Wait for price to retrace and tap the edge of the "open" FVG.
The Exit : Use opposing mitigated zones or swing points for targets.
Customizable Settings
Visuals : Custom color palettes for Bullish and Bearish imbalances.
Labels : Toggle "FVG" text on or off for a minimalist HUD experience.
Logic : Option to hide filled gaps completely for the ultimate zero-noise experience.
Global Compatibility
Tested and optimized for:
Forex : EURUSD, GBPUSD, AUDUSD.
Indices : US30, NAS100, DAX40.
Commodities : Gold (XAUUSD), Silver, Oil.
Crypto : BTCUSD, ETHUSD.
Authors Note
This script is written in Pine Script v6 . It is designed for traders who prioritize accuracy over "noisy" indicators. If you find value in this tool, please leave a Boost and follow for more SMC tool releases!

Fair Value Gaps (FVG)This indicator automatically detects Fair Value Gaps (FVGs) using the classic 3-candle structure (ICT-style).
It is designed for traders who want clean charts and relevant FVGs only, without the usual clutter from past sessions or tiny, meaningless gaps.
Key Features
• Bullish & Bearish FVG detection
Identifies imbalances where price fails to trade efficiently between candles.
• Automatic FVG removal when filled
As soon as price trades back into the gap, the box is deleted in real time – no more outdated zones on the chart.
• Only shows FVGs from the current session
At the start of each new session, all previous FVGs are cleared.
Perfect for intraday traders who only care about today’s liquidity map.
• Flexible minimum gap size filter
Avoid noise by filtering FVGs using one of three modes:
Ticks (based on market tick size)
Percent (relative to current price)
Points (absolute price distance)
• Right-extension option
Keep gaps extended forward in time or limit them to the candles that created them.
Why This Indicator?
Many FVG indicators overwhelm the chart with zones from previous days or tiny imbalances that don’t matter.
This version keeps things clean, meaningful, and real-time accurate, ideal for day traders who rely on market structure and liquidity.

TradeScope: MA Reversion • RVOL • Trendlines • GAPs • TableTradeScope is an all-in-one technical analysis suite that brings together price action, momentum, volume dynamics, and trend structure into one cohesive and fully customizable indicator.
An advanced, modular trading suite that combines moving averages, reversion signals, RSI/CCI momentum, relative volume, gap detection, trendline analysis, and dynamic tables — all within one powerful dashboard.
Perfect for swing traders, intraday traders, and analysts who want to read price strength, volume context, and market structure in real time.
⚙️ Core Components & Inputs
🧮 Moving Average Settings
Moving Average Type & Length:
Choose between SMA or EMA and set your preferred period for smoother or more reactive trend tracking.
Multi-MA Plotting:
Up to 8 customizable moving averages (each with independent type, color, and length).
Includes a “window filter” to show only the last X bars, reducing chart clutter.
MA Reversion Engine:
Detects when price has extended too far from its moving average.
Reversion Lookback: Number of bars analyzed to determine historical extremes.
Reversion Threshold: Sensitivity multiplier—lower = more frequent signals, higher = stricter triggers.
🔄 Trend Settings
Short-Term & Long-Term Trend Lookbacks:
Uses linear regression to detect the slope and direction of the short- and long-term trend.
Results are displayed in the live table with color-coded bias:
🟩 Bullish | 🟥 Bearish
📈 Momentum Indicators
RSI (Relative Strength Index):
Adjustable period; displays the current RSI value, overbought (>70) / oversold (<30) zones, and trending direction.
CCI (Commodity Channel Index):
Customizable length with color-coded bias:
🟩 Oversold (< -100), 🟥 Overbought (> 100).
Tooltip shows whether the CCI is trending up or down.
📊 Volume Analysis
Relative Volume (RVOL):
Estimates end-of-day projected volume using intraday progress and compares it against the 20-day average.
Displays whether today’s volume is expected to exceed yesterday’s, and highlights color by strength.
Volume Trend (Short & Long Lookbacks):
Visual cues for whether current volume is above or below short-term and long-term averages.
Estimated Full-Day Volume & Multiplier:
Converts raw volume into “X” multiples (e.g., 2.3X average) for quick interpretation.
🕳️ Gap Detection
Automatically identifies and plots bullish and bearish price gaps within a defined lookback period.
Gap Lookback: Defines how far back to search for gaps.
Gap Line Width / Visibility: Controls the thickness and display of gap lines on chart.
Displays the closest open gap in the live table, including its distance from current price (%).
🔍 ATR & Volatility
14-day ATR (% of price):
Automatically converts the Average True Range into a percent, providing quick volatility context:
🟩 Low (<3%) | 🟨 Moderate (3–5%) | 🟥 High (>5%)
💬 Candlestick Pattern Recognition
Auto-detects popular reversal and continuation patterns such as:
Bullish/Bearish Engulfing
Hammer / Hanging Man
Shooting Star / Inverted Hammer
Doji / Harami / Kicking / Marubozu / Morning Star
Each pattern is shown with contextual color coding in the table.
🧱 Pivot Points & Support/Resistance
Optional Pivot High / Pivot Low Labels
Adjustable left/right bar lengths for pivot detection
Theme-aware text and label color options
Automatically drawn diagonal trendlines for both support and resistance
Adjustable line style, color, and thickness
Detects and tracks touches for reliability
Includes breakout alerts (with optional volume confirmation)
🚨 Alerts
MA Cross Alerts:
Triggers when price crosses the fast or slow moving average within a tolerance band (default ±0.3%).
Diagonal Breakout Alerts:
Detects and alerts when price breaks diagonal trendlines.
Volume-Confirmed Alerts:
Filters breakouts where volume exceeds 1.5× the 20-bar average.
🧾 Live Market Table
A fully dynamic table displayed on-chart, customizable via input toggles:
Choose which rows to show (e.g., RSI, ATR, RVOL, Gaps, CCI, Trend, MA info, Diff, Low→Close%).
Choose table position (top-right, bottom-left, etc.) and text size.
Theme selection: Light or Dark
Conditional background colors for instant visual interpretation:
🟩 Bullish or Oversold
🟥 Bearish or Overbought
🟨 Neutral / Moderate
🎯 Practical Uses
✅ Identify confluence setups combining MA reversion, volume expansion, and RSI/CCI extremes.
✅ Track trend bias and gap proximity directly in your dashboard.
✅ Monitor relative volume behavior for intraday strength confirmation.
✅ Automate MA cross or breakout alerts to stay ahead of key price action.
🧠 Ideal For
Swing traders seeking confluence-based setups
Intraday traders monitoring multi-factor bias
Analysts looking for compact market health dashboards
💡 Summary
TradeScope is designed as a single-pane-of-glass market view — combining momentum, trend, volume, structure, and reversion into one clear visual system.
Fully customizable. Fully dynamic.
Use it to see what others miss — clarity, confluence, and confidence in every trade.

CM_Gap_Indicator_Intra-Day_V2.1CM_Gap_Indicator_Intra-Day_V2.1
Updated Intra-Day Gap Indicator.
Version 2.1…Many Additional Features To Come.
***Designed for Intra-Day Charts.
***Great for Stocks…Forex and Futures Sunday Night Gaps.
***Plots Green Lines If Gap Up (See Added Features Below)
***Plots Red Lines If Gap Down
MAJOR Feature Added:
***Added Check Boxes In Inputs Tab That Let’s You Choose if You Want To See All Gaps, Or Only Gaps That Open Above/Below Previous Days High/Low
Other Features Added:
***Gap Mid Lines
***Color Fill Based On Gap Up Or Down
Additional Features Coming!!!

ICT Vacuum BlocksThe indicator draws a box between the closing price of one candle and the opening price of the next whenever a gap occurs, helping traders easily spot potential areas of interest where the market has skipped over price levels. The boxes do not extend beyond the gap itself, keeping the chart clean and focused on the price action.
Features:
Detects both upward and downward gaps.
Non-extending boxes that accurately represent the size of each gap.
Customizable colors for up and down gaps to match your chart style.
Customizable Gap FinderThis is a fully customizable gap finder. You can change the color of just about anything, on top of hiding filled/old gaps. This is so you can spot those tiny gaps on something such as futures. Be sure to play around with the settings.

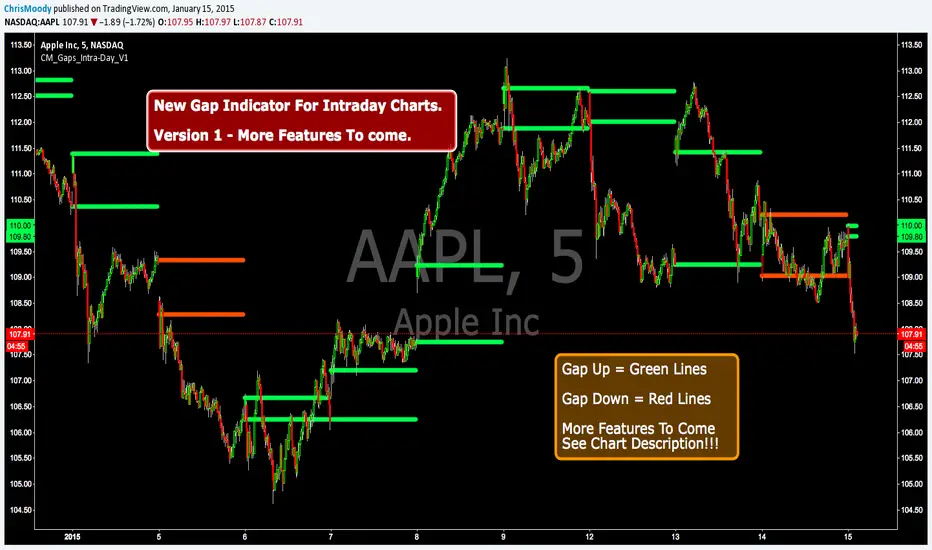
CM_Gap_Indicator_Intra-Day_V1CM_Gap_Indicator_Intra-Day_V1
This is a Simple Gap Indicator.
Version 1…Many Additional Features To Come.
***Designed for Intra-Day Charts.
***Great for Stocks…Forex and Futures Sunday Night Gaps.
***Plots Green Lines If Gap Up
***Plots Red Lines If Gap Down
Additional Filters Coming Soon:
***Minimum Gap% Filter
***Gap Mid Lines
***Color Coding On Filled Gaps
Efficiency GapsPaints inefficient candles ( where candles on both sides of a candle don't meet in the middle. )
Average True Range period and multiplier from 0.01 to 1 can be used to filter out small gaps.
Price is likely to return to these areas and they are possible support / resistance levels.
Combine with volume profile to detect low volume areas.


Bitcoin CME gaps multi-timeframe auto finder1. Overview
The Bitcoin CME Gap Multi-Timeframe Detector automatically identifies price gaps in the Bitcoin CME (Chicago Mercantile Exchange) futures market and visually displays them on the TradingView chart.
Because the CME futures market closes for about an hour after each weekday session and remains closed over the weekend, price gaps frequently appear when trading resumes on Monday.
This indicator analyzes gaps across six major timeframes, from 5-minute to 1-day charts, allowing traders to easily identify structural imbalances and potential support/resistance zones.
It is the most accurate and feature-rich CME gaps indicator available on TradingView.
2. Key Features
■ Multi-Timeframe Gap Detection
Analyzes 5m, 15m, 30m, 1h, 4h, and 1D charts simultaneously.
This enables traders to observe both short-term volatility and mid-to-long-term structure, providing a multi-dimensional view of market dynamics.
■ Gap Direction Classification
Up Gap: When the next candle’s open is higher than the previous candle’s high (default color: green tone)
Down Gap: When the next candle’s open is lower than the previous candle’s low (default color: red tone)
Gaps are color-coded to intuitively visualize potential support and resistance zones.
■ Highlight Function
Gaps exceeding a user-defined threshold (%) are highlighted (default color: yellow).
This helps quickly identify zones with abnormal volatility or sharp price dislocations.
■ Labels and Box Extension
Each gap displays a percentage label indicating its relative size and significance.
Gap zones are extended to the right as boxes, allowing traders to visually track when and how the gap gets filled over time.
■ Alert System
When a gap forms on the selected timeframe (or across all timeframes), a TradingView alert is triggered.
This enables real-time response to significant gap events.
3. Trading Strategies
■ Gap Fill Behavior
CME gaps statistically tend to get filled over time.
Gap boxes help distinguish between filled and unfilled gaps at a glance.
Up Gap: Price tends to decline to fill the previous high–next open zone.
Down Gap: Price often rises later to fill the previous low–next open zone.
■ Support & Resistance Levels
Gap zones frequently act as strong support or resistance.
When price retests a gap area, observing the reaction of buyers and sellers can provide valuable trading insights.
Overlapping gap boxes across multiple timeframes indicate high-confidence support/resistance zones.
■ Market Sentiment & Volatility Analysis
Large gaps usually result from shifts in market sentiment or major news events.
This indicator allows traders to detect volatility spikes early and prepare for potential trend reversals.
■ Combination with Other Technical Tools
While fully functional on its own, this indicator works even better when combined with tools like moving averages (MA), RSI, MACD, or Fibonacci retracements.
For example, if the bottom of a gap coincides with the 0.618 Fibonacci level, it may signal a strong rebound zone.
4. Settings Options
Minimum Gap % | Sets the minimum percentage movement required to detect a gap (lower values show smaller gaps)
Display Timeframes | Choose which timeframes to display (5m, 15m, 30m, 1h, 4h, 1D)
Box Colors | Assign colors for up and down gaps
Box Extension (Bars) | Number of bars to extend gap boxes to the right
Show Labels | Toggle display of gap percentage labels
Label Position / Size | Adjust label position and size
Highlight Gap ≥ % | Highlight gaps exceeding a specified percentage
Highlight Colors | Set highlight color for labels and boxes
Enable Alerts | Enable or disable alerts
Alert Timeframe | Select timeframe(s) for alerts (“All” = all timeframes)
5. Summary
This indicator is a professional trading tool that provides quantitative and visual analysis of price gaps in the Bitcoin CME futures market.
By combining multi-timeframe detection, highlighting, and alert systems, it helps traders clearly identify zones of market imbalance and potential reversal areas.

Momentum-Based Fair Value Gaps [BackQuant]Momentum-Based Fair Value Gaps
A precision tool that detects Fair Value Gaps and color-codes each zone by momentum, so you can quickly tell which imbalances matter, which are likely to fill, and which may power continuation.
What is a Fair Value Gap
A Fair Value Gap is a 3-candle price imbalance that forms when the middle candle expands fast enough that it leaves a void between candle 1 and candle 3.
Bullish FVG : low > high . This marks a bullish imbalance left beneath price.
Bearish FVG : high < low . This marks a bearish imbalance left above price.
These zones often act as magnets for mean reversion or as fuel for trend continuation when price respects the gap boundary and runs.
Why add momentum
Not all gaps are equal. This script measures momentum with RSI on your chosen source and paints each FVG with a momentum heatmap. Strong-momentum gaps are more likely to hold or propel continuation. Weak-momentum gaps are more likely to fill.
Core Features
Auto FVG Detection with size filters in percent of price.
Momentum Heatmap per gap using RSI with smoothing. Multiple palettes: Gradient, Discrete, Simple, and scientific schemes like Viridis, Plasma, Inferno, Magma, Cividis, Turbo, Jet, plus Red-Green and Blue-White-Red.
Bull and Bear Modes with independent toggles.
Extend Until Filled : keep drawing live to the right until price fully fills the gap.
Auto Remove Filled for a clean chart.
Optional Labels showing the smoothed RSI value stored at the gap’s birth.
RSI-based Filters : only accept bullish gaps when RSI is oversold and bearish gaps when RSI is overbought.
Performance Controls : cap how many FVGs to keep on chart.
Alerts : new bullish or bearish FVG, filled FVG, and extreme RSI FVGs.
How it works
Source for Momentum : choose Returns, Close, or Volume.
Returns computes percent change over a short lookback to focus on impulse quality.
RSI and Smoothing : RSI length and a small SMA smooth the signal to stabilize the color coding.
Gap Scan : each bar checks for a 3-candle bullish or bearish imbalance that also clears your minimum size filter in percent of price.
Heatmap Color : the gap is painted at creation with a color from your palette based on the smoothed RSI value, preserving the momentum signature that formed it.
Lifecycle : if Extend Unfilled is on, the zone projects forward until price fully trades through the far edge. If Auto Remove is on, a filled gap is deleted immediately.
How to use it
Scan for structure : turn on both bullish and bearish FVGs. Start with a moderate Min FVG Size percent to reduce noise. You will see stacked clusters in trends and scattered singletons in chop.
Read the colors : brighter or stronger palette values imply stronger momentum at gap formation. Weakly colored gaps are lower conviction.
Decide bias : bullish FVGs below price suggest demand footprints. Bearish FVGs above price suggest supply footprints. Use the heatmap and RSI value to rank importance.
Choose your playbook :
Mean reversion : target partial or full fills of opposing FVGs that were created on weak momentum or that sit against higher timeframe context.
Trend continuation : look for price to respect the near edge of a strong-momentum FVG, then break away in the direction of the original impulse.
Manage risk : in continuation ideas, invalidation often sits beyond the opposite edge of the active FVG. In reversion ideas, invalidation sits beyond the gap that should attract price.
Two trade playbooks
Continuation - Buy the hold of a bullish FVG
Context uptrend.
A bullish FVG prints with strong RSI color.
Price revisits the top of the gap, holds, and rotates up. Enter on hold or first higher low inside or just above the gap.
Invalidation: below the gap bottom. Targets: prior swing, measured move, or next LV area.
Reversion - Fade a weak bearish FVG toward fill
Context range or fading trend.
A bearish FVG prints with weak RSI color near a completed move.
Price fails to accelerate lower and rotates back into the gap.
Enter toward mid-gap with confirmation.
Invalidation: above gap top. Target: opposite edge for a full fill, or the gap midline for partials.
Key settings
Max FVG Display : memory cap to keep charts fast. Try 30 to 60 on intraday.
Min FVG Size % : sets a quality floor. Start near 0.20 to 0.50 on liquid markets.
RSI Length and Smooth : 14 and 3 are balanced. Increase length for higher timeframe stability.
RSI Source :
Returns : most sensitive to true momentum bursts
Close : traditional.
Volume : uses raw volume impulses to judge footprint strength.
Filter by RSI Extremes : tighten rules so only the most stretched gaps print as signals.
Heatmap Style and Palette : pick a palette with good contrast for your background. Gradient for continuous feel, Discrete for quick zoning, Simple for binary, Palette for scientific schemes.
Extend Unfilled - Auto Remove : choose live projection and cleanup behavior to match your workflow.
Reading the chart
Bullish zones sit beneath price. Respect and hold of the upper boundary suggests demand. Strong green or warm palette tones indicate impulse quality.
Bearish zones sit above price. Respect and hold of the lower boundary suggests supply. Strong red or cool palette tones indicate impulse quality.
Stacking : multiple same-direction gaps stacked in a trend create ladders. Ladders often act as stepping stones for continuation.
Overlapping : opposing gaps overlapping in a small region usually mark a battle zone. Expect chop until one side is absorbed.
Workflow tips
Map higher timeframe trend first. Use lower timeframe FVGs for entries aligned with the higher timeframe bias.
Increase Min FVG Size percent and RSI length for noisy symbols.
Use labels when learning to correlate the RSI numbers with your palette colors.
Combine with VWAP or moving averages for confluence at FVG edges.
If you see repeated fills and refills of the same zone, treat that area as fair value and avoid chasing.
Alerts included
New Bullish FVG
New Bearish FVG
Bullish FVG Filled
Bearish FVG Filled
Extreme Oversold FVG - bullish
Extreme Overbought FVG - bearish
Practical defaults
RSI Length 14, Smooth 3, Source Returns.
Min FVG Size 0.25 percent on liquid majors.
Heatmap Style Gradient, Palette Viridis or Turbo for contrast.
Extend Unfilled on, Auto Remove on for a clean live map.
Notes
This tool does not predict the future. It maps imbalances and momentum so you can frame trades with clearer context, cleaner invalidation, and better ranking of which gaps matter. Use it with risk control and in combination with your broader process.

[TehThomas] - Fair Value GapsThis script is designed to automatically detect and visualize Fair Value Gaps (FVGs) on your chart in a clean, intuitive, and highly responsive way. It’s built with active traders in mind, offering both dynamic updates and customization options that help you stay focused on price action without being distracted by outdated or irrelevant information.
What Are Fair Value Gaps?
Fair Value Gaps are areas on a chart where there’s an inefficiency in price, typically formed when price moves aggressively in one direction, leaving a gap between the wicks of consecutive candles. These gaps represent imbalanced price action where not all buy or sell orders were efficiently matched. As a result, they often become magnet zones where price returns later to "fill" the imbalance before continuing in its intended direction. Many traders use them as points of interest for entries, re-entries, or anticipating reversals and consolidations.
This concept is frequently used in Smart Money and ICT-based trading models, where understanding how price seeks efficiency is crucial to anticipating future moves. When combined with concepts like liquidity, displacement, and market structure, FVGs become powerful tools for technical decision-making.
Script Features & Functionality
1. Live Updating Gaps (Dynamic Shrinking)
One of the core features of this script is its ability to track and dynamically shrink Fair Value Gaps as price trades into them. Instead of leaving a static zone on your chart, the gap will adjust in real-time, reflecting the portion that has been filled. This gives you a much more accurate picture of remaining imbalance and avoids misleading zones.
2. Automatic Cleanup After Fill
Once price fully fills an FVG, the script automatically removes it from the chart. This helps keep your workspace clean and focused only on relevant price zones. There’s no need to manually manage your gaps, everything is handled behind the scenes to reduce clutter and distraction.
3. Static Mode Option
While dynamic updating is the default, some traders may prefer to keep the original size of the gap visible even after partial fills. For that reason, the script includes a toggle to switch from live-updating (shrinking) mode to static mode. In static mode, FVGs stay fixed from the moment they are drawn, giving you a more traditional visual reference point.
4. Multi-Timeframe Support (MTF)
You can now view higher timeframe FVGs, such as those from the 1H or 4H chart, while analyzing lower timeframes like the 5-minute. This allows you to see key imbalances from broader market context without having to flip between charts. FVGs from higher timeframes will be drawn distinctly so you can differentiate them at a glance.
5. Cleaner Visualization
The script is designed with clarity in mind. All drawings are streamlined, and filled gaps are removed to maintain a minimal, distraction-free chart. This makes it easier to combine this tool with other indicators or price-action-based strategies without overloading your workspace.
6. Suitable for All Market Types
This script can be used on any asset that displays candlestick-based price action — including crypto, forex, indices, and stocks. Whether you're scalping low-timeframe setups or swing trading with a higher timeframe bias, FVGs remain a useful concept and this script adapts to your trading style.
Use Case Examples
On a 5-minute chart, display 1-hour FVGs to catch major imbalance zones during intraday trading.
Combine the FVGs with liquidity levels and inducement patterns to build ICT-style trade setups.
Use live-updating gaps to monitor in-progress fills and evaluate whether a zone still holds validity.
Set the script to static mode to perform backtesting or visual replay with historical setups.
Final Notes
Fair Value Gaps are not a standalone trading signal, but when used with market structure, liquidity, displacement, and order flow concepts, they provide high-probability trade locations that align with institutional-style trading models. This script simplifies the visualization of those zones so you can react faster, stay focused on clean setups, and eliminate unnecessary distractions.
Whether you’re trading high volatility breakouts or patiently waiting for retracements into unfilled imbalances, this tool is designed to support your edge with precision and flexibility.

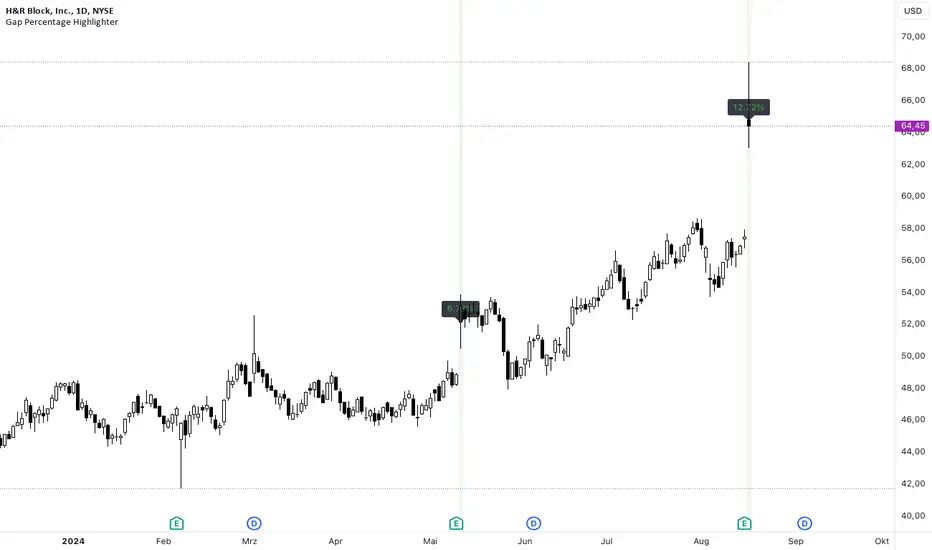
Gap Percentage Highlighter (1Day)b]🇬🇧 ENGLISH
The "Gap Percentage Highlighter" script is a useful tool for traders who want to visually highlight and analyze price gaps on their charts.
Features:
Identification of Price Gaps (Gaps):
The script automatically highlights candles where the opening price significantly differs from the previous day's closing price.
Percentage Display of the Gap:
The percentage change between the closing price and the opening price is displayed directly on the chart.
Customizable Gap Size:
Users can set the minimum size of the price gap in percentage terms through a simple input field, determining when the script marks a gap as significant.
Visual Highlighting:
Gap-ups (positive gaps) are highlighted in green, and gap-downs (negative gaps) are highlighted in red, making them easy to identify.
Use Case:
This script is ideal for traders who utilize gaps in their analyses to identify potential market movements. It allows for quick and visual identification of significant price gaps directly on the chart and offers the flexibility to adjust the definition of "significant" to match individual needs.
Disclaimer:
This script is for educational purposes only. Trading involves risks and is not suitable for every investor.
(c) BS IMPACT SCALE GmbH
🇩🇪 GERMAN
Das "Gap Percentage Highlighter" Skript ist ein nützliches Tool für Trader, die Kurslücken (Gaps) auf ihren Charts visuell hervorheben und analysieren möchten.
Funktionen:
Identifizierung von Kurslücken (Gaps):
Das Skript hebt automatisch Kerzen hervor, bei denen der Eröffnungskurs vom Schlusskurs der vorherigen Kerze auf Tagesbasis signifikant abweicht.
Prozentuale Anzeige der Kurslücke:
Die prozentuale Veränderung zwischen Schlusskurs und Eröffnungskurs wird direkt auf dem Chart angezeigt.
Anpassbare Gap-Größe:
Nutzer können über ein einfaches Eingabefeld die minimale Größe der Kurslücke in Prozent festlegen, ab der das Skript die Lücke als relevant markiert.
Visuelle Hervorhebung:
Gap-Ups (positive Lücken) werden in Grün und Gap-Downs (negative Lücken) in Rot hinterlegt, sodass sie leicht identifiziert werden können.
Anwendungsbereich:
Dieses Skript ist ideal für Trader, die Gaps in ihren Analysen nutzen, um potenzielle Marktbewegungen zu identifizieren. Es ermöglicht eine schnelle und visuelle Erkennung von signifikanten Kurslücken direkt auf dem Chart und bietet die Flexibilität, die Definition von "signifikant" an die eigenen Bedürfnisse anzupassen.
Haftungsausschluss:
Dieses Skript dient ausschließlich zu Bildungszwecken. Trading beinhaltet Risiken und ist nicht für jeden Anleger geeignet.
(c) BS IMPACT SCALE GmbH
Fair Value Gaps w Signals fair value gaps for resistance and support. It is important to understand ranges with this. An open bearish fair value gaps can indicate a bearish range. A bullish fair value gaps in premium can indicate retracement into the bearish range. A fair value gaps on a high time frame in discount of the range can be a indicator to go long. one can play the fair value gaps in discount or a range back into it for longs. negation of the fair value gaps candle bearish or bullish is stop loss. One would want to see a small time frame turn around story within the fair value gaps you are trading. FVG are support and resistance until the market is balanced. A bearish fair value gaps untouched can indicate the end of a range. The candle before the 1st bullsih fair value gaps could be the beginning of the range. all time frames

Fair Value Gaps (FVG) [UAlgo]A fair value gap is especially popular among price action traders and occurs when there are inefficiencies or imbalances in the market, or when the buying and selling are not equal. Fair value gaps can become a magnet for the price before continuing in the same direction.
🔶 Key Features :
Fair Value Gap Identification:
Bullish fair value gaps occur when the current market price exceeds the previous high. The indicator identifies bullish gaps by comparing the low of the current candle with the high of the candle two candles ago . If the low of the current candle is higher than the high two candles ago and the closing price of the previous candle is also higher than the high two candles ago, a bullish fair value gap is detected.
Bearish fair value gaps occur when the current market price falls below the previous low. The indicator identifies bearish gaps by comparing the high of the current candle with the low of the candle two candles ago. If the high of the current candle is lower than the low two periods ago and the closing price of the previous candle is also lower than the low two candles ago, a bearish fair value gap is detected.
Fair Value Gap Filter :
ATR measures market volatility by analyzing the range of price movements over a specified period. It provides insights into the average price range that a security experiences within a given timeframe. After the ATR is calculated, a Simple Moving Average (SMA) is computed for the ATR values. This moving average smoothens out the ATR data, providing a clearer indication of the average volatility levels over time.
When the filter is active, fair value gaps are identified only if they occur during periods of relatively higher volatility, as indicated by the ATR being greater than the SMA. This helps in refining and obtaining the detection of stronger fair value gaps
An example with FVG filtering off:
An example with FVG filtering on:
Customizable Settings: Users have the flexibility to customize various parameters to suit their trading preferences. They can adjust settings such as the number of fair value gaps displayed, mitigation method (either based on closing prices or wicks), and apply filters based on Average True Range (ATR) to refine gap detection.
🔶 Disclaimer :
Use with Caution: Trading involves significant risk, and this indicator should be used with caution. While it can help identify potential trading opportunities, it does not guarantee profits and may sometimes provide false signals.
Not Financial Advice: The information provided by the Fair Value Gaps indicator is for educational and informational purposes only and should not be considered as financial advice. Traders should conduct their own research and consult with financial professionals before making any trading decisions.
Past Performance: Past performance is not indicative of future results. Historical price movements analyzed by the indicator may not accurately predict future market behavior.

Daily Gaps & Trapped PositionsThis script builds substantially upon the default Gaps script provided by Tradingview. Functionality was added to allow users to decide what price from the previous session is used to determine a daily gap, added support for showing gaps across all timeframes up to the daily time frame, and also allow gaps to be shown even with ETH enabled on the chart. This script provides support across normal securities, futures, and also crypto.
Users can decide between the following selections to determine if a daily gap has formed:
- Previous Session Close
- Previous Session High/Low
- Last RTH Candle High/Low
The other larger piece that was added is something called trapped positions or what some folks familiar with Market Profile would call "single prints". They could also be considered FVGs but they are a specific subset of FVGs as these must from above or below the current session's high/low.
Single prints form above or below a current session's high/low and can be considered an area where price has moved too fast in that area and price will most likely return to these areas at a later point in time. In some teachings, these are also looked at as "trapped shorts" (lighter blue box color) or "trapped supply" (yellow orange box color) which creates an area where there will be potential support (trapped shorts) or resistance (trapped supply) when this area is revisited in the future. Adding these to your chart will simply provide additional areas of interest where you may see buying or selling.
Both gaps and trapped positions have the following options:
- Show only active gaps/trapped positions. Selecting this will only show areas where price has not completely traded through the box.
- Close gaps/trapped positions partially. If this is selected, it will reduce the box size as price is traded through the area. If it is not selected, the box will only disappear once price has traded through the entire box completely.
There are some additional settings that allow you to tailor how many boxes show up on the chart. These settings are as follows:
- Max number of boxes. This setting will only plot up to this number of gaps/trapped positions.
- Minimum Deviation. This will prevent gaps/trapped positions from showing if they are too small relative to average across that last 14 periods.
- Limit Max Box Trail Length (bars). If checkbox is selected, the box will stop being extended after X number of bars given in this input.

Gap Detector [MS]This indicator helps traders identify and visualize price gaps in market data. When price movements create gaps between trading sessions or periods, the script highlights these areas with colored clouds and markers.
Key Features:
Automatically detects price gaps based on a customizable gap percentage threshold
Visualizes gaps using color-coded clouds (green when price moves upward, red for downward price action)
Places small triangle markers at gap locations for easy identification of gaps, and if many happen close together
Shows gray clouds when price is within the last gap
Use it For:
Watching for gap-fills
Gap support/resistance levels
Trading gap breakouts
...and more
How it Works:
The script compares each bar's opening price with the previous bar's closing price. A gap is identified when the opening price is significantly different from the previous close (beyond the user-defined gap percentage). The gap area is then marked with a colored cloud:
Green clouds: Show gaps where price jumped higher
Red clouds: Show gaps where price dropped lower
Gray clouds: Indicate price action within the gap
Settings:
Gap %: Controls the minimum price difference required to identify a gap (default 0.01 or 1%)
This indicator can help traders:
Identify potential support/resistance levels at gap areas
Monitor gap-filling scenarios
Spot significant price movements between trading sessions
The script is designed to work across all timeframes and markets.

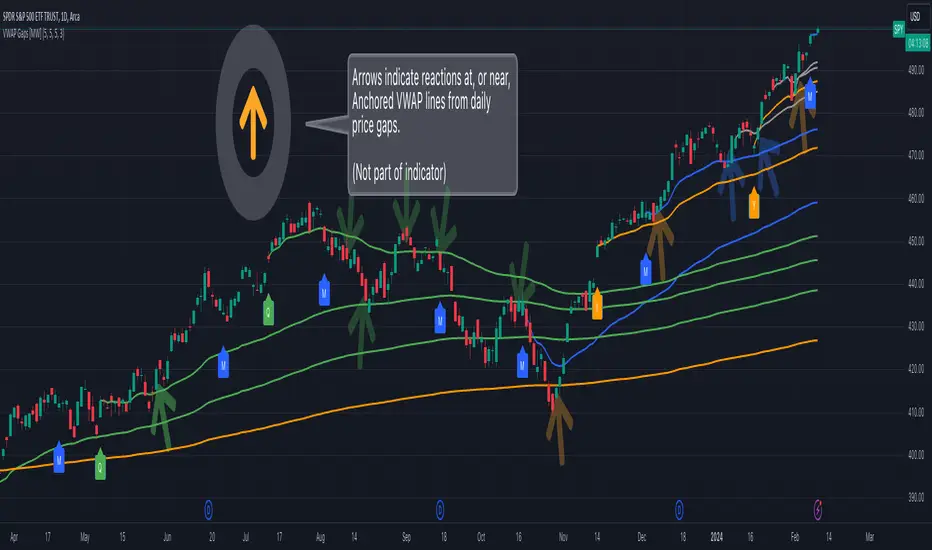
Multi VWAP from Gaps [MW]Multi VWAP from Gaps
Introduction
The Multi VWAP from Gaps tool extends the concept of using the Anchored Volume Weighted Average Price, popularized by its founder, Brian Shannon, founder of AlphaTrends. It creates automatic AVWAPS for anchor points originating at the biggest gaps of the week, month, quarter and year. Currently, most standard VWAP tools allow users to place custom anchored VWAPs, but the routine of doing this for every equity being watched can become cumbersome. This tool makes that process multi-times easier. Considering that large gaps can represent a shift in market structure, this tool provides unique and immediate insight into how past daily price gaps can and have affected price action.
Settings
LABEL SETTINGS
Show Biggest Gap of Week | Month | Quarter : Toggle labels that identify the location of the biggest gaps for the selected time period.
Show Big Labels : Toggle labels from showing the date and gap size to just showing a single letter (W/M/Q/Y) designating the time period that the gap is from.
Hide All Labels : Turn labels off and on.
MAX VWAP LINES
Max Weekly | Monthly | Quarterly | Yearly Lines : How many VWAP lines, starting from today, should be shown for the specified time period. Max: 5
SHOW VWAP LINES
Show Weekly | Monthly | Quarterly | Yearly Lines : This feature allows you to remove lines for the specified time period.
Calculations
This indicator does not provide buy or sell signals. It is simply the VWAP calculated starting from an “anchor point”, or start time. It is calculated by the summation of Price x Volume / Volume for the period starting at the anchor point.
How to Interpret
According to Brian Shannon, VWAP is an objective measure of what the average trader has paid for a particular equity over a given period, and is the value that large institutional investors frequently use as a trade signal. Therefore, by definition, when the price is above an AVWAP, buyers are in control for that period of time. Likewise, if the price is below the AVWAP, sellers are in control for that period of time.
VWAPs that coincide with important events, such as FOMC meetings, CPI reports, earnings reports, have added significance. In many cases, these events can cause gaps to happen in day-to-day price movement, and can affect market structure going forward.
Practically speaking, price action can tend to change direction when a significant VWAP is hit, voiding buy and sell signals. Like moving averages, this indicator can show, in real-time, how a buy or sell signal should be interpreted. A significant AVWAP line is a point of interest, and can serve as strong support or resistance, because large institutions may be using those values for entries or exits. For a great analysis of how to use AVWAP, visit the AlphaTrends channel on Youtube here or you can buy Brian Shannon’s “Anchored VWAP” book on Amazon.
Other Usage Notes and Limitations
It's important for traders to be aware of the limitations of any indicator and to use them as part of a broader, well-rounded trading strategy that includes risk management, fundamental analysis, and other tools that can help with reducing false signals, determining trend direction, and providing additional confirmation for a trade decision. Diversifying strategies and not relying solely on one type of indicator or analysis can help mitigate some of these risks.
Additionally, in order to build the VWAP calculations, past data is needed that may not be available on shorter timeframes. The workaround is that for some longer-term VWAP lines on shorter timeframes, you may see less than the total of lines that you selected in settings. This is particularly the case with quarterly VWAP lines on the 5 minute timeframe for some equities.
Acknowledgements
This script uses the MarketHolidays library by @Protervus. Also, for debugging, the JavaScript-style Debug Console by @algotraderdev was invaluable. Special thanks to @antsmuzic for helping review and debug the script. And, of course, without Brian Shannon's books, videos, and interviews, this indicator would would not have happened.
Nirmal Fair Value GapsICT Fair Value Gaps
Trade Wisely
How a Fair Value Gap Works
Formation:
A Fair Value Gap occurs when a strong price movement (usually from institutional orders) creates an imbalance between buyers and sellers.
This is typically seen in a three-candle pattern, where the middle candle has a large body, and the two surrounding candles have wicks but little overlap with the middle candle’s range.
Identification:
The FVG is marked between the high of the first candle and the low of the third candle (for bullish gaps).
For bearish gaps, it’s the low of the first candle and the high of the third candle.
Market Behavior Around FVG:
Price often retraces into the gap before resuming its original direction.
This happens because the market seeks to "fill" the imbalance where few trades occurred.
Traders use FVGs as potential entry zones for trend continuation trades.
Trading Fair Value Gaps
In an Uptrend:
Look for bullish fair value gaps as potential support zones for buy entries.
Price may dip into the gap and then continue upward.
In a Downtrend:
Look for bearish fair value gaps as potential resistance zones for sell entries.
Price may retrace into the gap and then drop further.
Confluence Factors:
FVGs work best when combined with other strategies like order blocks, liquidity zones, or key Fibonacci levels.

Daily Gap Highlighter (Partial Gaps + Age Filter)Daily Gap Highlighter – 部分的な窓の未埋めエリアを自動描画
このインジケーターは、日足チャートにおける窓(ギャップ)を自動で検出し、
その後の値動きで一部だけ埋まった場合も、埋め残し部分だけを正確に描画するツールです。
🔍 主な特徴
日足ベースで窓を検出
上窓:当日の安値 > 前日の高値
下窓:当日の高値 < 前日の安値
部分的な窓埋めにも対応
例:窓の90%が埋まった → 残り10%だけ窓として残す
完全に埋まった窓は自動的に削除
窓の“鮮度フィルター”を搭載
指定した日数(デフォルト90日)を経過した古い窓は自動で非表示にできます。
トレンド転換ポイントの可視化に最適
未埋めギャップは多くのトレーダーが注目する価格帯であり、
サポート/レジスタンスとして高い機能を持ちます。
📈 活用例
スイングトレードでのターゲット設定
窓埋めの完了・未完了の判定
重要水平ラインとしての分析
長期的な価格メモリーの可視化
日足チャートを使うトレーダーの方にとって、
“本当に意味のある未埋め窓だけ”が残る実用的なインジケーターです。
🇺🇸 English Description (for TradingView Community)
Daily Gap Highlighter – Precise Partial Gap Visualization
This indicator automatically detects daily price gaps and visualizes them on the chart —
but with one powerful upgrade:
It keeps only the unfilled portion of the gap.
🔍 Key Features
Daily-based gap detection
Up Gap: Today’s Low > Previous High
Down Gap: Today’s High < Previous Low
Partial gap filling supported
Example: If 90% of the gap has been filled,
→ Only the remaining 10% is still shown as an active gap.
Fully filled gaps are automatically removed
Gap “age filter” included
Automatically hide gaps older than a chosen number of days (default: 90).
Great for identifying key market levels
Unfilled gaps often act as strong support/resistance zones
and are widely watched by professional traders.
📈 Use Cases
Setting targets for swing trades
Determining whether a gap is filled or partially filled
Highlighting significant horizontal price levels
Visualizing long-term market memory zones
This tool is ideal for traders who want
a clean and accurate view of meaningful unfilled gaps only.

Volume Gaps & Imbalances (Zeiierman)█ Overview
Volume Gaps & Imbalances (Zeiierman) is an advanced market-structure and order-flow visualizer that maps where the market traded, where it did not, and how buyer-vs-seller pressure accumulated across the entire price range.
The core of the indicator is a price-by-price volume profile built from Bullish and Bearish volume assignments. The script highlights:
True zero-volume voids (regions of no traded volume)
Bull/Bear imbalance rows (horizontal volume slices)
A multi-section Delta Panel, showing aggregated Buy–Sell pressure per vertical sector
A clean separation between profile structure, volume efficiency, and delta flows
Together, these components reveal market inefficiencies, displacement zones, and fair-value regions that price tends to revisit — making it an exceptional tool for structural trading, order-flow analysis, and contextual confluence.
Highlights
Identifies true volume voids (untraded price regions), more precisely than standard FVG tools
Plots Bull vs Bear volume at each price row for fine-grained imbalance reading
Includes a sector-based Delta Grid that aggregates Buy–Sell dominance
█ How It Works
⚪ Profile Construction
The indicator scans a user-defined Lookback window and divides the full high–low range into Rows. Each bar's volume is allocated into the correct price bucket:
Bullish volume when close > open
Bearish volume when close <= open
This produces three values per price level:
Bull Volume
Bear Volume
Total Volume & Imbalance Profile
Rows where no volume at all occurred are marked as volume gaps — signaling true untraded zones, often produced by impulsive imbalanced moves.
⚪ Zero-Volume Gaps (True Voids)
Unlike candle-based Fair Value Gaps (FVGs), volume gaps identify the deeper, structural inefficiency: Price moved so fast through a region that no trades occurred at those prices. These areas often attract revisits because liquidity never exchanged hands there.
⚪ Bull/Bear Volume Imbalance
Every price row is drawn using two colored horizontal segments:
Bull segment proportional to bullish volume
Bear segment proportional to bearish volume
This reveals where buyers or sellers dominated individual price levels.
⚪ Delta Panel
The full volume profile is cut into Summary Sections. For each block, the script computes: Δ = (Bull Volume − Bear Volume) ÷ Total Volume × 100%
█ How to Use
⚪ Spot True Voids & Inefficiencies
Zero-volume zones highlight where the price moved without trading. These areas often behave like:
Refill zones during retracements
Targets during displacement
Thin regions price slices through quickly
Ideal for both SMC-style trading and structural mapping.
⚪ Identify Bull/Bear Control at Each Price Level
Broad bullish segments show zones of buyer absorption, while wide bearish slices reveal seller control.
This helps you interpret:
Where buyers supported the price
Where sellers defended a level
Which price levels matter for continuation or reversal
⚪ Use Delta Sectors for Contextual Direction
The delta panel shows where market pressure is accumulating, revealing whether the profile is dominated by:
Bullish flow (positive delta)
Bearish flow (negative delta)
Neutral flow (balanced or minimal delta)
█ Settings
Lookback – Number of bars scanned to build the profile.
Rows – Vertical resolution of price bins.
Source – Price source used to assign volume into rows.
Summary Sections – Number of vertical delta sectors.
Summary Width – Horizontal size of the delta bar panel.
Gap From Profile – Distance between profile and delta grid.
Show Delta Text – Toggle Δ% labels.
-----------------
Disclaimer
The content provided in my scripts, indicators, ideas, algorithms, and systems is for educational and informational purposes only. It does not constitute financial advice, investment recommendations, or a solicitation to buy or sell any financial instruments. I will not accept liability for any loss or damage, including without limitation any loss of profit, which may arise directly or indirectly from the use of or reliance on such information.
All investments involve risk, and the past performance of a security, industry, sector, market, financial product, trading strategy, backtest, or individual's trading does not guarantee future results or returns. Investors are fully responsible for any investment decisions they make. Such decisions should be based solely on an evaluation of their financial circumstances, investment objectives, risk tolerance, and liquidity needs.
