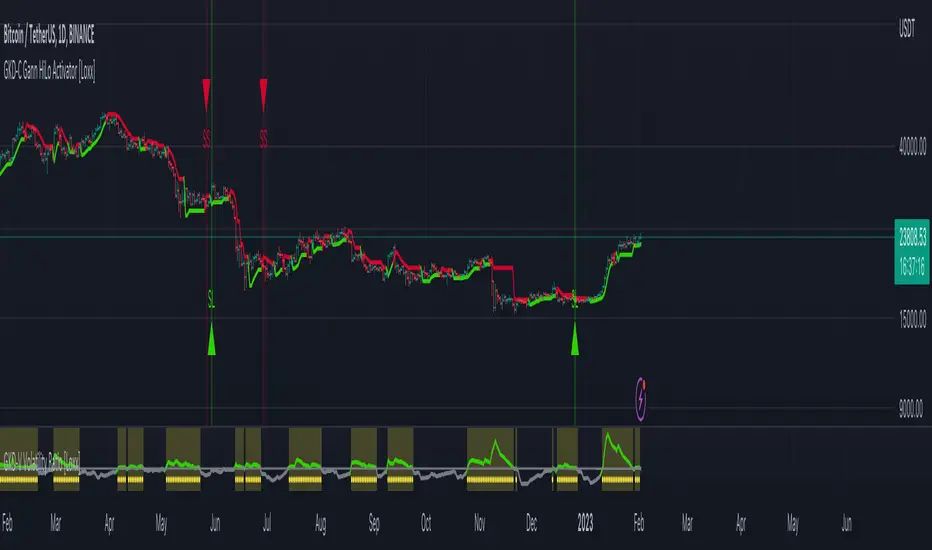
GKD-C Gann HiLo Activator [Loxx]Giga Kaleidoscope Gann HiLo Activator Averages is a Confirmation module included in Loxx's "Giga Kaleidoscope Modularized Trading System".
█ Giga Kaleidoscope Modularized Trading System
What is Loxx's "Giga Kaleidoscope Modularized Trading System"?
The Giga Kaleidoscope Modularized Trading System is a trading system built on the philosophy of the NNFX (No Nonsense Forex) algorithmic trading.
What is an NNFX algorithmic trading strategy?
The NNFX algorithm is built on the principles of trend, momentum, and volatility. There are six core components in the NNFX trading algorithm:
1. Volatility - price volatility; e.g., Average True Range, True Range Double, Close-to-Close, etc.
2. Baseline - a moving average to identify price trend
3. Confirmation 1 - a technical indicator used to identify trends
4. Confirmation 2 - a technical indicator used to identify trends
5. Continuation - a technical indicator used to identify trends
6. Volatility/Volume - a technical indicator used to identify volatility/volume breakouts/breakdown
7. Exit - a technical indicator used to determine when a trend is exhausted
How does Loxx's GKD (Giga Kaleidoscope Modularized Trading System) implement the NNFX algorithm outlined above?
Loxx's GKD v1.0 system has five types of modules (indicators/strategies). These modules are:
1. GKD-BT - Backtesting module (Volatility, Number 1 in the NNFX algorithm)
2. GKD-B - Baseline module (Baseline and Volatility/Volume, Numbers 1 and 2 in the NNFX algorithm)
3. GKD-C - Confirmation 1/2 and Continuation module (Confirmation 1/2 and Continuation, Numbers 3, 4, and 5 in the NNFX algorithm)
4. GKD-V - Volatility/Volume module (Confirmation 1/2, Number 6 in the NNFX algorithm)
5. GKD-E - Exit module (Exit, Number 7 in the NNFX algorithm)
(additional module types will added in future releases)
Each module interacts with every module by passing data between modules. Data is passed between each module as described below:
GKD-B => GKD-V => GKD-C(1) => GKD-C(2) => GKD-C(Continuation) => GKD-E => GKD-BT
That is, the Baseline indicator passes its data to Volatility/Volume. The Volatility/Volume indicator passes its values to the Confirmation 1 indicator. The Confirmation 1 indicator passes its values to the Confirmation 2 indicator. The Confirmation 2 indicator passes its values to the Continuation indicator. The Continuation indicator passes its values to the Exit indicator, and finally, the Exit indicator passes its values to the Backtest strategy.
This chaining of indicators requires that each module conform to Loxx's GKD protocol, therefore allowing for the testing of every possible combination of technical indicators that make up the six components of the NNFX algorithm.
What does the application of the GKD trading system look like?
Example trading system:
Backtest: Strategy with 1-3 take profits, trailing stop loss, multiple types of PnL volatility, and 2 backtesting styles
Baseline: Hull Moving Average
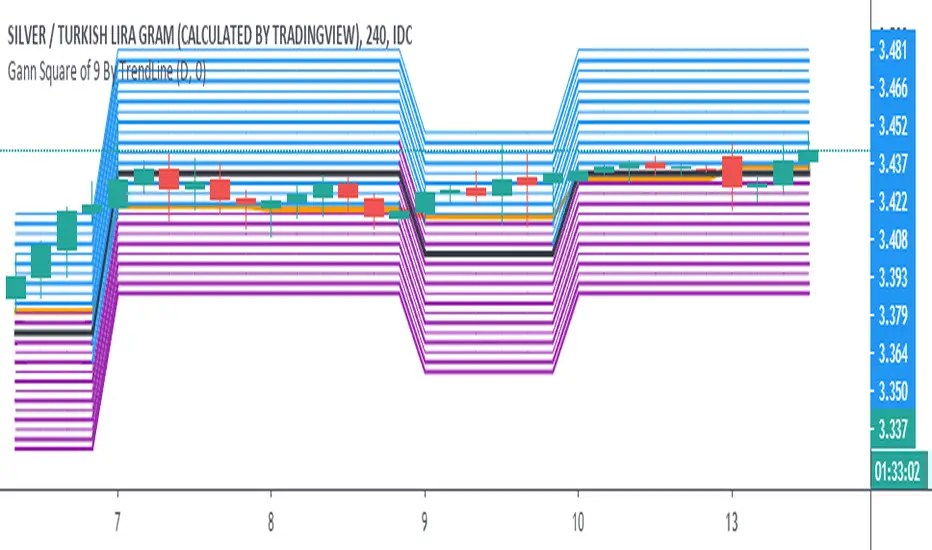
Volatility/Volume: Volatility Ratio as shown on the chart above
Confirmation 1: Gann HiLo Activator Averages as shown on the chart above
Confirmation 2: Williams Percent Range
Continuation: Fisher Transform
Exit: Rex Oscillator
Each GKD indicator is denoted with a module identifier of either: GKD-BT, GKD-B, GKD-C, GKD-V, or GKD-E. This allows traders to understand to which module each indicator belongs and where each indicator fits into the GKD protocol chain.
Giga Kaleidoscope Modularized Trading System Signals (based on the NNFX algorithm)
Standard Entry
1. GKD-C Confirmation 1 Signal
2. GKD-B Baseline agrees
3. Price is within a range of 0.2x Volatility and 1.0x Volatility of the Goldie Locks Mean
4. GKD-C Confirmation 2 agrees
5. GKD-V Volatility/Volume agrees
Baseline Entry
1. GKD-B Baseline signal
2. GKD-C Confirmation 1 agrees
3. Price is within a range of 0.2x Volatility and 1.0x Volatility of the Goldie Locks Mean
4. GKD-C Confirmation 2 agrees
5. GKD-V Volatility/Volume agrees
6. GKD-C Confirmation 1 signal was less than 7 candles prior
Continuation Entry
1. Standard Entry, Baseline Entry, or Pullback; entry triggered previously
2. GKD-B Baseline hasn't crossed since entry signal trigger
3. GKD-C Confirmation Continuation Indicator signals
4. GKD-C Confirmation 1 agrees
5. GKD-B Baseline agrees
6. GKD-C Confirmation 2 agrees
1-Candle Rule Standard Entry
1. GKD-C Confirmation 1 signal
2. GKD-B Baseline agrees
3. Price is within a range of 0.2x Volatility and 1.0x Volatility of the Goldie Locks Mean
Next Candle:
1. Price retraced (Long: close < close or Short: close > close )
2. GKD-B Baseline agrees
3. GKD-C Confirmation 1 agrees
4. GKD-C Confirmation 2 agrees
5. GKD-V Volatility/Volume agrees
1-Candle Rule Baseline Entry
1. GKD-B Baseline signal
2. GKD-C Confirmation 1 agrees
3. Price is within a range of 0.2x Volatility and 1.0x Volatility of the Goldie Locks Mean
4. GKD-C Confirmation 1 signal was less than 7 candles prior
Next Candle:
1. Price retraced (Long: close < close or Short: close > close )
2. GKD-B Baseline agrees
3. GKD-C Confirmation 1 agrees
4. GKD-C Confirmation 2 agrees
5. GKD-V Volatility/Volume Agrees
PullBack Entry
1. GKD-B Baseline signal
2. GKD-C Confirmation 1 agrees
3. Price is beyond 1.0x Volatility of Baseline
Next Candle:
1. Price is within a range of 0.2x Volatility and 1.0x Volatility of the Goldie Locks Mean
3. GKD-C Confirmation 1 agrees
4. GKD-C Confirmation 2 agrees
5. GKD-V Volatility/Volume Agrees
█ Gann HiLo Activator Averages
What is Gann HiLo Activator Averages?
Developed by Robert Krausz, the Gann HiLo Activator is a trend-following technical indicator used to help determine the trends direction and to generate with-trend entry signals. It is best combined with the Gann Swing Indicator and the Gann Trend Indicator (will be reviewed in the following articles) as part of a trading system, commonly known as the “New Gann Swing Chartist Plan”.
The Gann HiLo Activator is a simple moving average of the previous three periods highs or lows. Based on the moving averages logic, it is a trend-following indicator used to reflect the markets direction of movement. Within the trading system we mentioned earlier, the Gann HiLo activator is responsible for generating entry signals, but also helps determine stop-loss levels. Here is how it looks in a trading platform.
This version has 62 Moving Averages to choose from.
Requirements
Inputs
Confirmation 1 and Solo Confirmation: GKD-V Volatility / Volume indicator
Confirmation 2: GKD-C Confirmation indicator
Outputs
Confirmation 2 and Solo Confirmation: GKD-E Exit indicator
Confirmation 1: GKD-C Confirmation indicator
Continuation: GKD-E Exit indicator
Additional features will be added in future releases.
스크립트에서 "gann"에 대해 찾기
price Degree on gann master chartThis indicator calculates price degree on gann' s master chart. it will plot degree of open (red stepline), close(green stepline), high(white cross), low(red cross).
I request, only people who know how to use gann master chart and degrees of price use this. no one made this indicator till now. It is highly potential tool for gann gann fans.
happy trading!
comment if you like.
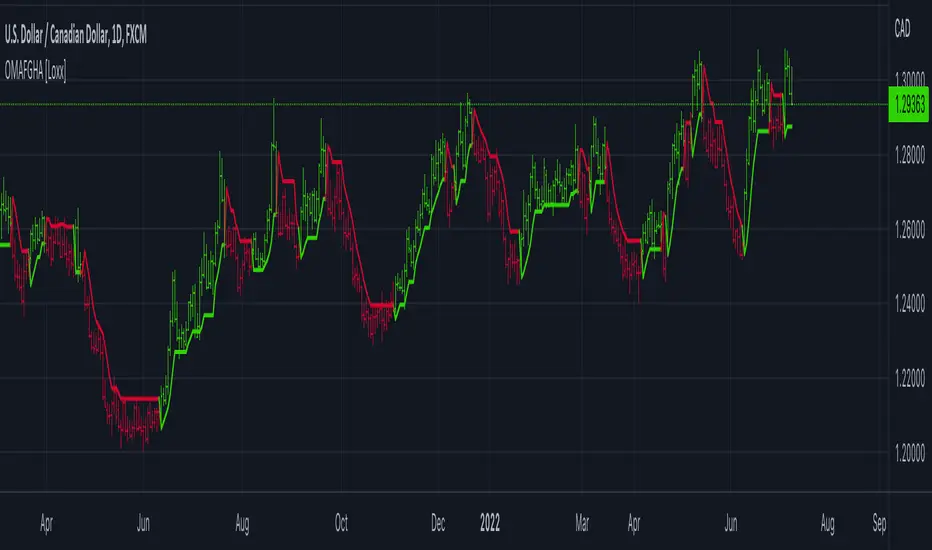
OMA-Filtered, Gann HiLo Activator [Loxx]OMA-Filtered, Gann HiLo Activator is a Gann HiLo activator that uses OMA filtering instead SMA filtering. This GHA calculation also includes a variable for close period to further tune the indicator.
What is Gann HiLo?
The HiLo Activator study is a trend-following indicator introduced by Robert Krausz as part of the Gann Swing trading strategy. In addition to indicating the current trend direction, this can be used as both entry signal and trailing stop.
Here is how the HiLo Activator is calculated:
1. The system calculates the moving averages of the high and low prices over the last several candles. By default, the average is calculated using the last three candles.
2. If the close price falls below the average low or rises above the average high, the system plots the opposite moving average. For example, if the price crosses above the average high, the system will plot the average low. If the price crosses below the average low afterward, the system will stop plotting the average low and will start plotting the average high, and so forth .
The plot of the HiLo Activator thus consists of sections on the top and bottom of the price plot. The sections on the bottom signify bullish trending conditions. Vice versa, those on the top signify the bearish conditions.
Included
-Toggle bar color on/off
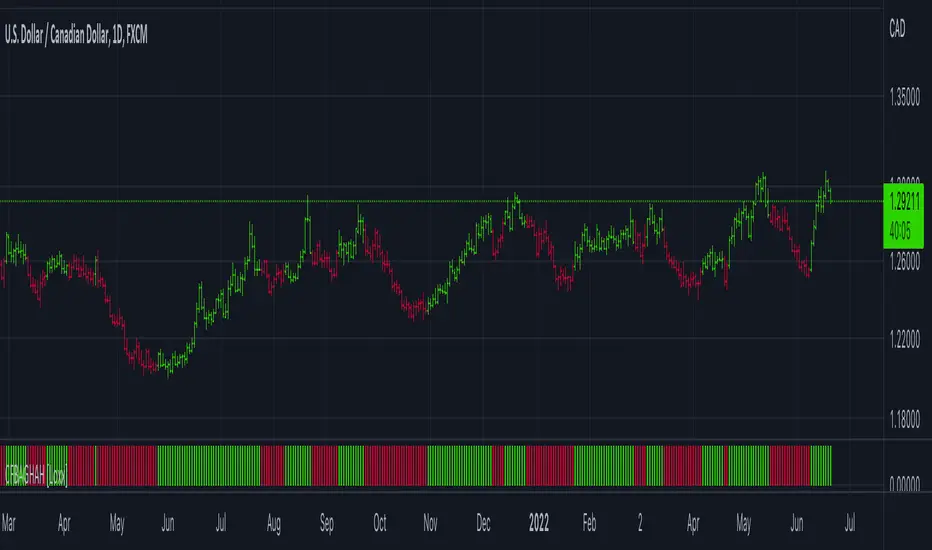
CFB Adaptive Gann HiLo Activator Histogram [Loxx]CFB Adaptive Gann HiLo Activator Histogram is a Composite-Fractal-Behavior-adaptive Gann HiLo activator in histogram form that has been smoothed using Jurik Filtering to reduce noise and better identify trending markets. This indicator is the CFB adaptive version of Jurik-Filtered, Gann HiLo Activator .
What is Gann HiLo
The HiLo Activator study is a trend-following indicator introduced by Robert Krausz as part of the Gann Swing trading strategy. In addition to indicating the current trend direction, this can be used as both entry signal and trailing stop.
Here is how the HiLo Activator is calculated:
1. The system calculates the moving averages of the high and low prices over the last several candles. By default, the average is calculated using the last three candles.
2. If the close price falls below the average low or rises above the average high, the system plots the opposite moving average. For example, if the price crosses above the average high, the system will plot the average low. If the price crosses below the average low afterward, the system will stop plotting the average low and will start plotting the average high, and so forth .
The plot of the HiLo Activator thus consists of sections on the top and bottom of the price plot. The sections on the bottom signify bullish trending conditions. Vice versa, those on the top signify the bearish conditions.
What is Composite Fractal Behavior ( CFB )?
All around you mechanisms adjust themselves to their environment. From simple thermostats that react to air temperature to computer chips in modern cars that respond to changes in engine temperature, r.p.m.'s, torque, and throttle position. It was only a matter of time before fast desktop computers applied the mathematics of self-adjustment to systems that trade the financial markets.
Unlike basic systems with fixed formulas, an adaptive system adjusts its own equations. For example, start with a basic channel breakout system that uses the highest closing price of the last N bars as a threshold for detecting breakouts on the up side. An adaptive and improved version of this system would adjust N according to market conditions, such as momentum, price volatility or acceleration.
Since many systems are based directly or indirectly on cycles, another useful measure of market condition is the periodic length of a price chart's dominant cycle, (DC), that cycle with the greatest influence on price action.
The utility of this new DC measure was noted by author Murray Ruggiero in the January '96 issue of Futures Magazine. In it. Mr. Ruggiero used it to adaptive adjust the value of N in a channel breakout system. He then simulated trading 15 years of D-Mark futures in order to compare its performance to a similar system that had a fixed optimal value of N. The adaptive version produced 20% more profit!
This DC index utilized the popular MESA algorithm (a formulation by John Ehlers adapted from Burg's maximum entropy algorithm, MEM). Unfortunately, the DC approach is problematic when the market has no real dominant cycle momentum, because the mathematics will produce a value whether or not one actually exists! Therefore, we developed a proprietary indicator that does not presuppose the presence of market cycles. It's called CFB (Composite Fractal Behavior) and it works well whether or not the market is cyclic.
CFB examines price action for a particular fractal pattern, categorizes them by size, and then outputs a composite fractal size index. This index is smooth, timely and accurate
Essentially, CFB reveals the length of the market's trending action time frame. Long trending activity produces a large CFB index and short choppy action produces a small index value. Investors have found many applications for CFB which involve scaling other existing technical indicators adaptively, on a bar-to-bar basis.
What is Jurik Volty used in the Juirk Filter?
One of the lesser known qualities of Juirk smoothing is that the Jurik smoothing process is adaptive. "Jurik Volty" (a sort of market volatility ) is what makes Jurik smoothing adaptive. The Jurik Volty calculation can be used as both a standalone indicator and to smooth other indicators that you wish to make adaptive.
What is the Jurik Moving Average?
Have you noticed how moving averages add some lag (delay) to your signals? ... especially when price gaps up or down in a big move, and you are waiting for your moving average to catch up? Wait no more! JMA eliminates this problem forever and gives you the best of both worlds: low lag and smooth lines.
Ideally, you would like a filtered signal to be both smooth and lag-free. Lag causes delays in your trades, and increasing lag in your indicators typically result in lower profits. In other words, late comers get what's left on the table after the feast has already begun.
Included
-Toggle bar color on/off
CFB Adaptive, Jurik-Filtered Gann HiLo Activator [Loxx]CFB Adaptive, Jurik-Filtered Gann HiLo Activator is a Composite-Fractal-Behavior-adaptive Gann HiLo activator that has been smoothed using Jurik Filtering to reduce noise and better identify trending markets. This indicator is the CFB adaptive version of Jurik-Filtered, Gann HiLo Activator .
What is Gann HiLo
The HiLo Activator study is a trend-following indicator introduced by Robert Krausz as part of the Gann Swing trading strategy. In addition to indicating the current trend direction, this can be used as both entry signal and trailing stop.
Here is how the HiLo Activator is calculated:
1. The system calculates the moving averages of the high and low prices over the last several candles. By default, the average is calculated using the last three candles.
2. If the close price falls below the average low or rises above the average high, the system plots the opposite moving average. For example, if the price crosses above the average high, the system will plot the average low. If the price crosses below the average low afterward, the system will stop plotting the average low and will start plotting the average high, and so forth .
The plot of the HiLo Activator thus consists of sections on the top and bottom of the price plot. The sections on the bottom signify bullish trending conditions. Vice versa, those on the top signify the bearish conditions.
What is Composite Fractal Behavior (CFB)?
All around you mechanisms adjust themselves to their environment. From simple thermostats that react to air temperature to computer chips in modern cars that respond to changes in engine temperature, r.p.m.'s, torque, and throttle position. It was only a matter of time before fast desktop computers applied the mathematics of self-adjustment to systems that trade the financial markets.
Unlike basic systems with fixed formulas, an adaptive system adjusts its own equations. For example, start with a basic channel breakout system that uses the highest closing price of the last N bars as a threshold for detecting breakouts on the up side. An adaptive and improved version of this system would adjust N according to market conditions, such as momentum, price volatility or acceleration.
Since many systems are based directly or indirectly on cycles, another useful measure of market condition is the periodic length of a price chart's dominant cycle, (DC), that cycle with the greatest influence on price action.
The utility of this new DC measure was noted by author Murray Ruggiero in the January '96 issue of Futures Magazine. In it. Mr. Ruggiero used it to adaptive adjust the value of N in a channel breakout system. He then simulated trading 15 years of D-Mark futures in order to compare its performance to a similar system that had a fixed optimal value of N. The adaptive version produced 20% more profit!
This DC index utilized the popular MESA algorithm (a formulation by John Ehlers adapted from Burg's maximum entropy algorithm, MEM). Unfortunately, the DC approach is problematic when the market has no real dominant cycle momentum, because the mathematics will produce a value whether or not one actually exists! Therefore, we developed a proprietary indicator that does not presuppose the presence of market cycles. It's called CFB (Composite Fractal Behavior) and it works well whether or not the market is cyclic.
CFB examines price action for a particular fractal pattern, categorizes them by size, and then outputs a composite fractal size index. This index is smooth, timely and accurate
Essentially, CFB reveals the length of the market's trending action time frame. Long trending activity produces a large CFB index and short choppy action produces a small index value. Investors have found many applications for CFB which involve scaling other existing technical indicators adaptively, on a bar-to-bar basis.
What is Jurik Volty used in the Juirk Filter?
One of the lesser known qualities of Juirk smoothing is that the Jurik smoothing process is adaptive. "Jurik Volty" (a sort of market volatility ) is what makes Jurik smoothing adaptive. The Jurik Volty calculation can be used as both a standalone indicator and to smooth other indicators that you wish to make adaptive.
What is the Jurik Moving Average?
Have you noticed how moving averages add some lag (delay) to your signals? ... especially when price gaps up or down in a big move, and you are waiting for your moving average to catch up? Wait no more! JMA eliminates this problem forever and gives you the best of both worlds: low lag and smooth lines.
Ideally, you would like a filtered signal to be both smooth and lag-free. Lag causes delays in your trades, and increasing lag in your indicators typically result in lower profits. In other words, late comers get what's left on the table after the feast has already begun.
Included
-Toggle bar color on/off

Degree Gann NumbersThe script plots numbers from Cardinal & Ordinal lines of Gann square of 9 for a given range. Inputs required are the degree of cardinal or Ordinal line & Range Min & Max Number.
For example, if we want to plot 45-225-degree Ordinal line numbers from Gann square of 9, on the chart for a range of 50 to 600, Input for the degree will be 45 & Range Min =50 / Range Max = 600
if we want to plot 90-270-degree Cardinal line numbers on the chart for a range of 50 to 600, Input for the degree will be 90 & Range Min =50 / Range Max = 600
Gann Volume Swing (GVS)## **Gann Volume Swing (GVS) Indicator**
*Professional Hybrid Volume-Gann Reversal Detector*
### **Core Concept & Purpose**
The Gann Volume Swing (GVS) indicator is a sophisticated trading tool designed to identify high-probability reversal points by integrating three key market dimensions: **volume dynamics**, **geometric price levels**, and **momentum confirmation**. Developed for serious technical traders, GVS addresses the common challenge of distinguishing meaningful breakouts/reversals from temporary noise.
The indicator operates on the principle that **significant volume expansions** at **precise geometric support/resistance levels** (derived from Gann theory) often precede substantial price movements. By combining these elements with traditional momentum filters (RSI, MACD), GVS provides a multi-factor approach to market timing.
### **Theoretical Foundation**
The methodology synthesizes:
1. **Wyckoff's Volume-Price Relationship**: Volume precedes and confirms price action
2. **Gann's Geometric Trading**: Price moves in predictable angular patterns from swing points
3. **Modern Momentum Filters**: Additional confirmation from established oscillators
This creates a robust framework that respects both classical technical analysis and contemporary trading psychology.
---
## **TECHNICAL ARCHITECTURE**
### **1. Volume Engine Module**
```
Inputs:
• Volume MA Period (20): Smoothing window for volume baseline
• Volume Multiplier (2.0): Threshold for "abnormal" volume detection
Calculation Logic:
Current Volume > AND
Current Volume >
Output: Boolean flag signaling institutional-grade participation
```
### **2. Gann Geometry Module**
```
Pivot Detection:
• Swing Highs: PivotHigh(25,25) - Identifies significant peaks
• Swing Lows: PivotLow(25,25) - Identifies significant troughs
Line Generation:
• 1x1 Lines: Base angular lines from pivots (45-degree equivalents)
• 2x1 Lines: Secondary steeper/flatter lines (dynamic angles)
Key Parameter:
• Gann Sensitivity (0.5): Controls line steepness (0.1=flat, 1.0=steep)
```
### **3. Signal Generation Logic**
```
Long Signal =
+ + + +
Short Signal =
+ + + +
Anti-Whipsaw Protection:
• 5-bar cooldown between same-direction signals
• Proximity threshold: 0.5×ATR from Gann lines
```
### **4. Visualization System**
```
Primary Elements:
• Real-time Gann lines (4 colors, 2 styles)
• Signal markers (▲/▼ triangles)
• Bar coloring (lime/red highlights)
Display Control:
• Toggle Gann lines on/off
• Adjust transparency levels
• Custom alert configurations
```
---
## **QUICK REFERENCE CARD**
**GANN VOLUME SWING (GVS)**
*Volume-Powered Geometric Reversal Indicator*
### **🔧 PARAMETER SETTINGS**
**VOLUME GROUP**
`Volume MA Period`: 20 (14-30 range)
`Volume Multiplier`: 2.0 (1.5-2.5 optimal)
**GANN GROUP**
`Swing Period`: 50 bars (pivot sensitivity)
`Gann Sensitivity`: 0.3-0.5 (adjust for market type)
**FILTERS GROUP**
`RSI Period`: 14 (standard)
`Use Filters`: ON (recommended)
**DISPLAY GROUP**
`Show Gann Levels`: ON
`Cooldown Bars`: 5 (prevents signal flooding)
### **🎯 SIGNAL INTERPRETATION**
**LONG SETUP (Green ▲)**
- Volume spike (2× average) + Price at Gann support + Bullish candle
- Entry: Close of signal bar
- SL: 1.5×ATR below support line
- TP: Next Gann resistance or 2:1 R/R
**SHORT SETUP (Red ▼)**
- Volume spike + Price at Gann resistance + Bearish candle
- Entry: Close of signal bar
- SL: 1.5×ATR above resistance line
- TP: Next Gann support or 2:1 R/R
### **📊 VISUAL ELEMENTS KEY**
**LINES**
- `Solid Green`: 1x1 Support (primary)
- `Solid Red`: 1x1 Resistance (primary)
- `Blue Dots`: 2x1 Support (secondary)
- `Orange Dots`: 2x1 Resistance (secondary)
**MARKERS**
- `▲ Below Bar`: Long signal
- `▼ Above Bar`: Short signal
- `Bar Coloring`: Confirmation highlight
### **⚙️ OPTIMIZATION GUIDE**
**TRENDING MARKETS**
- Sensitivity: 0.2-0.3 (shallower angles)
- Volume Multiplier: 1.8-2.0
- Filters: Strict (RSI 65/35)
**RANGING MARKETS**
- Sensitivity: 0.6-0.8 (steeper angles)
- Volume Multiplier: 2.2-2.5
- Filters: Moderate (RSI 70/30)
**HIGH VOLATILITY**
- Increase ATR multiplier to 0.7-1.0
- Extend cooldown to 7-10 bars
- Require stronger volume confirmation
### **🚫 LIMITATIONS & NOTES**
**KNOWN CONSTRAINTS**
- Less effective in extremely choppy markets
- Requires adequate historical data (200+ bars)
- Volume reliability varies by asset class
- Gann lines repaint as new pivots form
**BEST PRACTICES**
- Combine with higher timeframe trend analysis
- Use on 1H+ charts for reliability
- Wait for close confirmation before acting
- Track win rate by market condition
**ALERT CONFIGURATION**
- Enable both Long/Short alerts
- Set to "Once Per Bar Close"
- Include ATR distance in alert message
- Log all signals for performance review
---
## **TRADING SYSTEM INTEGRATION**
### **Recommended Confluence Factors**
1. **Trend Alignment** (Higher timeframe direction)
2. **Market Structure** (Support/Resistance clusters)
3. **Economic Context** (News event proximity)
4. **Session Timing** (High-volume trading hours)
### **Risk Management Protocol**
- Maximum risk: 1% per trade
- Correlation limit: 2 simultaneous GVS signals
- Daily loss cap: 3% of portfolio
- Weekly review of signal accuracy
### **Performance Metrics to Track**
- Signal-to-Noise ratio (profitable signals/total)
- Average Reward/Risk achieved
- Best/worst market conditions
- Optimal parameter sets per asset
---
## **SUMMARY**
The **Gann Volume Swing** indicator represents a sophisticated approach to technical analysis, blending time-tested principles with modern computational techniques. By focusing on the confluence of **unusual volume**, **geometric price levels**, and **momentum confirmation**, it provides traders with a structured framework for identifying high-quality setups.
**Ideal User Profile**: Intermediate to advanced traders comfortable with multi-factor analysis, geometric concepts, and disciplined risk management.
**Disclaimer**: This tool generates probabilities, not certainties. Always combine with comprehensive market analysis and strict risk control measures.
---
**Version**: 5.0
**Category**: Volume + Geometric Analysis
**Complexity**: Advanced
**Best Timeframe**: 1H - Daily
**Recommended Assets**: Liquid stocks, major Forex pairs, indices

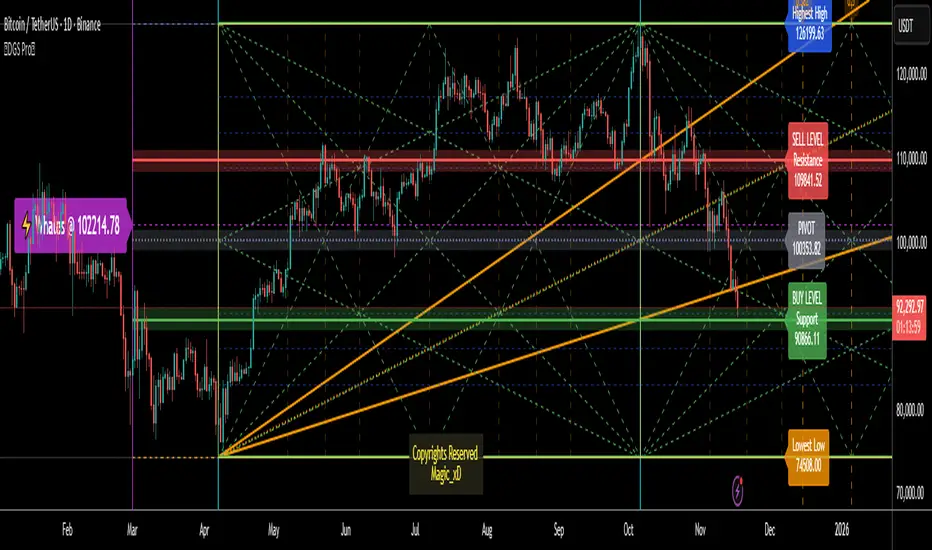
Dynamic Gann Square Pro - [Magic_xD]Premium Gann Analysis System for Professional Traders
Dynamic Gann Square Pro is an advanced technical analysis tool that combines classical Gann theory with modern geometric analysis to identify high-probability support/resistance zones, time cycles, and market turning points.
🎯 What This Indicator Does
This indicator provides a comprehensive suite of Gann-based analytical tools designed to help traders identify:
Dynamic Support & Resistance Levels: Automatically calculated key price zones based on market structure
Gann Square of 9 Calculations: Multiple calculation methods including Range, Daily, Weekly, and Monthly timeframes
Advanced Time Cycle Analysis: Gann cycles, Fibonacci time projections, and Square Root cycles for anticipating market turns
Geometric Pattern Recognition: Gann Stars with customizable shapes (Square, Triangle, Pentagon, Hexagon, Octagon, and more)
Price Action Zones: Color-coded zones highlighting critical decision points
Whale Detection System: Volume-weighted analysis to identify institutional activity
Multi-Timeframe Dashboard: Real-time technical rating system combining 10+ indicators (RSI, MACD, Stochastic, ADX, Bollinger Bands, and more)
📊 Key Features
Flexible Calculation Modes:
Select Candle Mode: Click directly on your chart to select your reference point
Lookback Mode: Define custom lookback periods (1-5000 bars)
Auto-Timeframe Detection: Automatically adjusts to Daily, Weekly, or Monthly ranges
Advanced Gann Tools:
Configurable Gann Square spacing with 17 precision levels (from 0.00000001 to 100000000)
Cycle multipliers (1-10 cycles) representing 360° to 3600° rotations
14 geometric shapes for market division analysis
Infinite Squares projection system for extended future projections
Time Cycle Systems:
Classical Gann Time Cycles with automatic repetition
Extended Fibonacci Time Ratios (0.382, 0.618, 1.618, 2.618, 3.618, up to 21.0)
W.D. Gann Square Root Method for geometric time expansion
Time grid subdivisions with customizable styles
Visual Clarity:
Multiple color themes (Dark Blue, Dark Gray, Black, Dark Green, Dark Purple)
Adjustable line styles (Solid, Dashed, Dotted) for all elements
Customizable labels with offset controls
Zone highlighting with transparency controls
Clean, professional chart presentation
🔮 Who Should Use This
This indicator is designed for:
Experienced traders familiar with Gann analysis methodology
Swing traders looking for high-probability reversal zones
Position traders using geometric and time-based analysis
Technical analysts who incorporate classical market theory
Gold & Forex traders (optimized for XAUUSD, BTCUSD, and major pairs)
⚙️ How to Use
Select Your Mode: Choose between "Select Candle" (click a pivot) or "Lookback" (automatic detection)
Configure Calculation Method: Pick your preferred Gann Square method (Range, Sqr9, Daily, Weekly, Monthly)
Adjust Cycles & Shape: Set the number of cycles and geometric division pattern
Enable Desired Features: Toggle Gann levels, Stars, Time Cycles, Trendlines, and Dashboard as needed
Customize Visual Style: Match your chart theme and preferences
The indicator automatically updates as new price data arrives, continuously calculating fresh support/resistance zones and time projections.
📈 What Makes This Different
Unlike simple support/resistance indicators, Dynamic Gann Square Pro implements authentic W.D. Gann methodology including:
True Square of 9 spiral calculations
Geometric price-time relationships
Natural angle divisions based on sacred geometry
Volume-weighted institutional detection
Multi-indicator consensus analysis
The system combines price analysis with time analysis, recognizing that Gann theory emphasizes both dimensions equally for accurate market forecasting.
⚠️ Important Notes
This is a technical analysis tool and should be used alongside proper risk management
Best results achieved when combined with your existing trading strategy
The indicator works on all timeframes but is optimized for H1, H4, and Daily charts
Customization is key: Spend time adjusting settings to match your trading instrument and style
The dashboard provides a technical rating but is not financial advice
🎓 Educational Foundation
This indicator is built on the teachings of W.D. Gann, one of the most legendary traders of the 20th century, incorporating:
Square of 9 theory
Natural geometric divisions (360° cycles)
Price-time equivalence principles
Support/resistance zone analysis.
Coded by Magic_xD - Ahmed Ramzey
Professional Algorithmic Trading System Developer
All copyrights reserved. This indicator represents years of research into Gann theory combined with modern programming techniques.
Gann Box LogicGann Box Logic
Overview
The Gann Box Logic indicator is a precision-based trading tool that combines the principles of Gann analysis with retracement logic to highlight high-probability zones of price action. It plots a structured box on the chart based on the previous day's high and low, overlays Fibonacci-derived retracement levels, and visually marks a critical “neutral zone” between 38.2% and 61.8% retracements.
This zone — shaded for emphasis — is a decision filter for traders:
- It warns against initiating trades in this area (low conviction zone).
- It identifies reversal pull targets when extremes are reached.
Core Principles Behind Gann Box Logic
Logic 1 — The Neutral Zone (38.2% ↔ 61.8%)
- The 38.2% and 61.8% retracement levels are key Fibonacci ratios often associated with consolidation or indecision.
- Price action between these two levels is considered a neutral, low-conviction zone.
- Trading Recommendation:
- Avoid initiating new trades while price remains within this shaded band.
- This zone tends to produce whipsaws and false signals.
- Wait for a decisive break above 61.8% or below 38.2% for clearer momentum.
- Why it matters:
- In Gann’s market structure thinking, the middle range of a swing is often a battleground where neither bulls nor bears are in full control.
- This is the zone where market makers often shake out weak hands before committing to a direction.
Logic 2 — Extremes Seek Balance (0% & 100% Reversal Bias)
- The indicator’s 0% and 100% levels represent the previous day’s low and high respectively.
- First Touch Rule:
- When the price touches 0% (previous low) or 100% (previous high) for the first time in the current session, there is a high probability it will attempt to revert toward the center zone (38.2% ↔ 61.8%).
- Trading Implication:
- If price spikes to an extreme, be alert for reversion trades toward the mid-zone rather than expecting a sustained breakout.
- Momentum traders may still pursue breakout trades, but this bias warns of potential pullbacks.
- Why it works:
- Extreme levels often trigger profit-taking by early entrants and counter-trend entries by mean-reversion traders.
- These forces naturally pull the market back toward equilibrium — often near the 50% level or within the shaded zone.
How the Indicator is Plotted
1. Previous Day High/Low Reference — The script locks onto the prior day’s range to establish the vertical bounds of the box.
2. Retracement Levels — Key Fibonacci levels plotted: 0%, 25%, 38.2%, 50%, 61.8%, 75%, 100%.
3. Box Structure — Outer Border marks the full prior day range, Mid Fill Zone is shaded between 38.2% and 61.8%.
4. VWAP (Optional) — Daily VWAP overlay for intraday bias confirmation.
Practical Usage Guide
- Avoid Trades in Neutral Zone — Stay out of the shaded area unless you’re already in a trade from outside this zone.
- Watch for First Touch Extremes — First touch at 0% or 100% → anticipate a pullback toward the shaded zone.
- Breakout Confirmation — Only commit to breakout trades when price leaves the 38.2–61.8% zone with strong volume and momentum.
- VWAP Confluence — VWAP crossing through the shaded zone often signals a balance day — breakout expectations should be tempered.
Strengths of Gann Box Logic
- Removes noise trades during low-conviction periods.
- Encourages patience and discipline.
- Highlights key market turning points.
- Provides clear visual structure for both new and advanced traders.
Limitations & Warnings
- Not a standalone entry system — best used in conjunction with price action and volume analysis.
- Extreme moves can sometimes trend without reversion, especially during news-driven sessions.
- Works best on intraday timeframes when referencing the previous day’s range.
In Summary
The Gann Box Logic indicator’s philosophy can be boiled down to two golden rules:
1. Do nothing in the middle — Avoid trades between 38.2% and 61.8%.
2. Expect balance from extremes — First touches at 0% or 100% often pull back toward the shaded mid-zone.
This dual approach makes the indicator both a trade filter and a targeting guide, allowing traders to navigate markets with a structured, Gann-inspired framework.
DISCLAIMER
The information provided by this indicator is for educational purposes only and should not be considered financial advice. Trading carries risk, including possible loss of capital. Past performance does not guarantee future results. Always conduct your own research and consult with a qualified financial professional before making trading decisions.

GANN Angles LevelsGANN Angles Levels - Mathematical Support & Resistance (45°, 90°, 180°, 360°)
GANN-based mathematical support/resistance levels using square root calculations and geometric angles. Provides 4 key GANN levels with customizable multipliers.
🎯 GANN ANGLES LEVELS (GAL)
This indicator calculates support and resistance levels using W.D. GANN's mathematical principles based on square roots and geometric angles.
✨ KEY FEATURES:
- 📐 4 GANN Geometric Angles: 45°, 90°, 180°, 360°
- 🔢 Manual Price Input for Base Level
- 📈 Bullish/Bearish Direction Selection
- ⚙️ Customizable Multipliers (0.5, 1, 1.5, 2, None)
- 📊 Optional Information Table
- 🎨 Color-coded Levels (Blue for input, Green/Red for calculated levels)
💡 HOW TO USE:
1. 🎯 **CRITICAL: Select a REAL high or low point** (significant peak or trough)
2. Set this high/low price manually as your base price
3. Choose direction:
• **Bullish** for support levels (from a major LOW)
• **Bearish** for resistance levels (from a major HIGH)
4. **Select multiplier based on timeframe:**
• 📈 **Higher timeframes (Daily, Weekly, Monthly):** Use larger multipliers (1.5, 2)
• ⚡ **Lower timeframes (1H, 4H, 15M, 5M):** Use smaller multipliers (0.5, 1) or None
• 🎯 **Scalping/Intraday:** Often use "None" for tighter levels
5. GANN levels will be calculated progressively using the time-tested formula
⚠️ **IMPORTANT NOTE:**
The accuracy of GANN levels depends heavily on selecting genuine market highs and lows. Use significant pivot points, not random price levels.
🎯 PERFECT FOR:
- GANN Analysis & Trading
- Mathematical Support/Resistance
- Price Target Setting
- Geometric Price Analysis
- Classical Technical Analysis
Based on W.D. GANN's time-tested mathematical principles for market analysis.
🔒 PROTECTED SCRIPT
This indicator is protected and the source code is not visible.
All rights reserved.

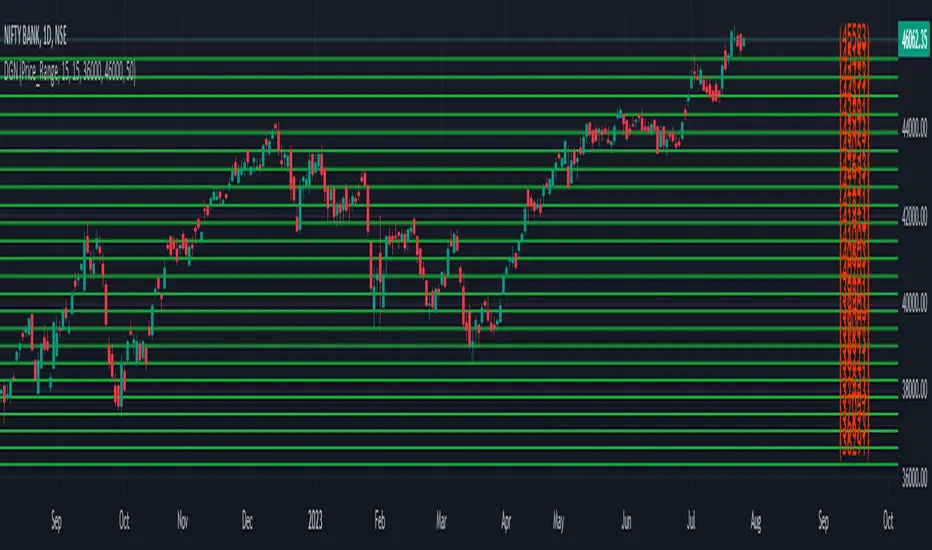
Range + VWAP + Gann Levels + ZL AMA + Gann Square Num# Multi-Strategy Market Analysis Indicator
## Overview
This comprehensive indicator combines several powerful technical analysis tools to help traders identify potential price movements, market trends, and key support/resistance levels. By integrating price range prediction, volume-weighted averages, adaptive moving averages, and Gann-based mathematical levels, this indicator provides a complete toolkit for market analysis.
## Components & How They Work
### 1. Range Calculator
**What it does:** Calculates the expected price range based on current volatility, useful for predicting potential price movements during a specific time period.
**How it works:**
- Uses the current price level and VIX (Volatility Index) to estimate how far the price might move in a given number of days
- Applies the square root of time principle (volatility grows with the square root of time)
- Displays upper and lower bounds of the expected price range
- Shows the calculation details in a convenient table
**How to use it:**
- Enter the current price level, VIX value, and number of days
- red line indicates potential resistance
- green line indicates potential support
- Useful for options trading, setting stop-loss levels, or preparing for upcoming market events
### 2. Gann Square Numbers
**What it does:** Identifies mathematically significant price levels based on square numbers.
**How it works:**
- Takes the square root of the current price
- Calculates the next 5 square numbers above the current price (upper levels)
- Calculates the 5 square numbers below the current price (lower levels)
- Draws these levels as horizontal lines on the chart
**How to use it:**
- Pink lines (upper levels) show potential resistance levels
- Blue lines (lower levels) show potential support levels
- These mathematical levels often coincide with significant market reactions
- Based on W.D. Gann's theory that price tends to respect mathematical square numbers
### 3. Zero Lag Adaptive Moving Average (AMA)
Bullish Scenario
Bearish Scenario
**What it does:** Provides a dynamic moving average that adapts to changing market conditions, reducing lag during trends while filtering noise during sideways markets.
**How it works:**
- Calculates an "Efficiency Ratio" that measures the directional movement relative to volatility
- Adjusts the smoothing factor based on market efficiency
- Uses a faster smoothing factor during trending markets and slower smoothing during sideways markets
- Background color changes to indicate the trend direction (green for uptrend, red for downtrend)
**How to use it:**
- When price is above the AMA line with green background: Strong uptrend
- When price is below the AMA line with red background: Strong downtrend
- Helpful for trend identification and potential entry/exit points
### 4. Gann Stepline Levels
**What it does:** Creates dynamic support and resistance levels based on multiple SMAs (Simple Moving Averages) of different lengths.
**How it works:**
- Calculates two key dynamic levels:
- Gann 50% Level: Average of 90 and 144-period SMAs
- Gann Level: Average of six different SMAs (90, 144, 180, 216, 240, 288)
- These levels adjust automatically as the market evolves
**How to use it:**
- Blue line (Gann 50% Level) acts as dynamic support in uptrends and resistance in downtrends
- Orange line (Gann Level) serves as a longer-term trend indicator
- Price interaction with these levels often indicates potential reversal or continuation points
### 5. Anchored VWAP (Volume-Weighted Average Price)
**What it does:** Shows the average price weighted by volume starting from a specific anchor point.
**How it works:**
- Calculates the average price weighted by volume from a chosen anchor period (Session, Day, Week, Month)
- Resets calculations at the beginning of each new period
- Shows where the current price is relative to the average trading price
**How to use it:**
- Price above VWAP: Bullish bias, buyers are in control
- Price below VWAP: Bearish bias, sellers are in control
- VWAP often acts as dynamic support/resistance level
- Institutional traders often use VWAP for order execution
## Key Benefits
- **Comprehensive Analysis:** Combines volatility-based, trend-following, volume-weighted, and mathematical approaches
- **Multi-timeframe Perspective:** Different components operate on various timeframes for a complete market view
- **Visual Clarity:** Color-coded lines and background help quickly identify market conditions
- **Customizable Components:** Range Calculator, VWAP, and Gann Square Numbers can be adjusted to fit your trading style
## How to Interpret When Used Together
- **Strong Trend Confirmation:** When AMA shows a trend and price respects the Gann Dynamic levels
- **Reversal Signals:** When price reaches the expected range bounds and encounters a Gann Square Number
- **High-Probability Zones:** Areas where multiple components show support/resistance at similar levels
- **Volatility Assessment:** Compare the expected range from the Range Calculator with the actual price movement
This indicator combines statistical, trend-following, and mathematical approaches to market analysis, providing traders with a well-rounded view of market conditions and potential price movements.

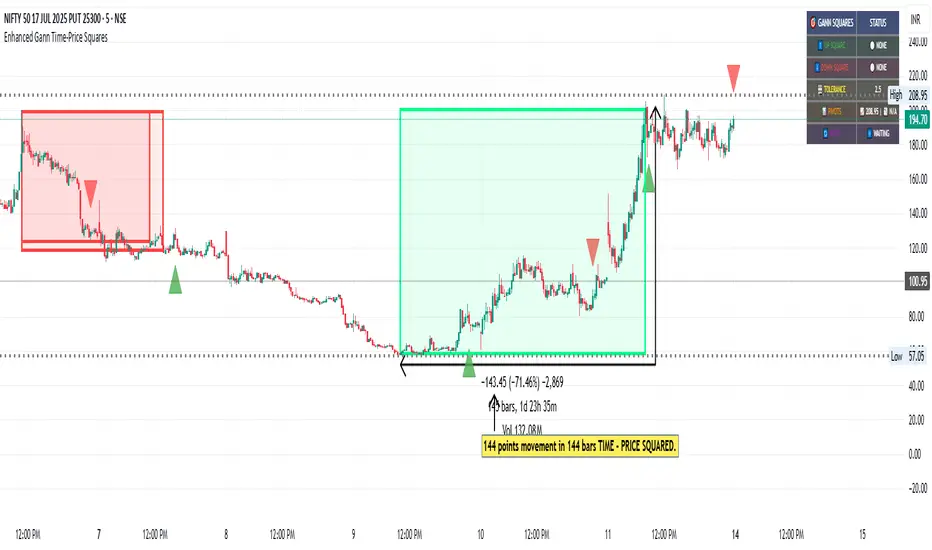
Enhanced Gann Time-Price SquaresEnhanced Gann Time-Price Squares Indicator
A comprehensive Pine Script indicator that identifies and visualizes W.D. Gann's time-price square formations on your charts. This tool helps traders spot potential market turning points where time and price movements align according to Gann's legendary market theories.
Key Features:
Automatic Square Detection - Identifies completed squares where price movement equals time movement
Future Projections - Shows forming squares with projected completion points
Pivot Integration - Automatically detects pivot highs/lows as square starting points
Visual Clarity - Clean box outlines with customizable colors and styles
Smart Filtering - Prevents overlapping squares and includes minimum move thresholds
Real-time Status - Information table showing current square formations
How to Use:
The indicator draws boxes when price moves from pivot points equal the time elapsed (number of bars). Green squares indicate upward movements, red squares show downward movements. Dashed lines show forming squares, while dotted lines project where they might complete.
Settings:
Adjust pivot sensitivity and minimum price moves
Customize tolerance for time-price matching
Toggle projections, labels, and visual elements
Fine-tune colors and line styles
Perfect for Gann theory practitioners and traders looking for time-based market analysis. The squares often coincide with significant support/resistance levels and potential reversal points.
Compatible with all timeframes and instruments.
More updates to follow
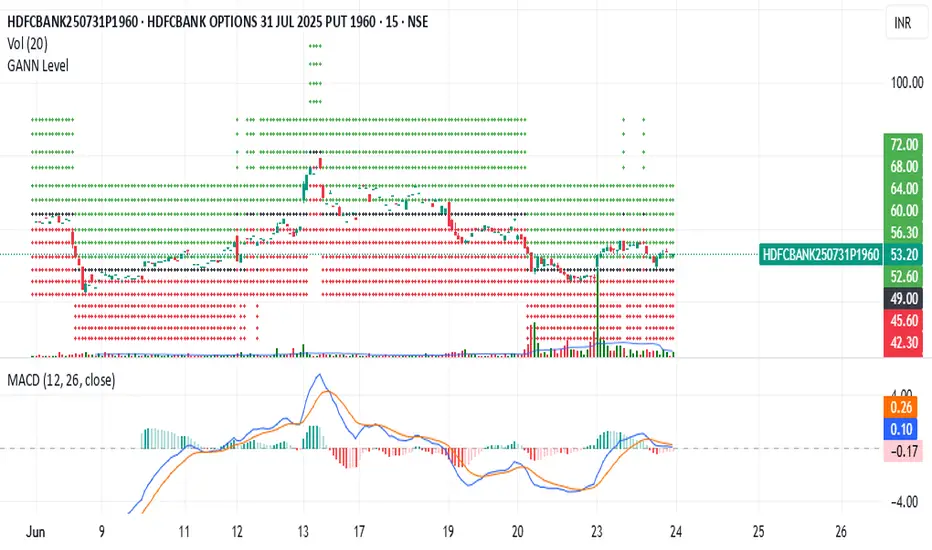
GANN Level (Salil Sir)GANN Level Indicator Description
This Pine Script calculates and plots Gann Levels based on a user-defined price input. It creates horizontal lines at key support and resistance levels derived from the input price, applying Gann's theory of market structure. The levels are dynamically calculated and squared for enhanced precision.
Key Features:
Manual Price Input:
The user inputs a round off of square root of base price (Manual_Input), which serves as the foundation for calculations.
Support and Resistance Levels:
Six resistance levels (R1 to R6) and six support levels (S1 to S6) are calculated by incrementing or decrementing the base price in steps of 0.25.
Squared Levels:
Each level is squared (level^2) to align with Gann's mathematical principles.
Visualization:
All levels, including the base price squared (GANN), are plotted as horizontal dotted lines:
Black Line: Base price squared (Gann Level).
Green Lines: Resistance levels.
Red Lines: Support levels.
Purpose:
The indicator helps traders identify potential support and resistance zones based on Gann's methodology, providing a mathematical framework for decision-making.
Usage:
Adjust the Manual Price in the settings to the desired value.
Observe the plotted levels for key support and resistance zones on the chart.
Use these levels to make informed trading decisions or to validate other indicators.
Gann SqrootGann indicators—based on trading techniques developed by W.D. Gann—are used in predicting support and resistance levels, as well as predict tops, bottoms, and future price moves.
Gann studies have been used by active traders for decades, and even though the futures and stock markets have changed considerably, they remain a popular method of analyzing an asset's direction.
Gann angles are a popular analysis and trading tool that are used to measure key elements, such as pattern, price, and time
Gann S9 Bursa MalaysiaGann Square of 9 created based on the table to make easy for everyone use it especially Intraday.
The Price starting from 0.250 to 10.090
Gann table widely use in Bursa Malaysia Intraday.
This Indicator is to help for viewing the Gann Price line with same color as the actual Gann Square of 9 table.
-Fiez-

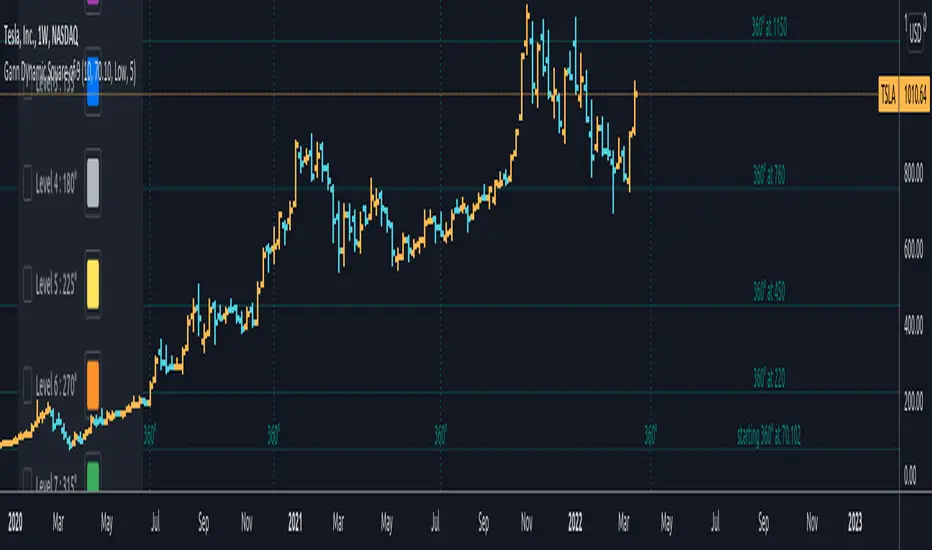
Gann Dynamic Square of 9Gann Dynamic Square of 9
// ========================================================================//
This script uses the same number series in the square of nine chart. Taking into considerations a high/low pivotal level of your choosing at $1/degree. It includes these degrees : ( 360, 315, 270, 225, 180, 135, 90, and 45 )
This dynamic square of 9 is different than the static one. The values always start at your low/high rather than one. All that you need to do is select and anchor your low/high and it will plot everything for you.
You will also be able to adjust the color of each line to differentiate between them.
This script also complements the Gann ToolBox that I have on my tradingview page giving you good measurement of the market and some of its volatility dates and locations in price.
// ========================================================================//
To get access to this add-on or for the full package including the toolbox you can see my information below.
Gann Planets vs SunGann Planets vs Sun
// ========================================================================//
the example above is set to ETH/USD block #1 date at 147 degrees Jupiter
This script helps you spot important events in the market using planetary lines. All you have to do is to input the planet natal degree from your desired date through any Emphemeris source.
This script includes settings to adjust the start and end date of the cycle and will auto calculate the planetary degree and plot its lines and plot the 4 quintiles for you as well.
This script also complements the Gann ToolBox that I have on my tradingview page giving you good measurement of the market and some of its volatility dates and locations in price.
// ========================================================================//
To get access to this add-on or for the full package including the toolbox you can see my information below.

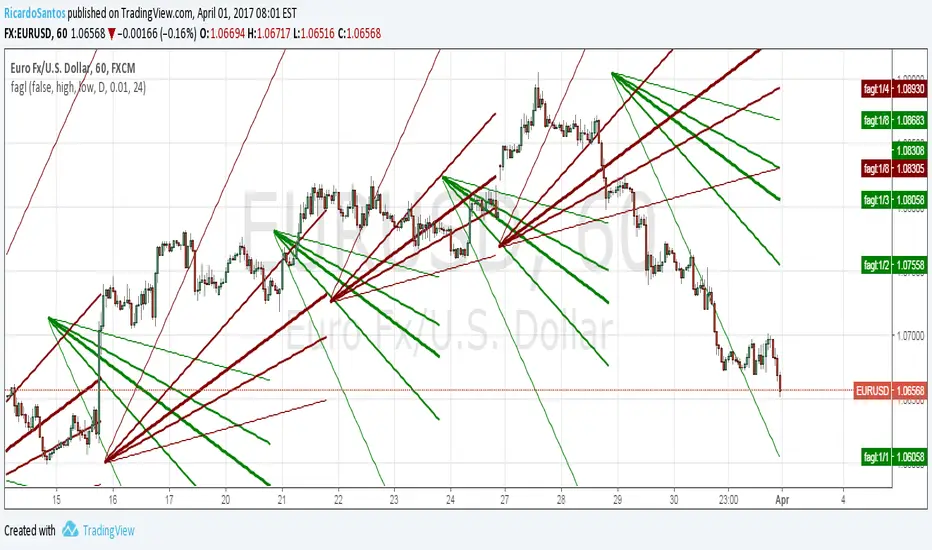
[RS]Fractal Auto Gann LinesEXPERIMENTAL:
GANN lines projection based on zigzag tops/bottoms, use at your own risk.
CM Gann Swing High Low V2CM Gann Swing High Low V2
Added Improvements:
Used PineScript “linebr" code so solid lines plot only when condition = true.
Via Inputs Tab:
Ability to Turn On/Off Highlight Bars When Crossing Above/Below Swing High Low
Ability to Turn On/Off Back Ground Highlights When Crossing Above/Below Swing High Low
Ability to Turn On/Off linebr plots.
Other Features: All Available Via Inputs Tab
Ability to Adjust Moving Average Values to adjust Sensitivity.
Ability to Turn On/Off Triangles Above/Below Bars based on Indicator.
Ability to Turn On/Off Triangles at Top And Bottom Of Screen Showing Direction of Indicator.
***Basically you have Option to View Indicator about every way possible.
***Special Thanks to Glaz for Original Code.

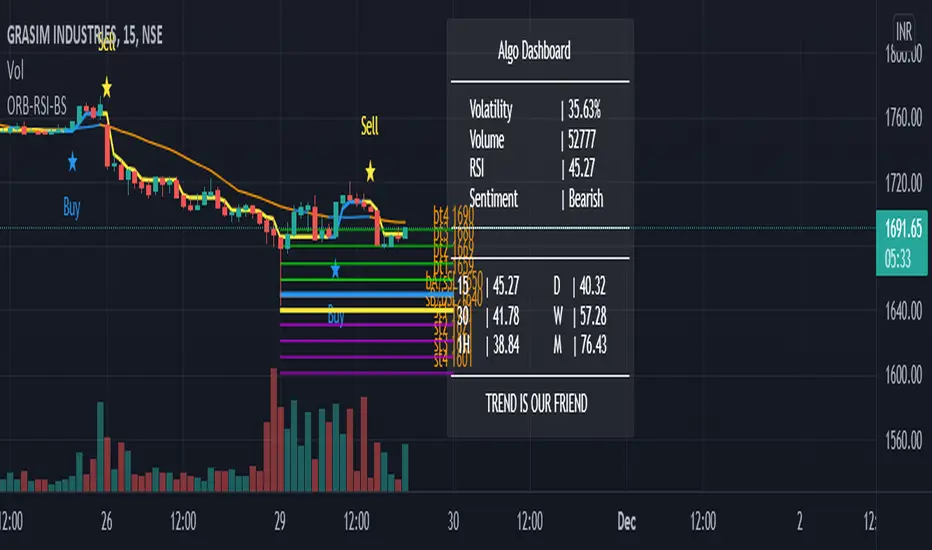
GANN-ORB-RSI-BSGann relied heavily on geometrical and numerical relationships
and created several tools to help with his work. Among these
tools are the Square of Nine, Square of 144, and the Hexagon.
The Square of Nine, or Square as we will refer to here, can be
constructed in at least two ways. The static Square has the
number 1 at the center and the dynamic Square has the historic
low of the time series in the center.
Square of 9 NumbersThis will mark all Square of numbers with digit addition of 9
One can create a system to buy above or below that number
GANN square of numbers concept if anybody knows will help

PRESTANA SQ9PRESTANA SQ9 - Advanced Analysis with Revised Square of 9 and Custom Gann Scale
Description:
PRST SQ9 is an innovative technical analysis tool that revolutionizes the use of the Square of 9 by integrating it with a custom Gann scale and the application of solar degrees. This unique script stands out for its ability to generate more precise levels of analysis compared to traditional market indicators.
Key Features:
Customizable Price Scale (Price Unit): By adjusting the 'price unit' and 'factor', our script allows for extremely precise levels of analysis. This approach provides greater flexibility and adaptability to various market conditions.
Application of Solar Degrees: A distinct feature of our script is the use of solar degrees, offering an alternative perspective to the traditional Square of 9 scale. This allows for a broader range of analysis and the identification of key market turning points.
Customizable Configuration: Users can set the desired time frame (TF) and adjust the 'price unit' and 'factor' to suit their specific needs. For instance, settings like 1, 4, 16, 64, 256, or 2, 8, 32, 128 can be used to calibrate the indicator.
Usage Guide:
Setting the Time Frame and Price Unit: Select the TF you wish to analyze and set the 'price unit' to values like 1 or 2, and their multiples (e.g., 4, 16, 64, 256 for 'price unit' 1).
Adjusting the Factor: Modify the 'factor' to correspond to the degrees you want to explore on the Square of 9. For example, a 'factor' of 1 corresponds to 180°, 2 to 360°, 0.5 to 90°, etc.
Time Analysis: For time analysis, set the degrees for the cycle you wish to observe and the reference TF.
Uniqueness and Added Value:
PRST SQ9 stands out for its ability to merge the Square of 9 with a dynamic price scale and the application of solar degrees, offering users a richer and more varied technical analysis. This unique approach provides traders with a powerful tool to navigate the markets with greater precision and confidence.
