ILM & IFVG StrategyPlease feel free to adjust in any way possible. Let me know if you can create something better from this initial coding.
//═══════════════════════════════════════════════════════════════════════
// Inverted Liquidity Model (ILM) – Strategy
//═══════════════════════════════════════════════════════════════════════
//
// The **Inverted Liquidity Model (ILM)** is a liquidity-based algorithm
// built to capture high-probability reversals after:
//
// • A liquidity sweep (SSL/BSL taken)
// • Rejection back inside the range
// • A Fair Value Gap (FVG) forms
// • That FVG becomes invalidated → becomes an IFVG entry zone
//
// ILM combines:
// • LTF BOS / CHOCH structure confirmation
// • HTF structure (expansion) filtering
// • Premium / Discount filter (17:00 CST session midline)
// • Optional ATR volatility filter
// • Optional trading session restrictions
// • Optional partial profit-taking + runners
//
// When all conditions align, the strategy enters:
// ✔ Long after sweep of SSL + valid long IFVG + trend confirmation
// ✔ Short after sweep of BSL + valid short IFVG + trend confirmation
//
// Stops are placed at the sweep wick.
// Full target is set at the next structural high/low.
// Optional partial TP sends a runner to full target.
//
// Visual tools (labels, sweep lines, IFVG boxes, midline) assist
// with review and forward testing.
//
//───────────────────────────────────────────────────────────────────────
// USER CONFIGURABLE FEATURES
//───────────────────────────────────────────────────────────────────────
//
// • **Liquidity & Structure**
// - pivotLen → swing length for pivots / liquidity
// - htfOn → toggle higher-timeframe pivots
// - htfTF → timeframe for HTF structure/liquidity
// - useStructureFilter → enforce LTF BOS/CHOCH trend
// - useHtfExpansionFilter → enforce HTF trend
// - showStructureLabels → show BOS/CHOCH labels
// - showHtfStructureLabels → show HTF BOS/CHOCH labels
//
// • **Premium / Discount Midline**
// - usePremiumDiscountFilter → only long in discount / short in premium
// - pdSession → session used for midline (default 17:00 CST)
// - showPdMidLine → show 50% midline
//
// • **FVG / IFVG Detection**
// - useBodyGapFVG → FVG uses candle bodies instead of wicks
// - useDisplacementFVG → require displacement bar
// - dispAtrMult → minimum ATR threshold for displacement
// - showIFVG → draw IFVG boxes
//
// • **ATR / Volatility / Sessions**
// - useRangeFilter → require minimum ATR%
// - atrLen → ATR period
// - minAtrPerc → minimum ATR% of price
// - useSessionFilter → restrict trading hours
// - sessionTimes → allowed trading session
//
// • **Sweep Visualization**
// - showSweepLines → draw sweep lines at SSL/BSL sweeps
// - sweepLineWidth → thickness of sweep lines
//
// • **Exits: Partial Targets & Runners**
// - usePartialTargets → enable partial TP logic
// - tp1QtyPercent → percent closed at TP1
// - tp1FractionOfPath → TP1 relative to path to full target
//
// • **Formatting / Visibility**
// - labelFontSizeInput → tiny / small / normal / large / huge
// - showEntries → entry markers
// - showTargets → target lines
//
//═══════════════════════════════════════════════════════════════════════
// END OF STRATEGY DESCRIPTION
//═══════════════════════════════════════════════════════════════════════
스크립트에서 "fvg"에 대해 찾기

Lord Mathew ATSThe Smart Money Structure & Pattern Analyzer is a complete, all-in-one visual trading system that brings together every essential element of Smart Money Concepts (SMC), ICT methodology, and candlestick psychology into one powerful indicator.
It is designed to help traders instantly understand the market’s structure, liquidity flow, and potential turning points without switching tools or manually marking charts. Whether you trade forex, indices, crypto, or commodities, this indicator automatically identifies where institutional activity, imbalances, and price inefficiencies occur in real time.
With its advanced algorithm, it plots market structure shifts, equal highs and lows, liquidity zones, order blocks, fair value gaps (FVGs), and previous week and day levels (PWO, PWH, PWL, PWC, PDO, PDH, PDL, PDO). It also integrates a deep candlestick recognition engine that detects over ten classic and advanced candle formations including engulfing patterns, dojis, hammers, shooting stars, morning/evening stars, and spinning tops to provide precise confirmation at critical points of interest.
This indicator isn’t just a tool it’s a complete market map that helps traders visualize how institutional order flow and candlestick sentiment interact.
Core Features
📊 Market Structure Detection:
Automatically marks swing highs/lows, Break of Structure (BOS), and Change of Character (CHOCH) in real time.
💧 Liquidity Mapping:
Highlights equal highs/lows and liquidity grabs, showing where price is likely to target before a reversal or continuation.
🧱 Order Block Visualization:
Displays the last bullish or bearish candle before an impulsive displacement, acting as a potential institutional entry zone.
⚡ Fair Value Gap (FVG) Scanner:
Detects and highlights imbalances where price moved too fast, helping you identify high-probability retracement areas.
🕯️ Candlestick Pattern Recognition:
Recognizes key reversal and continuation patterns (engulfing, hammer, shooting star, doji, morning/evening star, etc.) in real time.
📅 Institutional Reference Points:
Plots previous week & day open (PWO, PDO), previous week & day high (PWH, PWH), previous week & day low (PWL, PDL), previous week & day close (PWC, PDC) and optionally previous day levels to help frame bias.
🎨 Customizable Design:
Toggle any feature, change colors, and set alerts when multiple Smart Money signals align for cleaner, faster decision-making.
How It Works
Add the indicator to your chart on any timeframe or market.
The algorithm automatically detects structure, liquidity, and imbalance zones.
Candlestick patterns are highlighted when they form near high-probability areas (like OBs or FVGs).
When confluence occurs such as a liquidity grab, FVG fill, and bullish engulfing candle—the indicator provides a visual signal zone for your confirmation-based entries.
You can refine your trades using higher-timeframe bias (HTF order flow) and lower-timeframe execution (LTF confirmation).
Best For
Traders using ICT, Smart Money Concepts, or price-action systems.
Intraday and swing traders looking for clear, data-driven chart structure.
Traders who want to simplify confluence analysis and focus on precision execution.
Why It Stands Out
Unlike standard candlestick or pattern scanners, this indicator merges institutional market logic with technical candle behavior, allowing traders to see where smart money might be entering or exiting positions.
It’s not about random signals it’s about context, structure, and confirmation.
Every feature in this indicator is built around the principle of liquidity engineering:
price creates liquidity, grabs it, and moves toward imbalance or order flow efficiency.
By merging that institutional logic with candlestick patterns, this tool gives traders an edge in recognizing not only where to trade but why price is reacting in that exact area.
Disclaimer
This indicator is intended for educational and analytical use. It does not provide financial advice or guaranteed trading results. Always backtest and manage your risk responsibly.

AG_STRATEGY📈 AG_STRATEGY — Smart Money System + Sessions + PDH/PDL
AG_STRATEGY is an advanced Smart Money Concepts (SMC) toolkit built for traders who follow market structure, liquidity and institutional timing.
It combines real-time market structure, session ranges, liquidity levels, and daily institutional levels — all in one clean, professional interface.
✅ Key Features
🧠 Smart Money Concepts Engine
Automatic detection of:
BOS (Break of Structure)
CHoCH (Change of Character)
Dual structure system: Swing & Internal
Historical / Present display modes
Optional structural candle coloring
🎯 Liquidity & Market Structure
Equal Highs (EQH) and Equal Lows (EQL)
Marks strong/weak highs & lows
Real-time swing confirmation
Clear visual labels + smart positioning
⚡ Fair Value Gaps (FVG)
Automatic bullish & bearish FVGs
Higher-timeframe compatible
Extendable boxes
Auto-filtering to remove noise
🕓 Institutional Sessions
Asia
London
New York
Includes:
High/Low of each session
Automatic range plotting
Session background shading
London & NY Open markers
📌 PDH/PDL + Higher-Timeframe Levels
PDH / PDL (Previous Day High/Low)
Dynamic confirmation ✓ when liquidity is swept
Multi-timeframe level support:
Daily
Weekly
Monthly
Line style options: solid / dashed / dotted
🔔 Built-in Alerts
Internal & swing BOS / CHoCH
Equal Highs / Equal Lows
Bullish / Bearish FVG detected
🎛 Fully Adjustable Interface
Colored or Monochrome visual mode
Custom label sizes
Extend levels automatically
Session timezone settings
Clean, modular toggles for each component
🎯 Designed For Traders Who
Follow institutional order flow
Enter on BOS/CHoCH + FVG + Liquidity sweeps
Trade London & New York sessions
Want structure and liquidity clearly mapped
Prefer clean charts with full control
💡 Why AG_STRATEGY Stands Out
✔ Professional SMC engine
✔ Real-time swing & internal structure
✔ Session-based liquidity tracking
✔ Non-cluttered chart — high clarity
✔ Supports institutional trading workflows

Smart Structure Pro - Market Structure & Smart Money Concepts═══════════════════════════════════════════════════════════════════════════════
SMART STRUCTURE PRO
═══════════════════════════════════════════════════════════════════════════════
A comprehensive market structure analysis tool that identifies institutional trading
patterns and smart money concepts for improved trade timing and decision-making.
═══════════════════════════════════════════════════════════════════════════════
📊 WHAT IT DOES
═══════════════════════════════════════════════════════════════════════════════
This indicator automatically detects and visualizes key market structure elements:
🔹 BOS (Break of Structure)
- Identifies trend continuation patterns
- Marks when price breaks above previous highs (bullish) or below previous lows (bearish)
- Confirms trend strength and momentum
🔹 CHoCH (Change of Character)
- Detects potential trend reversals
- Alerts when market structure shifts from bullish to bearish or vice versa
- Helps identify early reversal opportunities
🔹 Order Blocks
- Highlights institutional entry zones
- Identifies the last opposite candle before a structure break
- Shows areas where smart money likely entered positions
🔹 Fair Value Gaps (FVG)
- Detects price imbalances and inefficiencies
- Shows areas where price moved rapidly leaving gaps
- Often act as support/resistance when retested
🔹 Liquidity Zones
- Marks swing high and low levels
- Identifies areas where stop losses likely cluster
- Shows potential stop hunt and liquidity grab zones
═══════════════════════════════════════════════════════════════════════════════
🎯 HOW TO USE
═══════════════════════════════════════════════════════════════════════════════
BULLISH SETUP:
1. Wait for Bullish CHoCH (trend reversal signal) or BOS ↑ (continuation)
2. Look for price to pull back into an Order Block or Fair Value Gap
3. Enter long when price bounces from these zones
4. Place stop loss below the Order Block
5. Target the next liquidity zone or resistance level
BEARISH SETUP:
1. Wait for Bearish CHoCH (trend reversal signal) or BOS ↓ (continuation)
2. Look for price to retrace into an Order Block or Fair Value Gap
3. Enter short when price rejects from these zones
4. Place stop loss above the Order Block
5. Target the next liquidity zone or support level
DASHBOARD INTERPRETATION:
• Trend: Current market direction (Bullish/Bearish)
• Volume: Confirmation strength (High volume = stronger signals)
• Signal: Latest structure break detected
• Key High/Low: Critical levels for the current trend
• Position: Price location (Premium = expensive, Discount = cheap)
═══════════════════════════════════════════════════════════════════════════════
⚙️ SETTINGS GUIDE
═══════════════════════════════════════════════════════════════════════════════
STRUCTURE DETECTION:
• Pivot Length (Default: 10)
- Lower values = More signals but potentially weaker
- Higher values = Fewer signals but stronger/more reliable
- Recommended: 8-12 for intraday, 10-15 for higher timeframes
• Structure Line Extension
- Visual preference for how far lines extend
- Does not affect signal detection
SMART MONEY CONCEPTS:
• Order Block Extension: How long OB boxes remain visible
• FVG Extension: How long gap boxes remain visible
• Min FVG Size: Filter out small gaps (0 = show all)
- Set to 10-20% to reduce noise
- Set to 0 to see all gaps
VOLUME FILTER:
• Volume Confirmation (Recommended: ON)
- Filters weak signals without volume support
- Reduces false breakouts
• Volume Multiplier (Default: 1.5)
- Higher = Stricter filtering (fewer but stronger signals)
- Lower = More signals (but may include weak ones)
DISPLAY:
• Dashboard: Toggle information panel
• Trend Background: Subtle color tint showing current trend
• Dashboard Position: Choose corner placement
═══════════════════════════════════════════════════════════════════════════════
🔔 ALERTS
═══════════════════════════════════════════════════════════════════════════════
Available alert conditions:
✓ Bullish BOS - Uptrend continuation confirmed
✓ Bearish BOS - Downtrend continuation confirmed
✓ Bullish CHoCH - Reversal to uptrend detected
✓ Bearish CHoCH - Reversal to downtrend detected
✓ Structure Break - Any significant market structure change
To set up alerts:
1. Click the "⏰" alert icon
2. Select "Smart Structure Pro"
3. Choose your desired condition
4. Configure notification method
5. Click "Create"
═══════════════════════════════════════════════════════════════════════════════
⚠️ IMPORTANT DISCLOSURES
═══════════════════════════════════════════════════════════════════════════════
REPAINTING BEHAVIOR:
• Pivot points WILL repaint until confirmed (this is by design and unavoidable)
• Structure breaks (BOS/CHoCH) use CLOSED candles and do NOT repaint after confirmation
• Order Blocks and FVGs are drawn on confirmed signals and do NOT repaint
• All signals wait for candle close before triggering
BEST PRACTICES:
• Use on higher timeframes (15min+) for more reliable signals
• Combine with other analysis (support/resistance, volume profile, etc.)
• Wait for candle close confirmation before acting on signals
• Use proper risk management - this is not a standalone trading system
• Backtest on your preferred instrument and timeframe
PERFORMANCE:
• Limited to 100 boxes, 100 lines, 100 labels for optimal performance
• Older objects automatically removed as new ones appear
• Works on all markets (Forex, Crypto, Stocks, Indices, Commodities)
═══════════════════════════════════════════════════════════════════════════════
📚 CONCEPTS EXPLAINED
═══════════════════════════════════════════════════════════════════════════════
MARKET STRUCTURE:
Market structure refers to the pattern of price movements creating swing highs
and lows. Understanding structure helps identify trend direction and potential
reversal points.
SMART MONEY CONCEPTS:
These are trading techniques based on tracking institutional order flow and
understanding where large players (banks, funds, institutions) enter and exit
positions.
ORDER BLOCKS:
The last opposing candle before a strong directional move. Institutions often
leave unfilled orders in these zones, which can act as support/resistance when
price returns.
FAIR VALUE GAPS:
Areas where price moved so quickly that it left an imbalance. These gaps often
get "filled" as price returns to find equilibrium, creating trading opportunities.
═══════════════════════════════════════════════════════════════════════════════
🎓 EDUCATIONAL VALUE
═══════════════════════════════════════════════════════════════════════════════
This indicator helps traders:
✓ Understand market structure mechanics
✓ Identify institutional trading patterns
✓ Improve trade timing and entry precision
✓ Recognize trend continuation vs reversal
✓ Learn smart money concepts through visualization
═══════════════════════════════════════════════════════════════════════════════
📋 TECHNICAL DETAILS
═══════════════════════════════════════════════════════════════════════════════
• Version: 1.0.0
• Pine Script Version: 5
• Indicator Type: Overlay
• No Repainting: Structure breaks use confirmed candles
• Performance Optimized: Limited drawing objects
• Works On: All markets and timeframes
• Alerts: Yes, fully customizable
═══════════════════════════════════════════════════════════════════════════════
👤 AUTHOR
═══════════════════════════════════════════════════════════════════════════════
Created by: Zakaria Safri
Original Work: All code and concepts are original implementations
Based On: ICT (Inner Circle Trader) educational concepts
License: © 2024 Zakaria Safri - Personal Use Only
═══════════════════════════════════════════════════════════════════════════════
⚖️ DISCLAIMER
═══════════════════════════════════════════════════════════════════════════════
This indicator is for educational and informational purposes only. It does not
constitute financial advice. Trading involves substantial risk of loss. Past
performance does not guarantee future results. Always conduct your own research
and consult with a licensed financial advisor before making trading decisions.
The author is not responsible for any losses incurred from using this indicator.
═══════════════════════════════════════════════════════════════════════════════
If you find this indicator helpful, please:
👍 Like and favorite
⭐ Leave a review
📢 Share with other traders
💬 Comment with feedback or suggestions
Happy Trading! 📈

CVD Pro – Smart Overlay + Signals (with Persist Mode)What this Indicator Does
CVD Pro visualizes Cumulative Volume Delta (CVD) data directly on your main price chart — helping you detect real buying vs. selling pressure in real time.
Unlike most CVD scripts that run in a separate subwindow, this one overlays price-mapped CVD curves on the candles themselves for better confluence with market structure and FVG zones.
The script dynamically scales normalized CVD values to the price range and uses adaptive smoothing and deviation bands to highlight shifts in trader behavior.
It also includes automatic bullish/bearish crossover signals, displayed as on-chart labels.
⚙️ Main Features
✅ Price-mapped CVD Overlay
CVD is normalized (Z-score) and projected onto the price chart for easy visual correlation with price structure.
✅ Multi-Timeframe Presets
Three sensitivity presets optimized for different chart environments:
Strict (4H) → Best for macro trends and high-timeframe structure.
Balanced (1H / 30m) → Great for active swing setups.
Sensitive (15m) → Captures short-term intraday reversals.
✅ Dynamic Bands & Smoothing
Deviation bands visualize statistical extremes in delta pressure — helping to identify exhaustion and divergence points.
✅ Smart Buy/Sell Signal Logic
Automatic label triggers when the CVD Overlay crosses its smoothed baseline:
🟢 BULL LONG → Rising CVD above the mean (buyers in control).
🔴 BEAR SHORT → Falling CVD below the mean (sellers in control).
✅ Persist Mode
Toggle to keep the last signal visible until a new one forms — ideal for traders who prefer clean chart annotations without noise.
✅ Clean, Minimal Overlay
Everything happens directly on your chart — no extra windows, no clutter. Designed for use with Smart Money Concepts, Fair Value Gaps (FVGs), or volume imbalance setups.
🧩 Use Case
CVD Pro is designed for traders who:
Use Smart Money Concepts (SMC) or ICT-style trading
Watch for FVG reactions, breaker blocks, and liquidity sweeps
Need to confirm order flow direction or momentum strength
Trade intraday or swing setups with precision entries and clear bias confirmation
⚡ Recommended Settings
4H / 1H: Use Strict mode for major structure and confirmation.
1H / 30m: Balanced mode for clear mid-term trend alignment.
15m: Sensitive mode to catch scalps and lower-TF shifts.
🧠 Pro Tips
Combine with RSI or Market Structure Breaks (MSS) for additional confluence.
A strong CVD divergence near a key FVG or 0.5–0.705 Fibonacci zone often signals reversal.
Persistent CVD crossover + price structure break = high-probability entry.
🧩 Credits
Created by Patrick S. ("Nova Labs")
Concept inspired by professional order-flow analytics and adaptive Z-Score normalization.
Would you like me to write a shorter “public summary” paragraph (for the short description at the top of TradingView, the one-liner users see before expanding)?
It’s usually a 2–3 sentence hook like:
“Overlay-based CVD indicator that merges volume delta with price structure. Detect true buying/selling pressure using adaptive normalization, deviation bands, and clean bullish/bearish crossover signals.”

Ayman – Full Smart Suite Auto/Manual Presets + PanelIndicator Name
Ayman – Full Smart Suite (OB/BoS/Liq/FVG/Pin/ADX/HTF) + Auto/Manual Presets + Panel
This is a multi-condition trading tool for TradingView that combines advanced Smart Money Concepts (SMC) with classic technical filters.
It generates BUY/SELL signals, draws Stop Loss (SL) and Take Profit (TP1, TP2) levels, and displays a control panel with all active settings and conditions.
1. Main Features
Smart Money Concepts Filters:
Order Block (OB) Zones
Break of Structure (BoS)
Liquidity Sweeps
Fair Value Gaps (FVG)
Pin Bar patterns
ADX filter
Higher Timeframe EMA filter (HTF EMA)
Two Operating Modes:
Auto Presets: Automatically adjusts all settings (buffers, ATR multipliers, RR, etc.) based on your chart timeframe (M1/M5/M15).
Manual Mode: Fully customize all parameters yourself.
Trade Management Levels:
Stop Loss (SL)
TP1 – partial profit
TP2 – full profit
Visual Panel showing:
Current settings
Filter status
Trend direction
Last swing levels
SL/TP status
Alerts for BUY/SELL conditions
2. Entry Conditions
A BUY signal is generated when all these are true:
Trend: Price above EMA (bullish)
HTF EMA: Higher timeframe trend also bullish
ADX: Trend strength above threshold
OB: Price in a valid bullish Order Block zone
BoS: Structure break to the upside
Liquidity Sweep: Sweep of recent lows in bullish context
FVG: A bullish Fair Value Gap is present
Pin Bar: Bullish Pin Bar pattern detected (if enabled)
A SELL signal is generated when the opposite conditions are met.
3. Stop Loss & Take Profits
SL: Placed just beyond the last swing low (BUY) or swing high (SELL), with a small ATR buffer.
TP1: Partial profit target, defined as a ratio of the SL distance.
TP2: Full profit target, based on Reward:Risk ratio.
4. How to Use
Step 1 – Apply Indicator
Open TradingView
Go to your chart (recommended: XAUUSD, M1/M5 for scalping)
Add the indicator script
Step 2 – Choose Mode
AUTO Mode: Leave “Use Auto Presets” ON – parameters adapt to your timeframe.
MANUAL Mode: Turn Auto OFF and adjust all lengths, buffers, RR, and filters.
Step 3 – Filters
In the Filters On/Off section, enable/disable specific conditions (OB, BoS, Liq, FVG, Pin Bar, ADX, HTF EMA).
Step 4 – Trading the Signals
Wait for a BUY or SELL arrow to appear.
SL and TP levels will be plotted automatically.
TP1 can be used for partial close and TP2 for full exit.
Step 5 – Alerts
Set alerts via BUY Signal or SELL Signal to receive notifications.
5. Best Practices
Scalping: Use M1 or M5 with AUTO mode for gold or forex pairs.
Swing Trading: Use M15+ and adjust buffers/ATR manually.
Combine with price action confirmation before entering trades.
For higher accuracy, wait for multiple filter confirmations rather than acting on the first arrow.
6. Summary Table
Feature Purpose Can Disable?
Order Block Finds key supply/demand zones ✅
Break of Structure Detects trend continuation ✅
Liquidity Sweep Finds stop-hunt moves ✅
Fair Value Gap Confirms imbalance entries ✅
Pin Bar Price action reversal filter ✅
ADX Trend strength filter ✅
HTF EMA Higher timeframe confirmation ✅

ICT Order Blocks v2 (Debug)Josh has a very large PP xD
Understanding Order Blocks (OBs) - The ICT Perspective
This document delves into the concept of Order Blocks (OBs) from the perspective of the ICT methodology. It outlines what OBs are, their significance in trading, and how the "ICT Order Blocks v2 (Refined)" indicator functions to identify and visualize these critical price levels. By understanding OBs, traders can better navigate market movements and make informed decisions based on institutional trading behavior.
What is an Order Block (OB)?
Within ICT methodology, an Order Block represents a specific price candle where significant buying or selling interest from institutions (Smart Money) is believed to have occurred. They are potential areas where price might return and react.
Bullish Order Block: Typically the last down-closing candle before a strong, impulsive upward move (displacement). It suggests institutions may have absorbed selling pressure and initiated long positions here.
Bearish Order Block: Typically the last up-closing candle before a strong, impulsive downward move (displacement). It suggests institutions may have distributed long positions or initiated short positions here.
Why are OBs Significant (ICT View)?
Institutional Footprint: They mark potential zones of large order execution.
Support/Resistance: Unmitigated OBs can act as sensitive price levels where reactions are expected. Bullish OBs may provide support; Bearish OBs may provide resistance.
Origin of Moves: They often mark the origin point of significant price swings.
Liquidity Engineering: Institutions might drive price back to OBs to mitigate earlier positions or to engineer liquidity before continuing a move.
Common Refinements
ICT often emphasizes higher probability OBs that are associated with:
Displacement: The move away from the OB is sharp and decisive.
Fair Value Gaps (FVGs): An FVG forming immediately after the OB strengthens its validity.
OB Mitigation: This refers to price returning to the level of the Order Block after its formation. Price might react at the edge (proximal line) or the 50% level (mean threshold) of the OB. An OB is often considered fully mitigated or invalidated if price trades decisively through its entire range, especially with a candle body closing beyond it.
How the "ICT Order Blocks v2 (Refined)" Indicator Works
This indicator automates the detection and visualization of the most recent unmitigated Order Block of each type (Bullish/Bearish), incorporating optional filters.
Detection:
It looks at the relationship between the candle two bars ago ( ), the previous candle ( ), and potentially the current candle ( ).
Bullish OB: Identifies if candle was a down-close (close < open ) AND candle broke above the high of candle (high > high ).
Bearish OB: Identifies if candle was an up-close (close > open ) AND candle broke below the low of candle (low < low ).
Accuracy Filters (Optional Inputs):
These filters help identify potentially higher-probability OBs:
Require Fair Value Gap (FVG)?: If enabled, the indicator checks if an FVG formed immediately after the OB candle ( ). Specifically, it looks for a gap between candle and candle (low > high for Bullish OB confirmation, high < low for Bearish).
Require Strong Close Breakout?: If enabled, it requires the breakout candle ( ) to close beyond the range of the OB candle ( ). (close > high for Bullish, close < low for Bearish). This suggests stronger confirmation.
Storing the Most Recent OB:
When an OB is detected and passes any enabled filters, its details (high, low, formation bar index) are stored. Crucially, this indicator only tracks the single most recent valid unmitigated OB of each type (one Bullish, one Bearish) using var variables. If a newer valid OB forms, it replaces the previously stored one.
Drawing Boxes:
If a valid Bullish OB is being tracked (and Show Bullish OBs is enabled), it draws a box (box.new) using the high and low of the identified OB candle ( ). The same process applies to Bearish OBs (Show Bearish OBs enabled). The boxes automatically extend to the right (extend.right) and their right edge is updated on each new bar (box.set_right) until they are mitigated. Labels ("Bull OB" / "Bear OB") are displayed inside the boxes.
Mitigation & Box Deletion:
The indicator checks if the current closing price (close ) has moved entirely beyond the range of the tracked OB.
Mitigation Rule Used: A Bullish OB is considered mitigated if close < bull_ob_low. A Bearish OB is considered mitigated if close > bear_ob_high. Once an OB is marked as mitigated, the indicator stops tracking it and its corresponding box is automatically deleted (box.delete) from the chart.
This indicator provides a dynamic visualization of the most recent, potentially significant Order Blocks that meet the specified criteria, helping traders identify key areas of interest based on ICT principles.

John Bob-Trading-BotDeveloped by Ayebale John Bob with the help of his bestie, this innovative strategy combines advanced Smart Money Concepts with practical risk management tools to help traders identify and capitalize on key market moves.
Key Features:
Smart Money Concepts & Fair Value Gaps (FVG):
The strategy monitors price action for fair value gaps, which are visualized as extremely faint horizontal lines on the chart. These FVGs signal potential areas where institutional traders might have entered or exited positions.
Dynamic Entry Signals:
Buy signals are triggered when the price crosses above the 50-bar lowest low or when a bullish FVG is detected. Conversely, sell signals are generated when the price falls below the 50-bar highest high or a bearish FVG is identified. Each signal is visually marked on the chart with clear buy (green) and sell (red) labels.
Multi-Level Order Execution:
Once an entry signal occurs, the strategy places five separate orders, each with its own take-profit (TP) level. The TP levels are calculated dynamically using the Average True Range (ATR) and a set of predefined multipliers. This allows traders to scale out of positions as the market moves favorably.
Dynamic Risk Management:
A stop-loss is automatically set at a distance determined by the ATR, ensuring that risk is managed in accordance with current market volatility.
Real-Time Trade Information Table:
In the bottom-right corner of the chart, a trade information table displays essential details about the current trade:
Side: Displays "BUY NOW" (with a dark green background) for long entries or "SELL NOW" (with a dark red background) for short entries.
Entry Price & Stop-Loss: Shows the entry price (highlighted in green) and the corresponding stop-loss level (highlighted in red).
Take-Profit Levels: Lists the five TP levels, each of which turns green once the market price reaches that target.
Timer: A live timer in minutes counts from the moment the current trade trigger started, helping traders track the duration of their active trades.
Visual Progress Bar:
A histogram-style progress bar is plotted on the chart, visually representing the percentage gain (or loss) relative to the entry price.
This strategy was meticulously designed to incorporate both technical analysis and smart risk management, offering a robust trading solution that adapts to changing market conditions. Whether you're a seasoned trader or just starting out, the AyebaleJohnBob Trading Bot equips you with the tools and visual cues needed to make well-informed trading decisions. Enjoy a seamless blend of strategy and style—crafted with passion by Ayebale John Bob and his bestie!

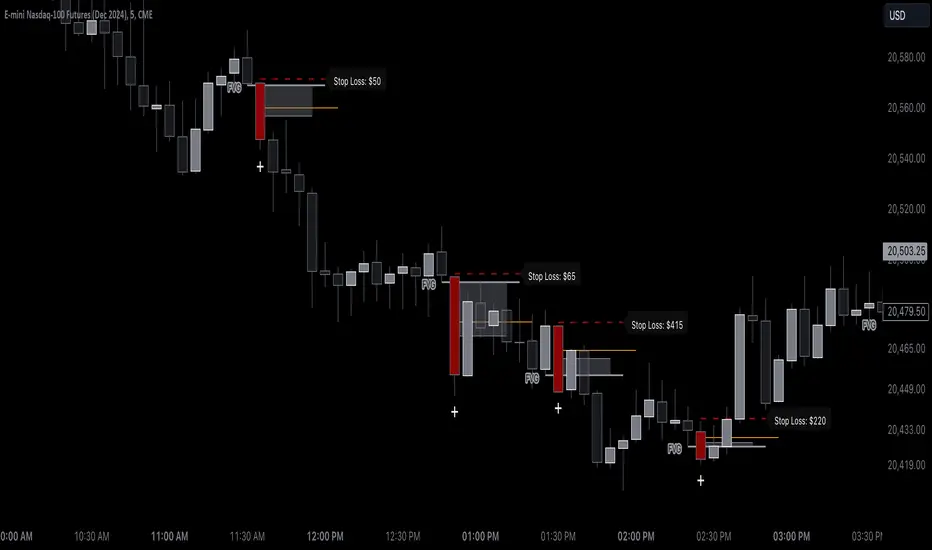
Bearish BreakerDescription:
The Bearish Breaker is designed to detect significant bearish candles that meet specific customizable conditions, allowing traders to easily identify potential sell signals or strong downtrends. This indicator highlights bearish candles based on size, close position within the candle's range, and other specific criteria, with options to plot Fibonacci levels, a stop loss line, and dollar loss estimation.
Key Features:
1. Customizable Candle Highlighting Conditions:
Highlights candles that are bearish and whose body is greater than a user-defined multiple of the average candle body size over a specified period.
2.Checks if the candle’s close is within a customizable percentage from the bottom of the candle’s range (default is 35%).
3. Ensures the close is lower than the lows of the previous two candles.
Visual Markings:
1. A plus sign appears below large bearish candles that meet the highlighting criteria.
2. Optionally plots a line at the low of the previous candle, labeled as "FVG" (Fair Value Gap).
3. Fibonacci Levels:
Plots 61.8% and 50% Fibonacci levels from the low to high of the highlighted candle.
4. Provides options to show/hide labels and adjust line colors.
5. Shaded Area:
Fills the area between the 50% and 61.8% levels with customizable color and transparency.
Stop Loss and Dollar Calculation:
1. Calculates a stop loss level, set a user-defined number of ticks above the high of the highlighted candle.
2. Displays a label with the potential dollar loss from the "FVG" to the stop loss line, using a specified dollar value per tick.
How To Use
1. Highlight Conditions: Adjust parameters like the average body length, threshold multiplier, and close percentage to fine-tune the bearish candle detection. typically I like to use the 4-6 body length with a 1.5 multiplier
2. Visual Elements: Toggle labels, colors, and transparency of Fibonacci and FVG lines, allowing you to customize the display for clarity.
3. Risk Management: Set the dollar value per tick and stop loss distance (in ticks) to display potential risk for your specific instrument , for example dollar per tick on NQ is $5 , ES is $12.50, CL is $10
4. Alerts:
An alert can be set to trigger each time a large bearish candle forms and meets all conditions, helping you stay notified of potential bearish momentum shifts.
5. Parameters:
Threshold Multiplier: Adjusts the size threshold for highlighting a bearish candle.
Close Percent in Range: Sets how close to the bottom of the candle’s range the close must be (0-100%). I like the candle to close in the lower 75 percent of the candle.
6. Stop Loss Ticks Above High: Controls how far above the high of the highlighted candle to place the stop loss.
7. Dollar Value per Tick: Calculates potential dollar loss between the FVG level and stop loss based on the asset’s tick value.
8. To trade this setup I like to wait for the first 1-2 candles after the highlighted breaker candle to pull back into the shaded area for a short position and target the low of the breaker candle or a 2-1 risk to reward.
Ideal For:
This indicator is ideal for traders looking to identify strong bearish momentum, manage risk visually, and use Fibonacci and fair value gaps on large bearish candles as potential areas for short entries with suggested stop loss areas and target profits.
Disclaimer: This indicator is for educational and informational purposes only and should not be used as a sole trading strategy. Always perform your own analysis before making trading decisions.
Key Prices & LevelsThis indicator is designed to visualize key price levels & areas for NY trading sessions based on the price action from previous day, pre-market activity and key areas from NY session itself. The purpose is to unify all key levels into a single indicator, while allowing a user to control which levels they want to visualize and how.
The indicator identifies the following:
Asia Range High/Lows, along with ability to visualize with a box
London Range High/Lows, along with ability to visualize with a box
Previous Day PM Session High/Lows
Current Day Lunch Session High/Lows, starts appearing after 12pm EST once the lunch session starts
New York Open (8:30am EST) price
9:53 Open (root candle) price
New York Midnight (12:00am EST) price
Previous Day High/Lows
First 1m FVG after NY Session Start (after 9:30am), with the ability to configure minimum FVG size.
Opening Range Gap, showing regular market hours close price (previous day 16:15pm EST close), new session open price (9:30am EST open) and optionally the mid-point between the two
Asia Range 50% along with 2, 2.5, 4 and 4.5 deviations of the Asia range in both directions
Configurability:
Each price level can be turned off
Styles in terms of line type, color
Ability to turn on/off labels for price levels and highlighting of prices on price scale
Ability to control label text for price levels
How is it different:
Identifies novel concepts such as 9:53 open, root candle that can be used as a bounce/resistance area during AM/PM sessions as well as confirmation of direction once closed over/under to indicate price's willingness to continue moving in the same direction.
It also shows 1st 1m FVG after New York Session open, that can be used to determine direction of the price action depending on PA's reaction to that area. While both 9:53 and 1m FVG are 1m based markers, these levels are visualized by the indicator on all timeframes from 15s to 1h.
Additionally the indicator is able to both highlight key prices in the price scale pane as well as combine labels to minimize clutter when multiple levels have the same price.
Lastly for in-session ranges such as Lunch High/Low the indicator updates the range in real-time as opposed to waiting for the lunch session to be over.
SMC Strategy Hub + Alerts💎 SMC Strategy Hub: Institutional Orderflow & Market Structure
Overview
This indicator is a comprehensive toolkit designed for traders who follow ICT, SMC (Smart Money Concepts), and The Quarterly Theory. It automates the detection of high-probability setups by identifying where institutional money is moving, specifically focusing on the "Model 1-4" setups found in professional price action trading.
🚀 Key Features
• Automatic Market Structure Shifts (MSS): Detects trend reversals the moment a swing high or low is violated.
• Fair Value Gap (FVG) Detection: Automatically draws supply and demand imbalances (Green/Red boxes).
• Live Trade Dashboard: A real-time UI showing current Trend Bias, Active Signals, and dynamic Take Profit targets.
• ATR Risk Engine: Calculates precise Stop Loss and Take Profit levels based on current market volatility.
• NY Session Filter: Optional toggle to focus exclusively on the high-probability New York "Silver Bullet" hours (07:30–12:00 EST).
📖 Step-by-Step Usage Guide
Step 1: Identify the Bias
Check the Dashboard in the top-right corner.
• BULLISH: Look only for Buy setups.
• BEARISH: Look only for Sell setups.
• NEUTRAL: The market is consolidating; stay patient.
Step 2: Wait for the Signal
The script will plot a BUY or SELL label on the chart. These signals trigger when a Market Structure Shift (MSS) aligns with price momentum.
Note: For the highest probability, ensure the signal appears during the NY Session (if the filter is active).
Step 3: Refine the Entry (The "A+" Setup)
Don't just chase the signal! For an elite entry, wait for price to retrace into the nearest Fair Value Gap (FVG) box:
• In a BUY setup, wait for price to dip back into the Green Box.
• In a SELL setup, wait for price to rally back into the Red Box.
Step 4: Manage the Trade
Once the entry is triggered, use the levels provided by the label:
• Stop Loss (SL): Place your stop at the price indicated to protect your capital.
• Take Profit (TP): The script calculates a logical exit based on a healthy Reward-to-Risk ratio.
⚙️ Recommended Settings
• Timeframe: 5-Minute or 15-Minute (Best for Intraday/Scalping).
• Asset Classes: Forex (EURUSD, GBPUSD), Indices (NAS100, US30), and Crypto.
• NY Filter: Highly recommended for traders following ICT's "Silver Bullet" methodology.

Smart Money Flow: Automated Liquidity & Fair Value GapsOverview
This script is a comprehensive Smart Money Concepts (SMC) toolkit designed specifically for high-volatility assets like Gold (XAUUSD/MGC) on the 4-Hour timeframe. It automates the identification of institutional "traps" and entry zones by tracking Liquidity Sweeps and Fair Value Gaps (FVG).
Key Features
Liquidity Sweep Detection (SSL/BSL): Automatically identifies "Stop Hunts" where price wicks beyond recent swing points to grab liquidity before a reversal.
Automated Fair Value Gaps (FVG): Draws and labels institutional imbalances where price is likely to return for a re-entry.
Market Structure Shift (MSS): Signals the "Change of Character" (CHoCH) following a liquidity sweep, confirming a potential trend reversal.
Scannable Visuals: Includes clear labels and box projections to help traders identify "Discount" and "Premium" zones at a glance.
How to Trade with this Tool
Wait for a Sweep: Look for the SSL Sweep (Green Triangle) or BSL Sweep (Red Triangle) on the 4H chart.
Confirm the Shift: Wait for the MSS (Star) to appear, signaling that the "Smart Money" has shifted the trend.
The Entry: Place your limit orders within the Labeled FVG Boxes created by the move.
Risk Management: Place your Stop Loss below the wick of the Liquidity Sweep.
Disclaimer
This script is a tool to assist in technical analysis. It does not guarantee profits. Trading futures, especially Gold, involves significant risk. Always use proper risk-to-reward ratios.

Bob's Whale Hunter - V7 (Jorge's Algo)Trade like a whale, not the bait.
The Whale Hunter V7 is a high-performance toolkit specifically engineered for traders following Smart Money Concepts (SMC) and Institutional Price Action. This indicator automates the identification of high-probability zones based on the AMD (Accumulation, Manipulation, Distribution) cycle.
🚀 Key Features:
Institutional Liquidity Sweeps: Automatically detects liquidity grabs at key highs and lows. These are the exact spots where institutional "whales" enter the market by triggering retail stop losses.
Dynamic Fair Value Gaps (FVG): Highlights market imbalances that act as price magnets. This allows you to time your entries during the "rebalance" with surgical precision.
Multi-Timeframe Dashboard (HTF Matrix): A real-time panel showing the Macro bias (4H) versus the Entry trend (15m). Stay aligned with the higher-timeframe order flow at all times.
Elite Market Structure: An institutional-grade trend filter that shifts color based on market dominance, helping you distinguish between a deep retracement and a true trend reversal.
🛠 How to Trade it (The Institutional Checklist):
Macro Alignment: Check the Dashboard. If 4H is green, look for buy setups only. Never trade against the "Big Money" flow.
Identify the Sweep: Wait for the triangle signal (Sweep). This confirms that liquidity has been cleared and the "Manipulation Phase" is likely complete.
The Trigger (FVG): Once a Break of Structure (ChoCH) occurs after the sweep, look for entries within the highlighted FVG boxes that align with your OTE (Optimal Trade Entry) Fibonacci levels.
Targeting: Aim for the opposing liquidity pools or the next institutional level identified by the script.
"Trading is a game of probabilities. Follow the footprints left by the giants."

Daily Bias Trade Manager [MarkitTick]💡 The Daily Bias Trade Manager is a sophisticated technical analysis suite designed to automate the identification of high-probability intraday setups based on liquidity concepts and structural shifts. By synthesizing Previous Day High/Low (PDH/PDL) interactions with momentum confirmation and strict risk management protocols, this tool assists traders in navigating the "Daily Bias." It moves beyond simple signal generation by offering a complete trade management visualization system, projecting entries, stop losses, and take-profit levels directly onto the chart in real-time.
✨ Originality and Utility
This script distinguishes itself by integrating institutional price action theory—specifically Liquidity Sweeps and Change in State of Delivery (CISD)—with mechanical filtering. While many indicators simply highlight highs and lows, the Daily Bias Trade Manager validates these levels by analyzing what happens *after* price tests them.
It solves a common problem for intraday traders: "Analysis Paralysis." By automating the detection of structure breaks (MSS) and Fair Value Gaps (FVG) following a sweep of daily liquidity, it provides an objective framework for entry. Furthermore, the built-in "Position Box" feature removes the guesswork from trade execution by instantly calculating risk-to-reward ratios and visualizing them, allowing traders to see the feasibility of a trade before execution.
🔬 Methodology and Concepts
The core logic operates on a sequential detection model:
Liquidity Identification: The script first plots the Previous Day High (PDH) and Previous Day Low (PDL). These are critical institutional reference points where stop-loss orders (liquidity) often reside.
The Sweep: A "Sweep" is confirmed when price breaches a PDH/PDL but fails to sustain the breakout, closing back inside the previous day's range. This suggests a "Fake-out" or liquidity grab, often a precursor to a reversal.
Change in State of Delivery (CISD): Following a sweep, the script monitors local market structure. It looks for a decisive close past a recent swing point (Swing High for shorts, Swing Low for longs) within a user-defined bar window. This confirms that the counter-trend move has momentum.
Confluence Filtering: To reduce false positives, the engine applies optional filters:
RVOL (Relative Volume): Ensures the sweep occurred on significant volume (Climax behavior).
RSI Momentum: Verifies that momentum supports the reversal direction.
Trend Filter: Uses a long-term EMA to ensure trades align with the broader market direction.
Entry Model: Upon validation, the script calculates an entry at the close (or optionally at a Fair Value Gap), places a Stop Loss at the sweep extreme, and projects three Take Profit targets based on configurable R:R ratios.
🎨 Visual Guide
The indicator uses a distinct color-coded system to keep the chart clean yet informative:
● Liquidity Levels & Sweeps
Orange/Blue Lines: Represent the PDH (Previous Day High) and PDL (Previous Day Low).
Teal Shaded Zones: Indicate a "Buy-Side Sweep" (Price took highs and rejected).
Red Shaded Zones: Indicate a "Sell-Side Sweep" (Price took lows and rejected).
● Position Management Boxes
When a signal triggers, a structured box appears:
Solid Gray Line: The theoretical Entry Price.
Solid Red Line: The Stop Loss (SL), typically placed at the swing high/low of the sweep.
Dashed Blue Lines: Represent TP1, TP2, and TP3 targets based on Reward-to-Risk settings.
Labels: Data tags on the right side of the box show exact price coordinates for Entry, SL, and Targets.
● Signals & Clouds
Green "BUY" Labels: Appear below the bar when a bullish sweep and structural shift are confirmed.
Red "SELL" Labels: Appear above the bar when a bearish sweep is validated.
Yellow Clouds: Highlight Fair Value Gaps (FVG) used for entry confluence or retests.
● Multi-Timeframe (MTF) Dashboard
A panel (default: Top Right) displays the status of up to three higher timeframes.
Trend: Shows "BULL" or "BEAR" based on EMA alignment.
Liquidity: Indicates if the timeframe is "Taking Buy Liq", "Taking Sell Liq", or "Inside Range".
📖 How to Use
● Bullish Reversal Setup
Wait for price to drop below the Blue PDL Line.
Look for a Red Sell-Side Sweep Zone to form, indicating price has rejected lower prices.
Wait for the Green BUY Signal . This confirms a shift in structure (CISD) back to the upside.
Observe the Position Box. If the Risk/Reward is favorable (targets are within reasonable reach), consider the trade.
Optional: Use the "Dynamic Targets" setting to target the previous swing high instead of a fixed ratio.
● Bearish Reversal Setup
Wait for price to rally above the Orange PDH Line.
Look for a Teal Buy-Side Sweep Zone .
Wait for the Red SELL Signal confirming the rejection.
Ensure the dashboard shows alignment (e.g., Higher Timeframe Trend is Bearish) for higher probability.
● Trade Management
Enable the "ATR Trailing Stop" in settings to have the Stop Loss line dynamically adjust as price moves in your favor, locking in potential gains.
⚙️ Inputs and Settings
● General & Display
Show Daily Liquidity: Toggles the PDH/PDL lines.
Max Signals/Zones: Limits the visual clutter by restricting historical shapes.
● Detection Logic
Swing Detection Length: Controls the sensitivity of pivot points. Higher numbers = fewer, more significant swings.
CISD Window: How many bars after a sweep are allowed for the structure shift to occur.
Use FVG Entry: If true, the signal waits for a retest of a gap rather than entering immediately at the close.
● Filters
Volume (RVOL): Requires the sweep candle volume to be X times larger than average.
Trend Filter: Only allows Buy signals above the EMA and Sell signals below it.
Session Filter: Restricts signals to specific hours (e.g., New York Killzone).
● Targets & Management
Target R:R: Sets the multiplier for TP1, TP2, TP3 relative to the stop loss distance.
Use Dynamic Targets: Targets structural liquidity (Previous Highs/Lows) instead of fixed math ratios.
ATR Trailing Stop: Activates the trailing stop mechanism.
🔍 Deconstruction of the Underlying Scientific and Academic Framework
This indicator is grounded in the principles of Market Microstructure and Mean Reversion theory .
1. Liquidity Pools & Stop Runs:
Academic literature on market microstructure suggests that order flow clusters around obvious visual references (PDH/PDL). Large market participants often utilize this "resting liquidity" to fill large block orders with minimal slippage. The "Sweep" logic detects this absorption phase.
2. Volatility Breakout vs. Fake-out:
The script differentiates between a genuine breakout and a mean-reverting "fake-out" by analyzing the Close relative to the Range . A close back within the prior day's range after a breach signifies a failure of auction in the new territory, statistically increasing the probability of a reversion to the mean (equilibrium).
3. Momentum Validation (RSI & RVOL):
By integrating Relative Volume (RVOL) and RSI, the script applies statistical significance testing to the price action. High volume at a range extreme without price progress (the sweep) indicates "Stopping Volume" or absorption, a key concept in Volume Spread Analysis (VSA).
🙏 Gratitude
I would like to express my gratitude to harry040708 for sharing the insightful idea that made this script possible.
⚠️ Disclaimer
All provided scripts and indicators are strictly for educational exploration and must not be interpreted as financial advice or a recommendation to execute trades. I expressly disclaim all liability for any financial losses or damages that may result, directly or indirectly, from the reliance on or application of these tools. Market participation carries inherent risk where past performance never guarantees future returns, leaving all investment decisions and due diligence solely at your own discretion.

Multi-Timeframe Trading SystemIntegrating Multi-Timeframe Trading Analysis: A Comprehensive Approach to Market Structure and Trend Identification
In the dynamic landscape of financial markets, traders continually seek robust analytical frameworks that can synthesize diverse market signals into a coherent decision-support system. This script represents a deliberate integration of several established technical analysis concepts, designed to provide a multi-perspective view of market conditions. The rationale for this integration stems from the recognition that no single indicator provides a complete picture; rather, a confluence of signals from different analytical dimensions can enhance the probability of identifying high-quality trading opportunities.
The core design principle of this script is the synthesis of trend analysis, momentum assessment, and market structure identification across multiple timeframes. This multi-layered approach is grounded in the widely accepted market axiom that higher timeframes exert gravitational pull on lower timeframes, and that the alignment of signals across temporal scales often precedes significant price movements.
Functional Components and Their Synergistic Operation
The script operates through several interconnected modules that work in concert:
Multi-Timeframe Trend Analysis Dashboard: At the heart of the system is a comparative trend analysis across six distinct timeframes (3-minute to daily). This is achieved using Exponential Moving Average (EMA) crossovers—a proven trend-following mechanism. The dashboard provides instantaneous visual feedback about trend alignment or divergence across timeframes, allowing traders to gauge the strength and consistency of prevailing market trends. When multiple timeframes exhibit congruent trend directions, it suggests a higher-conviction trading environment.
EMA-Based Trend Filtering: The script employs dual EMA periods (55 and 200) as its primary trend filter. The relationship between these moving averages serves as the foundation for all subsequent analysis, coloring price bars according to the dominant trend direction. This visual cue helps traders maintain perspective on the broader market context, preventing counter-trend entries during strong trending phases.
Momentum Assessment via RSI: The Relative Strength Index (RSI) operates as a complementary momentum oscillator. While the EMA system identifies trend direction, the RSI helps assess whether price movement within that trend is approaching overextended conditions. The script monitors RSI levels for traditional overbought and oversold thresholds, providing alerts when these conditions emerge.
Market Structure Analysis through Swing Points and Fractals: The automated detection of swing highs and lows forms the basis for understanding market structure. These pivot points are essential for identifying potential support/resistance zones and charting the sequence of higher highs/lows or lower highs/lows that characterize trending versus ranging markets. The fractal detection system further refines this structural analysis by identifying minor reversal points within the broader swing structure.
Fair Value Gap (FVG) Identification: The script automatically detects price voids or "gaps" that often act as magnetic attractors for future price action. These FVGs represent areas of inefficient price discovery where liquidity tends to cluster, making them significant for both trade entry and risk management decisions.
Automated Trendline Construction: By connecting successive swing points, the script dynamically draws trendlines that visualize the prevailing market trajectory. These trendlines serve as dynamic support/resistance levels that adapt to changing market conditions.
Practical Application and Usage Guidelines
Traders can utilize this integrated system in several practical ways:
Trend Confirmation: Before entering any position, check the multi-timeframe dashboard for trend alignment. Convergent trends across multiple timeframes generally offer higher-probability trading environments.
Entry Timing: Use RSI extremes in conjunction with trend direction. For instance, in an established uptrend (confirmed by EMA alignment), an RSI reading dipping into oversold territory may present a favorable long entry opportunity.
Structural Analysis: Monitor the sequence of swing points to identify potential breakouts or breakdowns in market structure. A break of a significant swing point often signals acceleration in the prevailing trend.
Fair Value Gap Trading: Watch for price returns to previously identified FVGs, as these zones frequently provide favorable risk-reward entry points with logical stop-loss placement beyond the gap boundaries.
Dynamic Support/Resistance: Utilize the automatically drawn trendlines as dynamic levels for trade management, including entry, stop-loss placement, and profit-taking.
Originality and Distinctive Features
While individual components of this system are derived from established technical analysis principles, the original contribution lies in their specific integration and visualization methodology. The script provides:
A unified visual framework that reduces analytical clutter while maintaining comprehensive market assessment
Real-time multi-timeframe analysis without requiring constant chart switching
Automated structural analysis that eliminates subjective trendline drawing
A balanced approach that respects both trend-following and mean-reversion principles
Customizable parameters that allow adaptation to different trading instruments and timeframes
Important Considerations
Users should understand that this tool is designed as a decision-support system, not an automated trading solution. All trading decisions should incorporate additional factors including fundamental analysis, market context, and appropriate risk management. The color-coded bar system and dashboard indicators are intended to streamline analysis, but they cannot guarantee specific market outcomes. Traders are encouraged to test this system in simulated environments before applying it to live markets and to adapt its parameters to align with their individual trading styles and risk tolerances.
The script's value proposition lies in its ability to synthesize multiple analytical perspectives into a cohesive visual interface, potentially reducing cognitive load while maintaining analytical rigor—a balance that many traders find challenging to achieve manually across multiple charts and timeframes.

10 Youtube Opening Range Strategies + Backtest 1. Quick Flip Scalper
A strategy centered on fading or following the initial move relative to the Opening Range (OR).
LONG Rules:
Reversal Mode: If the Opening Range is Bearish (Red), enter Long when price drops below the Opening Range Low (ORL).
Continuity Mode: If the Opening Range is Bullish (Green), enter Long when price drops below the Opening Range Low (ORL) (Buying the deep pullback/trap).
SHORT Rules:
Reversal Mode: If the Opening Range is Bullish (Green), enter Short when price breaks above the Opening Range High (ORH).
Continuity Mode: If the Opening Range is Bearish (Red), enter Short when price breaks above the Opening Range High (ORH) (Selling the deep pullback/trap).
2. First Candle Scalper
Identical to the Quick Flip Scalper but restricts entries to the very first retest only.
LONG Rules:
Same as Quick Flip Long, but only triggers once per session.
SHORT Rules:
Same as Quick Flip Short, but only triggers once per session.
3. Smart Money Trap (SMT)
Identifies a "fakeout" breakout followed immediately by a reversal candlestick pattern.
LONG Rules:
Condition: The previous candle low was below the ORL, but the candle closed back inside (above ORL).
Trigger: Must have a Bullish Engulfing or Bullish Rejection pattern closing above the ORL.
SHORT Rules:
Condition: The previous candle high was above the ORH, but the candle closed back inside (below ORH).
Trigger: Must have a Bearish Engulfing or Bearish Rejection pattern closing below the ORH.
4. Trident Pattern (TG Capital)
A London-session exclusive strategy requiring a Fair Value Gap (FVG) and a Doji confirmation.
LONG Rules:
Filter: Price is Above the 200 EMA (if enabled).
Setup: A Bullish FVG forms.
Confirmation: A Doji candle wicks down into the 50% level of the FVG.
Trigger: Enter on the next candle close.
SHORT Rules:
Filter: Price is Below the 200 EMA (if enabled).
Setup: A Bearish FVG forms.
Confirmation: A Doji candle wicks up into the 50% level of the FVG.
Trigger: Enter on the next candle close.
5. OTE Framework (MBB Trader)
Simulates an Optimal Trade Entry by combining a Liquidity Sweep with a Market Structure Shift (SMR).
LONG Rules:
Sweep: Price drops below the lowest low of the last 20 candles.
Structure: A Bullish SMR forms (Low → High → Lower Low → Higher High).
SHORT Rules:
Sweep: Price breaks above the highest high of the last 20 candles.
Structure: A Bearish SMR forms (High → Low → Higher High → Lower Low).
6. Liquidity Trap (Marco Trades)
A contrarian strategy that buys/sells purely on sweeps of major structural levels.
LONG Rules:
Trigger: Price sweeps (drops below) the lowest low of the last 50 candles.
SHORT Rules:
Trigger: Price sweeps (breaks above) the highest high of the last 50 candles.
7. Trojan Horse (Trader Mayne)
Uses Trend EMAs (50 & 200) to identify direction, then enters on a Lower Timeframe Breaker.
LONG Rules:
Trend: 50 EMA > 200 EMA (Uptrend).
Trigger: Price sweeps a recent 10-candle low, then immediately breaks a recent 5-candle high.
SHORT Rules:
Trend: 50 EMA < 200 EMA (Downtrend).
Trigger: Price sweeps a recent 10-candle high, then immediately breaks a recent 5-candle low.
8. Simplified SMT (9:30 Range)
Focuses on the 9:30 AM range. Waits for a breakout and a confirmed failure to sustain it.
LONG Rules:
Context: Price previously broke above the ORH.
Trigger: Price returns to the ORH (Retest) with a Bullish Engulfing/Rejection pattern.
SHORT Rules:
Context: Price previously broke below the ORL.
Trigger: Price returns to the ORL (Retest) with a Bearish Engulfing/Rejection pattern.
9. 9:30 One-Candle (Scarface)
Uses the high/low of the single 9:30 candle as the range.
LONG Rules:
Setup: Price closes above the 9:30 High.
Trigger: Price pulls back and touches/dips into the 9:30 High (Retest).
SHORT Rules:
Setup: Price closes below the 9:30 Low.
Trigger: Price pulls back and touches/wicks into the 9:30 Low (Retest).
10. London Breakout (Joovier)
Based on the 3 AM - 9 AM EST box.
LONG Rules:
Trigger: A candle's Body (Open and Close) forms completely above the Box High after the session opens.
SHORT Rules:
Trigger: A candle's Body (Open and Close) forms completely below the Box Low after the session opens.
⚠️ DISCLAIMER & LIMITATION OF LIABILITY
1. NO AFFILIATION / INDEPENDENT PROJECT This script is an independent coding project created solely for testing, research, and entertainment purposes. The creator of this indicator is not associated, affiliated, endorsed by, or in any way connected to the strategy authors or influencers mentioned within the tool (including but not limited to TG Capital, MBB Trader, Marco Trades, Trader Mayne, Scarface, or Joovier).
The strategy names are used strictly for identification purposes to credit the original concept creators.
This code represents an independent interpretation of public trading concepts. It may not reflect the exact, proprietary, or private methods taught by these individuals.
This is not an official product from any of the aforementioned parties.
2. FOR EDUCATIONAL PURPOSES ONLY This indicator is strictly for educational and informational purposes. It is not a signal service and does not constitute investment, financial, or trading advice. The buy/sell labels generated by this script are merely visual representations of specific code logic and should not be interpreted as instructions to execute trades.
3. EXCLUSION OF LIABILITY By using this script, you explicitly agree that:
The creator assumes no responsibility or liability for any direct, indirect, consequential, or incidental losses or damages resulting from the use of this tool.
You engage in trading entirely at your own risk.
You release the creator from any legal responsibility regarding your trading activities or financial results.
4. HYPOTHETICAL PERFORMANCE The statistics displayed on the "Dashboard" (Win Rate, P&L, etc.) are hypothetical and based on historical backtesting data.
Past performance is not indicative of future results.
These results do not account for slippage, spreads, commission fees, or real-time liquidity issues.
Strategies that performed well in the past may fail in current or future market conditions.
5. HIGH-RISK WARNING Trading in financial markets (Stocks, Forex, Crypto, Futures) involves a high degree of risk and is not suitable for all investors. You could lose some or all of your initial investment. You should not trade with money that you cannot afford to lose.
IF YOU DO NOT AGREE WITH THESE TERMS, DO NOT USE THIS SCRIPT.

Volume Delta MontoscaTechnical Summary: Volume Delta Montosca + Market Bias V3
The Volume Delta Montosca + Market Bias V3 is a multi-layered analysis tool designed to decode market sentiment through volume decomposition and relative strength. Instead of looking at volume as a single metric, this indicator splits every bar into its buy and sell components to reveal the true intent behind price movements.
Core Volume Analysis and Delta Logic
The indicator uses a calculation based on price movement within each bar to estimate Buy and Sell Delta. It measures the relationship between the close, high, and low to determine how much of the total volume was aggressive buying versus aggressive selling. Users can define a Dominance Threshold (typically 80%), which acts as a filter to identify bars where one side has a "substantial majority," effectively ignoring noise and focusing on high-conviction moves.
Signal Generation and FVG Filtering
Signals are categorized into two levels of importance. Base Signals (represented by small circles) occur when there is a significant volume spike—defined by a 20-period SMA—combined with high dominance. However, the indicator also features an internal Fair Value Gap (FVG) Filter. When price action "inverts" or breaks through a recent price imbalance while showing dominant volume, the indicator triggers a High-Priority Signal (represented by triangles). This specific logic ensures that signals are not just based on volume, but on the successful reclamation of key price areas.
Dynamic Market Bias and Comparative Strength
Beyond individual asset analysis, the script includes a Market Bias Engine that compares the current ticker against a benchmark, such as the S&P 500 (ES1!). It calculates a ratio between the two assets and applies a "Volume Supremacy" logic. If the current asset shows expanding volume and higher dominance percentages than the benchmark, the Bias Panel updates to show which asset is leading the market. This allows traders to see at a glance if they are trading the strongest available asset or if the broader market bias is shifting against them.
Visual Elements and Customization
The tool offers a clean visual experience by plotting a dual-colored histogram where the dominant volume color takes priority. It also includes Volume Candles, which paint the bars on the main chart to match the volume sentiment, and Top Diamonds to mark the peaks of volume expansion. All features, including the FVG lookback range and the SMA adjustment factor, are fully customizable to fit different trading timeframes and styles.

Engulfing Breakout StructureEngulfing Breakout Structure (EBS)
" Identify High-Probability Market Structures, Not Just Patterns. "
The E ngulfing Breakout Structure (EBS) is a professional-grade analysis tool designed to filter market noise and identify the true origins of significant price movements. While standard Engulfing patterns occur frequently, many lead to "fakeouts" within a range. EBS solves this by treating an engulfing candle as a potential "structure" that is only validated once a decisive Break-away occurs.
How it Works: The EBS Logic
Unlike traditional indicators that plot signals immediately, EBS follows a strict confirmation process:
Structure Formation (Invisible): The script internally tracks "Candidate" engulfing candles.
Break-away Validation: The structure is only drawn on the chart after price aggressively breaks out of the engulfing range, accompanied by a Fair Value Gap (FVG).
Historical Anchoring: Once confirmed, the block is plotted back to its origin, highlighting the exact zone where the market imbalance was created.
Key Features
Break-away Filter: Eliminates low-probability signals by ensuring price has left the "zone of indecision."
Dynamic Structure Plotting: Automatically draws the supply/demand blocks that acted as the catalyst for the breakout.
Smart FVG Integration: Detects and highlights the gaps created during the breakout, providing additional confluence for entry.
EBS Break-away Confirmed: Triggered the moment a new structure is validated by a decisive price breakout. This alert signals that a new supply or demand zone has been established.
EBS Structure Tested (Mitigation): Triggered when price returns to touch a previously confirmed EBS block. This "Mitigation" often presents the highest risk-to-reward entry opportunity as it tests the origin of the breakout.
Trading Strategy
The Breakout (Aggressive): Enter as soon as the EBS block and FVG appear, following the momentum.
The Retest (Conservative): Wait for price to return and "mitigate" the EBS block. This retest of a confirmed breakout structure is a classic institutional entry pattern.

cephxs + fadi / HTF PSPHTF PSP - PRECISION SWING POINTS
Detect divergence-based Precision Swing Points (PSPs) across multiple higher timeframes with automatic correlated asset detection.
WHAT'S NEW (vs Original HTF Candles)
This indicator builds on @fadizeidan's excellent ICT HTF Candles foundation with significant new functionality, depending on who you ask of course:
✨ PSP Divergence Detection: Automatically identifies Precision Swing Points where price diverges from correlated assets—the original has no divergence analysis
✨ Auto Asset Correlation: Uses AssetCorrelationUtils library to detect and pair correlated assets (ES↔NQ↔DXY, BTC↔ETH, Gold↔Silver, etc.)—no manual setup required
✨ Multi-Asset Comparison: Tracks up to 3 correlated assets simultaneously with divergence relationships between all pairs
✨ Dynamic Asset Reordering: When you switch charts, the indicator automatically reorders assets so your chart is always primary
✨ Inverse Correlation Support: Properly handles inversely correlated assets like DXY (bullish DXY = bearish signal for risk assets)
✨ HTF Sweep Detection: New sweep line feature highlights when HTF candles take out previous highs/lows and close back inside. One of my followers asked me for this, there you go anon.
🔧 Streamlined to 3 HTFs: Focused design with 3 HTF slots (vs 6) for cleaner charts and better performance
The original remains excellent for pure HTF candle visualization. This version adds institutional flow analysis through divergence detection.
WHAT IT DOES
This indicator displays Higher Timeframe (HTF) candles to the right of your chart and highlights Precision Swing Points—pivots where price diverges from correlated assets. When ES makes a new high but NQ doesn't follow, or gold pushes higher while DXY fails to confirm, you're looking at institutional repositioning.
PSPs mark these moments on your HTF candles, giving you a clean visual signal for potential reversals.
HOW IT WORKS
Divergence Detection
The indicator compares price action between your chart and up to two correlated assets. A divergence occurs when one asset makes a directional move (bullish/bearish candle) while a correlated asset moves the opposite direction.
Three divergence relationships are tracked:
Primary vs Secondary (e.g., ES vs NQ)
Primary vs Tertiary (e.g., ES vs DXY)
Secondary vs Tertiary (e.g., NQ vs DXY)
PSP Confirmation
A candle is marked as a PSP when:
A divergence exists between correlated assets
A swing pivot forms (high > previous high AND high > next high, or vice versa for lows)
This dual confirmation filters noise and highlights only meaningful institutional activity.
Automatic Asset Detection
In Auto mode, the indicator uses the AssetCorrelationUtils library to detect your chart's asset class and automatically select the most relevant correlated pairs:
Indices: ES ↔ NQ ↔ DXY, YM ↔ ES ↔ NQ
Forex: EURUSD ↔ DXY ↔ GBPUSD, USDJPY ↔ DXY ↔ US10Y
Crypto: BTC ↔ ETH ↔ DXY
Metals: Gold ↔ Silver ↔ DXY
Energy: CL (Oil) ↔ NG ↔ DXY
HTF Sweep Detection
Sweeps are detected when an HTF candle (C2) takes out the high or low of the previous candle (C1) and then closes back inside. This marks liquidity grabs on the higher timeframe.
HOW TO USE
Enable HTF timeframes: Select 1-3 higher timeframes relevant to your trading style (e.g., 30m, 90m, 4H for intraday traders)
Watch for PSP candles: When a candle body color changes to the divergence color, a PSP has formed
Note the direction: Bullish divergence (your asset bullish while correlated asset bearish) suggests upside; bearish divergence suggests downside
Combine with LTF structure: Use PSPs as bias, then look for entry on lower timeframes (CHoCH, FVG, etc.)
Sweeps confirm liquidity: A sweep followed by a PSP is a strong reversal signal
INPUTS
HTF Selection
HTF 1/2/3: Enable/disable each HTF slot with timeframe and candle count
Custom Daily Open: Use Midnight, 8:30, or 9:30 ET as daily candle open
Styling
Body/Border/Wick Colors: Customize bullish and bearish candle appearance
Padding/Buffer/HTF Buffer: Control spacing between candles and timeframe groups
Labels
HTF Label: Show timeframe name above/below candles
Remaining Time: Countdown to candle close
Label Position: Top, Bottom, or Both
Label Alignment: Align across timeframes or follow individual candles
Interval Value: Show interval details on candles
Imbalance
Fair Value Gap: Highlight FVGs on HTF candles
Volume Imbalance: Highlight VIs on HTF candles
HTF Sweeps: Show sweep lines when C2 takes out C1's high/low
Trace
Trace Lines: Draw lines from HTF candle OHLC levels back to chart price
Anchor: Anchor to first or last timeframe
PSP Divergence Detection
Precise Mode: Only highlight pivots on current asset (stricter confirmation)
Divergence Body Colors: Custom colors for bullish/bearish divergence candles
Asset Selection
Correlation Preset: Auto (library-detected) or Manual
Manual Assets 1/2/3: Specify custom correlated assets
Invert Asset 3: Flip the bullish/bearish interpretation for inverse correlations (e.g., DXY)
KEY FEATURES
Multi-HTF Display: Up to 3 higher timeframes displayed simultaneously
Auto Asset Detection: Automatically finds relevant correlated assets for your chart
Dynamic Reordering: When you switch charts, assets reorder so the chart is always primary
Inverse Correlation Support: Properly handles DXY and other inversely correlated assets
HTF Sweep Detection: Highlights liquidity grabs on higher timeframes
FVG/VI Detection: Fair Value Gaps and Volume Imbalances on HTF candles
Remaining Time Counter: Know exactly when the next HTF candle closes
BEST PRACTICES
Use PSPs as directional bias, not direct entries—wait for LTF confirmation
A PSP at a key level (previous day high, weekly open) carries more weight
Multiple PSPs across different HTFs pointing the same direction = stronger signal
Sweeps that fail to hold (sweep + PSP) often mark significant reversals
In Auto mode, trust the library's asset selection—it's been tuned for common correlations
DISCLAIMER
This indicator is for educational purposes only and does not constitute financial advice. Divergences and PSPs do not guarantee reversals—always use proper risk management and confirm signals with your own analysis. Past performance does not guarantee future results.
CREDITS
Original HTF candle plotting concept by @fadizeidan. PSP divergence detection and asset correlation logic by cephxs & fstarcapital. Uses the AssetCorrelationUtils library by fstarcapital.
Open Sourced For all.
Enjoy.
Made with ❤️ by cephxs + fadi

Institutional Liquidity Engine [Pointalgo]PointAlgo – Institutional Liquidity Engine is a price-overlay market structure and liquidity visualization tool designed to help traders analyze supply & demand behavior, liquidity zones, and price inefficiencies using rule-based logic inspired by modern market structure concepts.
This indicator focuses on where price aggressively moved from, where liquidity may remain, and how those zones evolve over time, without generating direct buy/sell signals.
The script is fully open-source, free to use, and intended strictly for educational and analytical purposes.
Core Analytical Concepts :
This indicator visualizes:
Market structure pivot points
High-volatility displacement zones
Supply & demand (order-block–like) areas
Liquidity mitigation behavior
Fair Value Gaps (price inefficiencies)
Zone lifecycle management (active vs mitigated)
It does not claim to detect actual institutional orders.
How the Indicator Works :
Volatility-Filtered Structure Detection
Uses ATR-based volatility filtering
Zones are only created when price displacement exceeds normal volatility
Helps reduce noise from weak or random candles
Demand & Supply Zone Identification
A demand zone is detected when:
A pivot low forms
The candle before the move is bearish
Price rapidly expands upward after the pivot
Volatility conditions are met
These zones highlight areas where price previously reacted strongly upward.
Supply Zones (Bearish)
A supply zone is detected when:
A pivot high forms
The candle before the move is bullish
Price drops aggressively after the pivot
Volatility conditions are met
These zones highlight areas where selling pressure previously dominated.
Smart Mitigation Engine (Automatic Zone Management)
One of the key design goals of this indicator is chart cleanliness.
Each zone is continuously monitored:
If price returns into the zone, it is considered mitigated
Users can choose to:
Automatically remove mitigated zones
Or gray them out for historical reference
Old and irrelevant zones far from price are also automatically deleted.
This prevents the chart from filling with outdated boxes.
Fair Value Gap (Liquidity Void) Detection
Optional Fair Value Gaps (FVGs) are displayed when:
Price moves so fast that wicks do not overlap
The gap size exceeds a user-defined ATR threshold
These gaps visually represent price inefficiencies where liquidity may be revisited.
Types:
🔵 Bullish FVG
🟠 Bearish FVG
Real-Time Dashboard
A small dashboard displays:
Active demand zones
Active supply zones
This provides a quick structural overview without scanning the entire chart.
Customization Options
Users can configure:
Pivot sensitivity
Zone colors
Mitigation behavior
Fair Value Gap visibility
Minimum gap size (ATR-based)
This makes the indicator adaptable across:
Forex
Indices
Crypto
Stocks
Futures
How to Use This Indicator
This tool is best used for:
Market structure analysis
Supply & demand studies
Liquidity mapping
Confluence with price action
Higher-timeframe bias alignment
Recommended complementary tools:
Support & Resistance
Trend analysis
Volume profiling
Risk management rules
Important Disclaimer
This indicator is provided for educational and analytical purposes only.
It does not provide trading signals, investment advice, or profit guarantees.
Market structure and liquidity concepts are interpretive in nature.
Users are solely responsible for their own trading decisions and risk management

Liquidity Gravity Engine [Pineify]```markdown
Liquidity Gravity Engine - Market Structure, Displacement, Liquidity Rails
Overview
Liquidity Gravity Engine is a market structure + liquidity visualization indicator designed to help you read flow , impulse , and liquidity magnets on any symbol and timeframe. Instead of relying on a single moving average, it builds a dynamic “flow ribbon” from confirmed swing structure, highlights displacement candles that create imbalance (FVG-style gaps), and projects unmitigated swing levels as liquidity rails that price often revisits.
Key Features
Liquid Flow Ribbon: a structure-based dynamic band that adapts to volatility.
Displacement Highlighting: flags momentum candles that expand beyond ATR and form an imbalance.
Liquidity Rails: extends unmitigated swing highs/lows as potential targets until swept.
Trend Context: displacement is filtered using the ribbon’s smoothed centerline.
How It Works
Market Structure (Swings) : swing highs/lows are detected using pivot logic over your “Structure Lookback”. Pivots become confirmed only after the lookback window completes, which means historical swing points can update until they are confirmed.
Flow Construction : the most recent confirmed swing high and swing low define a top and bottom boundary. Their midpoint is then smoothed with an EMA to create the “liquid” centerline.
Displacement + Imbalance : a candle is considered displacement when its range expands beyond ATR(14) × Displacement Factor and it creates a simple FVG-style gap (current low above the high two bars back for bullish, or current high below the low two bars back for bearish). The bar is then filtered by being on the correct side of the smoothed flow center.
Liquidity Rails : each new confirmed swing high/low can become a dotted rail. Rails extend forward and are removed once price sweeps beyond the level (mitigation), keeping the chart focused on active liquidity.
Trading Ideas and Insights
Use the ribbon as context : bias is stronger when price holds one side of the flow centerline.
Treat displacement markers as impulse confirmation : they often appear at breakout moments or at the start of expansions.
Use liquidity rails as magnets : unmitigated swing highs/lows can act as targets for continuation or mean-reversion moves.
Combine structure + displacement: a sweep into a rail followed by an opposite displacement can hint at a reversal attempt.
How Multiple Components Work Together
This indicator is intentionally built as a single liquidity-driven workflow:
Swings define structure.
Structure defines the flow ribbon (trend/volatility context).
The ribbon filters displacement so you see momentum that aligns with flow.
Liquidity rails provide objective target zones derived from the same swing structure.
The result is a cohesive view of market structure flow, institutional-style displacement, and liquidity targets without stacking multiple separate indicators.
Unique Aspects
Structure-first ribbon: the band is anchored to confirmed swing points, not just a price average.
Imbalance-aware displacement: requires both range expansion and a gap-style condition, reducing generic “big candle” noise.
Self-cleaning liquidity rails: mitigated levels are removed to keep the chart readable.
How to Use
Start with defaults on a clean chart.
Identify the flow: price above the smoothed centerline favors bullish flow; below favors bearish flow.
Watch for displacement diamonds (“D”): they often validate a push away from structure and can mark the start of a leg.
Plan around rails: treat dotted lines as potential objectives and areas where reactions/sweeps can occur.
Customization
Structure Lookback : smaller values = more sensitive swings; larger values = cleaner, slower structure.
Displacement Factor : higher values = fewer, stronger displacement bars; lower values = more signals.
Show Liquidity Rails + Liquidity Lookback : control whether rails are plotted and how active levels are emphasized.
Visuals : adjust bullish/bearish flow colors and liquidity line styling for your chart theme.
Conclusion
Liquidity Gravity Engine helps you map market structure, highlight displacement and imbalance (FVG-style) momentum, and visualize liquidity targets with rails that stay relevant until swept. Use it for trend context, breakout confirmation, and liquidity-based trade planning on forex, crypto, stocks, and indices.

PHEN ATLAS - Market Map & Playbook [PhenLabs]📊 PHEN ATLAS 🎂 #50 🎂
Version: PineScript™ v6
📌 Description
The PHEN ATLAS marks a historic milestone as the 50th official release from PhenLabs . This is a critical release you do not want to miss, serving as a comprehensive Market Map and Playbook designed to provide traders with a complete structural overview of price action. By synthesizing Market Structure, Liquidity concepts, and Regime detection, this script solves the problem of "analysis paralysis" by grading price action in real-time. It moves beyond simple indicators by offering a quantified "Playbook" that scores trade setups from 0 to 100, helping traders focus exclusively on high-probability opportunities while automating the complex math of position sizing and risk management.
🚀 Points of Innovation
Proprietary Scoring Engine: Unlike standard indicators, this script assigns a quantitative score (0-100) to every potential trade based on confluence factors like HTF alignment and displacement.
Dynamic Regime Detection: Features an integrated dashboard that classifies the market into specific phases (Expansion, Trend, Range) using ADX and EMA alignment logic.
Smart Liquidity Pools: Automatically identifies and visualizes resting liquidity, tracking when these pools are "swept" to generate high-probability reversal signals.
Integrated Trade Manager: Automates the calculation of Stop Loss, Take Profit (1:2 and 1:3), and Position Size based on account balance and risk percentage directly on the chart.
Multi-Mode Interface: Offers three distinct visual modes—Clean, Pro, and Sniper—allowing users to toggle between deep analysis and clutter-free execution instantly.
🔧 Core Components
Structure Module: Identifies Pivots, Break of Structure (BOS), and Change of Character (CHoCH) to define the current market bias.
Liquidity Engine: Plots liquidity pools at key swing points and detects "Sweeps" where price grabs liquidity before reversing.
Regime Filter: Uses a combination of EMAs (21/50) and ADX to determine if the market is trending or ranging, filtering out low-quality signals.
Setup Validator: Monitors for three specific setup types (Sweep, Snapback, FVG Retest) and triggers alerts only when specific scoring thresholds are met.
🔥 Key Features
Automated detection of High Timeframe (HTF) structure without repainting issues.
Real-time grading of price displacement to validate institutional intent.
Visual Risk/Reward boxes that automatically adjust to the volatility (ATR) of the asset.
Fair Value Gap (FVG) detection with auto-mitigation tracking to clean up the chart.
Customizable alerts for A+ setups, regime changes, and trade invalidations.
Detailed dashboard displaying current Trend, Phase, Bias, and the score of the last setup.
🎨 Visualization
Structure Points: Triangles for BOS and Diamonds for CHoCH events clearly mark trend shifts.
Liquidity Lines: Dotted lines extending from pivots indicate un-swept liquidity pools; these dim automatically when swept.
Setup Signals: Prominent "A+" labels appear on the chart when a setup meets the minimum score threshold defined by the user.
Risk Boxes: Color-coded boxes (Green for Long, Red for Short) show Entry, Stop Loss, and Take Profit levels visually.
Dashboard: A compact table in the bottom right corner provides a "Heads Up Display" of the market state.
📖 Usage Guidelines
Display Mode: Select between 'Clean' for signals only, 'Pro' for full analysis including FVGs and Structure, or 'Sniper' for only high-score setups.
HTF Timeframe: Sets the higher timeframe for structural analysis (Default: 240/4-Hour) to ensure you trade with the dominant trend.
Min Score for A+ Setup: Threshold (0-100) required to trigger a signal (Default: 83); increase this to filter for only the absolute best trades.
Risk %: Defines the percentage of your account you are willing to risk per trade (Default: 1.0%), used for the position size calculation.
Account Balance: Input your current capital (Default: 10,000) to receive accurate unit sizing for every trade setup.
ADX Threshold: Adjusts the sensitivity of the Regime detection filter (Default: 20) to determine when the market is trending versus ranging.
✅ Best Use Cases
Confluence Trading: Use the scoring system to filter discretionary entries, taking trades only when the system scores them above 80.
Prop Firm Trading: Utilize the built-in position size calculator to strictly adhere to risk management rules during evaluations.
Trend Following: Wait for the Regime Dashboard to show "Bullish Expansion" before taking Long "Snapback" entries.
Reversal Trading: Focus on "Sweep Reclaim" setups where price sweeps a liquidity pool and immediately closes back within range.
⚠️ Limitations
This tool is a trend-following and reversal system; it may produce lower scores during undefined, low-volatility chop.
The position size calculator is an estimation based on the entry candle; actual execution slippage is not accounted for.
HTF data relies on closed candles to prevent repainting, which may result in a slight lag during rapid volatility spikes.
💡 What Makes This Unique
Playbook Scoring: Most indicators just give a signal; PHEN ATLAS gives you a "Grade" (e.g., 85/100), allowing you to make informed decisions based on quality, not just frequency.
Context Awareness: The script understands "Market Regime" and creates a context-aware bias, rather than blindly firing signals in a range.
🔬 How It Works
Step 1 - Regime Definition: The script analyzes the 21/50 EMA relationship and ADX to define if the market is in a Trend or Range.
Step 2 - Structure & Liquidity: It maps key pivots and liquidity pools, waiting for a "Sweep" event or a structural break.
Step 3 - Setup Trigger: When a specific pattern occurs (like a Sweep Reclaim), the engine calculates a score based on displacement, volume, and key level alignment.
Step 4 - Execution Logic: If the score > Threshold, the Trade Manager calculates the invalidation point (SL) and projects 2R/3R targets automatically.
🎉 Message From The Team 🎉
2025 was an amazing year. 12 months of building, shipping, and improving together with you. Hitting our 50th indicator release marks one full year of weekly drops , and we couldn't have done it without this community, and of course, BIG thank you to TradingView and it's team.
Thank you for all the feedback, charts, and support. Let's make 2026 even bigger. We can't wait to show you what we've been working on. 🚀
💡 Note
For best results, we recommend using the "Pro" mode during analysis to understand the narrative, and switching to "Sniper" or "Clean" during execution to maintain focus. Always ensure your "Account Balance" input matches your broker balance for accurate risk calculations.

ICT Fair Value Gaps [Zero-Noise Edition]ICT Fair Value Gaps
Overview
In the Smart Money Concepts (SMC) framework, clarity is the ultimate edge. Most FVG indicators clutter your screen with "ghost boxes" that remain long after they have been filled. This professional-grade tool identifies high-displacement institutional imbalances and automatically dissolves them the moment they are mitigated.
Key Features
Precision Detection : Uses the classic 3-candle displacement logic to identify institutional gaps.
Auto-Mitigation : Boxes are removed the moment price retraces and "fills" the imbalance, keeping your chart 100% clean.
High Performance : Optimized with array-based logic for zero-lag performance on all timeframes.
Built-in Alerts : Stay informed with real-time notifications when new institutional displacement occurs.
How to Trade This Tool
The Trigger : A new FVG box appears, confirming institutional "intent."
The Draw : Treat the open boxes as magnets for price (Draw on Liquidity).
The Entry : Wait for price to retrace and tap the edge of the "open" FVG.
The Exit : Use opposing mitigated zones or swing points for targets.
Customizable Settings
Visuals : Custom color palettes for Bullish and Bearish imbalances.
Labels : Toggle "FVG" text on or off for a minimalist HUD experience.
Logic : Option to hide filled gaps completely for the ultimate zero-noise experience.
Global Compatibility
Tested and optimized for:
Forex : EURUSD, GBPUSD, AUDUSD.
Indices : US30, NAS100, DAX40.
Commodities : Gold (XAUUSD), Silver, Oil.
Crypto : BTCUSD, ETHUSD.
Authors Note
This script is written in Pine Script v6 . It is designed for traders who prioritize accuracy over "noisy" indicators. If you find value in this tool, please leave a Boost and follow for more SMC tool releases!
