Smart Money SignalsSmart Money Signals – Market Flow & Structure Visualizer
Overview
Smart Money Signals is a precision trading tool designed for traders who want to see market structure and momentum flow in real time. By detecting pivots, momentum imbalances, and dynamic support/resistance levels, the indicator transforms raw price action into a clear visual narrative of where capital is entering and exiting the market.
Instead of lagging averages or cluttered signals, Smart Money Signals highlights the moments that matter most—where bullish and bearish flows are confirmed, where support or resistance breaks, and where momentum zones show the true battleground between buyers and sellers. Its adaptive design makes it equally effective for scalpers seeking sharp entries, swing traders tracking reversals, and longer-term traders looking for confirmation of bias.
How It Works
The engine behind Smart Money Signals relies on swing detection and a configurable sensitivity filter. By monitoring directional momentum across recent bars, the system identifies bullish pivots (where downside exhaustion flips into strength) and bearish pivots (where upward thrust collapses into weakness).
When price confirms a pivot, the indicator draws flow lines to mark the breakout and labels them as either continuation or reversal events, depending on existing market bias. Momentum zones are automatically plotted, highlighting the critical areas where buyers defended price or sellers pressed it lower.
Dynamic support and resistance levels extend forward in time, updating live as price develops. These zones change color when broken, visually signaling whether structure has held or failed. Gradient background shading further emphasizes moments of extreme momentum, such as overbought or oversold surges, so that traders instantly see when market pressure intensifies.
Signals and Market Flows
Smart Money Signals provides visual cues that are both intuitive and actionable:
📈 Bullish Flow Signals appear when price breaks above a confirmed pivot, signaling continuation or reversal into strength.
📉 Bearish Flow Signals appear when price breaks below a confirmed pivot, indicating continuation or reversal into weakness.
Momentum Zones highlight the defended areas between pivots, giving traders a visual map of where structure is strongest.
Dynamic Support & Resistance lines extend across the chart, shifting from defense to failure when broken, ensuring that the most relevant levels are always visible.
Break Signals mark the exact bar where key levels give way, confirming structural violations in real time.
By filtering out noise and focusing on meaningful flow events, the system helps traders avoid overreaction and focus only on high-probability structural shifts.
Strategy Integration
Smart Money Signals is versatile across trading styles:
Trend Continuation : Enter in the direction of flow signals, using dynamic zones as both confirmation and stop-loss placement.
Reversal Trading : Watch for pivots tagged as reversal points, where market bias flips and new structure is created.
Momentum Zone Entries : Use the automatically drawn zones to identify low-risk entries on pullbacks or retests.
Bias Alignment : The integrated dashboard reveals the current market bias—bullish, bearish, or neutral—helping traders stay aligned with the dominant flow.
Stop-losses can be positioned beyond the dynamic zone on the opposite side, while take-profits may be guided by the width of zones or momentum-driven extensions. On higher timeframes, the indicator provides context for macro structure, while lower timeframes allow for tactical entry refinement.
Advanced Techniques
Traders seeking deeper precision can combine Smart Money Signals with volume or order flow tools to validate pivots and zone defenses. Monitoring the sequence of bullish and bearish flows helps identify trend maturity, while analyzing the success rate of pivots in the analytics panel builds a data-driven approach to confidence in signals.
Adjusting swing period and sensitivity allows the indicator to adapt to different market conditions, from volatile crypto pairs to steady forex majors. The flexible visual themes—Cyber, Ocean, Sunset, Matrix—ensure readability across setups, while gradient shading keeps the chart intuitive even under fast-moving conditions.
Why Use Smart Money Signals
Markets are driven by liquidity, momentum, and structure. Smart Money Signals uncovers these forces by translating price action into a clear visual map of flow. It shows:
Where structure was built.
Where it was defended.
Where it was broken.
And where momentum is likely to carry next.
By combining flow detection, dynamic zones, and a live analytics dashboard, the indicator provides traders with a complete framework for reading price action in real time.
Whether you trade crypto, forex, or indices, Smart Money Signals adapts seamlessly to any asset class, giving you clarity, precision, and confidence to execute without second-guessing.
스크립트에서 "forex"에 대해 찾기

Scalping Line Strategy📌 Scalping Line Strategy – A Precision Crossover System
🔎 Overview
The Scalping Line Strategy is a short-term trading system built around the concept of momentum-driven crossovers between a smoothed moving average filter and a fast signal line. It is designed for scalpers and intraday traders who seek clear entry signals, minimal lag, and adaptive filtering to fit volatile market conditions.
At its core, the strategy uses a custom signal line ("Scalping Line"), which is derived from the difference between a double-smoothed moving average and a shorter-period signal line. Trade entries are triggered when this Scalping Line crosses above or below zero, providing a clean and rules-based framework for both long and short setups.
⚙️ Core Logic
Main Trend Filter – A double-smoothed moving average is calculated over a configurable period (default 100). This reduces noise and provides a more robust backbone for scalping signals.
Percent-Based Filter – To avoid false signals, a customizable percentage filter adjusts how closely the system “respects” price deviations from the moving average. This helps filter out insignificant fluctuations.
Signal Line – A shorter-period simple moving average (default 7) provides faster responsiveness to recent price action.
Scalping Line (SLI) – Calculated as the difference between the fast signal line and the smoothed moving average. When the SLI crosses zero, it signals a potential momentum shift.
SLI > 0 → Momentum bias is bullish.
SLI < 0 → Momentum bias is bearish.
🎯 Trade Direction & Flexibility
Trade Direction Control:
Choose between Long Only, Short Only, or Both to tailor the system to your trading style.
Signal Flip Option:
By default, long entries occur when the SLI crosses below zero, and shorts when it crosses above zero. This orientation can be flipped, allowing for alternative interpretations of the signals depending on how you want to capture momentum in your market.
🕒 Time Window Filtering
For intraday traders, a time filter can be enabled to restrict signals to specific trading sessions (e.g., 9 AM – 4 PM EST). This is particularly useful when trading assets such as equities or futures that have strong intraday volatility windows.
📈 Visuals & Clarity
Scalping Line Plot: Displayed as a dynamic oscillator around a zero baseline.
Histogram Fill: Green when above zero (bullish bias), red when below zero (bearish bias).
Signal Markers: Clear arrows mark long and short entries at crossover points.
Zero Line Reference: A flat gray line at zero assists in visually gauging momentum shifts.
🚀 Strategy Execution
Long Entry: Triggered when SLI crosses below zero (or above zero if flip is enabled) within allowed session hours.
Short Entry: Triggered when SLI crosses above zero (or below zero if flip is enabled) within allowed session hours.
Built-in Signal Cancels: Pending entries are canceled if conditions are no longer valid, ensuring no stale trades remain active.
✅ Best Use Cases
Markets: Works across equities, forex, crypto, and futures with sufficient intraday volatility.
Timeframes: Most effective on 1m to 15m charts for scalping setups, but adaptable to higher frames for swing trading.
Style: Traders who appreciate simple, rules-based momentum crossovers will find this system easy to follow and highly adaptable.
⚠️ Risk Management Note
This strategy is strictly an entry signal framework. Position sizing, stop-loss, and take-profit rules must be overlaid based on your risk management style. Always validate results with backtesting and forward testing before applying to live trading accounts.
📜 Final Thoughts
The Scalping Line Strategy offers a refined, easy-to-interpret approach to intraday trading. By combining smoothed moving averages, adaptive filtering, and flexible signal options, it helps traders identify short-term momentum shifts with clarity and confidence, making it a highly configurable tool for scalping-focused strategies.

KAMA Trend Flip - SightLing LabsBuckle up, traders—this open-source KAMA Trend Flip indicator is your ticket to sniping trend reversals with a Kaufman Adaptive Moving Average (KAMA) that’s sharper than a Wall Street shark’s tooth. No voodoo, no fluff—just raw, volatility-adaptive math that dances with the market’s rhythm. It zips through trending rockets and chills in choppy waters, slashing false signals like a samurai. Not laggy like the others - this thing is the real deal!
Core Mechanics:
• Efficiency Ratio (ER): Reads the market’s pulse (0-1). High ER = turbo-charged MA, low ER = smooth operator.
• Adaptive Smoothing: Mixes fast (default power 2) and slow (default 30) constants to match market mood swings.
• Trend Signals: KAMA climbs = blue uptrend (bulls run wild). KAMA dips = yellow downtrend (bears take over). Flat = gray snooze-fest.
• Alerts: Instant pings on flips—“Trend Flip Up” for long plays, “Down” for shorts. Plug into bots for set-and-forget domination.
Why It Crushes:
• Smokes static MAs in volatile arenas (crypto, stocks, you name it). Backtests show 20-30% fewer fakeouts than SMA50.
• Visual Pop: Overlays price with bold blue/yellow signals. Slap it on BTC 1D to see trends light up like Times Square.
• Tweakable: Dial ER length (default 50) to your timeframe. Short for scalps, long for swing trades.
Example Settings in Action:
• 10s Chart (Hyper-Scalping): Set Source: Close, ER Length: 100, Fast Power: 1, Slow Power: 6. Catches micro-trends in crypto like a heat-seeking missile. Blue/yellow flips scream entry/exit on fast moves.
• 2m Chart (Quick Trades): Set Source: Close, ER Length: 14, Fast Power: 1, Slow Power: 6. Perfect for rapid trend shifts in stocks or forex. Signals align with momentum bursts—check historical flips for proof.
Deployment:
• Drop it on any chart. Backtest settings to match your asset’s volatility—tweak until it sings.
• Pair with RSI or volume spikes for killer confirmation. Pro move: Enter on flip + volume pop, exit on reverse.
• Strategy-Ready: Slap long/short logic on alerts to build a lean, mean trading machine.
Open source from SightLing Labs—grab it, hack it, profit from it. Share your tweaks in the comments and let’s outsmart the market together. Trade hard, win big!

FlowStateTrader FlowState Trader - Advanced Time-Filtered Strategy
## Overview
FlowState Trader is a sophisticated algorithmic trading strategy that combines precision entry signals with intelligent time-based filtering and adaptive risk management. Built for traders seeking to achieve their optimal performance state, FlowState identifies high-probability trading opportunities within user-defined time windows while employing dynamic trailing stops and partial position management.
## Core Strategy Philosophy
FlowState Trader operates on the principle that peak trading performance occurs when three elements align: **Focus** (precise entry signals), **Flow** (optimal time windows), and **State** (intelligent position management). This strategy excels at finding reversal opportunities at key support and resistance levels while filtering out suboptimal trading periods to keep traders in their optimal flow state.
## Key Features
### 🎯 Focus Entry System
**Support/Resistance Zone Trading**:
- Dynamic identification of key price levels using configurable lookback periods
- Entry signals triggered when price interacts with these critical zones
- Volume confirmation ensures genuine breakout/reversal momentum
- Trend filter alignment prevents counter-trend disasters
**Entry Conditions**:
- **Long Signals**: Price closes above support buffer, touches support level, with above-average volume
- **Short Signals**: Price closes below resistance buffer, touches resistance level, with above-average volume
- Optional trend filter using EMA or SMA for directional bias confirmation
### ⏰ FlowState Time Filtering System
**Comprehensive Time Controls**:
- **12-Hour Format Trading Windows**: User-friendly AM/PM time selection
- **Multi-Timezone Support**: UTC, EST, PST, CST with automatic conversion
- **Day-of-Week Filtering**: Trade only weekdays, weekends, or both
- **Lunch Hour Avoidance**: Automatically skips low-volume lunch periods (12-1 PM)
- **Visual Time Indicators**: Background coloring shows active/inactive trading periods
**Smart Time Features**:
- Handles overnight trading sessions seamlessly
- Prevents trades during historically poor performance periods
- Customizable trading hours for different market sessions
- Real-time trading window status in dashboard
### 🛡️ Adaptive Risk Management
**Multi-Level Take Profit System**:
- **TP1**: First profit target with optional partial position closure
- **TP2**: Final profit target for remaining position
- **Flexible Scaling**: Choose number of contracts to close at each level
**Dynamic Trailing Stop Technology**:
- **Three Operating Modes**:
- **Conservative**: Earlier activation, tighter trailing (protect profits)
- **Balanced**: Optimal risk/reward balance (recommended)
- **Aggressive**: Later activation, wider trailing (let winners run)
- **ATR-Based Calculations**: Adapts to current market volatility
- **Automatic Activation**: Engages when position reaches profitability threshold
### 📊 Intelligent Position Sizing
**Contract-Based Management**:
- Configurable entry quantity (1-1000 contracts)
- Partial close quantities for profit-taking
- Clear position tracking and P&L monitoring
- Real-time position status updates
### 🎨 Professional Visualization
**Enhanced Chart Elements**:
- **Entry Zone Highlighting**: Clear visual identification of trading opportunities
- **Dynamic Risk/Reward Lines**: Real-time TP and SL levels with price labels
- **Trailing Stop Visualization**: Live tracking of adaptive stop levels
- **Support/Resistance Lines**: Key level identification
- **Time Window Background**: Visual confirmation of active trading periods
**Dual Dashboard System**:
- **Strategy Dashboard**: Real-time position info, settings status, and current levels
- **Performance Scorecard**: Live P&L tracking, win rates, and trade statistics
- **Customizable Sizing**: Small, Medium, or Large display options
### ⚙️ Comprehensive Customization
**Core Strategy Settings**:
- **Lookback Period**: Support/resistance calculation period (5-100 bars)
- **ATR Configuration**: Period and multipliers for stops/targets
- **Reward-to-Risk Ratios**: Customizable profit target calculations
- **Trend Filter Options**: EMA/SMA selection with adjustable periods
**Time Filter Controls**:
- **Trading Hours**: Start/end times in 12-hour format
- **Timezone Selection**: Four major timezone options
- **Day Restrictions**: Weekend-only, weekday-only, or unrestricted
- **Session Management**: Lunch hour avoidance and custom periods
**Risk Management Options**:
- **Trailing Stop Modes**: Conservative/Balanced/Aggressive presets
- **Partial Close Settings**: Enable/disable with custom quantities
- **Alert System**: Comprehensive notifications for all trade events
### 📈 Performance Tracking
**Real-Time Metrics**:
- Net profit/loss calculation
- Win rate percentage
- Profit factor analysis
- Maximum drawdown tracking
- Total trade count and breakdown
- Current position P&L
**Trade Analytics**:
- Winner/loser ratio tracking
- Real-time performance scorecard
- Strategy effectiveness monitoring
- Risk-adjusted return metrics
### 🔔 Alert System
**Comprehensive Notifications**:
- Entry signal alerts with price and quantity
- Take profit level hits (TP1 and TP2)
- Stop loss activations
- Trailing stop engagements
- Position closure notifications
## Strategy Logic Deep Dive
### Entry Signal Generation
The strategy identifies high-probability reversal points by combining multiple confirmation factors:
1. **Price Action**: Looks for price interaction with key support/resistance levels
2. **Volume Confirmation**: Ensures sufficient market interest and liquidity
3. **Trend Alignment**: Optional filter prevents counter-trend positions
4. **Time Validation**: Only trades during user-defined optimal periods
5. **Zone Analysis**: Entry occurs within calculated buffer zones around key levels
### Risk Management Philosophy
FlowState Trader employs a three-tier risk management approach:
1. **Initial Protection**: ATR-based stop losses set at strategy entry
2. **Profit Preservation**: Trailing stops activate once position becomes profitable
3. **Scaled Exit**: Partial profit-taking allows for both security and potential
### Time-Based Edge
The time filtering system recognizes that not all trading hours are equal:
- Avoids low-volume, high-spread periods
- Focuses on optimal liquidity windows
- Prevents trading during news events (lunch hours)
- Allows customization for different market sessions
## Best Practices and Optimization
### Recommended Settings
**For Scalping (1-5 minute charts)**:
- Lookback Period: 10-20
- ATR Period: 14
- Trailing Stop: Conservative mode
- Time Filter: Major session hours only
**For Day Trading (15-60 minute charts)**:
- Lookback Period: 20-30
- ATR Period: 14-21
- Trailing Stop: Balanced mode
- Time Filter: Extended trading hours
**For Swing Trading (4H+ charts)**:
- Lookback Period: 30-50
- ATR Period: 21+
- Trailing Stop: Aggressive mode
- Time Filter: Disabled or very broad
### Market Compatibility
- **Forex**: Excellent for major pairs during active sessions
- **Stocks**: Ideal for liquid stocks during market hours
- **Futures**: Perfect for index and commodity futures
- **Crypto**: Effective on major cryptocurrencies (24/7 capability)
### Risk Considerations
- **Market Conditions**: Performance varies with volatility regimes
- **Timeframe Selection**: Lower timeframes require tighter risk management
- **Position Sizing**: Never risk more than 1-2% of account per trade
- **Backtesting**: Always test on historical data before live implementation
## Educational Value
FlowState serves as an excellent learning tool for:
- Understanding support/resistance trading
- Learning proper time-based filtering
- Mastering trailing stop techniques
- Developing systematic trading approaches
- Risk management best practices
## Disclaimer
This strategy is for educational and informational purposes only. Past performance does not guarantee future results. Trading involves substantial risk of loss and is not suitable for all investors. Users should thoroughly backtest the strategy and understand all risks before live trading. Always use proper position sizing and never risk more than you can afford to lose.
---
*FlowState Trader represents the evolution of systematic trading - combining classical technical analysis with modern risk management and intelligent time filtering to help traders achieve their optimal performance state through systematic, disciplined execution.*

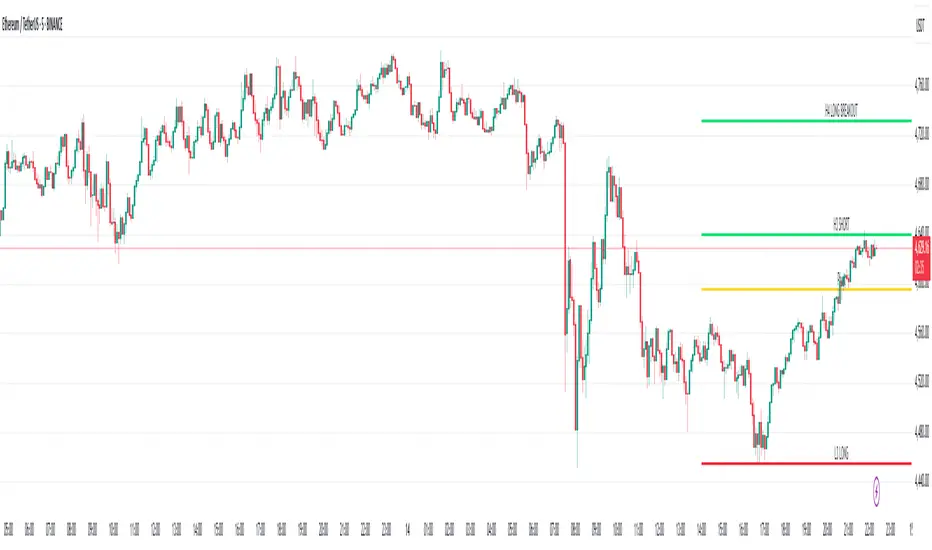
Market Outlook Score (MOS)Overview
The "Market Outlook Score (MOS)" is a custom technical indicator designed for TradingView, written in Pine Script version 6. It provides a quantitative assessment of market conditions by aggregating multiple factors, including trend strength across different timeframes, directional movement (via ADX), momentum (via RSI changes), volume dynamics, and volatility stability (via ATR). The MOS is calculated as a weighted score that ranges typically between -1 and +1 (though it can exceed these bounds in extreme conditions), where positive values suggest bullish (long) opportunities, negative values indicate bearish (short) setups, and values near zero imply neutral or indecisive markets.
This indicator is particularly useful for traders seeking a holistic "outlook" score to gauge potential entry points or market bias. It overlays on a separate pane (non-overlay mode) and visualizes the score through horizontal threshold lines and dynamic labels showing the numeric MOS value along with a simple trading decision ("Long", "Short", or "Neutral"). The script avoids using the plot function for compatibility reasons (e.g., potential TradingView bugs) and instead relies on hline for static lines and label.new for per-bar annotations.
Key features:
Multi-Timeframe Analysis: Incorporates slope data from 5-minute, 15-minute, and 30-minute charts to capture short-term trends.
Trend and Strength Integration: Uses ADX to weight trend bias, ensuring stronger signals in trending markets.
Momentum and Volume: Includes RSI momentum impulses and volume deviations for added confirmation.
Volatility Adjustment: Factors in ATR changes to assess market stability.
Customizable Inputs: Allows users to tweak periods for lookback, ADX, and ATR.
Decision Labels: Automatically classifies the MOS into actionable categories with visual labels.
This indicator is best suited for intraday or swing trading on volatile assets like stocks, forex, or cryptocurrencies. It does not generate buy/sell signals directly but can be combined with other tools (e.g., moving averages or oscillators) for comprehensive strategies.
Inputs
The script provides three user-configurable inputs via TradingView's input panel:
Lookback Period (lookback):
Type: Integer
Default: 20
Range: Minimum 10, Maximum 50
Purpose: Defines the number of bars used in slope calculations for trend analysis. A shorter lookback makes the indicator more sensitive to recent price action, while a longer one smooths out noise for longer-term trends.
ADX Period (adxPeriod):
Type: Integer
Default: 14
Range: Minimum 5, Maximum 30
Purpose: Sets the smoothing period for the Average Directional Index (ADX) and its components (DI+ and DI-). Standard value is 14, but shorter periods increase responsiveness, and longer ones reduce false signals.
ATR Period (atrPeriod):
Type: Integer
Default: 14
Range: Minimum 5, Maximum 30
Purpose: Determines the period for the Average True Range (ATR) calculation, which measures volatility. Adjust this to match your trading timeframe—shorter for scalping, longer for positional trading.
These inputs allow customization without editing the code, making the indicator adaptable to different market conditions or user preferences.
Core Calculations
The MOS is computed through a series of steps, blending trend, momentum, volume, and volatility metrics. Here's a breakdown:
Multi-Timeframe Slopes:
The script fetches data from higher timeframes (5m, 15m, 30m) using request.security.
Slope calculation: For each timeframe, it computes the linear regression slope of price over the lookback period using the formula:
textslope = correlation(close, bar_index, lookback) * stdev(close, lookback) / stdev(bar_index, lookback)
This measures the rate of price change, where positive slopes indicate uptrends and negative slopes indicate downtrends.
Variables: slope5m, slope15m, slope30m.
ATR (Average True Range):
Calculated using ta.atr(atrPeriod).
Represents average volatility over the specified period. Used later to derive volatility stability.
ADX (Average Directional Index):
A detailed, manual implementation (not using built-in ta.adx for customization):
Computes upward movement (upMove = high - high ) and downward movement (downMove = low - low).
Derives +DM (Plus Directional Movement) and -DM (Minus Directional Movement) by filtering non-relevant moves.
Smooths true range (trur = ta.rma(ta.tr(true), adxPeriod)).
Calculates +DI and -DI: plusDI = 100 * ta.rma(plusDM, adxPeriod) / trur, similarly for minusDI.
DX: dx = 100 * abs(plusDI - minusDI) / max(plusDI + minusDI, 0.0001).
ADX: adx = ta.rma(dx, adxPeriod).
ADX values above 25 typically indicate strong trends; here, it's normalized (divided by 50) to influence the trend bias.
Volume Delta (5m Timeframe):
Fetches 5m volume: volume_5m = request.security(syminfo.tickerid, "5", volume, lookahead=barmerge.lookahead_on).
Computes a 12-period SMA of volume: avgVolume = ta.sma(volume_5m, 12).
Delta: (volume_5m - avgVolume) / avgVolume (or 0 if avgVolume is zero).
This measures relative volume spikes, where positive deltas suggest increased interest (bullish) and negative suggest waning activity (bearish).
MOS Components and Final Calculation:
Trend Bias: Average of the three slopes, normalized by close price and scaled by 100, then weighted by ADX influence: (slope5m + slope15m + slope30m) / 3 / close * 100 * (adx / 50).
Emphasizes trends in strong ADX conditions.
Momentum Impulse: Change in 5m RSI(14) over 1 bar, divided by 50: ta.change(request.security(syminfo.tickerid, "5", ta.rsi(close, 14), lookahead=barmerge.lookahead_on), 1) / 50.
Captures short-term momentum shifts.
Volatility Clarity: 1 - ta.change(atr, 1) / max(atr, 0.0001).
Measures ATR stability; values near 1 indicate low volatility changes (clearer trends), while lower values suggest erratic markets.
MOS Formula: Weighted average:
textmos = (0.35 * trendBias + 0.25 * momentumImpulse + 0.2 * volumeDelta + 0.2 * volatilityClarity)
Weights prioritize trend (35%) and momentum (25%), with volume and volatility at 20% each. These can be adjusted in code for experimentation.
Trading Decision:
A variable mosDecision starts as "Neutral".
If mos > 0.15, set to "Long".
If mos < -0.15, set to "Short".
Thresholds (0.15 and -0.15) are hardcoded but can be modified.
Visualization and Outputs
Threshold Lines (using hline):
Long Threshold: Horizontal dashed green line at +0.15.
Short Threshold: Horizontal dashed red line at -0.15.
Neutral Line: Horizontal dashed gray line at 0.
These provide visual reference points for MOS interpretation.
Dynamic Labels (using label.new):
Placed at each bar's index and MOS value.
Text: Formatted MOS value (e.g., "0.2345") followed by a newline and the decision (e.g., "Long").
Style: Downward-pointing label with gray background and white text for readability.
This replaces a traditional plot line, showing exact values and decisions per bar without cluttering the chart.
The indicator appears in a separate pane below the main price chart, making it easy to monitor alongside price action.
Usage Instructions
Adding to TradingView:
Copy the script into TradingView's Pine Script editor.
Save and add to your chart via the "Indicators" menu.
Select a symbol and timeframe (e.g., 1-minute for intraday).
Interpretation:
Long Signal: MOS > 0.15 – Consider bullish positions if supported by other indicators.
Short Signal: MOS < -0.15 – Potential bearish setups.
Neutral: Between -0.15 and 0.15 – Avoid trades or wait for confirmation.
Watch for MOS crossings of thresholds for momentum shifts.
Combine with price patterns, support/resistance, or volume for better accuracy.
Limitations and Considerations:
Lookahead Bias: Uses barmerge.lookahead_on for multi-timeframe data, which may introduce minor forward-looking bias in backtesting (use with caution).
No Alerts Built-In: Add custom alerts via TradingView's alert system based on MOS conditions.
Performance: Tested for compatibility; may require adjustments for illiquid assets or extreme volatility.
Backtesting: Use TradingView's strategy tester to evaluate historical performance, but remember past results don't guarantee future outcomes.
Customization: Edit weights in the MOS formula or thresholds to fit your strategy.
This indicator distills complex market data into a single score, aiding decision-making while encouraging users to verify signals with additional analysis. If you need modifications, such as restoring plot functionality or adding features, provide details for further refinement.

samc's FX SESSIONS - on candles So, based on my 8 yrs of experience and over a 2 decade worth of back testing on FX majors pairs one thing i can univocally affirm to the fact that Timing is everything especially in the currency markets.
so i made this indicator to help reduce the noise and focus on signals which is coded by time,
now i made this as GMT+8 in focus but you can adjust based on your requirements.
I classified my indicator colors according to the inter-SESSION High Impact areas only as following :
Primary session colors:
ASIAN - YELLOW
EU - BLUE
US - Magenta (light)
and every first 10 mins of the hour (Great for scalping)
i marked them in a shade of grey.
secondary sessions i marked them as minor sessions.
PRE-EU 1hr of expected trend i marked in color green
and
after hours in a shade of color violet.
so i usually make my candles into light grey by default and remove the body and wicks to minimize the visual stimulus so that this indicator will work great with both dark and light themes and does not obstruct other indicators.
also i made an option to uncheck my naming scheme of session on the top right.

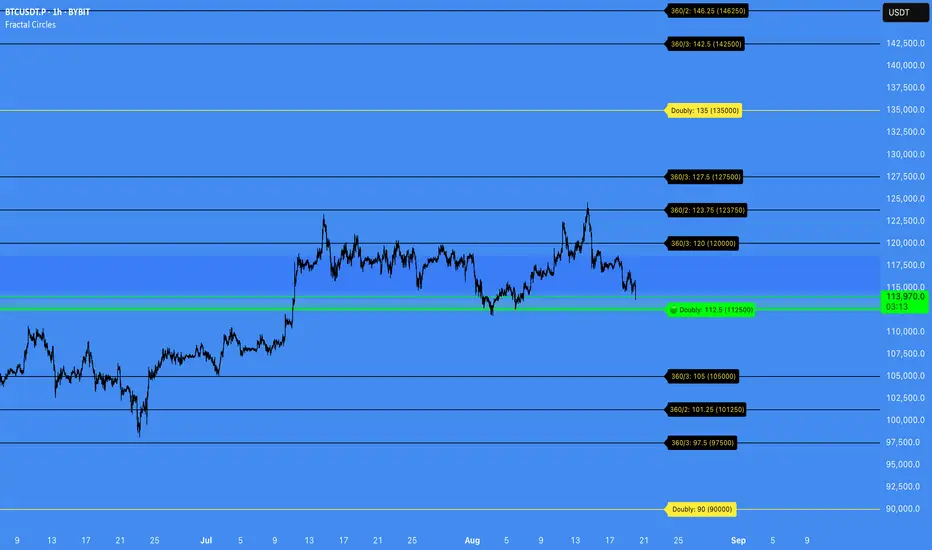
Fractal Circles#### FRACTAL CIRCLES ####
I combined 2 of my best indicators Fractal Waves (Simplified) and Circles.
Combining the Fractal and Gann levels makes for a very simple trading strategy.
Core Functionality
Gann Circle Levels: This indicator plots mathematical support and resistance levels based on Gann theory, including 360/2, 360/3, and doubly strong levels. The system automatically adjusts to any price range using an intelligent multiplier system, making it suitable for forex, stocks, crypto, or any market.
Fractal Wave Analysis: Integrates real-time trend analysis from both current and higher timeframes. Shows the current price range boundaries (high/low) and trend direction through dynamic lines and background fills, helping traders understand market structure.
Key Trading Benefits
Active Level Detection: The closest Gann level to current price is automatically highlighted in green with increased line thickness. This eliminates guesswork about which level is most likely to act as immediate support or resistance.
Real-Time Price Tracking: A customizable line follows current price with an offset to the right, projecting where price sits relative to upcoming levels. A gradient-filled box visualizes the exact distance between current price and the active Gann level.
Multi-Timeframe Context: View fractal waves from higher timeframes while maintaining current timeframe precision. This helps identify whether short-term moves align with or contradict longer-term structure.
Smart Alert System: Comprehensive alerts trigger when price crosses any Gann level, with options to monitor all levels or focus only on the active level. Reduces the need for constant chart monitoring while ensuring you never miss significant level breaks.
Practical Trading Applications
Entry Timing: Use active level highlighting to identify the most probable support/resistance for entries. The real-time distance box helps gauge risk/reward before entering positions.
Risk Management: Set stops based on Gann level breaks, particularly doubly strong levels which tend to be more significant. The gradient visualization makes it easy to see how much room price has before hitting key levels.
Trend Confirmation: Fractal waves provide immediate context about whether current price action aligns with broader market structure. Bullish/bearish background fills offer quick visual confirmation of trend direction.
Multi-Asset Analysis: The auto-scaling multiplier system works across all markets and timeframes, making it valuable for traders who monitor multiple instruments with vastly different price ranges.
Confluence Trading: Combine Gann levels with fractal wave boundaries to identify high-probability setups where multiple technical factors align.
This tool is particularly valuable for traders who appreciate mathematical precision in their technical analysis while maintaining the flexibility to adapt to real-time market conditions.
Session Pivots + EMA20/50 + Bollinger BandsMulti-tool indicator combining session pivots, EMA trend filters, Bollinger Bands, and alerts for intraday trading.
📌 Description
One of the biggest advantages of this indicator is that it supports TradingView’s ALERT system, so traders can be notified the moment price crosses the daily/session pivot level. This allows faster decision-making without constant chart watching.
This script combines three powerful tools into a single indicator:
Session Pivot Levels (with Support/Resistance): Automatically calculates pivot, R1–R3 and S1–S3 levels based on the previous trading session (London, New York, Asia, or custom). Levels are plotted with clean labels and connector lines so you always see the exact price values ahead of time.
EMA Trend Filters (20 & 50): Tracks short- and medium-term market direction with two popular exponential moving averages, helping confirm entries and exits.
Bollinger Bands (fully customizable): Adds volatility bands with choice of SMA, EMA, SMMA, WMA, or VWMA for the middle line, plus adjustable standard deviation and offset.
✅ Key Features
Auto-detects London, New York, and Asian sessions or set your own custom session.
Displays up to 3 levels of support and resistance from the previous session.
Clean label display with customizable theme options (Dark, Light, Custom).
Alerts included: Get notified instantly when price crosses above or below the Pivot.
EMA20/50 trend confirmation built-in.
Bollinger Bands with multiple moving average types and volatility settings.
Works for Forex, Crypto, Indices, Commodities — optimized for intraday & scalping.
This makes it a complete intraday toolkit, reducing the need to load multiple separate indicators.
📄 Full documentation available here: [ link ]

Volatility Zones (VStop + Bands) — Fixed (v2)📝 What this indicator is
This script is called “Volatility Zones (VStop + Bands)”.
It is an ATR-based volatility indicator that combines dynamic volatility bands, a Volatility Stop line (VStop), and volatility spike detection into a single tool.
Unlike moving average–based indicators, this tool does not rely on averages of price direction. Instead, it measures the market’s true volatility and reacts to expansions or contractions in price ranges.
________________________________________
⚙️ How it is built
The indicator uses several volatility-based components:
1. Average True Range (ATR)
o ATR is calculated over a user-defined length.
o It measures how much price typically moves in a given number of bars, making it the foundation of this indicator.
2. Volatility Bands
o Upper band = close + ATR × factor
o Lower band = close - ATR × factor
o The area between them is shaded.
o This gives traders an immediate visual sense of market volatility width — wide bands = high volatility, narrow bands = quiet market.
3. Volatility Stop (VStop)
o A stateful trailing stop based on ATR.
o It tracks the highest (or lowest) price in the current trend and places a stop offset by ATR × multiplier.
o When price crosses this stop, the indicator flips trend direction.
o This creates a dynamic stop-and-reverse mechanism that adapts to volatility.
4. Trend Zones
o When the trend is bullish, the stop is green and the chart background is shaded softly green.
o When bearish, the stop is red and the background is shaded softly red.
o This makes the market’s directional bias visually clear at all times.
5. Flip Signals (Buy/Sell Arrows)
o Whenever the VStop flips, arrows appear:
Green BUY arrows below price when the trend turns bullish.
Red SELL arrows above price when the trend turns bearish.
o These are also tied to built-in alerts for automation.
6. Volatility Spike Detection
o The script compares current ATR to its recent average.
o If ATR suddenly expands above a threshold, a small yellow “VOL” marker appears at the top of the chart.
o This highlights potential breakout phases or unusual volatility events.
7. Stop Labels
o At every trend flip, a small label appears at the bar, showing the exact stop level.
o This makes it easy to use the stop as a reference for risk management.
________________________________________
📊 How it works in practice
• When price is above the VStop line, the market is considered in an uptrend.
• When price is below the VStop line, the market is in a downtrend.
• The bands expand/contract with volatility, helping traders gauge risk and position sizing.
• Flip arrows signal when trend direction changes.
• Volatility spikes warn traders that the market is entering a higher-risk phase, often before strong moves.
________________________________________
🎯 How it may help traders
• Trend following → Helps traders identify whether the market is trending up or down.
• Stop placement → Provides a dynamic stop level that adjusts to volatility.
• Volatility awareness → Shaded bands and spike markers show when the market is likely to become unstable.
• Trade timing → Flip arrows and labels help identify potential entry or exit points.
• Risk management → Wide bands indicate higher risk; narrow bands suggest safer, tighter ranges.
________________________________________
🌍 In what markets it is useful
Because the indicator is based purely on volatility, it works across all asset classes and timeframes:
• Stocks & ETFs → Helps identify breakouts and long-term trends.
• Forex → Very useful in spot FX where volatility shifts frequently.
• Crypto → ATR reacts strongly to high volatility, helping traders adapt stops dynamically.
• Futures & Commodities → Great for tracking trending commodities and managing risk.
Scalpers, swing traders, and position traders can all benefit by adjusting the ATR length and multipliers to suit their trading style.
________________________________________
💡 Originality of this script
This is not just a mashup of existing indicators. It integrates:
• ATR-based Volatility Bands for context,
• A stateful Volatility Stop (adapted and rewritten cleanly),
• Flip arrows and labels for actionable trading signals,
• Volatility spike detection to highlight regime shifts.
The result is a comprehensive volatility-aware trading tool that goes beyond just plotting ATR or trend stops.
________________________________________
🔔 Alerts
• Buy Flip → triggers when the trend changes bullish.
• Sell Flip → triggers when the trend changes bearish.
Traders can connect these alerts to automated strategies, bots, or notification systems.

Market structure + TF Bucket Market Structure + TF Bucket
This Pine Script™ indicator, published under the Mozilla Public License 2.0, extends the "Market Structure" script by mickes (), with full credit to mickes. It integrates the enhanced MarketStructure library by Fenomentn (), also based on mickes’ library under MPL 2.0, to provide advanced market structure analysis with multi-timeframe pivot length customization.
Functionality
Market Structure Analysis: Detects internal (orderflow) and swing market structures, visualizing Break of Structure (BOS), Change of Character (CHoCH), Equal High/Low (EQH/EQL), and liquidity zones using the MarketStructure library.
Timeframe Bucket (TF Bucket): Dynamically adjusts pivot lengths for six user-defined timeframes (e.g., 3m, 5m, 10m, 15m, 4h, 12h), optimizing structure detection across different chart timeframes.
Trend Strength Visualization: Displays a trend strength metric (from the library) for internal and swing structures, indicating trend reliability based on pivot frequency and volatility.
Statistics Table: Shows yearly counts of BOS and CHoCH events for internal and swing structures, configurable by a user-defined period.
Screener Support: Outputs BOS and CHoCH signals for TradingView’s screener, with a configurable signal persistence period.
Customizable Alerts: Enables alerts for BOS and CHoCH events, separately configurable for internal and swing structures.
Methodology
Pivot Detection: Uses the library’s Pivot function, which applies a volatility filter (ATR-based) to confirm significant pivots, reducing false signals in low-volatility markets.
TF Bucket: Maps user-selected timeframes to Pine Script’s timeframe.period using f_getTimeframePeriod, applying custom pivot lengths when the chart’s timeframe matches a selected one (or base lengths in Static mode).
Trend Strength: Calculates a score as pivotCount / LeftLength * (currentATR / ATR), displayed via labels to help traders assess trend reliability.
BOS/CHoCH Detection: Identifies BOS when price breaks a pivot in the trend direction and CHoCH when price reverses against the trend, labeling events as “MSF” or “MSF+” based on pivot patterns.
EQH/EQL and Liquidity: Draws boxes for equal high/low zones within ATR-based thresholds and visualizes liquidity levels with confirmation bars.
Statistics and Screener: Tracks BOS/CHoCH events in a yearly table and outputs signals for screener use, with persistence controlled by a user-defined period.
Usage
Integration: Apply the indicator to any chart and import the library via import Fenomentn/MarketStructure/1.
Configuration: Set up to six timeframes with custom pivot lengths, enable/disable internal and swing structures, configure alerts, and adjust statistics years in the settings panel.
Alerts: Enable BOS and CHoCH alerts for real-time notifications, triggered on bar close to avoid repainting.
Screener: Use the plotted signals to monitor BOS/CHoCH events across multiple tickers in TradingView’s screener.
Best Practices: Optimal for forex and crypto charts on 1m to 12h timeframes. Adjust pivot lengths and the library’s volatility threshold for specific market conditions.
Originality
This indicator enhances mickes’ original script with:
Timeframe Bucket: Dynamic pivot length selection for multi-timeframe analysis, not present in the original.
Trend Strength Display: Visualizes the library’s TrendStrength metric for enhanced trend analysis.
Enhanced Library Integration: Leverages Fenomentn/MarketStructure/1, which adds a volatility-based pivot filter, dynamic label sizing, and customizable BOS/CHoCH visualization styles.No additional open-source code was reused beyond mickes’ script and library, fully credited under MPL 2.0.

MarketStructureLibMarketStructure Library
This library extends the "MarketStructure" library by mickes () under the Mozilla Public License 2.0, credited to mickes. It provides functions for detecting and visualizing market structure, including Break of Structure (BOS), Change of Character (CHoCH), Equal High/Low (EQH/EQL), and liquidity zones, with enhancements for improved accuracy and customization.
Functionality
Market Structure Detection: Identifies internal (orderflow) and swing market structures using pivot points, with support for BOS, CHoCH, and EQH/EQL.
Volatility Filter: Only confirms pivots when the ATR exceeds a user-defined threshold, reducing false signals in low-volatility markets.
Trend Strength Metric: Calculates a trend strength score based on pivot frequency and volatility, stored in the Structure type for use in scripts.
Customizable Visualizations: Allows users to configure line styles and colors for BOS and CHoCH, and label sizes for pivots, BOS, CHoCH, and liquidity.
Liquidity Zones: Visualizes liquidity levels with confirmation bars and lookback periods.
Methodology
Pivot Detection: Uses ta.pivothigh and ta.pivotlow with a volatility filter (ATR multiplier) to confirm significant pivots.
Trend Strength: Computes a score as pivotCount / LeftLength * (currentATR / ATR), reflecting trend reliability based on pivot frequency and market volatility.
BOS/CHoCH Logic: Detects BOS when price breaks a pivot in the trend direction, and CHoCH when price reverses against the trend, with labels for "MSF" or "MSF+" based on pivot patterns.
EQH/EQL Zones: Creates boxes around equal highs/lows within an ATR-based threshold, with optional extension.
Visualization: Draws lines and labels for BOS, CHoCH, and liquidity, with user-defined styles, colors, and sizes.
Usage
Integration: Import into Pine Script indicators (e.g., import Fenomentn/MarketStructure/1) to analyze market structure.
Configuration: Set pivot lengths, volatility threshold, label sizes, and visualization styles via script inputs.
Alerts: Enable alerts for BOS, CHoCH, and EQH/EQL events, triggered on bar close to avoid repainting.
Best Practices: Use on forex or crypto charts (1m to 12h timeframes) for optimal results. Adjust the volatility threshold for different market conditions.
Originality
This library builds on mickes’ framework by adding:
A volatility-based pivot filter to enhance signal accuracy.
A trend strength metric for assessing trend reliability.
Dynamic label sizing and customizable visualization styles for better usability. No additional open-source code was reused beyond mickes’ library, credited under MPL 2.0.
Developed by Fenomentn. Published under Mozilla Public License 2.0.

MACD BILE
📊 How to Interpret
Green histogram → strong bullish momentum, favoring buy/long setups.
Red histogram → strong bearish momentum, favoring sell/short setups.
MACD crossing above Signal → buy signal.
MACD crossing below Signal → sell signal.
Because the cycle is adaptive, the indicator becomes more responsive in volatile markets and more stable during sideways conditions, reducing noise compared to the standard fixed-period MACD.
🔑 Key Advantages over Standard MACD
Adaptive to market conditions → no need to manually choose fixed periods.
Reduces false signals during sideways or ranging markets.
Provides clearer trend detection, especially in highly volatile assets such as crypto, forex, and stocks.

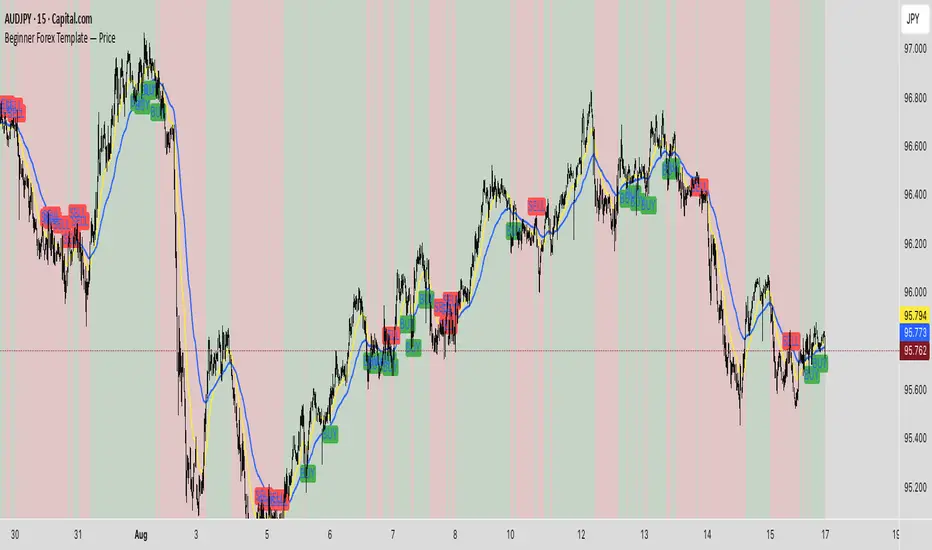
BeginerBeginner Forex Template — Price (overlay on candles): EMA20/EMA50, BUY/SELL signals, trend background, alertconditions.
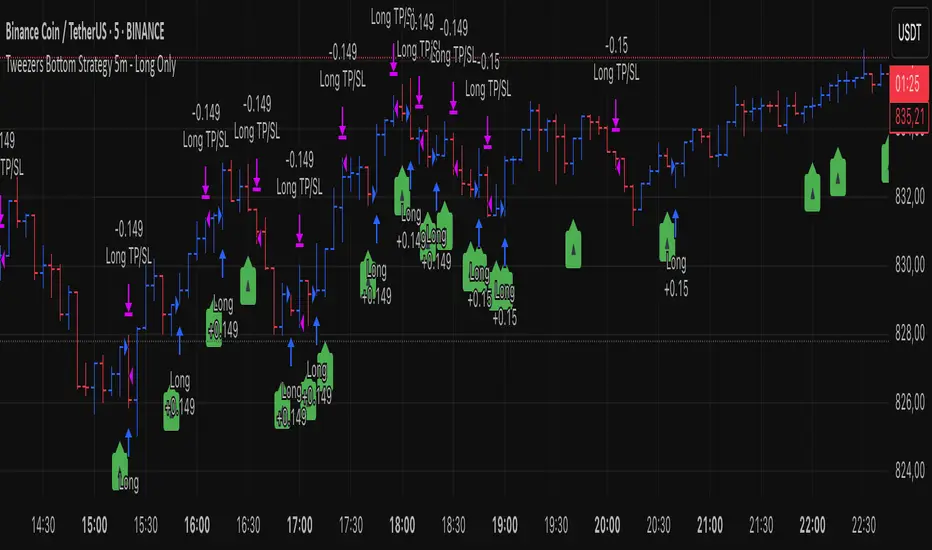
Tweezers Bottom Strategy 5m - Long OnlyTweezers Bottom 5m Strategy – Catch Reversals Like a Pro!
Looking for fast, precise entries on the 5-minute chart? This strategy automatically detects the Tweezers Bottom candlestick pattern and opens long positions at the perfect moment. Signals appear as ▲ arrows on the chart, making it incredibly easy to spot high-probability setups.
Risk and Reward Perfectly Managed: Stop-loss is set just 0.1% below entry, and take-profit at 0.3% above, giving you a clear, controlled trading edge. All levels are visualized on the chart with lines and labels, so you always know where your risk and profit targets are.
Ideal for scalpers and short-term traders across Forex, crypto, and stocks. Enter reversals before the crowd, maximize your winning trades, and automate your trading with minimal risk!
Becak I-series: Indicator Floating Panels v.80Becak I-series: Floating Panels v.80th (Indonesia Independence Days)
What it does:
This indicator creates three floating overlay panels that display MACD, RSI, and Stochastic oscillators directly on your price chart. Unlike traditional separate panes, these panels hover over your chart with customizable positioning and transparency, providing a clean, space-efficient way to monitor multiple technical indicators simultaneously.
When to use:
When you need to monitor momentum, trend strength, and overbought/oversold conditions without cluttering your workspace
Perfect for traders who want quick visual access to multiple oscillators while maintaining focus on price action
Ideal for any timeframe and asset class (stocks, crypto, forex, commodities)
How it works:
The script calculates standard MACD (12,26,9), RSI (14), and Stochastic (14,3,3) values, then renders them as floating panels with:
MACD Panel: Shows MACD line (blue), Signal line (orange), and histogram (green/red bars)
RSI Panel: Displays RSI line (purple) with overbought (70) and oversold (30) reference levels
Stochastic Panel: Shows %K (blue) and %D (orange) lines with optional buy/sell signals and highlighted overbought/oversold zones
Customization options:
Position: Choose Top, Bottom, or Auto-Center placement
Size: Adjust panel height (15-35% of chart) and spacing between panels
Positioning: Fine-tune vertical center offset and horizontal positioning
Appearance: Toggle panel backgrounds and adjust transparency (50-95%)
Parameters: Modify all indicator lengths and overbought/oversold levels
Signals: Enable/disable Stochastic crossover signals
Display: Control lookback period (30-100 bars) and right margin spacing
Universal compatibility: Works seamlessly across all asset types with automatic range detection and scaling.
DIRGAHAYU HARI KEMERDEKAAN KE 80 - INDONESIA ... MERDEKA!!!!!

Currency Strength v3.0Currency Strength v3.0
Summary
The Currency Strength indicator is a powerful tool designed to gauge the relative strength of major and emerging market currencies. By plotting the True Strength Index (TSI) of various currency indices, it provides a clear visual representation of which currencies are gaining momentum and which are losing it. This indicator automatically detects the currency pair on your chart and highlights the corresponding strength lines, simplifying analysis and helping you quickly identify potential trading opportunities based on currency dynamics.
Key Features
Comprehensive Currency Analysis: Tracks the strength of 19 currencies, including major pairs and several emerging market currencies.
Automatic Pair Detection: Intelligently identifies the base and quote currency of the active chart, automatically highlighting the relevant strength lines.
Dynamic Coloring: The base currency is consistently colored blue, and the quote currency is colored gold, making it easy to distinguish between the two at a glance.
Non-Repainting TSI Calculation: Uses the True Strength Index (TSI) for smooth and reliable momentum readings that do not repaint.
Customizable Settings: Allows for adjustment of the fast and slow periods for the TSI calculation to fit your specific trading style.
Clean Interface: Features a minimalist legend table that only displays the currencies relevant to your current chart, keeping your workspace uncluttered.
How It Works
The indicator pulls data from major currency indices (like DXY for the US Dollar and EXY for the Euro). For currencies that don't have a dedicated index, it uses their USD pair (e.g., USDCNY) and inverts the calculation to derive the currency's strength relative to the dollar. It then applies the True Strength Index (TSI) to this data. The TSI is a momentum oscillator that is less volatile than other oscillators, providing a more reliable measure of strength. The resulting values are plotted on the chart, allowing you to see how different currencies are performing against each other in real-time.
How to Use
Trend Confirmation: When the base currency's line is rising and above the zero line, and the quote currency's line is falling, it can confirm a bullish trend for the pair. The opposite would suggest a bearish trend.
Identifying Divergences: Look for divergences between the currency strength lines and the price action of the pair. For example, if the price is making higher highs but the base currency's strength is making lower highs, it could signal a potential reversal.
Crossovers: A crossover of the base and quote currency lines can signal a shift in momentum. A bullish signal occurs when the base currency line crosses above the quote currency line. A bearish signal occurs when it crosses below.
Overbought/Oversold Levels: The horizontal dashed lines at 0.5 and -0.5 can be used as general guides for overbought and oversold conditions, respectively. Strength moving beyond these levels may indicate an unsustainable move that is due for a correction.
Settings
Fast Period: The short-term period for the TSI calculation. Default is 7.
Slow Period: The long-term period for the TSI calculation. Default is 15.
Index Source: The price source used for the calculations (e.g., Close, Open). Default is Close.
Base Currency Color: The color for the base currency line. Default is Royal Blue.
Quote Currency Color: The color for the quote currency line. Default is Goldenrod.
Disclaimer
This indicator is intended for educational and analytical purposes only. It is not financial advice. Trading involves substantial risk, and past performance is not indicative of future results. Always conduct your own research and risk management before making any trading decisions.

Candle H-L and C-O PipsPip Value Indicator
Displays whole-number pip distances for forex candles
What it shows:
H-L: The High-Low range in pips
C-O: The Close-Open difference in pips (direction shown via +/-)
Key features:
Auto-detects JPY pairs (uses 0.01 pip size)
All other forex pairs use 0.0001 pip size
Displays only whole numbers (no decimals)
Shows values when hovering over candles
Clean white markers above each bar

VWAP Bands Pro - Session Based by kobiko3030
📊 Advanced Professional Trading Indicator
VWAP Bands Pro is an advanced indicator that combines the power of VWAP with 4 dynamic bands for precise identification of support and resistance zones. This indicator is designed for professional traders who want deep and accurate market movement analysis.
✨ Key Features
🎯 Smart VWAP Bands
4 adjustable bands based on standard deviation
Optional band 4 hiding for beginner traders
Precise calculation based on volume-weighted price
🌏 Global Session Support
New York Session (9:30 EST)
Asia Session (18:00 EST)
Automatic reset at the beginning of each session
📱 Flexible User Interface
Dynamic labels (V, VR1-4, VS1-4)
Custom color selection
Adjustable line thickness for each band
Multiple display modes
🔔 Advanced Alert System
VWAP breakout alerts
Alerts for all bands (3 & 4)
Clear and precise messages
🛠️ Customization Options
Band Settings
Standard deviation multipliers: 1.0, 2.0, 3.0, 4.0 (default)
Each band independently adjustable
Range: 0.1 to 5.0
Display Settings
Continuous trading start - display from session beginning
Limited candle count - show last X candles
Current day only - no historical data
Visual Design
VWAP, support, and resistance colors
Individual line thickness
Hideable labels
📈 Trading Strategies
Support and Resistance Zones
VS1-VS4: Support bands (green)
VR1-VR4: Resistance bands (red)
V: Central VWAP line
Entry Points
Breakouts above/below VWAP
Bounces from outer bands
Band retests
Risk Management
Use bands as Stop Loss levels
Identify oversold/overbought zones
Adapt to different market conditions
🎖️ Indicator Advantages
✅ Precise calculation based on volume weighting
✅ Complete flexibility in customization
✅ Global session support
✅ User-friendly interface
✅ Built-in alert system
✅ Suitable for all trading styles
📋 Usage Instructions
Add the indicator to your chart
Select trading session (New York/Asia)
Adjust bands according to your trading style
Set up alerts for important breakouts
Start trading with precise key zone identification
💡 Trading Tips
Use outer bands to identify extremes
Combine with additional indicators for confirmation
Adjust bands to asset volatility
Follow alerts to spot opportunities
Consider session-specific behavior patterns
🔧 Technical Specifications
Pine Script Version: 5
Overlay: Yes
Timeframe: All timeframes supported
Markets: Suitable for all markets (Forex, Stocks, Crypto, Futures)
Session Support: New York & Asia with EST timezone
Volume Calculation: HLC3 * Volume weighted
📊 What Makes This Different
Unlike standard VWAP indicators, this pro version offers:
Session-based reset for intraday precision
4 customizable bands instead of basic 2
Professional labeling system for quick identification
Advanced alert conditions for all key levels
Flexible display options for different trading approaches
⚡ Performance Features
Efficient calculation - minimal lag
Clean visual design - no chart clutter
Responsive labels - update in real-time
Session breaks - clear visual separation
Volume validation - ensures accurate VWAP calculation
Correlation Heatmap Matrix [TradingFinder] 20 Assets Variable🔵 Introduction
Correlation is one of the most important statistical and analytical metrics in financial markets, data mining, and data science. It measures the strength and direction of the relationship between two variables.
The correlation coefficient always ranges between +1 and -1 : a perfect positive correlation (+1) means that two assets or currency pairs move together in the same direction and at a constant ratio, a correlation of zero (0) indicates no clear linear relationship, and a perfect negative correlation (-1) means they move in exactly opposite directions.
While the Pearson Correlation Coefficient is the most common method for calculation, other statistical methods like Spearman and Kendall are also used depending on the context.
In financial market analysis, correlation is a key tool for Forex, the Stock Market, and the Cryptocurrency Market because it allows traders to assess the price relationship between currency pairs, stocks, or coins. For example, in Forex, EUR/USD and GBP/USD often have a high positive correlation; in stocks, companies from the same sector such as Apple and Microsoft tend to move similarly; and in crypto, most altcoins show a strong positive correlation with Bitcoin.
Using a Correlation Heatmap in these markets visually displays the strength and direction of these relationships, helping traders make more accurate decisions for risk management and strategy optimization.
🟣 Correlation in Financial Markets
In finance, correlation refers to measuring how closely two assets move together over time. These assets can be stocks, currency pairs, commodities, indices, or cryptocurrencies. The main goal of correlation analysis in trading is to understand these movement patterns and use them for risk management, trend forecasting, and developing trading strategies.
🟣 Correlation Heatmap
A correlation heatmap is a visual tool that presents the correlation between multiple assets in a color-coded table. Each cell shows the correlation coefficient between two assets, with colors indicating its strength and direction. Warm colors (such as red or orange) represent strong negative correlation, cool colors (such as blue or cyan) represent strong positive correlation, and mid-range tones (such as yellow or green) indicate correlations that are close to neutral.
🟣 Practical Applications in Markets
Forex : Identify currency pairs that move together or in opposite directions, avoid overexposure to similar trades, and spot unusual divergences.
Crypto : Examine the dependency of altcoins on Bitcoin and find independent movers for portfolio diversification.
Stocks : Detect relationships between stocks in the same industry or find outliers that move differently from their sector.
🟣 Key Uses of Correlation in Trading
Risk management and diversification: Select assets with low or negative correlation to reduce portfolio volatility.
Avoiding overexposure: Prevent opening multiple positions on highly correlated assets.
Pairs trading: Exploit temporary deviations between historically correlated assets for arbitrage opportunities.
Intermarket analysis: Study the relationships between different markets like stocks, currencies, commodities, and bonds.
Divergence detection: Spot when two typically correlated assets move apart as a possible trend change signal.
Market forecasting: Use correlated asset movements to anticipate others’ behavior.
Event reaction analysis: Evaluate how groups of assets respond to economic or political events.
❗ Important Note
It’s important to note that correlation does not imply causation — it only reflects co-movement between assets. Correlation is also dynamic and can change over time, which is why analyzing it across multiple timeframes provides a more accurate picture. Combining correlation heatmaps with other analytical tools can significantly improve the precision of trading decisions.
🔵 How to Use
The Correlation Heatmap Matrix indicator is designed to analyze and manage the relationships between multiple assets at once. After adding the tool to your chart, start by selecting the assets you want to compare (up to 20).
Then, choose the Correlation Period that fits your trading strategy. Shorter periods (e.g., 20 bars) are more sensitive to recent price movements, making them suitable for short-term trading, while longer periods (e.g., 100 or 200 bars) provide a broader view of correlation trends over time.
The indicator outputs a color-coded matrix where each cell represents the correlation between two assets. Warm colors like red and orange signal strong negative correlation, while cool colors like blue and cyan indicate strong positive correlation. Mid-range tones such as yellow or green suggest correlations that are close to neutral. This visual representation makes it easy to spot market patterns at a glance.
One of the most valuable uses of this tool is in portfolio risk management. Portfolios with highly correlated assets are more vulnerable to market swings. By using the heatmap, traders can find assets with low or negative correlation to reduce overall risk.
Another key benefit is preventing overexposure. For example, if EUR/USD and GBP/USD have a high positive correlation, opening trades on both is almost like doubling the position size on one asset, increasing risk unnecessarily. The heatmap makes such relationships clear, helping you avoid them.
The indicator is also useful for pairs trading, where a trader identifies assets that are usually correlated but have temporarily diverged — a potential arbitrage or mean-reversion opportunity.
Additionally, the tool supports intermarket analysis, allowing traders to see how movements in one market (e.g., crude oil) may impact others (e.g., the Canadian dollar). Divergence detection is another advantage: if two typically aligned assets suddenly move in opposite directions, it could signal a major trend shift or a news-driven move.
Overall, the Correlation Heatmap Matrix is not just an analytical indicator but also a fast, visual alert system for monitoring multiple markets at once. This is particularly valuable for traders in fast-moving environments like Forex and crypto.
🔵 Settings
🟣 Logic
Correlation Period : Number of bars used to calculate correlation between assets.
🟣 Display
Table on Chart : Enable/disable displaying the heatmap directly on the chart.
Table Size : Choose the table size (from very small to very large).
Table Position : Set the table location on the chart (top, middle, or bottom in various alignments).
🟣 Symbol Custom
Select Market : Choose the market type (Forex, Stocks, Crypto, or Custom).
Symbol 1 to Symbol 20: In custom mode, you can define up to 20 assets for correlation calculation.
🔵 Conclusion
The Correlation Heatmap Matrix is a powerful tool for analyzing correlations across multiple assets in Forex, crypto, and stock markets. By displaying a color-coded table, it visually conveys both the strength and direction of correlations — warm colors for strong negative correlation, cool colors for strong positive correlation, and mid-range tones such as yellow or green for near-zero or neutral correlation.
This helps traders select assets with low or negative correlation for diversification, avoid overexposure to similar trades, identify arbitrage and pairs trading opportunities, and detect unusual divergences between typically aligned assets. With support for custom mode and up to 20 symbols, it offers high flexibility for different trading strategies, making it a valuable complement to technical analysis and risk management.

Camarilla Levels Pro Camarilla Levels Pro – Precision Intraday & Swing Trading Tool
Unlock the full potential of Camarilla Pivot Levels for identifying high-probability reversal zones, breakout triggers, and intraday bias shifts.
This indicator automatically calculates L1–L5 levels based on the Camarilla formula, updating daily for precise market adaptation. Whether you’re trading futures, forex, stocks, or crypto, you’ll instantly see:
Reversal Zones – Where price historically reacts and traps traders.
Breakout Zones – L4/L5 for bullish breakouts, L3/L2 for bearish reversals.
Bias Shifts – Quickly gauge if the market is leaning long or short.
Custom Alerts – Get notified when price touches or breaks your chosen level.
Features:
Auto-adjusting Camarilla levels for any symbol & timeframe
Color-coded zones for instant visual recognition
Optional mid-levels for scalpers
Fully customizable styling to match your chart setup
Ideal for:
Day traders wanting precision entry/exit zones
Swing traders watching key daily pivot breaks
Scalpers looking for high-probability reaction points
Triple EMA with Alert | 21, 50, 200 EMA Strategy + Crossover🚀 Boost your trading edge with the Triple EMA with Alert — a professional-grade indicator designed for traders who want precise, real-time trend confirmation across short, medium, and long-term market movements.
🔹 What Makes This Indicator Powerful?
Three Adjustable EMAs — Default: 21, 50, 200 periods (fully customizable 1–200).
Toggle Visibility — Show only the EMAs you need for your strategy.
Real-Time Alerts — Get notified instantly when:
EMA 1 crosses EMA 2 → short-term trend change.
EMA 2 crosses EMA 3 → medium-term trend alignment.
Works on All Markets & Timeframes — Forex, crypto, stocks, indices, and commodities.
🔹 Why Traders Love It
📊 Multi-Timeframe Trend Confirmation — Filter out noise and trade with market momentum.
🎯 Accurate Crossover Signals — Identify bullish and bearish momentum shifts.
🔔 Hands-Free Monitoring — Alerts keep you informed even when you’re away from the chart.
💡 Versatile for Any Strategy — Perfect for scalping, swing trading, or long-term investing.
🔹 How to Use It
Bullish Signal — EMA 1 crossing above EMA 2 or EMA 2 crossing above EMA 3.
Bearish Signal — EMA 1 crossing below EMA 2 or EMA 2 crossing below EMA 3.
Combine with support/resistance zones, RSI, or volume for higher probability trades.
📌 Pro Tip:
Use EMA 21 & EMA 50 for momentum confirmation.
Use EMA 200 to spot the overall market direction.
If you’re serious about trend trading with precision, the Triple EMA with Alert will keep you one step ahead of market moves — no more missed entries or exits.

Correlation HeatMap Matrix Data [TradingFinder]🔵 Introduction
Correlation is a statistical measure that shows the degree and direction of a linear relationship between two assets.
Its value ranges from -1 to +1 : +1 means perfect positive correlation, 0 means no linear relationship, and -1 means perfect negative correlation.
In financial markets, correlation is used for portfolio diversification, risk management, pairs trading, intermarket analysis, and identifying divergences.
Correlation HeatMap Matrix Data TradingFinder is a Pine Script v6 library that calculates and returns raw correlation matrix data between up to 20 symbols. It only provides the data – it does not draw or render the heatmap – making it ideal for use in other scripts that handle visualization or further analysis. The library uses ta.correlation for fast and accurate calculations.
It also includes two helper functions for visual styling :
CorrelationColor(corr) : takes the correlation value as input and generates a smooth gradient color, ranging from strong negative to strong positive correlation.
CorrelationTextColor(corr) : takes the correlation value as input and returns a text color that ensures optimal contrast over the background color.
Library
"Correlation_HeatMap_Matrix_Data_TradingFinder"
CorrelationColor(corr)
Parameters:
corr (float)
CorrelationTextColor(corr)
Parameters:
corr (float)
Data_Matrix(Corr_Period, Sym_1, Sym_2, Sym_3, Sym_4, Sym_5, Sym_6, Sym_7, Sym_8, Sym_9, Sym_10, Sym_11, Sym_12, Sym_13, Sym_14, Sym_15, Sym_16, Sym_17, Sym_18, Sym_19, Sym_20)
Parameters:
Corr_Period (int)
Sym_1 (string)
Sym_2 (string)
Sym_3 (string)
Sym_4 (string)
Sym_5 (string)
Sym_6 (string)
Sym_7 (string)
Sym_8 (string)
Sym_9 (string)
Sym_10 (string)
Sym_11 (string)
Sym_12 (string)
Sym_13 (string)
Sym_14 (string)
Sym_15 (string)
Sym_16 (string)
Sym_17 (string)
Sym_18 (string)
Sym_19 (string)
Sym_20 (string)
🔵 How to use
Import the library into your Pine Script using the import keyword and its full namespace.
Decide how many symbols you want to include in your correlation matrix (up to 20). Each symbol must be provided as a string, for example FX:EURUSD .
Choose the correlation period (Corr\_Period) in bars. This is the lookback window used for the calculation, such as 20, 50, or 100 bars.
Call Data_Matrix(Corr_Period, Sym_1, ..., Sym_20) with your selected parameters. The function will return an array containing the correlation values for every symbol pair (upper triangle of the matrix plus diagonal).
For example :
var string Sym_1 = '' , var string Sym_2 = '' , var string Sym_3 = '' , var string Sym_4 = '' , var string Sym_5 = '' , var string Sym_6 = '' , var string Sym_7 = '' , var string Sym_8 = '' , var string Sym_9 = '' , var string Sym_10 = ''
var string Sym_11 = '', var string Sym_12 = '', var string Sym_13 = '', var string Sym_14 = '', var string Sym_15 = '', var string Sym_16 = '', var string Sym_17 = '', var string Sym_18 = '', var string Sym_19 = '', var string Sym_20 = ''
switch Market
'Forex' => Sym_1 := 'EURUSD' , Sym_2 := 'GBPUSD' , Sym_3 := 'USDJPY' , Sym_4 := 'USDCHF' , Sym_5 := 'USDCAD' , Sym_6 := 'AUDUSD' , Sym_7 := 'NZDUSD' , Sym_8 := 'EURJPY' , Sym_9 := 'EURGBP' , Sym_10 := 'GBPJPY'
,Sym_11 := 'AUDJPY', Sym_12 := 'EURCHF', Sym_13 := 'EURCAD', Sym_14 := 'GBPCAD', Sym_15 := 'CADJPY', Sym_16 := 'CHFJPY', Sym_17 := 'NZDJPY', Sym_18 := 'AUDNZD', Sym_19 := 'USDSEK' , Sym_20 := 'USDNOK'
'Stock' => Sym_1 := 'NVDA' , Sym_2 := 'AAPL' , Sym_3 := 'GOOGL' , Sym_4 := 'GOOG' , Sym_5 := 'META' , Sym_6 := 'MSFT' , Sym_7 := 'AMZN' , Sym_8 := 'AVGO' , Sym_9 := 'TSLA' , Sym_10 := 'BRK.B'
,Sym_11 := 'UNH' , Sym_12 := 'V' , Sym_13 := 'JPM' , Sym_14 := 'WMT' , Sym_15 := 'LLY' , Sym_16 := 'ORCL', Sym_17 := 'HD' , Sym_18 := 'JNJ' , Sym_19 := 'MA' , Sym_20 := 'COST'
'Crypto' => Sym_1 := 'BTCUSD' , Sym_2 := 'ETHUSD' , Sym_3 := 'BNBUSD' , Sym_4 := 'XRPUSD' , Sym_5 := 'SOLUSD' , Sym_6 := 'ADAUSD' , Sym_7 := 'DOGEUSD' , Sym_8 := 'AVAXUSD' , Sym_9 := 'DOTUSD' , Sym_10 := 'TRXUSD'
,Sym_11 := 'LTCUSD' , Sym_12 := 'LINKUSD', Sym_13 := 'UNIUSD', Sym_14 := 'ATOMUSD', Sym_15 := 'ICPUSD', Sym_16 := 'ARBUSD', Sym_17 := 'APTUSD', Sym_18 := 'FILUSD', Sym_19 := 'OPUSD' , Sym_20 := 'USDT.D'
'Custom' => Sym_1 := Sym_1_C , Sym_2 := Sym_2_C , Sym_3 := Sym_3_C , Sym_4 := Sym_4_C , Sym_5 := Sym_5_C , Sym_6 := Sym_6_C , Sym_7 := Sym_7_C , Sym_8 := Sym_8_C , Sym_9 := Sym_9_C , Sym_10 := Sym_10_C
,Sym_11 := Sym_11_C, Sym_12 := Sym_12_C, Sym_13 := Sym_13_C, Sym_14 := Sym_14_C, Sym_15 := Sym_15_C, Sym_16 := Sym_16_C, Sym_17 := Sym_17_C, Sym_18 := Sym_18_C, Sym_19 := Sym_19_C , Sym_20 := Sym_20_C
= Corr.Data_Matrix(Corr_period, Sym_1 ,Sym_2 ,Sym_3 ,Sym_4 ,Sym_5 ,Sym_6 ,Sym_7 ,Sym_8 ,Sym_9 ,Sym_10,Sym_11,Sym_12,Sym_13,Sym_14,Sym_15,Sym_16,Sym_17,Sym_18,Sym_19,Sym_20)
Loop through or index into this array to retrieve each correlation value for your custom layout or logic.
Pass each correlation value to CorrelationColor() to get the corresponding gradient background color, which reflects the correlation’s strength and direction (negative to positive).
For example :
Corr.CorrelationColor(SYM_3_10)
Pass the same correlation value to CorrelationTextColor() to get the correct text color for readability against that background.
For example :
Corr.CorrelationTextColor(SYM_1_1)
Use these colors in a table or label to render your own heatmap or any other visualization you need.

Enhanced RSI KDE | Advanced FiltersThis is an enhanced version of the excellent RSI (Kernel Optimized) indicator originally created by @fluxchart. Full credit goes to fluxchart for the innovative KDE (Kernel Density Estimation) concept and the solid foundation that made this enhancement possible.
🙏 CREDITS & ACKNOWLEDGMENTS
Original Creator: @fluxchart - RSI (Kernel Optimized)
Original Concept: Kernel Density Estimation applied to RSI pivot analysis
Enhancement: Advanced filtering system and signal optimization- profitgang
License: Mozilla Public License 2.0
🚀 WHAT'S NEW IN THIS ENHANCED VERSION
Building upon fluxchart's brilliant KDE RSI foundation, this version adds:
🔥 Advanced Filtering System:
Multi-Timeframe Confluence - Confirms signals across higher timeframes
Volume Confirmation - Only signals on above-average volume
Volatility Range Filter - Avoids signals in choppy or extreme conditions
Trend Context Analysis - Considers overall market direction
Adaptive Pivot Detection - Adjusts sensitivity based on market volatility
🎯 Signal Quality Improvements:
Confluence Scoring - Each signal gets a quality score (1-6)
Label Cooldown System - Prevents chart clutter with smart spacing
Higher Activation Thresholds - More selective signal generation
Risk Management Integration - Auto stop-loss and take-profit levels
📊 Enhanced Dashboard:
Real-time filter status monitoring
KDE probability percentages
Confluence scores for both directions
Volume and volatility readings
⚙️ HOW IT WORKS
The indicator maintains fluxchart's core KDE methodology:
Collects RSI values at historical pivot points
Creates probability density functions using Gaussian/Uniform/Sigmoid kernels
Identifies high-probability zones for potential reversals
NEW: Multiple filters must align before generating signals, dramatically reducing false positives while maintaining the accuracy of high-probability setups.
🎛️ RECOMMENDED SETTINGS
Confluence Score: 5/6 (very selective)
Activation Threshold: Medium or High
Multi-Timeframe: Enabled with 2/2 alignment
Volume Filter: Enabled (1.5x threshold)
All other filters: Enabled for maximum quality
📈 BEST USE CASES
Swing Trading - Higher timeframe confirmation reduces whipsaws
Quality over Quantity - Fewer but much higher probability signals
Risk Management - Built-in stop/target levels for each signal
Multi-Asset Analysis - Works on stocks, crypto, forex, commodities
⚠️ IMPORTANT NOTES
This is a quality-focused indicator - expect fewer but better signals
Backtest thoroughly on your specific assets and timeframes
The original fluxchart indicator remains excellent for different trading styles
Consider this an alternative approach, not a replacement
🤝 COLLABORATION & FEEDBACK
Special thanks to @fluxchart for creating the original innovative KDE RSI concept. This enhancement wouldn't exist without that solid foundation.
Feel free to suggest improvements or share your results! The goal is to build upon great work in the community.
