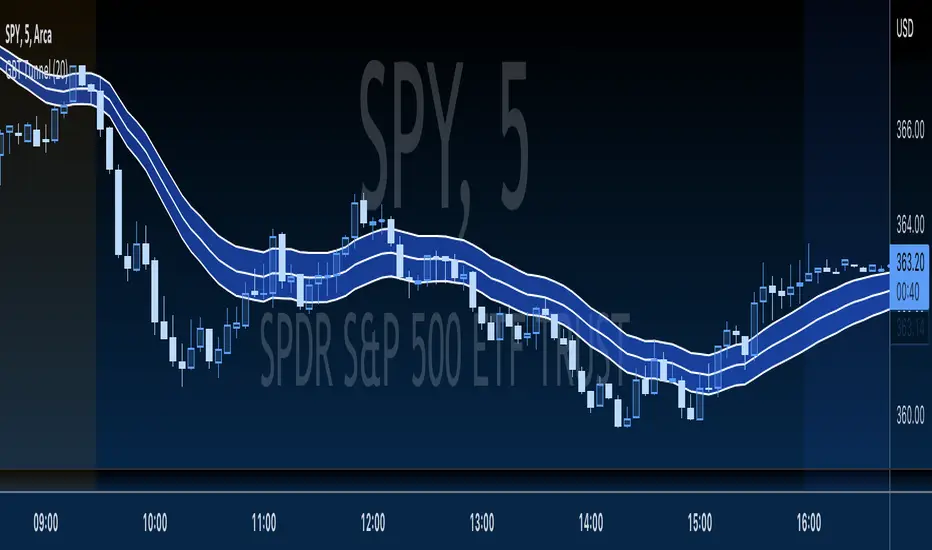
GBT TunnelThis is a channel type tool I created, heavily influenced by LazyBear COG Fibs script and the COG Fibs script by Joy_Bangla which also uses LazyBear COG Fib logic. All credit to those guys, publishing this open source as well since its nothing here is my original work really.
스크립트에서 "fib"에 대해 찾기
.236 FIB Extension ToolThis is a simple FIB extension tool that pulls from the start of a wave to the end of the wave. It extends FIB levels beyond the first wave making the assumption that the first wave was between 0.0 and .236 FIB levels. This often works as support and resistance in a multi-wave move. I see the price get to .65 or .786 often after clearing the initial .236 level. This works on any timeframe.

Auto Fib Time Zones and Trend-Based Fib Time by DGTFibonacci time zones, based on the Fibonacci number sequence, are vertical lines that represent potential areas where a swing high, low, or reversal could occur.
Trend-Based Fib Time shows probable price corrections in an existing trend. A useful tool to use in addition to Elliot Wave counting, Fib Time helps to identify how far the wave is likely to travel
Please note, Time zones aren't concerned with price, only time
Disclaimer :
Trading success is all about following your trading strategy and the indicators should fit within your trading strategy, and not to be traded upon solely
The script is for informational and educational purposes only. Use of the script does not constitute professional and/or financial advice. You alone have the sole responsibility of evaluating the script output and risks associated with the use of the script. In exchange for using the script, you agree not to hold dgtrd TradingView user liable for any possible claim for damages arising from any decision you make based on use of the script

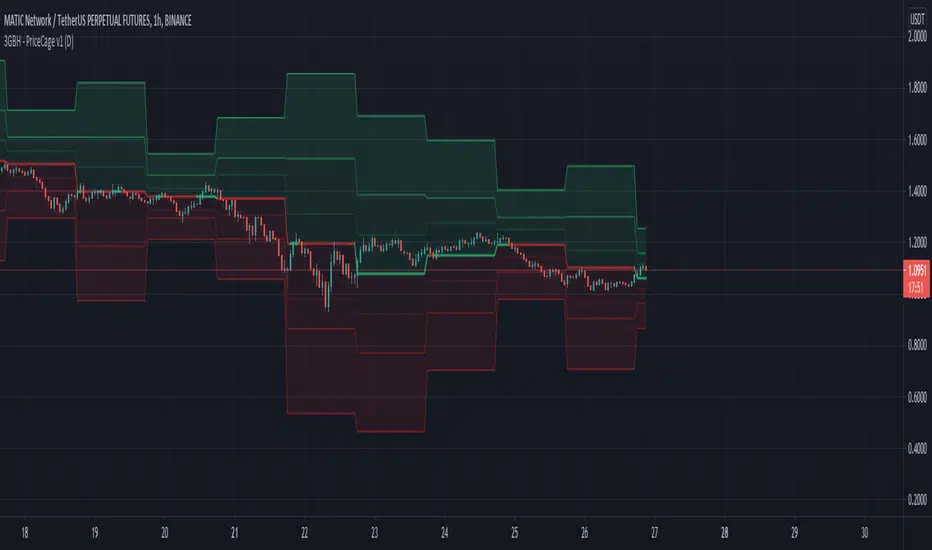
3GBH - Pivot Points & Fib LevelsThis indicator displays Pivot Points & Fib Levels based on the timeframe you select.
-----
There are 3-levels of support/resistance to the Pivot Points.
-----
Currently there are only Fib-Levels based on the 1st Pivot Levels .
Fibs will be added to the other 2 levels in the near future.
The Golden Ratio is highlighted by default.
-----
The Pivot Line is either green or red depending on whether the price is above or below.
-----
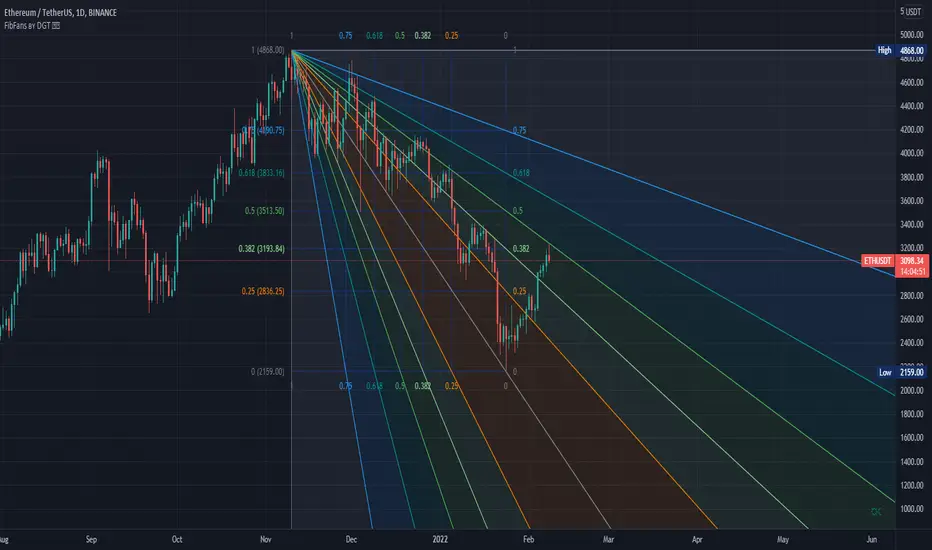
Fibonacci tools are quickly becoming a favorite of mine. This helps me to practice working with them,
and may help to be more efficient in doing analysis.
Auto Fib Speed Resistance Fans by DGTFibonacci Speed and Resistance Fan is an analytical drawing tool used to indicate the support and resistance levels of an existing trend and the price level at which possible changes in the trend may occur.
A Fibonacci Speed Resistance Fan consists of a trend line drawn between two extreme points - a trough and opposing peak or a peak and opposing trough - on which a set of sequential speed resistance lines are drawn above (which represents time) and below (which represents price). These lines are drawn based on time/price percentages of the distance between the beginning and the end of the trend line.
Speed resistance lines not only help to measure trend corrections but also measure the speed of a trend (the rate at which a trendline ascends or descends)
Traders can use the lines of the Fibonacci Speed and Resistance Fan to predict key points of resistance or support, at which they might expect price trends to reverse. Once a trader identifies patterns within a chart, they can use those patterns to predict future price movements and future levels of support and resistance. Traders use the predictions to time their trades. Key support and resistance levels tend to occur frequently at the 61.8-percent level on both uptrends and downtrends.
Please check for further details in the education post that I will share shortly after this publication :
Nobody appears to know whether Fibonacci tools work because markets exhibit some form of natural pattern or because many investors use Fibonacci ratios to predict price movements, making them a self-fulfilling prophecy.
█ Study OPTIONS
Auto Fibonacci Speed and Resistance Fan , the main aim of the study
- Pivot threshold can be adjusted via “Deviation” and “Depth” input options
- Historical Fans option will allow plotting of Speed and Resistance Fans on previous pivot high/lows
- Ability to set ALERTs for the Speed and Resistance Levels
- Price Grid Lines if extended it will result with Fib Retracement levels
- All lines, line levels are customizable, default values are set exactly to the same with the available Fib Speed and Resistance Fan drawing tool
Zig Zag – Derived from build-in Auto Fib Retracement with some customization options.
Example Usages :
Disclaimer :
Trading success is all about following your trading strategy and the indicators should fit within your trading strategy, and not to be traded upon solely
The script is for informational and educational purposes only. Use of the script does not constitute professional and/or financial advice. You alone have the sole responsibility of evaluating the script output and risks associated with the use of the script. In exchange for using the script, you agree not to hold dgtrd TradingView user liable for any possible claim for damages arising from any decision you make based on use of the script
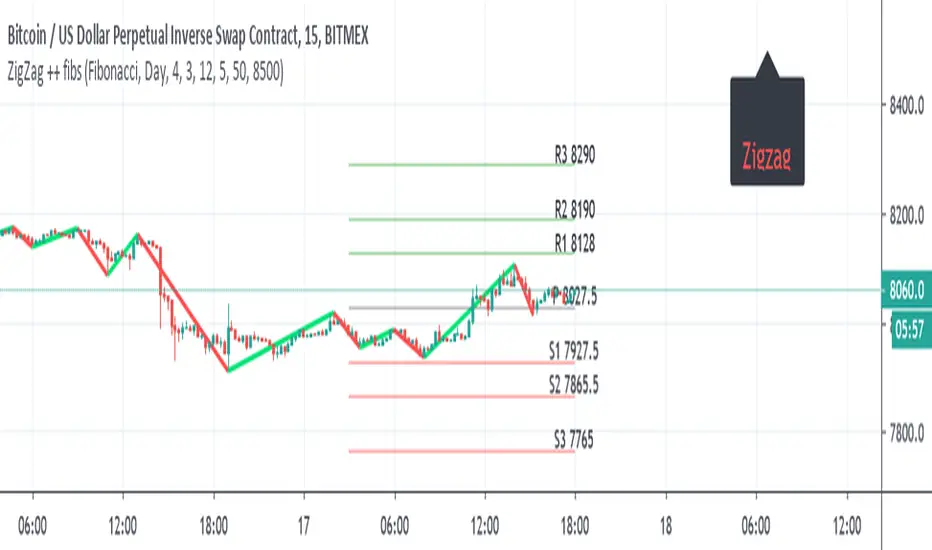
ZigZag ++ fibsI just put this as one user ask for me to do it.
So it the zigzag++ and fibs ,and other pivots type
the fibs can daily , monthly , year
the info panel need to be adjusted by either offset =distance from
or by putting a number , here its btc so I put about 500 above from close =8500
this important as otherwise it will look messy and not pretty
so for each type of asset you use , you expect to adjust this two variables or the data of fibs (daily , weekly etc)
DrungleOG's Auto Fibs PVI got tired of manually using the Fib retracement tool on pivots. This little guy automates it for me. Does not have all levels in this version, mostly just the ones I use. Can add all later if there's interest.
23.6%
38.2%
50%
61.8%
78.6%
127.20%
You can have two sets of Fibs, Inner and Outer. Use the outer for the larger runs and the inner for smaller. The Fib lines have a look back view window of 48 bars and the base/resistance lines have 168 (a week's worth of time on the 1h). The lookback window is based on the view (show_last param) not the pivot calculations.
-DrungleOG
Fibonacci Retracement (L)-BronzeThe Automatic Fib Retracement - Bronze script indicates the 50% pullback line and upper 50% region.
The lines of the upper and lower pivots, the support and resistance areas are also highlighted.
Customisable Fib Length - Time period over which max and min pivots are chosen.
Offsetfib - Automatically offsets the 50% region and pivots as your entry position
will be some time after the upper and lower pivots are set.
Works well when used in combination with an oscillator which highlights Divergence.
A strategy based off buying the 50% with a defined stop loss and target can be the basis of your strategy.
This tool will automatically plot those points but a defined Risk Management strategy will always be needed.
Works best in Bullish trends but will work on all timeframes (Bullish correction in downtrend also possible).
Previous pivots shown but be careful to identify which of the several pivots you are using.
Start at a larger timeframe and move down as necessary.
Pivots and retracements are dynamic. Be sure to note your entry and targets.

My RSI Fib Range Cloud//SOLO900q99This is basically the close price, optionally “stepped” if you set Bars Per Sample > 1.
2. Central Threshold Band (colored line)
• This is an EMA of the resampled price (default length 34).
• It turns:
• Green when RSI is in bullish fib zones,
• Pink when RSI is in bearish fib zones,
• Grey when RSI is in the middle/neutral area.
3. Sigma Range High (green line) and Sigma Range Low (pink line)
• These are an upper and lower band around price.
• The distance from price is based on how much price has been moving recently (average change).

LHAMA MTF Structure & Fibs [LTS]Overview
LHAMA MTF Structure & Fibs is a multi-purpose market structure toolkit that combines current-timeframe structure, higher-timeframe structure, Imbalance/FVG-based order blocks, and automatic Fibonacci retracements into a single chart overlay.
Current-Timeframe Structure
The indicator first maps current-timeframe market structure using swing highs and lows based on a user-defined pivot length (“Time-Horizon”):
Labels swing points as HH , HL , LH , and LL .
Draws BOS (Break of Structure) when price breaks beyond a prior swing.
Optionally identifies CHoCH (Change of Character) when a break occurs against the previous direction.
Lets you choose whether BOS/CHoCH confirmation uses closes or wicks .
Provides options to show/hide swing labels, choose line style (solid/dashed/dotted), and configure bullish/bearish colors.
Higher-Timeframe (HTF) Structure
On top of the local structure, the script builds a higher-timeframe structure map and projects it onto your active chart:
Aggregates price into HTF “bars” (e.g., 4h structure on a 5m chart).
Detects HTF pivots with their own pivot length setting.
Draws HTF BOS/CHoCH lines and labels back on the lower timeframe.
Lets you choose wick vs close confirmation for HTF breaks.
Optional “ pending ” HTF levels: lines extended from the latest HTF swing highs/lows that remain “waiting” until price breaks them.
This is designed to make it easier to see how intraday price is moving relative to the dominant higher-timeframe trend.
Order Blocks (Imbalance/FVG-Based)
The indicator detects simple bullish and bearish order blocks based on fair value gaps and prior sweeps:
Identifies bullish/bearish FVGs together with a sweep of a previous low/high.
Creates colored boxes anchored to an “anchor” candle and extends them forward.
Marks boxes as “broken” when price trades inside or through the opposite side.
Broken blocks can have reduced emphasis (more transparent, dashed border) and can optionally be deleted.
Show Nearest Only mode highlights only the closest active bullish and bearish blocks to reduce chart clutter.
Periodic cleanup removes very old boxes to maintain chart responsiveness.
Automatic Fibonacci Levels
The script can draw up to five customizable Fibonacci retracement levels using the HTF structure logic:
Measures swings using HTF pivots and extremes.
Historical mode : measures between two confirmed pivots in one direction.
Live mode : starts from the last confirmed pivot and tracks the evolving extreme; if price reverses through that pivot, measurement can flip to track the new leg.
Each Fib level has its own on/off toggle, ratio value, and color.
Draws a main swing line plus retracement lines projected slightly into the future.
Key Inputs & Customization
Market Structure (Current TF)
Pivot length (“Time-Horizon”).
BOS confirmation: candle close or wicks.
BOS/CHoCH line style and width.
Swing labels on/off and global label size.
Bullish/bearish colors.
Market Structure (HTF)
HTF timeframe selection.
Separate pivot length for HTF swings.
Close vs wick confirmation for HTF breaks.
HTF swing labels and CHoCH labels on/off.
Pending HTF levels: style, color, and visibility.
Order Block Settings
Bullish/bearish box colors and border width.
Maximum number of boxes to display.
Optional deletion of broken blocks.
“Show Nearest Only” filter to highlight the closest active zones.
Max bars to backscan for the anchor candle.
Cleanup frequency for removing very old boxes.
Fibonacci Settings
Show/hide auto Fibs.
Historical vs Live tracking mode.
Five user-defined ratios with individual toggles and colors.

Dual Session Range Boxes with FIB Lines█ OVERVIEW
The Dual Session Range Boxes with FIB Lines indicator is a powerful tool for identifying and visualizing Range Breakout or Inside Boxes Strategy setups with dual session tracking, customizable Fibonacci extensions, and trade zone levels. Perfect for traders who focus on session-based strategies across multiple markets.
█ FEATURES
◆ DUAL SESSION RANGES
- Range 1: Defines the Range (ORB) based on a specific time window
- Range 2: Extends the Range levels throughout a second session for trade management
- Both ranges can be independently configured with preset sessions or custom times
◆ SESSION PRESETS
- Tokyo Session (00:00 - 09:00)
- London Session (08:00 - 17:00)
- New York Session (14:00 - 21:00)
- Pre Market Session (10:00 - 15:30)
- Custom Time: Define your own session windows
◆ FIBONACCI EXTENSION LEVELS
- Automatically calculated from Range 1 High/Low
- Buy Side Levels: Projected above the range (green)
- Sell Side Levels: Projected below the range (red)
- 10 customizable Fib levels with individual on/off toggles:
- 23.6%, 38.2%, 50%, 61.8%, 78.6%, 100%, 127.2%, 161.8%, 200%, 261.8%
- Special color highlighting for key levels (50%, 100%, 200%)
- All percentage values are fully editable
◆ INSIDE TRADE ZONES
- Two horizontal lines drawn inside the Range 1 box
- Configurable percentage from High/Low (default: 10%)
- Helps identify premium/discount zones within the range
◆ LABELS & DISPLAY OPTIONS
- Show/hide price values on labels
- Show/hide percentage values on labels
- Adjustable label size (Tiny, Small, Normal, Large, Huge)
- Configurable label offset (distance above lines)
- Multiple rounding options for price display:
- 0.25 (quarter points - ideal for indices)
- 0.1 (tenth points)
- 0.01 (two decimals)
◆ STYLE CUSTOMIZATION
- Independent fill and border colors for both ranges
- Adjustable border width (1-5)
- Line style options: Solid, Dashed, Dotted
- Separate color settings for:
- Buy side Fibonacci levels
- Sell side Fibonacci levels
- Trade zone lines
- Special levels (50%, 100%, 200%)
◆ HISTORICAL DATA CONTROL
- Toggle to show/hide historical sessions
- Current session always remains visible
- Clean chart view when analyzing only the active session
█ HOW TO USE
1. Set your timezone in General settings
2. Configure Range 1 to capture your desired Opening Range period
3. Configure Range 2 to define how long levels should extend
4. Adjust Fibonacci levels based on your trading strategy
5. Use Trade Zones to identify key areas within the range
6. Toggle historical data on/off based on your analysis needs
█ USE CASES
- Opening Range Breakout (ORB) strategies
- Session-based trading (London, New York, Tokyo, Pre-Market)
- Fibonacci extension targets for breakout trades
- Identifying support/resistance from session ranges
- Multi-session analysis and confluence zones
█ NOTES
- Indicator works on timeframes lower than Daily
- All times are based on the selected timezone setting
- Range 2 only activates after Range 1 completes
- Fibonacci levels extend from Range 1 start to Range 2 end
Let me know if you like to have any enhancements.
Leave a like if you like it!

SUMA Fib Channels with JMA Ribbon TrendlinesI made this indicator because I was tired of drawing the lines everyday and adding fib lines, so I wanted to automated my daily process so I can be more productive,
-The Green Yellow and red line on the right side of the indicator are the Fib Regression
- The Green top of the line/sell the premium, wait for the price to fully stop and retest this area before you sell (double top or M pattern)
- Yellow is the 0.618 Possibly reversal and in most cases a highly likely area for price to comeback to this point.
- The Red/Buy price is at discount, Wait for the price to fully stop and retest this area before buying (double bottom or W pattern)
The channels lines are easy to read and self explanatory
- Price Above green lines or channel = bullish (always wait for retest and to break above resistance line (lines above price))
- Price Below red lines or channel = Bearish (always wait for retest and to break below support line (lines below price))

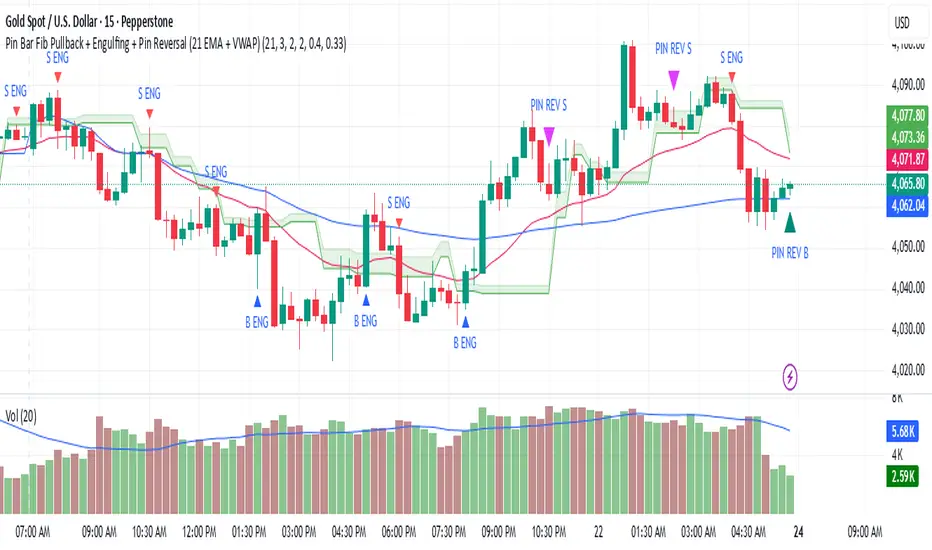
Pin Bar Fib Pullback + Engulfing + Pin Reversal (21 EMA + VWAP)21 EMA = trend filter
VWAP = intraday mean price filter
Fibs = 0.50 & 0.618 “golden pocket” from latest swing range
Signals = Pin bars + Engulfing candles inside that Fib zone, with trend + VWAP filter
1H Auto Fib 區間 (多層支撐壓力 + 標記 + 虛線)1H Auto Fib 區間 (多層支撐壓力 + 標記 + 虛線)
1H Auto Fib interval (stair support pressure + mark + dotted line)

Multi-Symbol Fib Zone Signal Scanner NSEMulti-Symbol Fib Zone Signal Scanner NSE
this indicator will suggest to buy or sell basis fib retracement
it is for educational purpose only.

MCF-TotalTrader-Fib ScreenerThis is an unique screener that scans fib levels among stocks and any asset to find high probability setups. You can choose and filter any fib levels of your likings. this is an cool screener and one of my personal favorites. This is the first of the Total Trader Indicator Series.

Auto Session Fib/Open LevelsThis indicator automatically plots fib levels and key opening levels so you don't have to (:
Default levels are set to Longhorn Trades (Peter Kennedy) fib settings and two key openings of my liking.
IB range + Breakout fibsThe IB High / Low + Auto-Fib indicator automatically plots the Initial Balance range and a Fibonacci projection for each trading day.
Define your IB start and end times (e.g., 09:30–10:30).
The indicator marks the IB High and IB Low from that session and extends them to the session close.
It keeps the last N days visible for context.
When price breaks outside the IB range, it automatically plots a Fibonacci retracement/extension from the opposite IB side to the breakout, using levels 0, 0.236, 0.382, 0.5, 0.618, 0.88, 1.
The Fib updates dynamically as the breakout extends, and labels are neatly aligned on the right side of the chart for clarity.
Ideal for traders who monitor Initial Balance breaks, range expansions, and Fibonacci reaction levels throughout the trading session.

Dynamic Fib Zones [By TraderMan]📊 Dynamic Fib Zones — Indicator Overview
This indicator automatically plots dynamic Fibonacci levels and zones on your chart based on recent price action, volume, and trend direction. It helps you identify key support and resistance areas where price may react strongly.
🔍 What Does It Do?
Draws Fibonacci retracement levels dynamically over a specified lookback period.
Highlights zones around these Fibonacci levels to give you a price “buffer area” instead of just a line.
Colors the zones green or red based on volume strength and trend direction to signal potential buying or selling pressure.
Uses EMA (Exponential Moving Average) to detect if the trend is up or down.
Shows labels with Fibonacci % levels and exact price for quick reference.
⚙️ How to Use It?
Set your inputs:
Fibonacci Period: How many bars back the Fibonacci levels are calculated.
EMA Period: For trend detection.
Volume Multiplier: How much volume should exceed average to consider the signal strong.
Level Tolerance and Zone Width: Adjust the sensitivity and size of the price zones.
Interpret zones:
Green zones with high volume and price near Fibonacci level in an uptrend = potential buying area.
Red zones with high volume and price near Fibonacci level in a downtrend = potential selling area.
Gray zones = neutral, no strong signal.
Make your trading decisions:
Consider entering long positions near green zones with confirmation from other indicators or price action.
Consider entering short positions near red zones similarly.
Use zone boundaries as dynamic support/resistance for stop loss or take profit placement.
🚀 Tips for Position Opening
Combine with other confirmation tools (candlestick patterns, RSI, MACD, etc.) to avoid false signals.
Watch volume spikes carefully; strong volume near a Fibonacci zone increases the reliability.
Use the EMA trend filter to avoid trading against the main trend.
🎯 Summary
Dynamic Fib Zones give you a powerful, visual edge by combining Fibonacci, volume, and trend signals — making your entries and exits smarter and more precise!
Happy Trading! 📈✨

ATR + FibsDescription:
This script plots ATR levels and ATR-based Fibonacci extension levels from either the Low of Day, or High of Day, using the daily Average True Range (ATR) to project key price zones. It's designed to help traders quickly assess where price is trading relative to the day’s ATR.
Features:
Visual reference for how far price has moved relative to today's ATR
Projects fib levels using daily ATR from LOD or HOD
Optional display of fib lines, % labels, and price values
Customizable colors and line widths per level
Auto-resets daily with updated highs/lows
Works on all intraday and higher timeframes
Ideal for traders who want to gauge intraday extension, or frame entries using volatility-based levels.
Dynamic Fib Pro by Qabas Algo🔹 Dynamic Fib Pro by Qabas Algo
Dynamic Fib Pro is an intelligent Fibonacci-based indicator that adapts to real market behavior by incorporating volatility and momentum into classic Fibonacci levels. This tool is ideal for traders who want realistic, responsive, and smart support/resistance zones rather than static levels.
⸻
🚀 Key Features:
• Adaptive Fibonacci Levels: Each level is dynamically adjusted based on current volatility and momentum strength, offering more relevant price zones.
• Smart Trend Detection: Option to auto-detect trend using SMA20 vs SMA50 crossover or pure price action logic.
• Volatility-Aware Scaling: Levels expand or contract depending on market volatility, avoiding rigid assumptions.
• Momentum-Based Adjustment: Uses range and average price to assess strength and adjust levels accordingly.
• Custom Styling: Choose from dashed, dotted, or solid lines, and control the max level displayed.
• Optional Percentage Labels: View both classic and adjusted Fibonacci % next to each level (e.g., 61.8% → 78.4%).
⸻
🎯 Use Case:
This indicator is built for discretionary traders, swing traders, and scalpers who want to:
• Identify meaningful dynamic support/resistance levels
• React to price behavior in real time
• Incorporate market volatility and strength into their strategy
⸻
⚙️ Settings Overview:
• Show Fibonacci Levels – Toggle main levels on/off
• Max Level – Limit the highest level to keep the chart clean
• Show Percentage Labels – View classic vs adjusted percentages
• Use Moving Averages – Enable SMA20/50 trend filtering
• Line Style – Choose between solid, dashed, or dotted
⸻
📌 Notes:
• Levels are calculated from the last 100 bars (High/Low range)
• Adjustments use both current volatility and 50-bar momentum strength
• The indicator updates in real time on each new bar
⸻
🧠 Created with precision by Qabas Algo — designed to make Fibonacci smarter.
If you like this tool, leave a comment or follow for more advanced indicators!

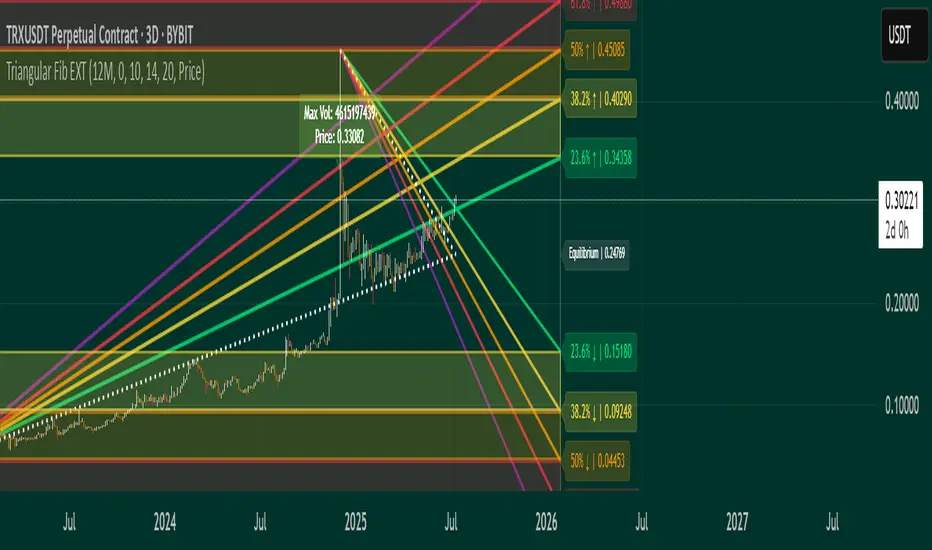
Triangular Fib🔍 Features
- Dynamic Lookback & Projection: Automatically adjusts the range and projection horizon based on timeframe changes.
- Triangular Fibonacci Arms: Projects fib levels upward and downward from high/low extremes to highlight potential price inflections.
- Volatility-Shaded Equilibrium: Visual zone highlights areas of consolidation or energy buildup before breakouts.
- Breakout Alerts: Detects and signals bullish/bearish breakouts from triangular fib thresholds.
- Auto-Traced Triangle Wedge: Dotted wedge lines visually represent narrowing price action from range extremes to midpoint.
Ideal for traders who seek visual clarity, price symmetry, and alert-driven decision-making across multiple timeframes. Whether you're swing trading or intraday scouting, this script provides a richly layered roadmap of market potential.
Not financial advice.
Manual Fib Levels (Paul Laurent Trading)📜 Script Description for TradingView
Manual Fibonacci Levels with Whole Number Lines
This script draws infinite horizontal lines for custom Fibonacci retracement and extension levels, based on manually entered high and low points. It also includes additional lines at full whole number levels (e.g., 1.0000, 2.0000, 3.0000), making it easier to visualize key psychological price zones within the Fibonacci range.
Features:
* Custom manual high/low inputs
* Infinite Fib lines (retracement + extension)
* Separate whole-number lines within the Fib range
* Adjustable line color and thickness for both sets
Useful for traders who prefer visual clarity with precise price alignment across major and whole-number levels.
