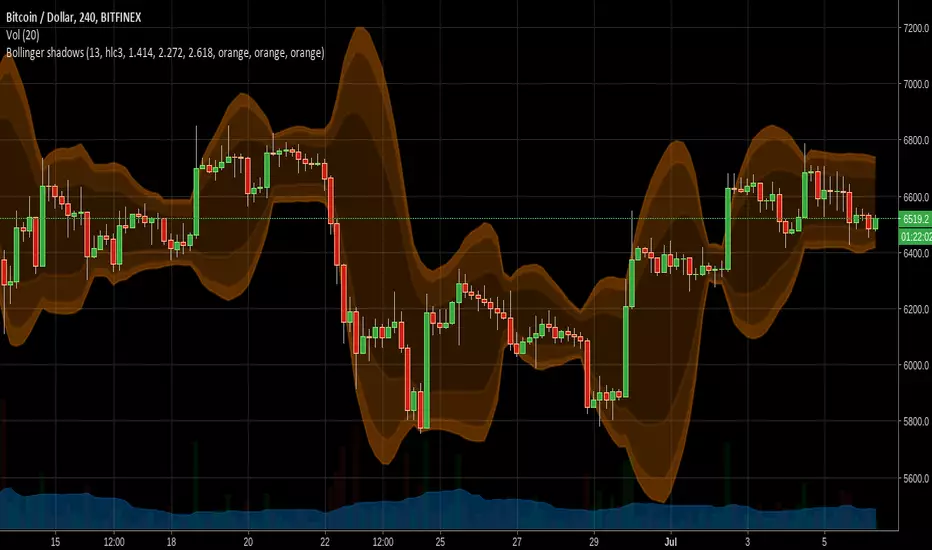
Cooltoyz : Bollinger ShadowsFinally, another gadget for the cooltoyz series :)
this is a simple tool to allow vizualizing bollinger bands with several values/levels. usually boll bands have the levels at 1.5, 2, 3, for multiplier of standadrd deviations. but, just changing those values, we can apply fibbonnaci levels to the bands.
The inputs on this indicator come with fib levels by default, but the values are part of input fields, so it's easy to change to whatever you prefer, back to the calssic std.deviation values, for example. also, the colors are set to make a visual slope, so it's more instinctive to see how strong the candles are moving.
just play with it, and like it. or not :)
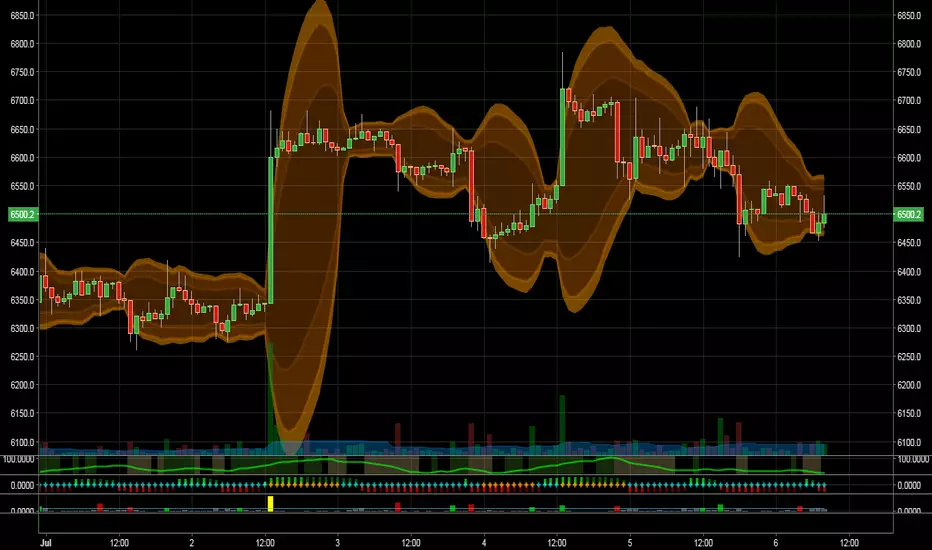
here is another example, where the colors are reversed, to create a more classic "shadowy" effect.
i just like to have the edge level set stronger, it's easier to see when stuff is "on fire" :)
스크립트에서 "fib"에 대해 찾기
Cooltoyz: Multi level Bollinger ShadowsFinally, another gadget for the cooltoyz series :)
this is a simple tool to allow vizualizing bollinger bands with several values/levels. usually boll bands have the levels at 1.5, 2, 3, for multiplier of standadrd deviations. but, just changing those values, we can apply fibbonnaci levels to the bands.
The inputs on this indicator come with fib levels by default, but the values are part of input fields, so it's easy to change to whatever you prefer, back to the calssic std.deviation values, for example. also, the colors are set to make a visual slope, so it's more instinctive to see how strong the candles are moving.
just play with it, and like it. or not :)
EMA & MA CrossoverfibThis is nice hybrid of EMA MA cross over made by harry poter and daily fib made by justuncle
with alerts easy to see where the best buy points and exit. also you the trends more easy.have fun

[RS]Volume Rsidmi This indicator has the following:
1. volume rsi based on Ricardo Santos great work
2.DMI
3.fib candle
the buy points are based on volume break of rsi (not rsi) filter by DMI and the candle fib based on fibo points
sell point the same just in reverse
this indicator give you volume based on rsi to gether with other stuff so the buy points seems to be more accurate and it not repainting.
I hope you will like it

Peso Pros Nueve a DiezThere are many ways we can trade the Peso and some trades have a much higher probability than others, such as the morning NY session trade that we teach as part of the Peso Pros course (el desayuno trade). This indicator relates to a trading strategy that is intraday using the stochastic oscillator indicator, trend detection, fibs and of course... some of grandma's special sauce.
This indicator is actually using the timeframe 9am - 11am EST so it should be called "de nueve a once", however we may tweak the session time sometime in the future with further testing. The rules still apply similar to what you have/will be taught in the Peso Pros course regarding the Nueve a Diez trade. This indicator aims to make your life easier and in fact you can even leave your chart running and setup alerts so you don't have to sit there all day watching the chart... well not all day but between 9 and 11 am EST.
Happy trading Peso Pros!

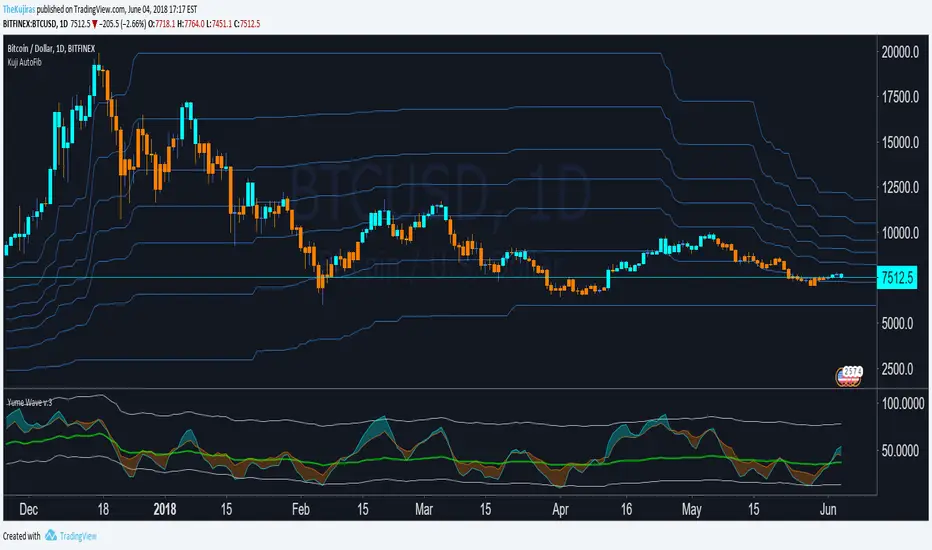
EdgeAnalysisGroup: Kuji's TrendBreakerA beta testing script for TrendBreak Analysis to determine Yume Wave bottoms/tops.
To be used with Yume Wave + EdgeAnalysisGroup Fib MA's.
Fuchsia bars indicate a potential support/resistance point on the Yume Wave to predict a sideways trend-break.

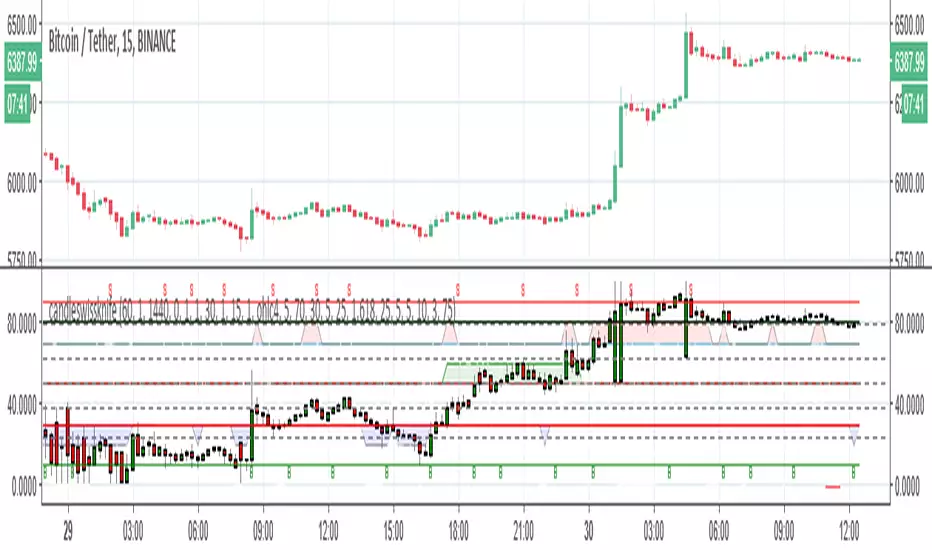
candleswissknifethere are two system to buy and sell in this indicator
system 1 is based on long ema and short ema with heiken candle and macd filter (green=buy and red=sell) line bellow the candles)
system 2 is based on fib candle and fast rsi and fast adx crossing (blue=buy line and gray=sell line bellow candle)
B and S are points of stoch rsi crossing
inside there are points of divergence based on ATR and rsi
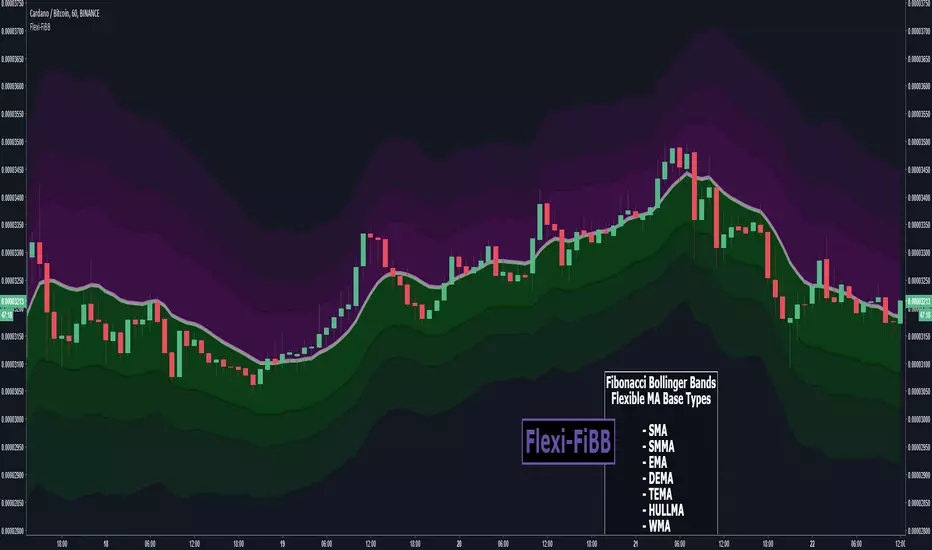
Flexi-FiBBFlexible Fibonacci Bollinger Bands
Colorful 3d Bands displaying Support and Resistance areas based off of Fibonacci Ratios in a customization Bollinger Band.
Choose from vary types of moving average types to get the perfect fit for your trade style.
MA Types Available
- SMA
- SMMA
- EMA
- DEMA
- TEMA
- HULL-MA
- WMA
- VWMA
You can purchase access to this indicator via CryptoProTools
Other recent indicators proving popular among members lately :
dmi-srsi-candle v1very similar to previous version only here instead of using rsi dmi system , I use only dmi srsi cross up as seen as green and red trinangular on top or buttom. fib candles are the same no modification best buy if candles bellow 10 and sell if candles above 90

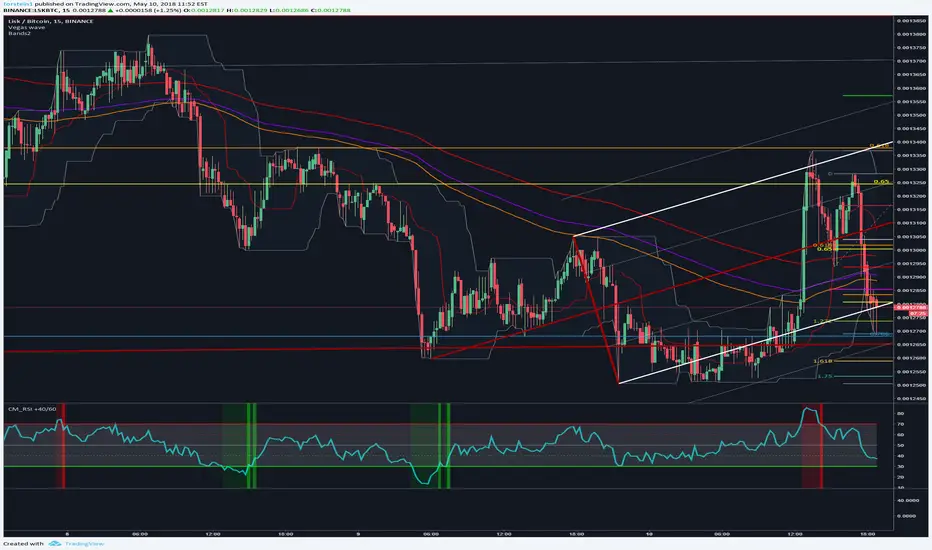
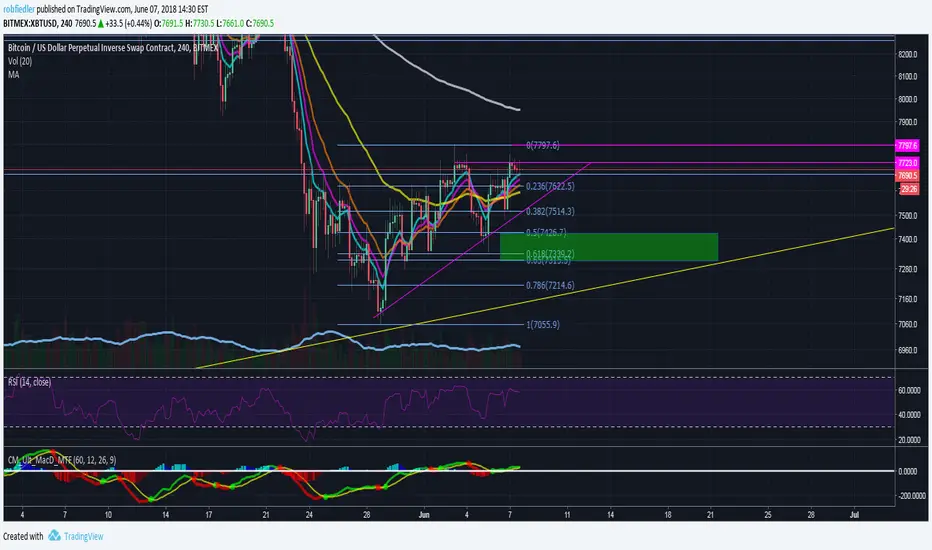
Fibonacci Algo - LongAutomatic Fibonacci retracement entry, stop loss and extension target level as apart of a customisable strategy.
Automatic plots of 23.6% 38.2%, 50%, 61.8%, 65%, 78.6% and -23.6, -61.8% and -100% levels.
Customisable Fib Length - Time period over which max and min pivots are chosen.
Customisable Offsetfib - Offsets the pivots and sell zone as your entry position
will be some time after the upper and lower pivots are set.
Vegas Wave - Automatic plot. Shows price relative to wave and EMA crossover - See my 'Vegas Wave' code for more of an explanation.
A strategy based off buying the 50-618 with a defined stop loss the other side of the 65 or 786 can easily be formulated.
This tool will automatically plot those points but a defined Risk Management strategy will always be needed.
The 236 and 382 region can also be plotted, allowing for lesser retracements coinciding with wave 4 pullbacks ( Elliott Wave Traders).
Works best in Bullish trends but will work on all timeframes (Bullish correction in an downtrend also possible).
Previous pivots shown but be careful to identify which of the several pivots you are using.
Start at a larger timeframe and move down. (Entries consistent on several timeframes are golden)
Pivots and retracements are dynamic. Be sure to note your entry and targets.
Works well when used in combination with an oscillator which highlights Divergence.
Also refer to my other 'Fibonacci' Codes for more context.

DMI-RSI-candlesthis system is based on RSI+DMI and special candle based on fibonacci levels, best buy poiny is RSI + indicated in green triangle, DMI above 30 (red line) and low fib level ( bellow 30 better bellow 10) ..have fun


stochrsi-histo-candleHave fun I hope you will like it :) its a special stoch rsi design with relation of candels and fib levels

RSI-candlesThis is my best creation/ its all in in one/ RSI +candles +fib levels and alert to show you where to buy where to sell / also you can make twiking by your way:) have fun

Daily Auto Fibonacci ToolCalculates Fibonacci retracements based on daily highs/lows, and further beyond that if specified. The main difference between this and other auto Fibbing tools is ease of visibility.
Options:
Take highs/lows from a few days back or take highs/lows from each daily candle
Hide retracements before today
Show labels for each retracement level
Hide/Show retracement levels
Change colors quickly and uniformly (in script)
Retracements used:
-0.382 / 0 / 0.236 / 0.382 / 0.5 / 0.618 / 0.786 / 1 / 1.272

Fibonacci Exponential Moving Averages (+ 200EMA)One indicator to rule them all...
So here you have the fib based EMA`s (8,3,21,55) plus I added the 200 EMA cause I love it and should give you the complete picture. Have fun!
To add click on "Add to favorite scripts" and then select in your TV settings.
*Thanks to behind_crypto for publishing the base version of the script!*
EdgeAnalysisGroup: Fibbonacci Moving AveragesMoving averages based on a moving Fibonacci within a specified length - averaging the highest high/lowest lows, highest opens, lowest closes, and identifying major resistance points closest to estimated fib resistance/support areas.
Donations are appreciated:
ETH/ERC20 : 0x862E6C54397Cf681887136472d5F16cCA22C80Fe
BTC -1.39% : 16wnhEyNB5zx7ErwNi5KyszNeHhtjH2syx

Vegas Wave - BronzeThe bronze edition of my code will be the most basic of a series of Vegas Wave codes which I will publish.
EMA 144, 169, 233
Vegas Tunnel - Highlights the price band between the 144 and 169 EMA.
Identifies support and resistance areas
Target price bounces and aid identifying EW counts.
Wave 2 retrace through the waves. Wave 4 bounce off Vegas Tunnel for example.
Provides confluence when used with fib targets and other indicators.
Identify EMA cross-overs and price crosses.
Easy to customise colours and shading for all time periods.
Multiple indicators in one (for those with TV limits).
Silver/Gold versions
I will include highlights/alerts for EMA/Price crossovers.
I hope its helpful and hopefully the first of many scripts to come.
Feel free to leave ideas and tips for future versions.


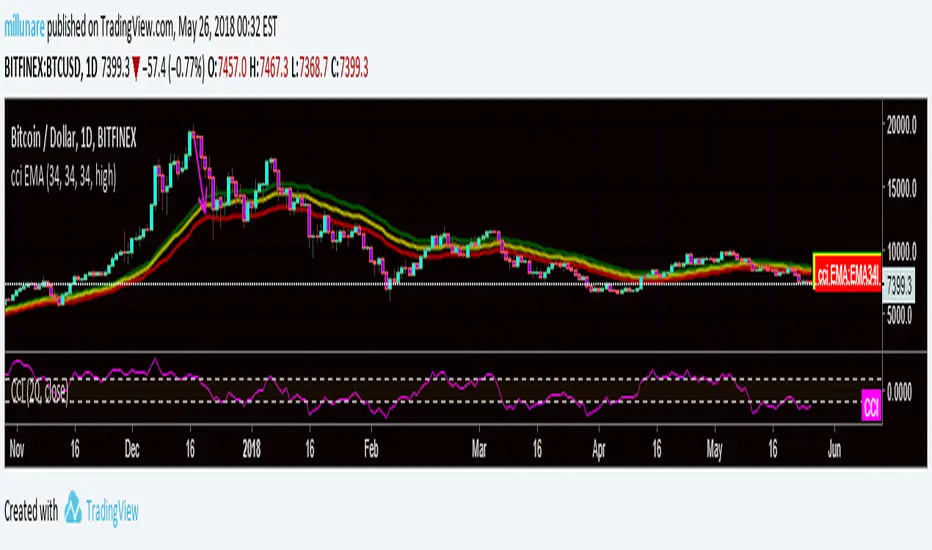
CMR CCI WAVEThe Funnel consists of 3 EMA's all set at the 34 EMA ( 1 on 34 Close, 1 on 34 Low and 1 on 34 High )
We couple this with a CCI of +100 / 0 / -100 ( The CCI is used as an RSI would be to determining crossings and overbought and oversold)
The Funnel should not be used as your primary entries, it is more of a verification process to show where the market is heading and where it has been. Best couple with the Elliott Wave of Swing Trading Fibs.
The Wave Funnel moves in clock angles ( remember to always think of a clock when working with the wave)
* 12-2 = A North Move
* 4-6 = A South Move
* A 9-3 = A Flat Move signaling Consolidation / Market Stall
* A 2-4 = When the wave is not steep enough to be a 12-2 or 4-6 and not flat enough to be a Consolidation of the 9-3.. We can verify this by looking at the CCI to confirm.
Wave confirms Direction, CCI confirms 2-4 ( We only range trade a 2-4 or Stay out of the Market if volume is non existent.
Add a MACD for a Flat 9-3 clock angle.
* Congestion/Consolidation is evident we look for other chart patterns to form in this angle. ( Triangles/ Rectangles/ Flags etc)
* Only use the MACD on Sideways markets
* If and when it breaks the Flat Angle we then look at the MACD for entry.
* If MACD is over 0 we BUY the Break
* If MACD is under the 0 we Sell
A 2-4 angle we trade the range of the emas, it will poke through the bottom and back out the top and repeat until we see a breakout to the north or south.
So if it is a 2-4 oclock angle we trade based off the macd's -100 we buy, 100 we sell. Repeat as the funnel continues the clock angle.
We trade with a Stop Loss on the other side of the Wave.
Do Not jump the gun on the trades. Wait for Pull Backs into the Wave
Pivots and Fibs will help determine the pullback ranges
The price always pullback to the Wave ( No different than any other ema, they act as magnets to price action)
ANy Questions hit up mill in CMR
Ichimoku Fibonacci HybridHey guys, this is a variation of Ichimoku using Fibonacci principles.
Overview
As you may know, Ichimoku uses in its calculations (high + low)/2 to calculate Tenkan-sen (Conversion line) and Kijun-sen (Base line) for different periods: Tenkan is a shorter period, so it reacts faster to reversals, while Kijun is slower, so it reacts slower, and it is contextually more reliable due to how conservative it is.
Why does the Ichimoku Cloud works? My theory that inspired this indicator is that it works because it looks at 50% retracements from highest point to the lowest point. In other words, Tenkan plots the 50% line between the peak and the trough from the recent period, which has proven to often be a good estimation for retracements. Similarly, Kijun applies the same, but for a longer period*.
However, if we look at Fibonacci retracement, it is often the case that price retracts to those magical percentages: 23.6%, 38.2%, 50%, 61.8%, and sometimes even 88.6% and 78.6%. Why this happens is largely unknown to the academic community, but, empirically, it often seems that these numbers just work.
Therefore, I wanted to apply this principle to Ichimoku calculations, and instead of calculating (high + low)/2, I calculated both (high + low) * 0.382 and (high + low) * 0.618. These lines should provide pessimistic/bearish estimations, and optimistic/bullish estimations, respectively. Naturally, these results in 4 extra lines: a bearish Tenkan/Kijun pair and a bullish Tenkan/Kijun pair.
Therefore, applying this indicator will crowd the chart quite a bit: you have 6 lines on the chart among which 2 of them are the original Tenkan and Kijun lines, and the other 4 are Fib-inspired Tenkan/Kijun lines.
Usage
As with most indicators, usage is subjective to the user and relative to the chart. However, some ways in which this indicator can be used are as follows:
In a strong uptrend, price is typically above both Ichi Kijun and Tenkan. In this case, you can use this indicator to provide you with a new pair of bullish Kijun/Tenkan that provide the same usage as before. Similarly, in a downtrend, the bearish Kijun/Tenkan apply.
Using the new lines, one can apply R/S levels, crossover signals, overbought/oversold areas, price channels, retracement levels, and trend indications.
One may simply use it out of convenience, as it automatically computes potential areas of interest without having to perform manual work.
Please note that because the indicator was so full, I did not keep the Cloud, nor did I keep the Chikou span (Lagging span.) These can be easily implemented, but it would crowd the chart to an extent that it would be difficult to gauge much information. However, I did consider adding them as optional indicators that are disabled by default, and I may potentially do so in the future. For reference, this would help by simply disabling everything else besides the "bullish Ichi" in an uptrend.
Footnotes
* I have heard people referring to Ichimoku Cloud as "a glorified average mean," but, mathematically, I don't believe there is much relationship between MAs and Ichimoku Cloud. However, I acknowledge the visual similarity between the two and the potential to use both in a similar fashion, so one may interpret this indicator as such if they please.