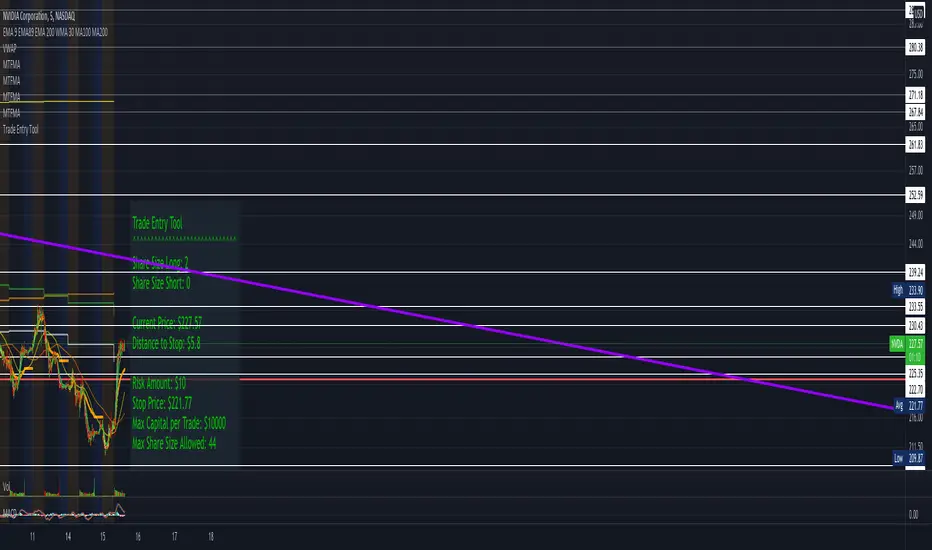
Entry Percent: EssamThis Pine Script code is designed to perform the task of computing and showcasing the profit percentage, profit value, and the duration for which a specific asset is held, all in real-time. The script effectively leverages the built-in resources to provide a seamless and robust experience, as it presents the calculated figures in an easily readable format on the chart, without causing any lag or disruptions to the chart.
스크립트에서 "entry"에 대해 찾기
MA_Script- Entry Point : base on MA20, MA50, MA100, MA200.
- Exit Point : base on stop loss, MA and trailing stop.
sa-strategy with HTF-TSLEntry- based on HA close above HMA confirmation done with ST and HTF ATR
Exit- based on close below ATR which works as trailing SL
[MV] %B with SMA + Volume Based Colored Bars
Entry Signal when %B Crosses with SMA and this is more meaningful if it supports colored bars.
Black Bar when prices go down and volume is bigger than 150% of its average, that indicates us price action is supported by a strong bearish volume
Blue Bar when prices go up and volume bigger than 150% of its average, that indicates us price action is supported by a strong bullish volume
VBC author @KIVANCfr3762
FX Sniper: T3-CCI Strategy - With 100 IndicatorsEntry signal when moving above -100, sell signal when going below 100
Amazing Crossover SystemEntry Rules
BUY when the 5 EMA crosses above the 10 EMA from underneath and the RSI crosses above the 50.0 mark from the bottom.
SELL when the 5 EMA crosses below the 10 EMA from the top and the RSI crosses below the 50.0 mark from the top.
Make sure that the RSI did cross 50.0 from the top or bottom and not just ranging tightly around the level.
How to setup Alert:
1) Add the Amazing Crossover System to your chart via Indicators
2) Find your currency pair
3) Set the timeframe on the chart to 1 hour
4) Press 'Alt + A' (create alert shortcut)
5) Set the following criteria for the alert:
Condition = 'Amazing Crossover System', Plot, ' BUY Signal'
The rest of the alert can be customized to your preferences
5) Repeat steps 1 - 4, but set the Condition = 'Amazing Crossover System', Plot, ' SELL Signal'
Pro Trader Hybrid System - Aldo Leandro 🧠 Pro Trader Hybrid System
Version: 6
Author: Aldo Leandro
Category: Intelligent Entry System / Multi-Indicator
🚀 General Description
The Pro Trader Hybrid System is a complete analysis and entry signaling tool designed for professional and advanced traders seeking precision, clarity, and adaptability.
Based on an optimized combination of momentum, trend, volatility, and volume, the indicator automatically adjusts to the selected operation mode — Scalp or Swing — providing intelligent LONG and SHORT signals with built-in quality filters.
⚙️ Key Features
🧭 Dynamic Modes: Switch between Scalp and Swing to automatically adjust all moving averages, RSI levels, ADX, and volume filters.
📊 Smart Panel: Displays trend strength, signal quality, volatility, volume, ADX, RSI, MACD, and active setup — all in real time.
🎯 Entry Signals: Visual arrows and automatic alerts (LONG/SHORT) with minimum quality validation.
📈 Advanced Moving Averages: Combines SMA, EMA, and HMA for a more sensitive reading of trend and reversals.
⚡ Multi-Timeframe Confirmation: Validates the main signal using higher timeframe analysis (15m for Scalp / 1D for Swing).
🧩 Dynamic Zones: Automatically marks local supports and resistances through smart pivot detection.
🛡️ Risk Management: Includes automatic Stop Loss and Take Profit calculation based on ATR, adjusted to the operational profile.
💡 Ideal For
Traders who want to automate part of their technical analysis without relying on dozens of indicators.
Strategies based on trend and controlled reversal, focused on BTC, indices, or highly liquid currencies.
Scalper and Swing Trader profiles seeking clear, objective, and highly reliable setups.
📏 Recommendations
⏱️ Scalp Mode: Use on 1–5min charts, target 0.5–1%, stop between 0.3–0.5%.
🕓 Swing Mode: Use on 15min–4H charts, target 5–10%, stop between 2–3%.
🧮 Combine with higher timeframe confirmation and consistent volume for more robust results.
🧠 Technical Summary
Combines the core pillars of modern analysis:
Momentum: RSI, Stochastic, MACD
Trend: HMA, EMA, SMA, ADX
Volume & Volatility: Dynamic Volume Filter + Adaptive ATR
Market Structure: Support, Resistance, and MTF Confirmation
⚠️ Disclaimer
This script does not guarantee financial results. Use it as a confirmation tool within a consolidated strategy and with proper risk management.
FVG Zones with Signals█ OVERVIEW
"FVG Zones with Signals" is a technical analysis tool that identifies Fair Value Gaps (FVG) on the chart and draws customizable zones in the form of boxes. It is ideal for traders using price action and market structure strategies, helping to identify potential imbalance zones and trading opportunities based on breakout and exit signals. With flexible size filter settings, box styles, and signal options, the indicator ensures clarity and precision on the chart.
█ CONCEPTS
The indicator is designed to identify potential entry points for trades based on FVG breakouts or retests. For chart clarity, a size filter for FVGs is included, based on a multiplier of the average candle size over a specified period.
Why are FVGs important? FVG zones represent areas of market imbalance, often attracting price back to "fill" the gap. Larger gaps (with a higher size multiplier) have a greater chance of being retested, as they indicate deeper imbalances—leaving more unexecuted orders in those zones, which attracts liquidity. Market makers and institutions often return to these levels to "refresh" liquidity before further moves. However, not every large FVG is retested quickly—in strong trends, smaller imbalances may be ignored, and the location (e.g., near swing highs/lows) is critical for retest probability.
█ FEATURES
- FVG Detection: Identifies bullish and bearish FVGs based on size filters (Candle Size Period and FVG Size Multiplier), with automatic initialization of historical gaps up to 500 candles back.
- Customizable Boxes: Draws FVG boxes with adjustable border colors, background gradients, border styles (solid, dashed, dotted), border widths, and transparency for both the background and the 50% FVG midline.
- Breakout and Exit Signals: Generates "Break" signals (green upward triangle for breakouts above bearish FVG, red downward triangle for breakouts below bullish FVG) and "Exit" signals (circles for exiting the zone), with options to select signal types (Break, Exit, or Both). A break signal causes the box to disappear, leaving a triangle as a trace of the breakout, which may serve as a signal to open a position. Exit signals (circles) may also indicate entry opportunities but require additional confirmation, such as alignment with the main trend.
- Midline: Automatically draws a dashed line at the 50% FVG level with adjustable transparency, aiding in assessing price reactions within the zone.
- Box Limitation: Automatically removes old or inactive FVGs after 500 candles to avoid chart clutter.
- Alerts: Built-in alerts for all signal types, including price and FVG type descriptions.
█ HOW TO USE
Add to Chart: Apply the indicator to your TradingView chart via the Pine Editor or Indicators menu.
Configure Settings:
- FVG Settings: Adjust Candle Size Period (default 20) and FVG Size Multiplier (default 1) to filter out small gaps—higher values generate fewer but more significant FVGs.
- Box Settings: Configure colors and styles for bullish (green) and bearish (red) boxes, including background transparency (default 80) and midline transparency.
- Signal Settings: Select signal types (Break, Exit, or Both) in Signal Type. Breakout signals appear after a candle closes outside the zone, while exit signals appear when exiting an FVG without a full breakout.
- Styling: Customize signal colors (green for buy/up, red for sell/down) and shape sizes.
Interpreting Signals:
- Break Up Signal: A green triangle below the bar indicates a breakout above a bearish FVG, suggesting potential continuation of an uptrend.
- Break Down Signal: A red triangle above the bar indicates a breakout below a bullish FVG, suggesting potential continuation of a downtrend.
- Exit Up/Down Signal: A green/red circle indicates an exit from an FVG without a full breakout, which may signal the end of a correction or preparation for a reversal.
- FVG Zones: If the price returns to an FVG and fills the gap, it may indicate equilibrium; an unfilled gap often leads to a retest.
- Use signals in conjunction with other technical analysis tools for confirmation, such as RSI (to identify overbought/oversold conditions) or MACD (to confirm momentum). Analyze FVGs from higher timeframes—these zones act as stronger imbalance levels and carry greater structural significance.
Exit signals (retests without breakouts) tend to be most effective when traded in line with the current trend.
█ APPLICATIONS
- Price Action Trading: Use FVG zones as dynamic support and resistance levels. In an uptrend, look for buying opportunities in bullish FVGs, where price often tests the gap before continuing. Combining with RSI, MACD, or Fibonacci levels enhances the significance of zones.
- Breakout Strategies: Trade based on breakout signals from FVGs. A buy signal after breaking a bearish FVG may indicate a strong upward impulse, especially when supported by a rising MACD or RSI exiting oversold conditions.
Larger FVG gaps (higher multiplier) have a greater chance of retest, as they indicate deeper imbalances.
█ NOTES
- Test the indicator across different timeframes and markets (stocks, forex, crypto) to optimize size filters for your trading style.
- The indicator initializes historical FVGs up to 500 candles back, which may slow loading on longer charts.
- For best results, use on high-liquidity markets where FVGs are more frequently retested.
- In consolidation zones, the indicator may generate more false signals, so additional confirmation is recommended.
High-Confluence SuperTrend + MACD v5 (FIXED)1. How to Read a Trade Signal (Entry Criteria)
A Green Buy Signal (Long) or Red Sell Signal (Short) appears when ALL of the following conditions are true at the close of the bar:
🟢 For a BUY Signal (Long):
SuperTrend: The line is Green (or just flipped to Green).
MACD Crossover: The MACD Line crosses above the Signal Line (Bullish Crossover).
RSI Filter: RSI is above 50 (Confirming underlying bullish momentum).
Volume: Current Volume is high (above the moving average of volume, set by the Volume Surge Multiplier).
ADX (If Used): The ADX value is above the Threshold (e.g., 20 or 25), confirming a strong trend exists.
🔴 For a SELL Signal (Short):
SuperTrend: The line is Red (or just flipped to Red).
MACD Crossover: The MACD Line crosses below the Signal Line (Bearish Crossover).
RSI Filter: RSI is below 50 (Confirming underlying bearish momentum).
Volume: Current Volume is high (above the moving average of volume).
ADX (If Used): The ADX value is above the Threshold, confirming a strong trend exists.
2. Parameter Guidance (Settings for Different Trading Styles)
You must change the indicator lengths (periods) when switching between fast (intraday) and slow (swing) trading, as well as for different assets.
A. Settings for FAST Trading (Scalping / Low Timeframes like 5m):
Goal: Be sensitive and catch quick moves.
SuperTrend Period: Use a smaller number (e.g., 7 or 8).
SuperTrend Multiplier: Use a smaller number (e.g., 1.5 or 2.0) to keep the line close to price.
MACD Lengths: Use shorter lengths (e.g., Fast: 8, Slow: 17, Signal: 9) for faster crossovers.
ADX Lengths: Use shorter lengths (e.g., 10 or 12).
B. Settings for SLOW Trading (Swing / High Timeframes like Daily):
Goal: Filter noise and capture major trends.
SuperTrend Period: Use a higher number (e.g., 14 or 20).
SuperTrend Multiplier: Use a higher number (e.g., 3.0 or 4.0) to avoid false flips.
MACD Lengths: Use standard or longer lengths (e.g., Standard 12/26/9, or longer 20/40/9).
ADX Lengths: Use standard or longer lengths (e.g., 14 or 20).
3. Critical Filter: Using the ADX
The ADX component is your quality control filter. It measures the strength of the trend, not the direction.
When to Enable ADX: Turn Use ADX Filter to True when the market is choppy or sideways.
Threshold Rule: If the ADX line is below 20, the market is ranging, and the filter will block signals, saving you from false whipsaws.
Signal Strength: A signal is strongest when ADX is above 25.
dyor, nfa
TF weekly System 1 — Weekly Trend Flip Indicator
System 1 (Weekly) is a simple trend-following indicator that uses weekly EMAs with ATR filtering to highlight strong directional shifts.
📈 Uses weekly fast & slow EMAs
🧭 ATR filter removes weak or choppy signals
🟢 Bullish regime = fast EMA above slow + ATR margin
🔴 Bearish regime = fast EMA below slow − ATR margin
⚪ Neutral when neither condition is met
Works on any chart timeframe, but signals are based on weekly data
Ideal for position traders and longer-term swing trading
💡 Tip: Use this indicator to confirm larger trend direction and combine with lower timeframe strategies for entry timing.
Final trend following weeklySystem 1 — Weekly Trend Flip Indicator
System 1 (Weekly) is a simple trend-following indicator that uses weekly EMAs with ATR filtering to highlight strong directional shifts.
📈 Uses weekly fast & slow EMAs
🧭 ATR filter removes weak or choppy signals
🟢 Bullish regime = fast EMA above slow + ATR margin
🔴 Bearish regime = fast EMA below slow − ATR margin
⚪ Neutral when neither condition is met
Works on any chart timeframe, but signals are based on weekly data
Ideal for position traders and longer-term swing trading
💡 Tip: Use this indicator to confirm larger trend direction and combine with lower timeframe strategies for entry timing.
Big Candle Identifier with RSI Divergence and Advanced Stops1. Strategy Objective
The main goal of this strategy is to:
Identify significant price momentum (big candles).
Enter trades at opportune moments based on market signals (candlestick patterns and RSI divergence).
Limit initial risk through a fixed stop loss.
Maximize profits by using a trailing stop that activates only after the trade moves a specified distance in the profitable direction.
2. Components of the Strategy
A. Big Candle Identification
The strategy identifies big candles as indicators of strong momentum.
A big candle is defined as:
The body (absolute difference between close and open) of the current candle (body0) is larger than the bodies of the last five candles.
The candle is:
Bullish Big Candle: If close > open.
Bearish Big Candle: If open > close.
Purpose: Big candles signal potential continuation or reversal of trends, serving as the primary entry trigger.
B. RSI Divergence
Relative Strength Index (RSI): A momentum oscillator used to detect overbought/oversold conditions and divergence.
Fast RSI: A 5-period RSI, which is more sensitive to short-term price movements.
Slow RSI: A 14-period RSI, which smoothens fluctuations over a longer timeframe.
Divergence: The difference between the fast and slow RSIs.
Positive divergence (divergence > 0): Bullish momentum.
Negative divergence (divergence < 0): Bearish momentum.
Visualization: The divergence is plotted on the chart, helping traders confirm momentum shifts.
C. Stop Loss
Initial Stop Loss:
When entering a trade, an immediate stop loss of 200 points is applied.
This stop loss ensures the maximum risk is capped at a predefined level.
Implementation:
Long Trades: Stop loss is set below the entry price at low - 200 points.
Short Trades: Stop loss is set above the entry price at high + 200 points.
Purpose:
Prevents significant losses if the price moves against the trade immediately after entry.
D. Trailing Stop
The trailing stop is a dynamic risk management tool that adjusts with price movements to lock in profits. Here’s how it works:
Activation Condition:
The trailing stop only starts trailing when the trade moves 200 ticks (profit) in the right direction:
Long Position: close - entry_price >= 200 ticks.
Short Position: entry_price - close >= 200 ticks.
Trailing Logic:
Once activated, the trailing stop:
For Long Positions: Trails behind the price by 150 ticks (trail_stop = close - 150 ticks).
For Short Positions: Trails above the price by 150 ticks (trail_stop = close + 150 ticks).
Exit Condition:
The trade exits automatically if the price touches the trailing stop level.
Purpose:
Ensures profits are locked in as the trade progresses while still allowing room for price fluctuations.
E. Trade Entry Logic
Long Entry:
Triggered when a bullish big candle is identified.
Stop loss is set at low - 200 points.
Short Entry:
Triggered when a bearish big candle is identified.
Stop loss is set at high + 200 points.
F. Trade Exit Logic
Trailing Stop: Automatically exits the trade if the price touches the trailing stop level.
Fixed Stop Loss: Exits the trade if the price hits the predefined stop loss level.
G. 21 EMA
The strategy includes a 21-period Exponential Moving Average (EMA), which acts as a trend filter.
EMA helps visualize the overall market direction:
Price above EMA: Indicates an uptrend.
Price below EMA: Indicates a downtrend.
H. Visualization
Big Candle Identification:
The open and close prices of big candles are plotted for easy reference.
Trailing Stop:
Plotted on the chart to visualize its progression during the trade.
Green Line: Indicates the trailing stop for long positions.
Red Line: Indicates the trailing stop for short positions.
RSI Divergence:
Positive divergence is shown in green.
Negative divergence is shown in red.
3. Key Parameters
trail_start_ticks: The number of ticks required before the trailing stop activates (default: 200 ticks).
trail_distance_ticks: The distance between the trailing stop and price once the trailing stop starts (default: 150 ticks).
initial_stop_loss_points: The fixed stop loss in points applied at entry (default: 200 points).
tick_size: Automatically calculates the minimum tick size for the trading instrument.
4. Workflow of the Strategy
Step 1: Entry Signal
The strategy identifies a big candle (bullish or bearish).
If conditions are met, a trade is entered with a fixed stop loss.
Step 2: Initial Risk Management
The trade starts with an initial stop loss of 200 points.
Step 3: Trailing Stop Activation
If the trade moves 200 ticks in the profitable direction:
The trailing stop is activated and follows the price at a distance of 150 ticks.
Step 4: Exit the Trade
The trade is exited if:
The price hits the trailing stop.
The price hits the initial stop loss.
5. Advantages of the Strategy
Risk Management:
The fixed stop loss ensures that losses are capped.
The trailing stop locks in profits after the trade becomes profitable.
Momentum-Based Entries:
The strategy uses big candles as entry triggers, which often indicate strong price momentum.
Divergence Confirmation:
RSI divergence helps validate momentum and avoid false signals.
Dynamic Profit Protection:
The trailing stop adjusts dynamically, allowing the trade to capture larger moves while protecting gains.
6. Ideal Market Conditions
This strategy performs best in:
Trending Markets:
Big candles and momentum signals are more effective in capturing directional moves.
High Volatility:
Larger price swings improve the probability of reaching the trailing stop activation level (200 ticks).
Nef33 Forex & Crypto Trading Signals PRO
1. Understanding the Indicator's Context
The indicator generates signals based on confluence (trend, volume, key zones, etc.), but it does not include predefined SL or TP levels. To establish them, we must:
Use dynamic or static support/resistance levels already present in the script.
Incorporate volatility (such as ATR) to adjust the levels based on market conditions.
Define a risk/reward ratio (e.g., 1:2).
2. Options for Determining SL and TP
Below, I provide several ideas based on the tools available in the script:
Stop Loss (SL)
The SL should protect you from adverse movements. You can base it on:
ATR (Volatility): Use the smoothed ATR (atr_smooth) multiplied by a factor (e.g., 1.5 or 2) to set a dynamic SL.
Buy: SL = Entry Price - (atr_smooth * atr_mult).
Sell: SL = Entry Price + (atr_smooth * atr_mult).
Key Zones: Place the SL below a support (for buys) or above a resistance (for sells), using Order Blocks, Fair Value Gaps, or Liquidity Zones.
Buy: SL below the nearest ob_lows or fvg_lows.
Sell: SL above the nearest ob_highs or fvg_highs.
VWAP: Use the daily VWAP (vwap_day) as a critical level.
Buy: SL below vwap_day.
Sell: SL above vwap_day.
Take Profit (TP)
The TP should maximize profits. You can base it on:
Risk/Reward Ratio: Multiply the SL distance by a factor (e.g., 2 or 3).
Buy: TP = Entry Price + (SL Distance * 2).
Sell: TP = Entry Price - (SL Distance * 2).
Key Zones: Target the next resistance (for buys) or support (for sells).
Buy: TP at the next ob_highs, fvg_highs, or liq_zone_high.
Sell: TP at the next ob_lows, fvg_lows, or liq_zone_low.
Ichimoku: Use the cloud levels (Senkou Span A/B) as targets.
Buy: TP at senkou_span_a or senkou_span_b (whichever is higher).
Sell: TP at senkou_span_a or senkou_span_b (whichever is lower).
3. Practical Implementation
Since the script does not automatically draw SL/TP, you can:
Calculate them manually: Observe the chart and use the levels mentioned.
Modify the code: Add SL/TP as labels (label.new) at the moment of the signal.
Here’s an example of how to modify the code to display SL and TP based on ATR with a 1:2 risk/reward ratio:
Modified Code (Signals Section)
Find the lines where the signals (trade_buy and trade_sell) are generated and add the following:
pinescript
// Calculate SL and TP based on ATR
atr_sl_mult = 1.5 // Multiplier for SL
atr_tp_mult = 3.0 // Multiplier for TP (1:2 ratio)
sl_distance = atr_smooth * atr_sl_mult
tp_distance = atr_smooth * atr_tp_mult
if trade_buy
entry_price = close
sl_price = entry_price - sl_distance
tp_price = entry_price + tp_distance
label.new(bar_index, low, "Buy: " + str.tostring(math.round(bull_conditions, 1)), color=color.green, textcolor=color.white, style=label.style_label_up, size=size.tiny)
label.new(bar_index, sl_price, "SL: " + str.tostring(math.round(sl_price, 2)), color=color.red, textcolor=color.white, style=label.style_label_down, size=size.tiny)
label.new(bar_index, tp_price, "TP: " + str.tostring(math.round(tp_price, 2)), color=color.blue, textcolor=color.white, style=label.style_label_up, size=size.tiny)
if trade_sell
entry_price = close
sl_price = entry_price + sl_distance
tp_price = entry_price - tp_distance
label.new(bar_index, high, "Sell: " + str.tostring(math.round(bear_conditions, 1)), color=color.red, textcolor=color.white, style=label.style_label_down, size=size.tiny)
label.new(bar_index, sl_price, "SL: " + str.tostring(math.round(sl_price, 2)), color=color.red, textcolor=color.white, style=label.style_label_up, size=size.tiny)
label.new(bar_index, tp_price, "TP: " + str.tostring(math.round(tp_price, 2)), color=color.blue, textcolor=color.white, style=label.style_label_down, size=size.tiny)
Code Explanation
SL: Calculated by subtracting/adding sl_distance to the entry price (close) depending on whether it’s a buy or sell.
TP: Calculated with a double distance (tp_distance) for a 1:2 risk/reward ratio.
Visualization: Labels are added to the chart to display SL (red) and TP (blue).
4. Practical Strategy Without Modifying the Code
If you don’t want to modify the script, follow these steps manually:
Entry: Take the trade_buy or trade_sell signal.
SL: Check the smoothed ATR (atr_smooth) on the chart or calculate a fixed level (e.g., 1.5 times the ATR). Also, review nearby key zones (OB, FVG, VWAP).
TP: Define a target based on the next key zone or multiply the SL distance by 2 or 3.
Example:
Buy at 100, ATR = 2.
SL = 100 - (2 * 1.5) = 97.
TP = 100 + (2 * 3) = 106.
5. Recommendations
Test in Demo: Apply this logic in a demo account to adjust the multipliers (atr_sl_mult, atr_tp_mult) based on the market (forex or crypto).
Combine with Zones: If the ATR-based SL is too wide, use the nearest OB or FVG as a reference.
Risk/Reward Ratio: Adjust the TP based on your tolerance (1:1, 1:2, 1:3)
BackTestLibLibrary "BackTestLib"
Allows backtesting indicator performance. Tracks typical metrics such as won/loss, profit factor, draw down, etc. Trading View strategy library provides similar (and more comprehensive)
functionality but only works with strategies. This libary was created to address performance tracking within indicators.
Two primary outputs are generated:
1. Summary Table: Displays overall performance metrics for the indicator over the chart's loaded timeframe and history
2. Details Table: Displays a table of individual trade entries and exits. This table can grow larger than the available chart space. It does have a max number of rows supported. I haven't
found a way to add scroll bars or scroll bar equivalents yet.
f_init(data, _defaultStopLoss, _defaultTakeProfit, _useTrailingStop, _useTraingStopToBreakEven, _trailingStopActivation, _trailingStopOffset)
f_init Initialize the backtest data type. Called prior to using the backtester functions
Parameters:
data (backtesterData) : backtesterData to initialize
_defaultStopLoss (float) : Default trade stop loss to apply
_defaultTakeProfit (float) : Default trade take profit to apply
_useTrailingStop (bool) : Trailing stop enabled
_useTraingStopToBreakEven (bool) : When trailing stop active, trailing stop will increase no further than the entry price
_trailingStopActivation (int) : When trailing stop active, trailing will begin once price exceeds base stop loss by this number of points
_trailingStopOffset (int) : When trailing stop active, it will trail the max price achieved by this number of points
Returns: Initialized data set
f_buildResultStr(_resultType, _price, _resultPoints, _numWins, _pointsWon, _numLoss, _pointsLost)
f_buildResultStr Helper function to construct a string of resutling data for exit tooltip labels
Parameters:
_resultType (string)
_price (float)
_resultPoints (float)
_numWins (int)
_pointsWon (float)
_numLoss (int)
_pointsLost (float)
f_buildResultLabel(data, labelVertical, labelOffset, long)
f_buildResultLabel Helper function to construct an Exit label for display on the chart
Parameters:
data (backtesterData)
labelVertical (bool)
labelOffset (int)
long (bool)
f_updateTrailingStop(_entryPrice, _curPrice, _sl, _tp, trailingStopActivationInput, trailingStopOffsetInput, useTrailingStopToBreakEven)
f_updateTrailingStop Helper function to advance the trailing stop as price action dictates
Parameters:
_entryPrice (float)
_curPrice (float)
_sl (float)
_tp (float)
trailingStopActivationInput (float)
trailingStopOffsetInput (float)
useTrailingStopToBreakEven (bool)
Returns: Updated stop loss for current price action
f_enterShort(data, entryPrice, fixedStopLoss)
f_enterShort Helper function to enter a short and collect data necessary for tracking the trade entry
Parameters:
data (backtesterData)
entryPrice (float)
fixedStopLoss (float)
Returns: Updated backtest data
f_enterLong(data, entryPrice, fixedStopLoss)
f_enterLong Helper function to enter a long and collect data necessary for tracking the trade entry
Parameters:
data (backtesterData)
entryPrice (float)
fixedStopLoss (float)
Returns: Updated backtest data
f_exitTrade(data)
f_enterLong Helper function to exit a trade and update/reset tracking data
Parameters:
data (backtesterData)
Returns: Updated backtest data
f_checkTradeConditionForExit(data, condition, curPrice, enableRealTime)
f_checkTradeConditionForExit Helper function to determine if provided condition indicates an exit
Parameters:
data (backtesterData)
condition (bool) : When true trade will exit
curPrice (float)
enableRealTime (bool) : When true trade will evaluate if barstate is relatime or barstate is confirmed; otherwise just checks on is confirmed
Returns: Updated backtest data
f_checkTrade(data, curPrice, curLow, curHigh, enableRealTime)
f_checkTrade Helper function to determine if current price action dictates stop loss or take profit exit
Parameters:
data (backtesterData)
curPrice (float)
curLow (float)
curHigh (float)
enableRealTime (bool) : When true trade will evaluate if barstate is relatime or barstate is confirmed; otherwise just checks on is confirmed
Returns: Updated backtest data
f_fillCell(_table, _column, _row, _title, _value, _bgcolor, _txtcolor, _text_size)
f_fillCell Helper function to construct result table cells
Parameters:
_table (table)
_column (int)
_row (int)
_title (string)
_value (string)
_bgcolor (color)
_txtcolor (color)
_text_size (string)
Returns: Table cell
f_prepareStatsTable(data, drawTesterSummary, drawTesterDetails, summaryTableTextSize, detailsTableTextSize, displayRowZero, summaryTableLocation, detailsTableLocation)
f_fillCell Helper function to populate result table
Parameters:
data (backtesterData)
drawTesterSummary (bool)
drawTesterDetails (bool)
summaryTableTextSize (string)
detailsTableTextSize (string)
displayRowZero (bool)
summaryTableLocation (string)
detailsTableLocation (string)
Returns: Updated backtest data
backtesterData
backtesterData - container for backtest performance metrics
Fields:
tradesArray (array) : Array of strings with entries for each individual trade and its results
pointsBalance (series float) : Running sum of backtest points won/loss results
drawDown (series float) : Running sum of backtest total draw down points
maxDrawDown (series float) : Running sum of backtest total draw down points
maxRunup (series float) : Running sum of max points won over the backtest
numWins (series int) : Number of wins of current backtes set
numLoss (series int) : Number of losses of current backtes set
pointsWon (series float) : Running sum of points won to date
pointsLost (series float) : Running sum of points lost to date
entrySide (series string) : Current entry long/short
tradeActive (series bool) : Indicates if a trade is currently active
tradeComplete (series bool) : Indicates if a trade just exited (due to stop loss or take profit)
entryPrice (series float) : Current trade entry price
entryTime (series int) : Current trade entry time
sl (series float) : Current trade stop loss
tp (series float) : Current trade take profit
defaultStopLoss (series float) : Default trade stop loss to apply
defaultTakeProfit (series float) : Default trade take profit to apply
useTrailingStop (series bool) : Trailing stop enabled
useTrailingStopToBreakEven (series bool) : When trailing stop active, trailing stop will increase no further than the entry price
trailingStopActivation (series int) : When trailing stop active, trailing will begin once price exceeds base stop loss by this number of points
trailingStopOffset (series int) : When trailing stop active, it will trail the max price achieved by this number of points
resultType (series string) : Current trade won/lost
exitPrice (series float) : Current trade exit price
resultPoints (series float) : Current trade points won/lost
summaryTable (series table) : Table to deisplay summary info
tradesTable (series table) : Table to display per trade info
position_toolLibrary "position_tool"
Trying to turn TradingView's position tool into a library from which you can draw position tools for your strategies on the chart. Not sure if this is going to work
calcBaseUnit()
Calculates the chart symbol's base unit of change in asset prices.
Returns: (float) A ticks or pips value of base units of change.
calcOrderPipsOrTicks(orderSize, unit)
Converts the `orderSize` to ticks.
Parameters:
orderSize (float) : (series float) The order size to convert to ticks.
unit (simple float) : (simple float) The basic units of change in asset prices.
Returns: (int) A tick value based on a given order size.
calcProfitLossSize(price, entryPrice, isLongPosition)
Calculates a difference between a `price` and the `entryPrice` in absolute terms.
Parameters:
price (float) : (series float) The price to calculate the difference from.
entryPrice (float) : (series float) The price of entry for the position.
isLongPosition (bool)
Returns: (float) The absolute price displacement of a price from an entry price.
calcRiskRewardRatio(profitSize, lossSize)
Calculates a risk to reward ratio given the size of profit and loss.
Parameters:
profitSize (float) : (series float) The size of the profit in absolute terms.
lossSize (float) : (series float) The size of the loss in absolute terms.
Returns: (float) The ratio between the `profitSize` to the `lossSize`
createPosition(entryPrice, entryTime, tpPrice, slPrice, entryColor, tpColor, slColor, textColor, showExtendRight)
Main function to create a position visualization with entry, TP, and SL
Parameters:
entryPrice (float) : (float) The entry price of the position
entryTime (int) : (int) The entry time of the position in bar_time format
tpPrice (float) : (float) The take profit price
slPrice (float) : (float) The stop loss price
entryColor (color) : (color) Color for entry line
tpColor (color) : (color) Color for take profit zone
slColor (color) : (color) Color for stop loss zone
textColor (color) : (color) Color for text labels
showExtendRight (bool) : (bool) Whether to extend lines to the right
Returns: (bool) Returns true when position is closed
CalculatePercentageSlTpLibrary "CalculatePercentageSlTp"
This Library calculate the sl and tp amount in percentage
sl_percentage(entry_price, sl_price)
this function calculates the sl value in percentage
Parameters:
entry_price : indicates the entry level
sl_price : indicates the stop loss level
Returns: stop loss in percentage
tp_percentage(entry_price, tp_price)
this function calculates the tp value in percentage
Parameters:
entry_price : indicates the entry level
tp_price : indicates the take profit level
Returns: take profit in percentage
sl_level(entry_price, sl_percentage)
this function calculates the sl level price
Parameters:
entry_price : indicates the entry level
sl_percentage : indicates the stop loss percentage
Returns: stop loss price in $
tp_level(entry_price, tp_percentage)
this function calculates the tp level price
Parameters:
entry_price : indicates the entry level
tp_percentage : indicates the take profit percentage
Returns: take profit price in $
ApicodeLibrary "Apicode"
percentToTicks(percent, from)
Converts a percentage of the average entry price or a specified price to ticks when the
strategy has an open position.
Parameters:
percent (float) : (series int/float) The percentage of the `from` price to express in ticks, e.g.,
a value of 50 represents 50% (half) of the price.
from (float) : (series int/float) Optional. The price from which to calculate a percentage and convert
to ticks. The default is `strategy.position_avg_price`.
Returns: (float) The number of ticks within the specified percentage of the `from` price if
the strategy has an open position. Otherwise, it returns `na`.
percentToPrice(percent, from)
Calculates the price value that is a specific percentage distance away from the average
entry price or a specified price when the strategy has an open position.
Parameters:
percent (float) : (series int/float) The percentage of the `from` price to use as the distance. If the value
is positive, the calculated price is above the `from` price. If negative, the result is
below the `from` price. For example, a value of 10 calculates the price 10% higher than
the `from` price.
from (float) : (series int/float) Optional. The price from which to calculate a percentage distance.
The default is `strategy.position_avg_price`.
Returns: (float) The price value at the specified `percentage` distance away from the `from` price
if the strategy has an open position. Otherwise, it returns `na`.
percentToCurrency(price, percent)
Parameters:
price (float) : (series int/float) The price from which to calculate the percentage.
percent (float) : (series int/float) The percentage of the `price` to calculate.
Returns: (float) The amount of the symbol's currency represented by the percentage of the specified
`price`.
percentProfit(exitPrice)
Calculates the expected profit/loss of the open position if it were to close at the
specified `exitPrice`, expressed as a percentage of the average entry price.
NOTE: This function may not return precise values for positions with multiple open trades
because it only uses the average entry price.
Parameters:
exitPrice (float) : (series int/float) The position's hypothetical closing price.
Returns: (float) The expected profit percentage from exiting the position at the `exitPrice`. If
there is no open position, it returns `na`.
priceToTicks(price)
Converts a price value to ticks.
Parameters:
price (float) : (series int/float) The price to convert.
Returns: (float) The value of the `price`, expressed in ticks.
ticksToPrice(ticks, from)
Calculates the price value at the specified number of ticks away from the average entry
price or a specified price when the strategy has an open position.
Parameters:
ticks (float) : (series int/float) The number of ticks away from the `from` price. If the value is positive,
the calculated price is above the `from` price. If negative, the result is below the `from`
price.
from (float) : (series int/float) Optional. The price to evaluate the tick distance from. The default is
`strategy.position_avg_price`.
Returns: (float) The price value at the specified number of ticks away from the `from` price if
the strategy has an open position. Otherwise, it returns `na`.
ticksToCurrency(ticks)
Converts a specified number of ticks to an amount of the symbol's currency.
Parameters:
ticks (float) : (series int/float) The number of ticks to convert.
Returns: (float) The amount of the symbol's currency represented by the tick distance.
ticksToStopLevel(ticks)
Calculates a stop-loss level using a specified tick distance from the position's average
entry price. A script can plot the returned value and use it as the `stop` argument in a
`strategy.exit()` call.
Parameters:
ticks (float) : (series int/float) The number of ticks from the position's average entry price to the
stop-loss level. If the position is long, the value represents the number of ticks *below*
the average entry price. If short, it represents the number of ticks *above* the price.
Returns: (float) The calculated stop-loss value for the open position. If there is no open position,
it returns `na`.
ticksToTpLevel(ticks)
Calculates a take-profit level using a specified tick distance from the position's average
entry price. A script can plot the returned value and use it as the `limit` argument in a
`strategy.exit()` call.
Parameters:
ticks (float) : (series int/float) The number of ticks from the position's average entry price to the
take-profit level. If the position is long, the value represents the number of ticks *above*
the average entry price. If short, it represents the number of ticks *below* the price.
Returns: (float) The calculated take-profit value for the open position. If there is no open
position, it returns `na`.
calcPositionSizeByStopLossTicks(stopLossTicks, riskPercent)
Calculates the entry quantity required to risk a specified percentage of the strategy's
current equity at a tick-based stop-loss level.
Parameters:
stopLossTicks (float) : (series int/float) The number of ticks in the stop-loss distance.
riskPercent (float) : (series int/float) The percentage of the strategy's equity to risk if a trade moves
`stopLossTicks` away from the entry price in the unfavorable direction.
Returns: (int) The number of contracts/shares/lots/units to use as the entry quantity to risk the
specified percentage of equity at the stop-loss level.
calcPositionSizeByStopLossPercent(stopLossPercent, riskPercent, entryPrice)
Calculates the entry quantity required to risk a specified percentage of the strategy's
current equity at a percent-based stop-loss level.
Parameters:
stopLossPercent (float) : (series int/float) The percentage of the `entryPrice` to use as the stop-loss distance.
riskPercent (float) : (series int/float) The percentage of the strategy's equity to risk if a trade moves
`stopLossPercent` of the `entryPrice` in the unfavorable direction.
entryPrice (float) : (series int/float) Optional. The entry price to use in the calculation. The default is
`close`.
Returns: (int) The number of contracts/shares/lots/units to use as the entry quantity to risk the
specified percentage of equity at the stop-loss level.
exitPercent(id, lossPercent, profitPercent, qty, qtyPercent, comment, alertMessage)
A wrapper for the `strategy.exit()` function designed for creating stop-loss and
take-profit orders at percentage distances away from the position's average entry price.
NOTE: This function calls `strategy.exit()` without a `from_entry` ID, so it creates exit
orders for *every* entry in an open position until the position closes. Therefore, using
this function when the strategy has a pyramiding value greater than 1 can lead to
unexpected results. See the "Exits for multiple entries" section of our User Manual's
"Strategies" page to learn more about this behavior.
Parameters:
id (string) : (series string) Optional. The identifier of the stop-loss/take-profit orders, which
corresponds to an exit ID in the strategy's trades after an order fills. The default is
`"Exit"`.
lossPercent (float) : (series int/float) The percentage of the position's average entry price to use as the
stop-loss distance. The function does not create a stop-loss order if the value is `na`.
profitPercent (float) : (series int/float) The percentage of the position's average entry price to use as the
take-profit distance. The function does not create a take-profit order if the value is `na`.
qty (float) : (series int/float) Optional. The number of contracts/lots/shares/units to close when an
exit order fills. If specified, the call uses this value instead of `qtyPercent` to
determine the order size. The exit orders reserve this quantity from the position, meaning
other orders from `strategy.exit()` cannot close this portion until the strategy fills or
cancels those orders. The default is `na`, which means the order size depends on the
`qtyPercent` value.
qtyPercent (float) : (series int/float) Optional. A value between 0 and 100 representing the percentage of the
open trade quantity to close when an exit order fills. The exit orders reserve this
percentage from the open trades, meaning other calls to this command cannot close this
portion until the strategy fills or cancels those orders. The percentage calculation
depends on the total size of the applicable open trades without considering the reserved
amount from other `strategy.exit()` calls. The call ignores this parameter if the `qty`
value is not `na`. The default is 100.
comment (string) : (series string) Optional. Additional notes on the filled order. If the value is specified
and not an empty "string", the Strategy Tester and the chart show this text for the order
instead of the specified `id`. The default is `na`.
alertMessage (string) : (series string) Optional. Custom text for the alert that fires when an order fills. If the
value is specified and not an empty "string", and the "Message" field of the "Create Alert"
dialog box contains the `{{strategy.order.alert_message}}` placeholder, the alert message
replaces the placeholder with this text. The default is `na`.
Returns: (void) The function does not return a usable value.
closeAllAtEndOfSession(comment, alertMessage)
A wrapper for the `strategy.close_all()` function designed to close all open trades with a
market order when the last bar in the current day's session closes. It uses the command's
`immediately` parameter to exit all trades at the last bar's `close` instead of the `open`
of the next session's first bar.
Parameters:
comment (string) : (series string) Optional. Additional notes on the filled order. If the value is specified
and not an empty "string", the Strategy Tester and the chart show this text for the order
instead of the automatically generated exit identifier. The default is `na`.
alertMessage (string) : (series string) Optional. Custom text for the alert that fires when an order fills. If the
value is specified and not an empty "string", and the "Message" field of the "Create Alert"
dialog box contains the `{{strategy.order.alert_message}}` placeholder, the alert message
replaces the placeholder with this text. The default is `na`.
Returns: (void) The function does not return a usable value.
closeAtEndOfSession(entryId, comment, alertMessage)
A wrapper for the `strategy.close()` function designed to close specific open trades with a
market order when the last bar in the current day's session closes. It uses the command's
`immediately` parameter to exit the trades at the last bar's `close` instead of the `open`
of the next session's first bar.
Parameters:
entryId (string)
comment (string) : (series string) Optional. Additional notes on the filled order. If the value is specified
and not an empty "string", the Strategy Tester and the chart show this text for the order
instead of the automatically generated exit identifier. The default is `na`.
alertMessage (string) : (series string) Optional. Custom text for the alert that fires when an order fills. If the
value is specified and not an empty "string", and the "Message" field of the "Create Alert"
dialog box contains the `{{strategy.order.alert_message}}` placeholder, the alert message
replaces the placeholder with this text. The default is `na`.
Returns: (void) The function does not return a usable value.
sortinoRatio(interestRate, forceCalc)
Calculates the Sortino ratio of the strategy based on realized monthly returns.
Parameters:
interestRate (simple float) : (simple int/float) Optional. The *annual* "risk-free" return percentage to compare against
strategy returns. The default is 2, meaning it uses an annual benchmark of 2%.
forceCalc (bool) : (series bool) Optional. A value of `true` forces the function to calculate the ratio on the
current bar. If the value is `false`, the function calculates the ratio only on the latest
available bar for efficiency. The default is `false`.
Returns: (float) The Sortino ratio, which estimates the strategy's excess return per unit of
downside volatility.
sharpeRatio(interestRate, forceCalc)
Calculates the Sharpe ratio of the strategy based on realized monthly returns.
Parameters:
interestRate (simple float) : (simple int/float) Optional. The *annual* "risk-free" return percentage to compare against
strategy returns. The default is 2, meaning it uses an annual benchmark of 2%.
forceCalc (bool) : (series bool) Optional. A value of `true` forces the function to calculate the ratio on the
current bar. If the value is `false`, the function calculates the ratio only on the latest
available bar for efficiency. The default is `false`.
Returns: (float) The Sortino ratio, which estimates the strategy's excess return per unit of
total volatility.
Commission-aware Trade LabelsCommission-aware Trade Labels
Description:
This library provides an easy way to visualize take-profit and stop-loss levels on your chart, taking into account trading commissions. The library calculates and displays the net profit or loss, along with other useful information such as risk/reward ratio, shares, and position size.
Features:
Configurable take-profit and stop-loss prices or percentages.
Set entry amount or shares.
Calculates and displays the risk/reward ratio.
Shows net profit or loss, considering trading commissions.
Customizable label appearance.
Usage:
Add the script to your chart.
Create an Order object for take-profit and stop-loss with desired configurations.
Call target_label() and stop_label() methods for each order object.
Example:
target_order = Order.new(take_profit_price=27483, stop_loss_price=28000, shares=0.2)
stop_order = Order.new(stop_loss_price=29000, shares=1)
target_order.target_label()
stop_order.stop_label()
This script is a powerful tool for visualizing your trading strategy's performance and helps you make better-informed decisions by considering trading commissions in your profit and loss calculations.
Library "tradelabels"
entry_price(this)
Parameters:
this : Order object
@return entry_price
take_profit_price(this)
Parameters:
this : Order object
@return take_profit_price
stop_loss_price(this)
Parameters:
this : Order object
@return stop_loss_price
is_long(this)
Parameters:
this : Order object
@return entry_price
is_short(this)
Parameters:
this : Order object
@return entry_price
percent_to_target(this, target)
Parameters:
this : Order object
target : Target price
@return percent
risk_reward(this)
Parameters:
this : Order object
@return risk_reward_ratio
shares(this)
Parameters:
this : Order object
@return shares
position_size(this)
Parameters:
this : Order object
@return position_size
commission_cost(this, target_price)
Parameters:
this : Order object
@return commission_cost
target_price
net_result(this, target_price)
Parameters:
this : Order object
target_price : The target price to calculate net result for (either take_profit_price or stop_loss_price)
@return net_result
create_take_profit_label(this, prefix, size, offset_x, bg_color, text_color)
Parameters:
this
prefix
size
offset_x
bg_color
text_color
create_stop_loss_label(this, prefix, size, offset_x, bg_color, text_color)
Parameters:
this
prefix
size
offset_x
bg_color
text_color
create_entry_label(this, prefix, size, offset_x, bg_color, text_color)
Parameters:
this
prefix
size
offset_x
bg_color
text_color
create_line(this, target_price, line_color, offset_x, line_style, line_width, draw_entry_line)
Parameters:
this
target_price
line_color
offset_x
line_style
line_width
draw_entry_line
Order
Order
Fields:
entry_price : Entry price
stop_loss_price : Stop loss price
stop_loss_percent : Stop loss percent, default 2%
take_profit_price : Take profit price
take_profit_percent : Take profit percent, default 6%
entry_amount : Entry amount, default 5000$
shares : Shares
commission : Commission, default 0.04%
Katz Exploding PowerBand FilterUnderstanding the Katz Exploding PowerBand Filter (EPBF) v2.4
1. Indicator Overview
The Katz Exploding PowerBand Filter (EPBF) is an advanced technical indicator designed to identify moments of expanding bullish or bearish momentum, often referred to as "power." It operates as a standalone oscillator in a separate pane below the main price chart.
Its primary goal is to measure underlying market strength by calculating custom "Bull" and "Bear" power components. These components are then filtered through a versatile moving average and a dual signal line system to generate clear entry and exit signals. This indicator is not a simple momentum oscillator; it uses a unique calculation based on exponential envelopes of both price and squared price to derive its values.
2. On-Chart Lines and Components
The indicator pane consists of five main lines:
Bullish Component (Thick Green/Blue/Yellow/Gray Line): This is the core of the indicator. It represents the calculated bullish "power" or momentum in the market.
Bright Green: Indicates a strong, active long signal condition.
Blue: Shows the bull component is above the MA filter, but the filter itself is still pointing down—a potential sign of a reversal or weakening downtrend.
Yellow: A warning sign that bullish power is weakening and has fallen below the primary signal lines.
Gray: Represents neutral or insignificant bullish power.
Bearish Component (Thick Red/Purple/Yellow/Gray Line): This line represents the calculated bearish "power" or downward momentum.
Bright Red: Indicates a strong, active short signal condition.
Purple: Shows the bear component is above the MA filter, but the filter itself is still pointing down—a sign of potential trend continuation.
Yellow: A warning sign that bearish power is weakening.
Gray: Represents neutral or insignificant bearish power.
MA Filter (Purple Line): This is the main filter, calculated using the moving average type and length you select in the settings (e.g., HullMA, EMA). The Bull and Bear components are compared against this line to determine the underlying trend bias.
Signal Line 1 (Orange Line): A fast Exponential Moving Average (EMA) of the stronger power component. It acts as the first level of dynamic support or resistance for the power lines.
Signal Line 2 (Lime/Gray Line): A slower EMA that acts as a confirmation filter.
Lime Green: The line turns lime when it is rising and the faster Signal Line 1 is above it, indicating a confirmed bullish trend in momentum.
Gray: Indicates a neutral or bearish momentum trend.
3. On-Chart Symbols and Their Meanings
Various characters are plotted at the bottom of the indicator pane to provide clear, actionable signals.
L (Pre-Long Signal): The first sign of a potential long entry. It appears when the Bullish Component rises and crosses above both signal lines for the first time.
S (Pre-Short Signal): The first sign of a potential short entry. It appears when the Bearish Component rises and crosses above both signal lines for the first time.
▲ (Post-Long Signal): A stronger confirmation for a long entry. It appears with the 'L' signal only if the momentum trend is also confirmed bullish (i.e., the slower Signal Line 2 is lime green).
▼ (Post-Short Signal): A stronger confirmation for a short entry. It appears with the 'S' signal only if the momentum trend is confirmed bullish.
Exit / Take-Profit Symbols:
These symbols appear when a power component crosses below a line, suggesting that momentum is fading and it may be time to take profit.
⚠️ (Exit Signal 1): The Bull/Bear component has crossed below the main MA Filter. This is the first and most sensitive take-profit signal.
☣️ (Exit Signal 2): The Bull/Bear component has crossed below the faster Signal Line 1. This is a moderate take-profit signal.
🚼 (Exit Signal 3): The Bull/Bear component has crossed below the slower Signal Line 2. This is the slowest take-profit signal, suggesting the trend is more definitively exhausted.
4. Trading Strategy and Rules
Long Entry Rules:
Initial Signal: Wait for an L to appear at the bottom of the indicator. This confirms that bullish power is expanding.
Confirmation (Recommended): For a higher-probability trade, wait for a green ▲ symbol to appear. This confirms the underlying momentum trend aligns with the signal.
Entry: Enter a long (buy) position on the opening of the next candle after the signal appears.
Short Entry Rules:
Initial Signal: Wait for an S to appear at the bottom of the indicator. This confirms that bearish power is expanding.
Confirmation (Recommended): For a higher-probability trade, wait for a maroon ▼ symbol to appear. This confirms the underlying momentum trend aligns with the signal.
Entry: Enter a short (sell) position on the opening of the next candle after the signal appears.
Take Profit (TP) Rules:
The indicator provides three levels of take-profit signals. You can choose to exit your entire position or scale out at each level.
For a long trade, exit when you see ⚠️, ☣️, or 🚼 appear below the Bullish Component.
For a short trade, exit when you see ⚠️, ☣️, or 🚼 appear below the Bearish Component.
Stop Loss (SL) Rules:
The indicator does not provide an explicit stop loss. You must use your own risk management rules. Common methods include:
Swing High/Low: For a long position, place your stop loss below the most recent significant swing low on the price chart. For a short position, place it above the most recent swing high.
ATR-Based: Use an Average True Range (ATR) indicator to set a volatility-based stop loss.
Fixed Percentage: Risk a fixed percentage (e.g., 1-2%) of your account on the trade.
5. Disclaimer
This indicator is a tool for technical analysis and should not be considered financial advice. All trading involves significant risk, and past performance is not indicative of future results. The signals generated by this indicator are probabilistic and can result in losing trades. Always use proper risk management, such as setting a stop loss, and never risk more than you are willing to lose. It is recommended to backtest this indicator and use it in conjunction with other forms of analysis before trading with real capital. The indicator should only be used for educational purposes.
EAOBS by MIGVersion 1
1. Strategy Overview Objective: Capitalize on breakout movements in Ethereum (ETH) price after the Asian open pre-market session (7:00 PM–7:59 PM EST) by identifying high and low prices during the session and trading breakouts above the high or below the low.
Timeframe: Any (script is timeframe-agnostic, but align with session timing).
Session: Pre-market session (7:00 PM–7:59 PM EST, adjustable for other time zones, e.g., 12:00 AM–12:59 AM GMT).
Risk-Reward Ratios (R:R): Targets range from 1.2:1 to 5.2:1, with a fixed stop loss.
Instrument: Ethereum (ETH/USD or ETH-based pairs).
2. Market Setup Session Monitoring: Monitor ETH price action during the pre-market session (7:00 PM–7:59 PM EST), which aligns with the Asian market open (e.g., 9:00 AM–9:59 AM JST).
The script tracks the highest high and lowest low during this session.
Breakout Triggers: Buy Signal: Price breaks above the session’s high after the session ends (7:59 PM EST).
Sell Signal: Price breaks below the session’s low after the session ends.
Visualization: The session is highlighted on the chart with a white background.
Horizontal lines are drawn at the session’s high and low, extended for 30 bars, along with take-profit (TP) and stop-loss (SL) levels.
3. Entry Rules Long (Buy) Entry: Enter a long position when the price breaks above the session’s high price after 7:59 PM EST.
Entry price: Just above the session high (e.g., add a small buffer, like 0.1–0.5%, to avoid false breakouts, depending on volatility).
Short (Sell) Entry: Enter a short position when the price breaks below the session’s low price after 7:59 PM EST.
Entry price: Just below the session low (e.g., subtract a small buffer, like 0.1–0.5%).
Confirmation: Use a candlestick close above/below the breakout level to confirm the entry.
Optionally, add volume confirmation or a momentum indicator (e.g., RSI or MACD) to filter out weak breakouts.
Position Size: Calculate position size based on risk tolerance (e.g., 1–2% of account per trade).
Risk is determined by the stop-loss distance (10 points, as defined in the script).
4. Exit Rules Take-Profit Levels (in points, based on script inputs):TP1: 12 points (1.2:1 R:R).
TP2: 22 points (2.2:1 R:R).
TP3: 32 points (3.2:1 R:R).
TP4: 42 points (4.2:1 R:R).
TP5: 52 points (5.2:1 R:R).
Example for Long: If session high is 3000, TP levels are 3012, 3022, 3032, 3042, 3052.
Example for Short: If session low is 2950, TP levels are 2938, 2928, 2918, 2908, 2898.
Strategy: Scale out of the position (e.g., close 20% at TP1, 20% at TP2, etc.) or take full profit at a preferred TP level based on market conditions.
Stop-Loss: Fixed at 10 points from the entry.
Long SL: Session high - 10 points (e.g., entry at 3000, SL at 2990).
Short SL: Session low + 10 points (e.g., entry at 2950, SL at 2960).
Trailing Stop (Optional):After reaching TP2 or TP3, consider trailing the stop to lock in profits (e.g., trail by 10–15 points below the current price).
5. Risk Management per Trade: Limit risk to 1–2% of your trading account per trade.
Calculate position size: Account Size × Risk % ÷ (Stop-Loss Distance × ETH Price per Point).
Example: $10,000 account, 1% risk = $100. If SL = 10 points and 1 point = $1, position size = $100 ÷ 10 = 0.1 ETH.
Daily Risk Limit: Cap daily losses at 3–5% of the account to avoid overtrading.
Maximum Exposure: Avoid taking both long and short positions simultaneously unless using separate accounts or strategies.
Volatility Consideration: Adjust position size during high-volatility periods (e.g., major news events like Ethereum upgrades or macroeconomic announcements).
6. Trade Management Monitoring :Watch for breakouts after 7:59 PM EST.
Monitor price action near TP and SL levels using alerts or manual checks.
Trade Duration: Breakout lines extend for 30 bars (script parameter). Close trades if no TP or SL is hit within this period, or reassess based on market conditions.
Adjustments: If the market shows strong momentum, consider holding beyond TP5 with a trailing stop.
If the breakout fails (e.g., price reverses before TP1), exit early to minimize losses.
7. Additional Considerations Market Conditions: The 7:00 PM–7:59 PM EST session aligns with the Asian market open (e.g., Tokyo Stock Exchange open at 9:00 AM JST), which may introduce higher volatility due to Asian trading activity.
Avoid trading during low-liquidity periods or extreme volatility (e.g., major crypto news).
Check for upcoming events (e.g., Ethereum network upgrades, ETF decisions) that could impact price.
Backtesting: Test the strategy on historical ETH data using the session high/low breakouts for the 7:00 PM–7:59 PM EST window to validate performance.
Adjust TP/SL levels based on backtest results if needed.
Broker and Fees: Use a low-fee crypto exchange (e.g., Binance, Kraken, Coinbase Pro) to maximize R:R.
Account for trading fees and slippage in your position sizing.
Time zone Adjustment: Adjust session time input for your time zone (e.g., "0000-0059" for GMT).
Ensure your trading platform’s clock aligns with the script’s time zone (default: America/New_York).
8. Example Trade Scenario: Session (7:00 PM–7:59 PM EST) records a high of 3050 and a low of 3000.
Long Trade: Entry: Price breaks above 3050 (e.g., enter at 3051).
TP Levels: 3063 (TP1), 3073 (TP2), 3083 (TP3), 3093 (TP4), 3103 (TP5).
SL: 3040 (3050 - 10).
Position Size: For a $10,000 account, 1% risk = $100. SL = 11 points ($11). Size = $100 ÷ 11 = ~0.09 ETH.
Short Trade: Entry: Price breaks below 3000 (e.g., enter at 2999).
TP Levels: 2987 (TP1), 2977 (TP2), 2967 (TP3), 2957 (TP4), 2947 (TP5).
SL: 3010 (3000 + 10).
Position Size: Same as above, ~0.09 ETH.
Execution: Set alerts for breakouts, enter with limit orders, and monitor TPs/SL.
9. Tools and Setup Platform: Use TradingView to implement the Pine Script and visualize breakout levels.
Alerts: Set price alerts for breakouts above the session high or below the session low after 7:59 PM EST.
Set alerts for TP and SL levels.
Chart Settings: Use a 1-minute or 5-minute chart for precise session tracking.
Overlay the script to see high/low lines, TP levels, and SL levels.
Optional Indicators: Add RSI (e.g., avoid overbought/oversold breakouts) or volume to confirm breakouts.
10. Risk Warnings Crypto Volatility: ETH is highly volatile; unexpected news can cause rapid price swings.
False Breakouts: Breakouts may fail, especially in low-volume sessions. Use confirmation signals.
Leverage: Avoid high leverage (e.g., >5x) to prevent liquidation during volatile moves.
Session Accuracy: Ensure correct session timing for your time zone to avoid misaligned entries.
11. Performance Tracking Journaling :Record each trade’s entry, exit, R:R, and outcome.
Note market conditions (e.g., trending, ranging, news-driven).
Review: Weekly: Assess win rate, average R:R, and adherence to the plan.
Monthly: Adjust TP/SL or session timing based on performance.
ai quant oculusAI QUANT OCULUS
Version 1.0 | Pine Script v6
Purpose & Innovation
AI QUANT OCULUS integrates four distinct technical concepts—exponential trend filtering, adaptive smoothing, momentum oscillation, and Gaussian smoothing—into a single, cohesive system that delivers clear, objective buy and sell signals along with automatically plotted stop-loss and three profit-target levels. This mash-up goes beyond a simple EMA crossover or standalone TRIX oscillator by requiring confluence across trend, adaptive moving averages, momentum direction, and smoothed price action, reducing false triggers and focusing on high‐probability turning points.
How It Works & Why Its Components Matter
Trend Filter: EMA vs. Adaptive MA
EMA (20) measures the prevailing trend with fixed sensitivity.
Adaptive MA (also EMA-based, length 10) approximates a faster-responding moving average, standing in for a KAMA-style filter.
Bullish bias requires AMA > EMA; bearish bias requires AMA < EMA. This ensures signals align with both the underlying trend and a more nimble view of recent price action.
Momentum Confirmation: TRIX
Calculates a triple-smoothed EMA of price over TRIX Length (15), then converts it to a percentage rate-of-change oscillator.
Positive TRIX reinforces bullish entries; negative TRIX reinforces bearish entries. Using TRIX helps filter whipsaws by focusing on sustained momentum shifts.
Gaussian Price Smoother
Applies two back-to-back 5-period EMAs to the price (“gaussian” smoothing) to remove short-term noise.
Price above the smoothed line confirms strength for longs; below confirms weakness for shorts. This layer avoids entries on erratic spikes.
Confluence Signals
Buy Signal (isBull) fires only when:
AMA > EMA (trend alignment)
TRIX > 0 (momentum support)
Close > Gaussian (price strength)
Sell Signal (isBear) fires under the inverse conditions.
Requiring all three conditions simultaneously sharply reduces false triggers common to single-indicator systems.
Automatic Risk & Reward Plotting
On each new buy or sell signal (edge detection via not isBull or not isBear ), the script:
Stores entryPrice at the signal bar’s close.
Draws a stop-loss line at entry minus ATR(14) × Stop Multiplier (1.5) by default.
Plots three profit-target lines at entry plus ATR × Target Multiplier (1×, 1.5×, and 2×).
All previous labels and lines are deleted on each new signal, keeping the chart uncluttered and focusing only on the current trade.
Inputs & Customization
Input Description Default
EMA Length Period for the main trend EMA 20
Adaptive MA Length Period for the faster adaptive EM A substitute 10
TRIX Length Period for the triple-smoothed momentum oscillator 15
Dominant Cycle Length (Reserved) 40
Stop Multiplier ATR multiple for stop-loss distance 1.5
Target Multiplier ATR multiple for first profit target 1.5
Show Buy/Sell Signals Toggle on-chart labels for entry signals On
How to Use
Apply to Chart: Best on 15 m–1 h timeframes for swing entries or 5 m for agile scalps.
Wait for Full Confluence:
Look for the AMA to cross above/below the EMA and verify TRIX and Gaussian conditions on the same bar.
A bright “LONG” or “SHORT” label marks your entry.
Manage the Trade:
Place your stop where the red or green SL line appears.
Scale or exit at the three yellow TP1/TP2/TP3 lines, automatically drawn by volatility.
Repeat Cleanly: Each new signal clears prior annotations, ensuring you only track the active setup.
Why This Script Stands Out
Multi-Layer Confluence: Trend, momentum, and noise-reduction must all align, addressing the weaknesses of single-indicator strategies.
Automated Trade Management: No manual plotting—stop and target lines appear seamlessly with each signal.
Transparent & Customizable: All logic is open, adjustable, and clearly documented, allowing traders to tweak lengths and multipliers to suit different instruments.
Disclaimer
No indicator guarantees profit. Always backtest AI QUANT OCULUS extensively, combine its signals with your own analysis and risk controls, and practice sound money management before trading live.
TrailingStopLibraryLibrary "TrailingStopLibrary"
专业移动止盈库 - 为Pine Script策略提供完整的追踪止盈功能。支持做多做空双向交易,基于风险回报比智能激活,提供收盘价和高低价两种判断模式。包含完整的状态管理、调试信息和易用的API接口。适用于股票、外汇、加密货币等各种市场的风险管理。
@version 1.0
@author runto2006
new_config(enabled, activation_ratio, pullback_percent, price_type)
创建移动止盈配置对象
Parameters:
enabled (bool) : (bool) 是否启用移动止盈,默认true
activation_ratio (float) : (float) 激活盈亏比,默认4.0,表示盈利4倍止损距离时激活
pullback_percent (float) : (float) 回撤百分比,默认1.0,表示回撤1%时触发止盈
price_type (string) : (string) 价格类型,默认"close"。"close"=收盘价模式,"hl"=高低价模式
Returns: Config 配置对象
new_state()
创建移动止盈状态对象
Returns: State 初始化的状态对象
reset(state)
重置移动止盈状态
Parameters:
state (State) : (State) 要重置的状态对象
Returns: void
calc_activation_target(entry_price, stop_price, activation_ratio, is_long)
计算激活目标价格
Parameters:
entry_price (float) : (float) 入场价格
stop_price (float) : (float) 止损价格
activation_ratio (float) : (float) 激活盈亏比
is_long (bool) : (bool) 是否为多头持仓
Returns: float 激活目标价格,如果输入无效则返回na
get_check_price(price_type, is_long, for_activation)
获取用于判断的价格
Parameters:
price_type (string) : (string) 价格类型:"close"或"hl"
is_long (bool) : (bool) 是否为多头持仓
for_activation (bool) : (bool) 是否用于激活判断,影响高低价的选择方向
Returns: float 当前判断价格
check_activation(config, state, entry_price, stop_price, is_long, has_position)
检查是否应该激活移动止盈
Parameters:
config (Config) : (Config) 移动止盈配置
state (State) : (State) 移动止盈状态
entry_price (float) : (float) 入场价格
stop_price (float) : (float) 止损价格
is_long (bool) : (bool) 是否为多头持仓
has_position (bool) : (bool) 是否有持仓
Returns: bool 是否成功激活
update_tracking(config, state, is_long)
更新移动止盈的追踪价格
Parameters:
config (Config) : (Config) 移动止盈配置
state (State) : (State) 移动止盈状态
is_long (bool) : (bool) 是否为多头持仓
Returns: void
check_trigger(config, state, entry_price, is_long)
检查是否触发移动止盈
Parameters:
config (Config) : (Config) 移动止盈配置
state (State) : (State) 移动止盈状态
entry_price (float) : (float) 入场价格
is_long (bool) : (bool) 是否为多头持仓
Returns: bool 是否触发止盈
process(config, state, entry_price, stop_price, is_long, has_position)
一体化处理移动止盈逻辑
Parameters:
config (Config) : (Config) 移动止盈配置
state (State) : (State) 移动止盈状态
entry_price (float) : (float) 入场价格
stop_price (float) : (float) 止损价格
is_long (bool) : (bool) 是否为多头持仓
has_position (bool) : (bool) 是否有持仓
Returns: bool 是否触发止盈
get_trigger_price(config, state, is_long)
获取当前触发价格
Parameters:
config (Config) : (Config) 移动止盈配置
state (State) : (State) 移动止盈状态
is_long (bool) : (bool) 是否为多头持仓
Returns: float 触发价格,未激活时返回na
get_pullback_percent(config, state, entry_price, is_long)
计算当前回撤百分比
Parameters:
config (Config) : (Config) 移动止盈配置
state (State) : (State) 移动止盈状态
entry_price (float) : (float) 入场价格
is_long (bool) : (bool) 是否为多头持仓
Returns: float 当前回撤百分比,未激活时返回na
get_status_info(config, state, entry_price, is_long)
获取状态信息字符串(用于调试)
Parameters:
config (Config) : (Config) 移动止盈配置
state (State) : (State) 移动止盈状态
entry_price (float) : (float) 入场价格
is_long (bool) : (bool) 是否为多头持仓
Returns: string 详细的状态信息
Config
移动止盈配置对象
Fields:
enabled (series bool) : (bool) 是否启用移动止盈功能
activation_ratio (series float) : (float) 激活盈亏比 - 盈利达到止损距离的多少倍时激活追踪
pullback_percent (series float) : (float) 回撤百分比 - 从最优价格回撤多少百分比时触发止盈
price_type (series string) : (string) 价格判断类型 - "close"使用收盘价,"hl"使用高低价
State
移动止盈状态对象
Fields:
activated (series bool) : (bool) 是否已激活追踪止盈
highest_price (series float) : (float) 激活后记录的最高价格
lowest_price (series float) : (float) 激活后记录的最低价格
activation_target (series float) : (float) 激活目标价格