NAS Oracle AlgoThe NAS Oracle Algo is a powerful and versatile daily trading indicator designed to provide clear, automated support and resistance levels for both long and short trading strategies. By calculating a dynamic range based on the previous day's price action, it projects key entry points, stop-losses, and up to six profit targets onto your chart, giving you a complete roadmap for the trading day.
Key Features:
Dual-Sided Strategy: Generates independent levels for BUY and SELL setups, making it effective for both directional and range-bound markets.
Customizable Reference Point: Choose between using the current day's "Open" or the previous day's "Pre Close" as the base for all calculations.
Comprehensive Levels:
Entry Level: The price level to execute a trade.
Stop Loss: A predefined level to limit potential losses.
Profit Targets (1-6): Six incremental take-profit levels, allowing for partial profit-taking strategies.
Multiple Display Options:
Visual Levels & Labels: Clean horizontal lines and text labels are drawn directly on the chart for easy price reference.
Information Table: A highly customizable data table that summarizes all key levels, which can be positioned at the Top or Bottom of the chart and resized.
Flexible Configuration: Toggle the visibility of levels and choose to show either 3 or 6 profit targets to suit your trading style and avoid chart clutter.
How to Use:
Add the Indicator: Apply the "NAS Oracle Algo" to your chart. It works best on daily and intraday timeframes.
Configure Settings: In the indicator's settings, choose your preferred Option (Open/Pre Close), toggle levels and the table on/off, and adjust their position and size.
Interpret the Signals:
BUY Setup: When the price moves above the green "Buy Above" level, consider a long entry.
Stop Loss: Place your stop loss at the BUY_SL level.
Take Profit: Scale out of your position at the six progressively higher target levels (T1 to T6).
SELL Setup: When the price moves below the red "Sell Below" level, consider a short entry.
Stop Loss: Place your stop loss at the SELL_SL level.
스크립트에서 "entry"에 대해 찾기

BTST Stats BTST Statistical Edge Analyzer — VCR · Volume · SMA · RSI Filtered
This indicator isn’t a trading signal generator.
It’s a research framework designed to answer a simple but valuable question:
“Does Buy-Today-Sell-Tomorrow (BTST) have statistical edge under specific market conditions?”
Most traders assume BTST works because they feel markets gap.
This script measures whether that belief holds true — and under what filters.
🔍 What the Indicator Does
For each bar, the script simulates a BTST trade:
Entry: previous bar’s close
Exit: current bar’s open
Result: Open(next day) − Close(previous day)
But a BTST trade is only counted if the entry bar satisfies the filter logic.
🎯 Entry Filters You Can Tune
A trade is included only if ALL activated conditions are satisfied:
Filter Rule
VCR Filter Candle volatility ratio must exceed threshold: `(High−Low) /
Volume Filter Volume must be greater than n × AverageVolume
SMA Trend Filter (Optional) Close must be above a user-selected SMA length
RSI Condition (Optional) RSI must be between a user-defined min/max band
This allows testing BTST under different volatility, trend, and momentum conditions.
📊 What the Table Shows
For all qualifying trades inside the chosen lookback window, the indicator displays:
Metric Meaning
Profitable Trades Count of BTST trades with positive overnight return
Losing Trades Count of negative overnight returns
Avg Profit Average upside gain on winner trades
Avg Loss Average downside loss on losing trades
Avg Net per Trade Overall expectancy across all trades
Avg High After Entry Average maximum price movement above entry (potential upside)
Avg Low After Entry Average price movement against the entry (risk exposure)
Winner-Only High/Low Stats How far good trades move and how much heat they take
Loser-Only High/Low Stats How bad trades behave, including early fake-outs
Together, these reveal:
Opportunity potential
Risk exposure
Whether trades behave cleanly or chaotically
Whether exits are leaving money on the table
🧠 Why This Matters
BTST edges change drastically across:
Market regimes
Trend direction
Volatility clusters
Earnings cycles
Volume surges
This tool helps identify when BTST should be traded — and when it should be avoided entirely.
Rather than guessing, traders can:
Validate if their BTST assumptions hold,
Apply filters until the expectancy improves,
Rank symbols and conditions where the system performs best.
🚫 Not a Buy/Sell Indicator
This script does not place arrows, signals, alerts, or entries.
It exists for analysis and system development, not live execution.
Use it to:
Build ideas
Validate hypotheses
Compare symbols
Optimize BTST frameworks
Decide if BTST belongs in your playbook — or in the trash
🔧 Who This Is For
✔ System traders
✔ Quant-minded traders
✔ Options/Index traders who rely on gaps
✔ Swing traders testing overnight holds
✔ Developers building automated BTST logic
Final Thought
BTST isn’t magic — it’s just a behavior pattern.
Some markets reward it.
Some punish it.
Some reward it only under the right volatility and volume conditions.
This tool tells you which is which.

(CRT) MTF Candle Range Theory Model# 🚀 **CASH Pro MTF – Candle Range Theory (CRT) Indicator**
**The Smart Money ICT Setup Detector** 🔥
Hey Traders!
Here is the **ultimate Pine Script indicator** that automatically detects one of the most powerful Smart Money / ICT setups: **Candle Range Theory (CRT)**
---
### What is Candle Range Theory – CRT?
**CRT** is a high-probability price action model based on **liquidity grabs** and **range expansion**.
Price loves to:
1️⃣ Raid the low/high of the previous candle (take stop-losses)
2️⃣ Then reverse and run to the opposite side of the range (or beyond)
When this happens near a **key higher-timeframe level**, magic happens!
### Bullish CRT Model
- Price touches a **strong HTF support**
- Previous candle closes near that support
- Next candle **sweeps the low** (grabs liquidity)
- Current candle **closes above the raided low AND breaks the high** of the sweep candle
**Result → Aggressive bullish move expected!**
**Entry:** On close above the high (or on retest + MSS)
**Stop Loss:** Below the swept low
**Take Profit:** CRT High or next liquidity pool
### Bearish CRT Model
- Price touches a **strong HTF resistance**
- Previous candle closes near resistance
- Next candle **sweeps the high** (grabs buy stops)
- Current candle **closes below the raided high AND breaks the low** of the sweep candle
**Result → Strong bearish expansion!**
**Entry:** On close below the low
**Stop Loss:** Above the swept high
**Take Profit:** CRT Low or next downside liquidity
This whole setup can form in **just 3 candles**… or sometimes more if price consolidates after the sweep.
---
### Why This Indicator is Special
This is **NOT** a simple 3-candle pattern scanner!
This is a **true CRT + MTF confluence beast** with:
- **Multi-Timeframe Confirmation** (default 4H – fully customizable)
- **Built-in RSI Filter** (avoid fake moves in overbought/oversold)
- **Day-2 High/Low Levels** automatically drawn (the exact CRT range!)
- **Clean “LONG” / “SHORT” labels** right on the candle (no ugly arrows or offset)
- **Background highlight** on signal
- **Fully grouped inputs** – super clean settings panel
---
### Features at a Glance
| Feature | Included |
|--------------------------------|----------|
| Higher Timeframe Confirmation | Yes |
| RSI Overbought/Oversold Filter | Yes |
| Day-2 High/Low Lines + Labels | Yes |
| Clean Text Signals (no offset) | Yes |
| Background Highlight | Yes |
| Fully Customizable Colors & Text| Yes |
| Works on All Markets & TFs | Yes |
---
### How to Use
1. Add the indicator to your chart
2. Wait for a **LONG** or **SHORT** label to appear
3. Confirm price is near a **key HTF level** (order block, FVG, etc.)
4. Enter on close or retest (your choice)
5. Manage risk with the drawn Day-2 levels
**Pro Tip:** Combine with ICT Market Structure Shift (MSS) or Fair Value Gaps for even higher accuracy!

Universal Scalper Indicator [Crypto/Forex/Gold]Universal Scalper Pro is an all-in-one scalping system designed for the 15-Minute Timeframe. It automates the analysis of trend, volatility, and risk management into a single, high-contrast dashboard.
Unlike standard crossover indicators, this system filters out low-volatility "noise" using a built-in ADX engine and automatically calculates dynamic Stop Loss and Take Profit levels based on market volatility (ATR).
It is engineered to work universally on:
Crypto (BTC, ETH, SOL, Altcoins)
Commodities (Gold, Silver, Oil)
Forex (Major & Minor Pairs)
Stocks (High volume tech stocks like NVDA, TSLA)
📈 How It Works (The Strategy)
1. The Trend Engine (9/21 EMA) The core logic utilizes a Fast (9) and Slow (21) Exponential Moving Average crossover.
Bullish Signal: The 9 EMA crosses above the 21 EMA.
Bearish Signal: The 9 EMA crosses below the 21 EMA. This specific combination is chosen for its responsiveness to 15-minute intraday trends.
2. The Noise Filter (ADX > 15) To prevent "whipsaws" (fake signals during sideways markets), the script includes a Volatility Filter based on the Average Directional Index (ADX).
Signals are rejected if the ADX is below 15.
This ensures you only receive alerts when there is sufficient momentum to sustain a move.
3. Dynamic Risk Management (ATR) The script uses the Average True Range (ATR) to calculate Stop Loss and Take Profit levels that adapt to the specific asset's volatility.
Stop Loss: Placed at 1.5x ATR from the entry. (Tight enough to preserve capital, wide enough to survive standard market noise).
Take Profit: Placed at 2.0x ATR from the entry. (Provides a healthy 1:1.3 Risk/Reward ratio).
🚀 Key Features
Universal Dashboard: A bottom-right panel displays the live Trend Status, Entry Price, Stop Loss, and Take Profit. It automatically formats decimals for any asset (e.g., 2 decimals for Gold, 5 for Forex, 8 for Crypto).
"Sticky" Memory: The dashboard retains the prices of the last valid signal, allowing you to manage your trade even after the signal candle closes.
Trend Cloud: A visual Green/Red zone between the EMAs helps you instantly identify the market bias.
Unified Alerts: A single alert setup ("Any alert() function call") sends the Asset Name, Entry, SL, and TP directly to your phone.
🛠️ How to Use
Timeframe: Set your chart to 15 Minutes (15m).
Wait for the Signal: Look for the "BUY" (Green) or "SELL" (Red) label on the chart.
Check the Dashboard: Ensure the "STATUS" is BULLISH (for buys) or BEARISH (for sells). If the status says "WAIT", do not trade.
Execute: Enter the trade using the exact Stop Loss and Take Profit levels shown on the dashboard.
⚠️ Risk Disclaimer
Trading financial markets involves high risk and may not be suitable for all investors. This indicator is a technical analysis tool and does not constitute financial advice. Past performance is not indicative of future results. Always practice with a demo account before trading real capital.

Kalman Trend Sniper# KALMAN TREND SNIPER
## ORIGINALITY STATEMENT
The Kalman Trend Sniper combines adaptive trend detection with precision entry validation to identify high-probability trading opportunities. Unlike static moving averages that use fixed parameters, this indicator adapts to changing market volatility through ATR-based gain adjustment and distinguishes trending from ranging markets using ADX regime detection.
The indicator's unique contribution is its three-phase entry validation system: signals must hold for three bars, undergo a pullback test to the signal level, and receive confirmation through price action before generating an entry. This structured approach helps traders enter established trends at favorable retracement levels rather than chasing momentum.
---
## TECHNICAL METHODOLOGY
### Kalman Filter Implementation
This indicator implements an Alpha-Beta variant of the Kalman filter, a recursive algorithm that estimates trend from noisy price data:
1. Prediction: kf = kf + velocity
2. Error calculation: error = price - kf
3. Correction: kf = kf + gain * error
4. Velocity update: velocity = velocity + (gain * error) / 2
The gain parameter determines filter responsiveness. Higher gain values track price more closely but increase noise sensitivity, while lower values provide smoother output but lag price changes.
### Adaptive Gain Mechanism
The indicator adjusts gain dynamically based on volatility:
Volatility Factor = Current ATR / Long-term ATR
Adaptive Gain = Base Gain * (0.7 + 0.6 * Volatility Factor)
This ATR ratio increases responsiveness during high-volatility periods and reduces sensitivity during consolidations, addressing the fixed-parameter limitation of traditional moving averages. The volatility factor is bounded between configurable minimum and maximum values to prevent extreme adjustments.
### Regime Detection
The indicator uses the Average Directional Index (ADX) to distinguish market conditions:
- Trending markets (ADX above threshold): Full gain applied, signals generated
- Ranging markets (ADX below threshold): Gain reduced 25%, fewer signals
This regime awareness helps reduce whipsaw signals during sideways consolidation periods.
### Signal Line Validation System
When the Kalman line changes direction in trending conditions, the indicator draws a horizontal signal line at the low (for long signals) or high (for short signals) of the signal candle. This line represents a potential support or resistance level.
The validation system then monitors three phases:
Phase 1 - Hold Period: Price must remain above (long) or below (short) the signal line for three consecutive bars. This requirement filters weak signals where price immediately violates the signal level.
Phase 2 - Test: After the hold period, the system waits for price to pull back and touch the signal line, with configurable tolerance for volatile instruments.
Phase 3 - Confirmation: Within eight bars of the test, a confirmation candle must close above (long) or below (short) the test candle's body, demonstrating renewed momentum. If confirmation does not occur within eight bars, the validation attempt expires.
Successful validation generates an R label at the entry point. This three-phase structure helps identify entries where trend direction and support/resistance validation align.
---
## USAGE INSTRUCTIONS
### Signal Interpretation
Triangle Signals:
- Upward triangle (teal): Kalman line turns bullish in trending market (ADX above threshold)
- Downward triangle (red): Kalman line turns bearish in trending market
Signal Lines (horizontal):
- Teal line: Potential long support level at signal candle low
- Red line: Potential short resistance level at signal candle high
- Gray line: First opposite-color candle after signal (initial reversal pressure)
R Labels (optional, disabled by default):
- Green R below price: Validation complete for long entry
- Red R above price: Validation complete for short entry
Stop Levels:
- Red dots: Long stop level (Kalman line minus ATR multiplier)
- Teal dots: Short stop level (Kalman line plus ATR multiplier)
### Dashboard Information
The dashboard displays real-time indicator state:
- Trend: Current Kalman direction (BULL/BEAR)
- Regime: Market classification (Trending when ADX exceeds threshold, Ranging otherwise)
- Gain: Current adaptive gain value
- Vol Factor: Volatility ratio (current ATR / long-term ATR)
- ADX: Trend strength (higher values indicate stronger trends)
- Z-Score: Standard deviation distance from Kalman line (when enabled)
- Stop Dist: Current ATR-based stop distance
- Lines: Number of active signal lines displayed
- R-Status: Validation system state (Idle / Waiting / Testing)
### Trading Applications
Trend Following Approach:
1. Wait for triangle signal in trending market (ADX above threshold)
2. Enter immediately at signal candle close or wait for pullback
3. Place stop at displayed stop level
4. Trail stop using Kalman line as dynamic support/resistance
Validation Entry Approach (conservative):
1. After triangle signal, observe three-bar hold period
2. Wait for pullback to signal line (test phase)
3. Enter on R label confirmation
4. Place stop below/above signal line
5. Provides higher probability entries but reduces trade frequency
Z-Score Mean Reversion (when enabled):
1. Watch for Z-Score exceeding entry threshold (default +/-2.0)
2. Consider counter-trend entries when price touches Kalman line
3. Target return to Kalman line (Z-Score near zero)
4. Use Z-Score threshold as stop level for extreme continuation
### Optimal Conditions
The indicator performs optimally in clearly trending markets where ADX consistently exceeds the threshold. Performance degrades in sideways, choppy conditions.
Recommended timeframes:
- 1-5 minute charts: Use Crypto_1M preset (faster adaptation)
- 15-60 minute charts: Use Crypto_15M preset (balanced)
- Hourly charts: Use Forex preset (smoother)
- Daily charts: Use Stocks_Daily preset (long-term trends)
Market conditions:
- High volatility (Vol Factor above 1.5): Expect faster adaptation, wider stops needed
- Normal volatility (Vol Factor 0.7-1.5): Standard behavior
- Low volatility (Vol Factor below 0.7): Expect slower adaptation, tighter stops possible
---
## PARAMETER DOCUMENTATION
### Kalman Filter Settings
Preset Mode: Select optimized configuration for specific markets
- Custom: Manual parameter control
- Crypto_1M: Base Gain 0.05, ATR 7 (fast response for 1-5 minute crypto charts)
- Crypto_15M: Base Gain 0.03, ATR 14 (balanced for 15-60 minute crypto charts)
- Forex: Base Gain 0.02, ATR 14 (standard for forex pairs)
- Stocks_Daily: Base Gain 0.01, ATR 20 (smooth for daily stock charts)
Base Gain (0.001-0.2): Core Kalman filter responsiveness parameter. Higher values increase sensitivity to price changes. Low values (0.01-0.02) provide smooth output with fewer whipsaws but slower trend changes. High values (0.06-0.08) offer fast response with more signals but increased whipsaw risk.
Adaptive (checkbox): When enabled, automatically adjusts gain based on ATR ratio. Recommended to keep enabled for dynamic volatility adaptation.
ATR (5-50): Short-term Average True Range period for current volatility measurement. Default 14 is industry standard. Lower values respond faster to volatility changes.
Long ATR (20-200): Long-term ATR period for baseline volatility comparison. Default 50 provides stable reference. The ratio between ATR and Long ATR determines adaptive adjustment magnitude.
Regime Filter (checkbox): Enables ADX-based trending/ranging detection. When enabled, reduces gain by 25 percent during ranging markets to minimize false signals.
ADX Period (7-30): Period for ADX calculation. Default 14 is standard. Lower values respond faster to trend strength changes.
Threshold (15-40): ADX level distinguishing trending from ranging markets. Default 25. Above threshold: trending (generate signals normally). Below threshold: ranging (reduce sensitivity).
Min Vol / Max Vol (0.3-3.0): Bounds for volatility factor adjustment. Prevents extreme gain changes during unusual volatility spikes or quiet periods. Default minimum 0.5, maximum 2.0.
Stop ATR x (1.0-3.0): Multiplier for ATR-based stop loss distance. Default 2.0 places stops two ATRs from Kalman line. Use 1.5 for tight stops (intraday), 2.5-3.0 for wide stops (swing trading).
Show Signals (checkbox): Displays triangle signals when Kalman changes direction in trending markets. Disable to use indicator purely as dynamic support/resistance without signals.
Z-Score (checkbox): Enables mean-reversion signal generation based on statistical deviation from Kalman line.
Period (10-100): Lookback period for Z-Score standard deviation calculation. Default 20 bars. Longer periods produce smoother, less sensitive readings.
Entry (1.5-3.5): Standard deviation threshold for Z-Score signals. Default 2.0 generates signals at plus/minus two standard deviations (approximately 95th percentile moves).
Bull / Bear Colors: Customize Kalman line colors for uptrend (default teal) and downtrend (default red).
Fill (checkbox): Shows semi-transparent fill between price and Kalman line for visual trend emphasis.
### Signal Line System Settings
Signal Lines (checkbox): Displays horizontal signal lines at low (long) or high (short) of signal candles. These function as dynamic support/resistance levels.
Reverse Lines (checkbox): Shows gray horizontal lines at first opposite-colored candle after signal. Helps identify initial resistance points in new trends.
Max Lines (0-20): Maximum number of signal lines to display simultaneously. Older lines are removed as new signals appear. Use 1-2 for clean charts, 3-5 for recent support/resistance history.
Style (Solid/Dotted/Dashed): Visual style for signal and reverse lines. Dotted provides subtle appearance, solid is most prominent.
Line % / Label % (0-100): Transparency percentage for lines and labels. Zero is fully opaque, 100 is invisible.
R Labels (checkbox): Shows R labels when validation confirmation occurs. Default disabled. Enable if you want visual confirmation of successful pullback entries.
Tolerance % (0-1.0): Price deviation tolerance for test candle detection. Zero requires exact touch. 0.5 allows 0.5 percent deviation for volatile instruments.
### Dashboard Settings
Show Dashboard (checkbox): Toggles visibility of information panel. Disable for clean chart presentation.
Position: Choose dashboard location from nine positions (Top/Middle/Bottom combined with Left/Center/Right).
---
## LIMITATIONS AND WARNINGS
This indicator is a technical analysis tool that processes historical price data. It does not predict future price movements.
Inherent limitations:
1. Lagging nature: Like all trend indicators, the Kalman filter lags price. Signals occur after trend changes begin, not before.
2. Ranging markets: Generates fewer signals and reduced performance when ADX falls below threshold. Not optimized for sideways consolidation.
3. Whipsaw risk: In choppy, indecisive markets near ADX threshold, signals may reverse quickly despite regime filtering.
4. Parameter sensitivity: Inappropriate Base Gain settings can cause over-trading (too high) or missed trends (too low).
5. Validation requirement: The three-phase confirmation system provides higher accuracy but significantly reduces trade frequency. Not all trends produce valid pullback entries.
Not suitable for:
- Scalping strategies requiring instant signals (Kalman filter has intentional smoothing)
- Ultra-high frequency trading (indicator updates once per bar close)
- Markets with extreme overnight gaps (stops may be exceeded)
- Strategies requiring signals on Heikin Ashi, Renko, Kagi, Point and Figure, or Range charts
Risk management requirements:
This indicator provides trend direction and signal levels but does not incorporate position sizing, risk management, or account balance considerations. Users must implement appropriate position sizing, maximum daily loss limits, and portfolio diversification. Past performance does not indicate future results.
Optimal usage:
- Works optimally in clearly trending markets where ADX consistently exceeds threshold
- Performance degrades in sideways, choppy conditions
- Designed for swing trading and position trading timeframes (15-minute and above)
- Requires confirmation from price action or additional technical analysis
---
## NO REPAINT GUARANTEE
This indicator operates on bar close confirmation only. All signals, signal lines, and validation labels appear exclusively when candles close. Historical signals remain exactly where they appeared. This makes the indicator suitable for automated trading and reliable backtesting. What you see in historical data matches what appeared in real-time.
---
## ALERTS
The indicator provides eight alert conditions:
1. Kalman Buy Signal: Fires when upward triangle appears (bullish trend change in trending market)
2. Kalman Sell Signal: Fires when downward triangle appears (bearish trend change in trending market)
3. Trend Change to Bullish: Fires whenever Kalman line changes to bullish (regardless of ADX)
4. Trend Change to Bearish: Fires whenever Kalman line changes to bearish (regardless of ADX)
5. SCT-R Long Retest Confirmed: Fires when green R label appears for long validation
6. SCT-R Short Retest Confirmed: Fires when red R label appears for short validation
7. SCT Test Long Detected: Fires when test candle appears for long signal (before confirmation)
8. SCT Test Short Detected: Fires when test candle appears for short signal (before confirmation)
Alert messages include context about bar close confirmation and current price levels.
---
## CALCULATION TRANSPARENCY
While complete proprietary optimization methodology is not disclosed, the core technical approach is fully explained: Alpha-Beta Kalman filter with ATR-based adaptive gain adjustment and ADX regime detection. The signal line validation system uses a three-phase structure (hold, test, confirmation) with configurable parameters. Users can understand indicator functionality and make informed decisions about application.
---
## DISCLAIMER
This indicator is provided as a technical analysis tool. It does not constitute financial advice, trading recommendations, or performance guarantees. All trading decisions carry risk. Users are responsible for their own trading decisions and risk management. Past results do not indicate future performance.

True Market MeanTrue Market Mean (Optimized) - User Guide
📋 Overview
The True Market Mean (TMM) indicator is a sophisticated multi-timeframe market analysis tool that approximates the "true" market equilibrium price by combining perspectives from different market participants. It helps identify potential support/resistance levels and trend direction changes.
🎯 Concept
The TMM calculates a weighted average of four key market perspectives:
Realized Price - Long-term cost basis (350-period SMA)
Long-Term Holder Proxy - Very long-term perspective (1400-period EMA)
Short-Term Holder Proxy - Recent market activity (50-period WMA)
Momentum Proxy - Market sentiment and trend strength
⚙️ Input Parameters
Time Periods
Realized Price Period (350): Long-term cost basis calculation
Long-term Holder Period (1400): Very long-term market perspective
Short-term Holder Period (50): Recent price action
Momentum Period (200): Trend strength measurement
Weighting System
Base Weight Realized Price (0.35): Primary long-term anchor
Base Weight LTH (0.30): Long-term trend component
Base Weight STH (0.25): Short-term market activity
Base Weight Momentum (0.10): Trend strength influence
Features
Use Dynamic Weighting: Automatically adjusts weights based on market volatility
Show Information Table: Displays real-time data table
Show Alternative TMM: Shows secondary calculation method
📊 Interpretation
Primary Signals
Bullish Signal (Green Triangle ↑): Price crosses above TMM
Bearish Signal (Red Triangle ↓): Price crosses below TMM
Strong Signals: Solid colored triangles (strong conviction)
Weak Signals: Light colored triangles (weaker conviction)
Market States
Green Background: Price above TMM (bullish regime)
Red Background: Price below TMM (bearish regime)
Information Table
The table (top-right) shows:
Primary and Alternative TMM values
Current market status (BULLISH/BEARISH)
Price deviation from TMM (%)
TMM trend direction (RISING/FALLING)
Market volatility level (LOW/MEDIUM/HIGH)
🎨 Visual Elements
Lines
Orange Line: Primary TMM calculation
Purple Line: Alternative TMM calculation (if enabled)
Background
Light green: Bullish territory (price > TMM)
Light red: Bearish territory (price < TMM)
💡 Trading Applications
Trend Identification
Bullish Trend: Price consistently above rising TMM
Bearish Trend: Price consistently below falling TMM
Range-bound: Price oscillating around flat TMM
Support/Resistance
TMM often acts as dynamic support/resistance
Significant deviations from TMM may indicate overbought/oversold conditions
Entry/Exit Signals
Long Entry: Strong bullish signal with price above TMM
Short Entry: Strong bearish signal with price below TMM
Exit/Stop: Price crossing back below/above TMM
⚠️ Risk Management
Use TMM in conjunction with other indicators
Consider volatility levels when interpreting signals
Strong signals in high volatility may be more significant
Always use proper stop-losses
🔧 Customization Tips
For Day Trading
Reduce all periods (e.g., 50, 200, 20, 50)
Increase STH weight for more sensitivity
For Swing Trading
Use default periods
Balanced weights work well
For Long-term Investing
Increase LTH and Realized Price periods
Give more weight to long-term components
Volatility Adjustments
In high volatility markets, dynamic weighting automatically emphasizes momentum
In low volatility, long-term components dominate
📈 Performance Tips
Best Timeframes: 4H, Daily, Weekly for reliable signals
Asset Classes: Works well with stocks, crypto, forex
Market Conditions: Effective in both trending and ranging markets
Confirmation: Combine with volume analysis for stronger signals
🚀 Advanced Features
Dynamic Weighting
When enabled, the indicator automatically:
Increases momentum weight during high volatility
Emphasizes long-term components in stable markets
Adapts to changing market conditions
Alternative TMM
The purple line uses price deviation instead of momentum rate-of-change, providing:
Different sensitivity to market moves
Additional confirmation of primary signals
Alternative perspective on market equilibrium
❗❗❗ Limitations❗❗❗
Lagging indicator (based on moving averages)
Works best in conjunction with other tools
May give false signals during low-volume periods
Requires parameter optimization for different assets
🔄 Optimization
Experiment with:
Period lengths based on your trading style
Weight distributions for different market conditions
Enabling/disabling alternative TMM based on preference
Table display based on screen space

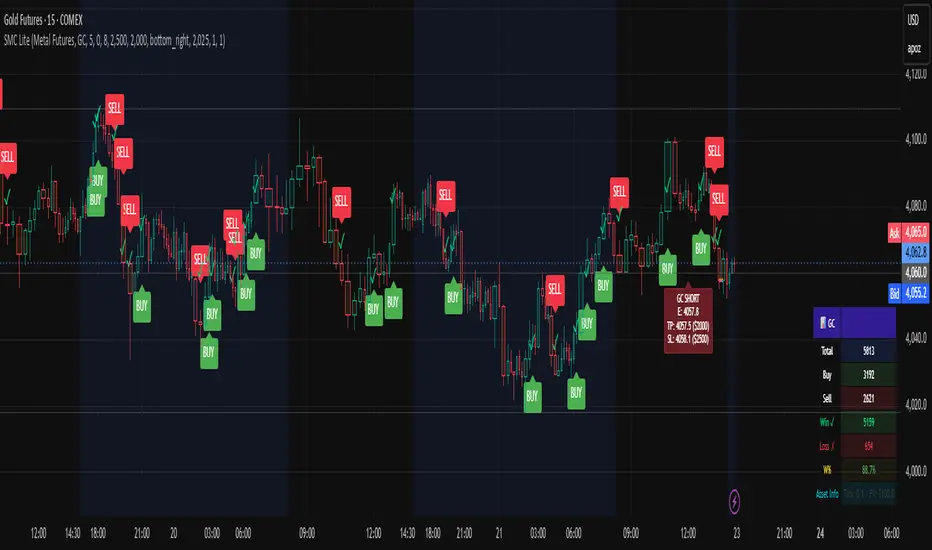
RAFA's SMC Killer LITEWhat is the SMC Killer?
The Smart Money Concepts (SMC) Killer is a trading indicator that identifies high-probability entry points using three proven strategies:
Break of Structure (BOS) - Trades when price breaks key support/resistance levels
Fair Value Gap (FVG) - Enters when price fills gaps in the market
Order Blocks (OB) - Entry from institutional order clusters (optional display)
This indicator automatically:
✅ Calculates correct entry, take-profit, and stop-loss levels for your asset
✅ Tracks win/loss statistics in real-time
✅ Works on 30+ different futures contracts
✅ Adapts tick size and point value automatically
Asset Selection
Supported Assets
The indicator supports all major futures contracts:
Equity Futures:
ES (E-mini S&P 500)
NQ (E-mini NASDAQ 100)
YM (Mini Dow Jones)
NKD (Nikkei 225)
EMD (E-mini Midcap 400)
RTY (Russell 2000)
Currency Futures:
6A (Australian Dollar)
6B (British Pound)
6C (Canadian Dollar)
6E (Euro FX)
6J (Japanese Yen)
6S (Swiss Franc)
6N (New Zealand Dollar)
Agricultural Futures:
HE (Lean Hogs)
LE (Live Cattle)
GF (Feeder Cattle)
ZC (Corn)
ZW (Wheat)
ZS (Soybeans)
ZM (Soybean Meal)
ZL (Soybean Oil)
Energy Futures:
CL (Crude Oil)
QM (Mini Crude Oil)
NG (Natural Gas)
QG (E-mini Natural Gas)
HO (Heating Oil)
RB (RBOB Gasoline)
Metal Futures:
GC (Gold)
SI (Silver)
HG (Copper)
PL (Platinum)
PA (Palladium)
QI (E-mini Silver)
QO (E-mini Gold)
Micro Futures:
MES (Micro E-mini S&P 500)
MYM (Micro E-mini Dow Jones)
MNQ (Micro E-mini NASDAQ)
M2K (Micro Russell 2000)
MGC (E-Micro Gold)
M6A (E-Micro AUD/USD)
M6E (E-Micro EUR/USD)
MCL (Micro Crude Oil)
How to Select Your Asset
Open the indicator settings (click ⚙️)
Go to ASSET SELECT section
Select Asset Category (e.g., "Metal Futures")
Enter Select Asset Symbol (e.g., "GC" for Gold)
Click OK
The indicator will automatically load the correct:
✅ Tick size
✅ Point value
✅ Risk/reward calculations
Settings Configuration
ASSET SELECT Group
Asset Category: Choose from 6 categories
Select Asset Symbol: Enter symbol (ES, GC, CL, etc.)
STRUCTURE Group
Show Swing Structure: Display swing highs/lows
Swing Length: Bars used for pivot detection (default: 5)
Build Sweep: Show sweep formations (default: ON)
What it does: Identifies the market trend and key turning points
Teal/Green bars = Uptrend
Orange/Red bars = Downtrend
FVG Group
Enable FVG Entry: Use Fair Value Gap strategy
FVG Threshold: Sensitivity filter (default: 0)
What it does: Detects gaps in price action that indicate imbalance
Lower threshold = More signals
Higher threshold = Fewer, high-quality signals
RISK Group
Show Bracket: Display entry/TP/SL lines
Units/Contracts: Number of contracts to trade (default: 6)
Stop Loss ($): Risk amount per trade (default: $250)
Target ($): Profit target per trade (default: $1,000)
Example: If you select ES with $250 stop loss:
The indicator calculates: 250 ÷ (6 contracts × $50 per point) = 0.83 points
Your stop loss line appears 0.83 points below entry
TABLE Group
Show Statistics: Display results table
Position: Table location (default: top_right)
Year: Start tracking from this year
Month: Start tracking from this month
Day: Start tracking from this day
Trading Signals
BUY Signal 🟢
When you see a green "BUY" label below a candle:
Price is breaking higher (Break of Structure)
OR price is filling a gap (Fair Value Gap)
The indicator plots three lines:
Green line = Entry price
Lime/bright green line = Take Profit level
Red line = Stop Loss level
Action: Consider entering a LONG position at market or entry price
SELL Signal 🔴
When you see a red "SELL" label above a candle:
Price is breaking lower (Break of Structure)
OR price is filling a gap (Fair Value Gap)
The indicator plots three lines:
Red line = Entry price
Magenta/pink line = Take Profit level
Orange line = Stop Loss level
Action: Consider entering a SHORT position at market or entry price
Signal Confirmation
✅ Wait for confirmation - Only trade signals on confirmed (closed) bars
✅ Check the trend - Look at candle colors (green uptrend, orange downtrend)
✅ Risk/reward ratio - TP should be at least 2x your SL risk
Risk Management
Position Sizing Example
Trading Gold (GC) with ES Settings:
Units: 6 contracts
Stop Loss: $250
Target: $1,000
Tick Size: 0.1 (automatic for GC)
Point Value: $100 per point (automatic for GC)
Risk per trade: $250
Reward per trade: $1,000
Risk/Reward Ratio: 1:4 (Excellent!)
Stop Loss Strategy
Always place your stop loss below/above the entry lines
The red/orange line shows exactly where to place SL
Never move your stop loss against the trade (unless scaling)
Use hard stops - set them immediately upon entry
Take Profit Strategy
Take profits at the lime/magenta line (TP level)
Consider taking partial profits at 50% of target
Let remaining 50% run to full target
Use trailing stops if price moves in your favor
Risk Per Trade
Formula: (Stop Loss $) ÷ (Units × Point Value)
Example for ES:
Stop Loss: $250
Units: 6
Point Value: $50
Risk per point: 250 ÷ (6 × 50) = 0.83 points
Reading the Chart
Visual Elements
Candle Colors:
🟩 Green/Teal = Uptrend (higher highs and higher lows)
🟥 Orange/Red = Downtrend (lower highs and lower lows)
Signal Labels:
BUY (Green) = Long entry opportunity
SELL (Red) = Short entry opportunity
Bracket Lines:
Entry Line (Solid) = Your entry price
TP Line (Bright color) = Take profit target
SL Line (Red/Orange) = Stop loss level
Success Markers:
✓ (Green checkmark) = Trade hit TP (WIN)
✗ (Red X) = Trade hit SL (LOSS)
Statistics Table
What Each Column Means
📊 ← Current asset being traded
├── Total: Total signals generated (buys + sells)
├── Buy: Number of buy signals
├── Sell: Number of sell signals
├── Win ✓: Trades that hit take profit
├── Loss ✗: Trades that hit stop loss
├── W%: Win rate percentage (wins ÷ total trades)
└── Asset Info: Tick size and point value
Example Reading
📊 ES
Total: 15
Buy: 8
Sell: 7
Win ✓: 10
Loss ✗: 5
W%: 66.7%
Asset Info: Tick: 0.25 | PV: $50
This means:
15 total signals since tracking started
10 wins, 5 losses
66.7% win rate (Professional level!)
Trading ES with 0.25 tick and $50 point value
Trading Examples
Example 1: Gold (GC) Long Trade
Setup:
Asset: Metal Futures → GC
Stop Loss: $150
Target: $600
Units: 2 contracts
What happens:
You see a BUY label on a green candle
Entry line at 2050.0
TP line at 2050.6 (0.6 points higher = $600 profit)
SL line at 2049.85 (0.15 points lower = $150 loss)
Risk/Reward: 1:4 ✅
Trade Result:
Price moves to 2050.6 → Label shows ✓ = WIN
Table updates: Wins increases by 1, Win% increases
Example 2: Crude Oil (CL) Short Trade
Setup:
Asset: Energy Futures → CL
Stop Loss: $500
Target: $2,000
Units: 1 contract
What happens:
You see a SELL label on a red candle
Entry line at 78.50
TP line at 77.50 (1.00 lower = $1,000 profit)
SL line at 79.00 (0.50 higher = $500 loss)
Risk/Reward: 1:2 ✅
Trade Result:
Price drops to 77.50 → Label shows ✓ = WIN
Table updates: Wins increases by 1, Win% increases
Example 3: E-mini S&P (ES) Day Trading
Setup:
Asset: Equity Futures → ES
Stop Loss: $250
Target: $1,000
Units: 6 contracts
Swap Length: 5 (default)
Enable FVG: ON
Morning Session:
See BUY at 5860.25 (swing break)
Hit TP at 5861.08 = WIN ✓
Table shows: Total 1, Buy 1, Win 1, W% 100%
See SELL at 5861.50 (FVG entry)
Hit SL at 5860.67 = LOSS ✗
Table shows: Total 2, Sell 1, Win 1, L% 50%
By end of day: 4 wins, 1 loss, 80% win rate
Troubleshooting
Issue 1: No signals appearing
Solution:
Check if both Show Bracket is ON
Check if Enable FVG Entry is ON
Try changing Swing Length (lower = more signals)
Ensure you're on a 1-hour or higher timeframe
Check chart has enough data (scroll left to see history)
Issue 2: Signals appear but no entry lines
Solution:
Confirm Show Bracket is toggled ON
Check Stop Loss ()andTarget() and Target (
)andTarget() are reasonable amounts
Ensure your Units value is not 0
Try refreshing the chart
Issue 3: Asset not recognized
Solution:
Check spelling of symbol (ES, not E-S)
Verify asset is in the supported list
Check you're in the correct category
Try closing and reopening the chart
Issue 4: Wrong stop loss/target levels
Solution:
Verify correct asset is selected
Check Units setting matches your position size
Verify Stop Loss ($) and Target ($) amounts
Look at Asset Info in table to confirm tick size
Manually calculate: SL $ ÷ (Units × Point Value) = Points
Issue 5: Statistics table not showing
Solution:
Toggle Show Statistics OFF then back ON
Try changing Table Position
Refresh the chart
Check that Show Table is enabled in settings
Issue 6: Indicator acting "heavy" or laggy
Solution:
Turn off Show Swing Structure if not needed
Turn off Show Bracket if reviewing historical trades
Reduce chart's data window (don't load entire years)
Refresh the chart
Pro Tips 🚀
Tip 1: Start with Micro Futures
Micro contracts (MES, MNQ, MCL) have lower cost
Perfect for learning the strategy
Same quality signals, smaller risk
Tip 2: Trade During Peak Hours
Equity Futures: 9:30-16:00 ET (Regular session)
Energy: 18:00-16:00 CT (After hours active)
Metals: 18:00-17:00 CT (Most liquid)
Currencies: 5:00 PM - 4:00 PM ET (24-5 market)
Tip 3: Combine Timeframes
Look for entry on 1-hour chart
Confirm on 15-minute chart
Execute on 5-minute breakout
More confluence = higher probability
Tip 4: Track Your Trades
Keep notes on WIN/LOSS trades
Identify patterns in your losses
Adjust settings based on performance
Use Win% table to monitor improvement
Tip 5: Risk Management First
Never risk more than 2% of account per trade
Respect your stop loss (don't move it)
Take profits when levels are hit
Be patient for high-probability setups
Tip 6: Adjust for Market Conditions
Trending markets: Increase Swing Length (6-8)
Choppy markets: Decrease Swing Length (2-4)
Low volatility: Reduce Stop Loss $
High volatility: Increase Target $
Quick Reference Card
────────────────────────────────────────────────────
SMC KILLER QUICK START ─────────────────────────────────────────────────────
│ 1. Select Asset Category & Symbol
│ 2. Set Units (contracts)
│ 3. Set Stop Loss ($) - your max risk
│ 4. Set Target ($) - your profit goal
│ 5. Wait for BUY (green) or SELL (red) signal
│ 6. Place entry at the entry line
│ 7. Place stop at the red/orange line
│ 8. Place take-profit at the lime/magenta line
│ 9. Close trade when line closes (✓ or ✗)
│ 10. Review statistics and adjust next trade
└─────────────────────────────────────────────────────
BUY Signal = Break Higher OR Fill Gap = LONG
SELL Signal = Break Lower OR Fill Gap = SHORT
Green candles = Uptrend
Orange candles = Downtrend
✓ = Win (took profit)
✗ = Loss (hit stop)
Support & Updates
Check settings are correct for your asset
Ensure adequate chart data is loaded
Test on demo account first
Start with smallest position size
Track performance over 20+ trades
Bifurcation Zone - CAEBifurcation Zone — Cognitive Adversarial Engine (BZ-CAE)
Bifurcation Zone — CAE (BZ-CAE) is a next-generation divergence detection system enhanced by a Cognitive Adversarial Engine that evaluates both sides of every potential trade before presenting signals. Unlike traditional divergence indicators that show every price-oscillator disagreement regardless of context, BZ-CAE applies comprehensive market-state intelligence to identify only the divergences that occur in favorable conditions with genuine probability edges.
The system identifies structural bifurcation points — critical junctures where price and momentum disagree, signaling potential reversals or continuations — then validates these opportunities through five interconnected intelligence layers: Trend Conviction Scoring , Directional Momentum Alignment , Multi-Factor Exhaustion Modeling , Adversarial Validation , and Confidence Scoring . The result is a selective, context-aware signal system that filters noise and highlights high-probability setups.
This is not a "buy the arrow" indicator. It's a decision support framework that teaches you how to read market state, evaluate divergence quality, and make informed trading decisions based on quantified intelligence rather than hope.
What Sets BZ-CAE Apart: Technical Architecture
The Problem With Traditional Divergence Indicators
Most divergence indicators operate on a simple rule: if price makes a higher high and RSI makes a lower high, show a bearish signal. If price makes a lower low and RSI makes a higher low, show a bullish signal. This creates several critical problems:
Context Blindness : They show counter-trend signals in powerful trends that rarely reverse, leading to repeated losses as you fade momentum.
Signal Spam : Every minor price-oscillator disagreement generates an alert, overwhelming you with low-quality setups and creating analysis paralysis.
No Quality Ranking : All signals are treated identically. A marginal divergence in choppy conditions receives the same visual treatment as a high-conviction setup at a major exhaustion point.
Single-Sided Evaluation : They ask "Is this a good long?" without checking if the short case is overwhelmingly stronger, leading you into obvious bad trades.
Static Configuration : You manually choose RSI 14 or Stochastic 14 and hope it works, with no systematic way to validate if that's optimal for your instrument.
BZ-CAE's Solution: Cognitive Adversarial Intelligence
BZ-CAE solves these problems through an integrated five-layer intelligence architecture:
1. Trend Conviction Score (TCS) — 0 to 1 Scale
Most indicators check if ADX is above 25 to determine "trending" conditions. This binary approach misses nuance. TCS is a weighted composite metric:
Formula : 0.35 × normalize(ADX, 10, 35) + 0.35 × structural_strength + 0.30 × htf_alignment
Structural Strength : 10-bar SMA of consecutive directional bars. Captures persistence — are bulls or bears consistently winning?
HTF Alignment : Multi-timeframe EMA stacking (20/50/100/200). When all EMAs align in the same direction, you're in institutional trend territory.
Purpose : Quantifies how "locked in" the trend is. When TCS exceeds your threshold (default 0.80), the system knows to avoid counter-trend trades unless other factors override.
Interpretation :
TCS > 0.85: Very strong trend — counter-trading is extremely high risk
TCS 0.70-0.85: Strong trend — favor continuation, require exhaustion for reversals
TCS 0.50-0.70: Moderate trend — context matters, both directions viable
TCS < 0.50: Weak/choppy — reversals more viable, range-bound conditions
2. Directional Momentum Alignment (DMA) — ATR-Normalized
Formula : (EMA21 - EMA55) / ATR14
This isn't just "price above EMA" — it's a regime-aware momentum gauge. The same $100 price movement reads completely differently in high-volatility crypto versus low-volatility forex. By normalizing with ATR, DMA adapts its interpretation to current market conditions.
Purpose : Quantifies the directional "force" behind current price action. Positive = bullish push, negative = bearish push. Magnitude = strength.
Interpretation :
DMA > 0.7: Strong bullish momentum — bearish divergences risky
DMA 0.3 to 0.7: Moderate bullish bias
DMA -0.3 to 0.3: Balanced/choppy conditions
DMA -0.7 to -0.3: Moderate bearish bias
DMA < -0.7: Strong bearish momentum — bullish divergences risky
3. Multi-Factor Exhaustion Modeling — 0 to 1 Probability
Single-metric exhaustion detection (like "RSI > 80") misses complex market states. BZ-CAE aggregates five independent exhaustion signals:
Volume Spikes : Current volume versus 50-bar average
2.5x average: 0.25 weight
2.0x average: 0.15 weight
1.5x average: 0.10 weight
Divergence Present : The fact that a divergence exists contributes 0.30 weight — structural momentum disagreement is itself an exhaustion signal.
RSI Extremes : Captures oscillator climax zones
RSI > 80 or < 20: 0.25 weight
RSI > 75 or < 25: 0.15 weight
Pin Bar Detection : Identifies rejection candles (2:1 wick-to-body ratio, indicating failed breakout attempts): 0.15 weight
Extended Runs : Consecutive bars above/below EMA20 without pullback
30+ bars: 0.15 weight (market hasn't paused to consolidate)
Total exhaustion score is the sum of all applicable weights, capped at 1.0.
Purpose : Detects when strong trends become vulnerable to reversal. High exhaustion can override trend filters, allowing counter-trend trades at genuine turning points that basic indicators would miss.
Interpretation :
Exhaustion > 0.75: High probability of climax — yellow background shading alerts you visually
Exhaustion 0.50-0.75: Moderate overextension — watch for confirmation
Exhaustion < 0.50: Fresh move — trend can continue, counter-trend trades higher risk
4. Adversarial Validation — Game Theory Applied to Trading
This is BZ-CAE's signature innovation. Before approving any signal, the engine quantifies BOTH sides of the trade simultaneously:
For Bullish Divergences , it calculates:
Bull Case Score (0-1+) :
Distance below EMA20 (pullback quality): up to 0.25
Bullish EMA alignment (close > EMA20 > EMA50): 0.25
Oversold RSI (< 40): 0.25
Volume confirmation (> 1.2x average): 0.25
Bear Case Score (0-1+) :
Price below EMA50 (structural weakness): 0.30
Very oversold RSI (< 30, indicating knife-catching): 0.20
Differential = Bull Case - Bear Case
If differential < -0.10 (default threshold), the bear case is dominating — signal is BLOCKED or ANNOTATED.
For Bearish Divergences , the logic inverts (Bear Case vs Bull Case).
Purpose : Prevents trades where you're fighting obvious strength in the opposite direction. This is institutional-grade risk management — don't just evaluate your trade, evaluate the counter-trade simultaneously.
Why This Matters : You might see a bullish divergence at a local low, but if price is deeply below major support EMAs with strong bearish momentum, you're catching a falling knife. The adversarial check catches this and blocks the signal.
5. Confidence Scoring — 0 to 1 Quality Assessment
Every signal that passes initial filters receives a comprehensive quality score:
Formula :
0.30 × normalize(TCS) // Trend context
+ 0.25 × normalize(|DMA|) // Momentum magnitude
+ 0.20 × pullback_quality // Entry distance from EMA20
+ 0.15 × state_quality // ADX + alignment + structure
+ 0.10 × divergence_strength // Slope separation magnitude
+ adversarial_bonus (0-0.30) // Your side's advantage
Purpose : Ranks setup quality for filtering and position sizing decisions. You can set a minimum confidence threshold (default 0.35) to ensure only quality setups reach your chart.
Interpretation :
Confidence > 0.70: Premium setup — consider increased position size
Confidence 0.50-0.70: Good quality — standard size
Confidence 0.35-0.50: Acceptable — reduced size or skip if conservative
Confidence < 0.35: Marginal — blocked in Filtering mode, annotated in Advisory mode
CAE Operating Modes: Learning vs Enforcement
Off : Disables all CAE logic. Raw divergence pipeline only. Use for baseline comparison.
Advisory : Shows ALL signals regardless of CAE evaluation, but annotates signals that WOULD be blocked with specific warnings (e.g., "Bull: strong downtrend (TCS=0.87)" or "Adversarial bearish"). This is your learning mode — see CAE's decision logic in action without missing educational opportunities.
Filtering : Actively blocks low-quality signals. Only setups that pass all enabled gates (Trend Filter, Adversarial Validation, Confidence Gating) reach your chart. This is your live trading mode — trust the system to enforce discipline.
CAE Filter Gates: Three-Layer Protection
When CAE is enabled, signals must pass through three independent gates (each can be toggled on/off):
Gate 1: Strong Trend Filter
If TCS ≥ tcs_threshold (default 0.80)
And signal is counter-trend (bullish in downtrend or bearish in uptrend)
And exhaustion < exhaustion_required (default 0.50)
Then: BLOCK signal
Logic: Don't fade strong trends unless the move is clearly overextended
Gate 2: Adversarial Validation
Calculate both bull case and bear case scores
If opposing case dominates by more than adv_threshold (default 0.10)
Then: BLOCK signal
Logic: Avoid trades where you're fighting obvious strength in the opposite direction
Gate 3: Confidence Gating
Calculate composite confidence score (0-1)
If confidence < min_confidence (default 0.35)
Then: In Filtering mode, BLOCK signal; in Advisory mode, ANNOTATE with warning
Logic: Only take setups with minimum quality threshold
All three gates work together. A signal must pass ALL enabled gates to fire.
Visual Intelligence System
Bifurcation Zones (Supply/Demand Blocks)
When a divergence signal fires, BZ-CAE draws a semi-transparent box extending 15 bars forward from the signal pivot:
Demand Zones (Bullish) : Theme-colored box (cyan in Cyberpunk, blue in Professional, etc.) labeled "Demand" — marks where smart money likely placed buy orders as price diverged at the low.
Supply Zones (Bearish) : Theme-colored box (magenta in Cyberpunk, orange in Professional) labeled "Supply" — marks where smart money likely placed sell orders as price diverged at the high.
Theory : Divergences represent institutional disagreement with the crowd. The crowd pushed price to an extreme (new high or low), but momentum (oscillator) is waning, indicating smart money is taking the opposite side. These zones mark order placement areas that become future support/resistance.
Use Cases :
Exit targets: Take profit when price returns to opposite-side zone
Re-entry levels: If price returns to your entry zone, consider adding
Stop placement: Place stops just beyond your zone (below demand, above supply)
Auto-Cleanup : System keeps the last 20 zones to prevent chart clutter.
Adversarial Bar Coloring — Real-Time Market Debate Heatmap
Each bar is colored based on the Bull Case vs Bear Case differential:
Strong Bull Advantage (diff > 0.3): Full theme bull color (e.g., cyan)
Moderate Bull Advantage (diff > 0.1): 50% transparency bull
Neutral (diff -0.1 to 0.1): Gray/neutral theme
Moderate Bear Advantage (diff < -0.1): 50% transparency bear
Strong Bear Advantage (diff < -0.3): Full theme bear color (e.g., magenta)
This creates a real-time visual heatmap showing which side is "winning" the market debate. When bars flip from cyan to magenta (or vice versa), you're witnessing a shift in adversarial advantage — a leading indicator of potential momentum changes.
Exhaustion Shading
When exhaustion score exceeds 0.75, the chart background displays a semi-transparent yellow highlight. This immediate visual warning alerts you that the current move is at high risk of reversal, even if trend indicators remain strong.
Visual Themes — Six Aesthetic Options
Cyberpunk : Cyan/Magenta/Yellow — High contrast, neon aesthetic, excellent for dark-themed trading environments
Professional : Blue/Orange/Green — Corporate color palette, suitable for presentations and professional documentation
Ocean : Teal/Red/Cyan — Aquatic palette, calming for extended monitoring sessions
Fire : Orange/Red/Coral — Warm aggressive colors, high energy
Matrix : Green/Red/Lime — Code aesthetic, homage to classic hacker visuals
Monochrome : White/Gray — Minimal distraction, maximum focus on price action
All visual elements (signal markers, zones, bar colors, dashboard) adapt to your selected theme.
Divergence Engine — Core Detection System
What Are Divergences?
Divergences occur when price action and momentum indicators disagree, creating structural tension that often resolves in a change of direction:
Regular Divergence (Reversal Signal) :
Bearish Regular : Price makes higher high, oscillator makes lower high → Potential trend reversal down
Bullish Regular : Price makes lower low, oscillator makes higher low → Potential trend reversal up
Hidden Divergence (Continuation Signal) :
Bearish Hidden : Price makes lower high, oscillator makes higher high → Downtrend continuation
Bullish Hidden : Price makes higher low, oscillator makes lower low → Uptrend continuation
Both types can be enabled/disabled independently in settings.
Pivot Detection Methods
BZ-CAE uses symmetric pivot detection with separate lookback and lookforward periods (default 5/5):
Pivot High : Bar where high > all highs within lookback range AND high > all highs within lookforward range
Pivot Low : Bar where low < all lows within lookback range AND low < all lows within lookforward range
This ensures structural validity — the pivot must be a clear local extreme, not just a minor wiggle.
Divergence Validation Requirements
For a divergence to be confirmed, it must satisfy:
Slope Disagreement : Price slope and oscillator slope must move in opposite directions (for regular divs) or same direction with inverted highs/lows (for hidden divs)
Minimum Slope Change : |osc_slope| > min_slope_change / 100 (default 1.0) — filters weak, marginal divergences
Maximum Lookback Range : Pivots must be within max_lookback bars (default 60) — prevents ancient, irrelevant divergences
ATR-Normalized Strength : Divergence strength = min(|price_slope| × |osc_slope| × 10, 1.0) — quantifies the magnitude of disagreement in volatility context
Regular divergences receive 1.0× weight; hidden divergences receive 0.8× weight (slightly less reliable historically).
Oscillator Options — Five Professional Indicators
RSI (Relative Strength Index) : Classic overbought/oversold momentum indicator. Best for: General purpose divergence detection across all instruments.
Stochastic : Range-bound %K momentum comparing close to high-low range. Best for: Mean reversion strategies and range-bound markets.
CCI (Commodity Channel Index) : Measures deviation from statistical mean, auto-normalized to 0-100 scale. Best for: Cyclical instruments and commodities.
MFI (Money Flow Index) : Volume-weighted RSI incorporating money flow. Best for: Volume-driven markets like stocks and crypto.
Williams %R : Inverse stochastic looking back over period, auto-adjusted to 0-100. Best for: Reversal detection at extremes.
Each oscillator has adjustable length (2-200, default 14) and smoothing (1-20, default 1). You also set overbought (50-100, default 70) and oversold (0-50, default 30) thresholds.
Signal Timing Modes — Understanding Repainting
BZ-CAE offers two timing policies with complete transparency about repainting behavior:
Realtime (1-bar, peak-anchored)
How It Works :
Detects peaks 1 bar ago using pattern: high > high AND high > high
Signal prints on the NEXT bar after peak detection (bar_index)
Visual marker anchors to the actual PEAK bar (bar_index - 1, offset -1)
Signal locks in when bar CONFIRMS (closes)
Repainting Behavior :
On the FORMING bar (before close), the peak condition may change as new prices arrive
Once bar CLOSES (barstate.isconfirmed), signal is locked permanently
This is preview/early warning behavior by design
Best For :
Active monitoring and immediate alerts
Learning the system (seeing signals develop in real-time)
Responsive entry if you're watching the chart live
Confirmed (lookforward)
How It Works :
Uses Pine Script's built-in ta.pivothigh() and ta.pivotlow() functions
Requires full pivot validation period (lookback + lookforward bars)
Signal prints pivot_lookforward bars after the actual peak (default 5-bar delay)
Visual marker anchors to the actual peak bar (offset -pivot_lookforward)
No Repainting Behavior
Best For :
Backtesting and historical analysis
Conservative entries requiring full confirmation
Automated trading systems
Swing trading with larger timeframes
Tradeoff :
Delayed entry by pivot_lookforward bars (typically 5 bars)
On a 5-minute chart, this is a 25-minute delay
On a 4-hour chart, this is a 20-hour delay
Recommendation : Use Confirmed for backtesting to verify system performance honestly. Use Realtime for live monitoring only if you're actively watching the chart and understand pre-confirmation repainting behavior.
Signal Spacing System — Anti-Spam Architecture
Even after CAE filtering, raw divergences can cluster. The spacing system enforces separation:
Three Independent Filters
1. Min Bars Between ANY Signals (default 12):
Prevents rapid-fire clustering across both directions
If last signal (bull or bear) was within N bars, block new signal
Ensures breathing room between all setups
2. Min Bars Between SAME-SIDE Signals (default 24, optional enforcement):
Prevents bull-bull or bear-bear spam
Separate tracking for bullish and bearish signal timelines
Toggle enforcement on/off
3. Min ATR Distance From Last Signal (default 0, optional):
Requires price to move N × ATR from last signal location
Ensures meaningful price movement between setups
0 = disabled, 0.5-2.0 = typical range for enabled
All three filters work independently. A signal must pass ALL enabled filters to proceed.
Practical Guidance :
Scalping (1-5m) : Any 6-10, Same-side 12-20, ATR 0-0.5
Day Trading (15m-1H) : Any 12, Same-side 24, ATR 0-1.0
Swing Trading (4H-D) : Any 20-30, Same-side 40-60, ATR 1.0-2.0
Dashboard — Real-Time Control Center
The dashboard (toggleable, four corner positions, three sizes) provides comprehensive system intelligence:
Oscillator Section
Current oscillator type and value
State: OVERBOUGHT / OVERSOLD / NEUTRAL (color-coded)
Length parameter
Cognitive Engine Section
TCS (Trend Conviction Score) :
Current value with emoji state indicator
🔥 = Strong trend (>0.75)
📊 = Moderate trend (0.50-0.75)
〰️ = Weak/choppy (<0.50)
Color: Red if above threshold (trend filter active), yellow if moderate, green if weak
DMA (Directional Momentum Alignment) :
Current value with emoji direction indicator
🐂 = Bullish momentum (>0.5)
⚖️ = Balanced (-0.5 to 0.5)
🐻 = Bearish momentum (<-0.5)
Color: Green if bullish, red if bearish
Exhaustion :
Current value with emoji warning indicator
⚠️ = High exhaustion (>0.75)
🟡 = Moderate (0.50-0.75)
✓ = Low (<0.50)
Color: Red if high, yellow if moderate, green if low
Pullback :
Quality of current distance from EMA20
Values >0.6 are ideal entry zones (not too close, not too far)
Bull Case / Bear Case (if Adversarial enabled):
Current scores for both sides of the market debate
Differential with emoji indicator:
📈 = Bull advantage (>0.2)
➡️ = Balanced (-0.2 to 0.2)
📉 = Bear advantage (<-0.2)
Last Signal Metrics Section (New Feature)
When a signal fires, this section captures and displays:
Signal type (BULL or BEAR)
Bars elapsed since signal
Confidence % at time of signal
TCS value at signal time
DMA value at signal time
Purpose : Provides a historical reference for learning. You can see what the market state looked like when the last signal fired, helping you correlate outcomes with conditions.
Statistics Section
Total Signals : Lifetime count across session
Blocked Signals : Count and percentage (filter effectiveness metric)
Bull Signals : Total bullish divergences
Bear Signals : Total bearish divergences
Purpose : System health monitoring. If blocked % is very high (>60%), filters may be too strict. If very low (<10%), filters may be too loose.
Advisory Annotations
When CAE Mode = Advisory, this section displays warnings for signals that would be blocked in Filtering mode:
Examples:
"Bull spacing: wait 8 bars"
"Bear: strong uptrend (TCS=0.87)"
"Adversarial bearish"
"Low confidence 32%"
Multiple warnings can stack, separated by " | ". This teaches you CAE's decision logic transparently.
How to Use BZ-CAE — Complete Workflow
Phase 1: Initial Setup (First Session)
Apply BZ-CAE to your chart
Select your preferred Visual Theme (Cyberpunk recommended for visibility)
Set Signal Timing to "Confirmed (lookforward)" for learning
Choose your Oscillator Type (RSI recommended for general use, length 14)
Set Overbought/Oversold to 70/30 (standard)
Enable both Regular Divergence and Hidden Divergence
Set Pivot Lookback/Lookforward to 5/5 (balanced structure)
Enable CAE Intelligence
Set CAE Mode to "Advisory" (learning mode)
Enable all three CAE filters: Strong Trend Filter , Adversarial Validation , Confidence Gating
Enable Show Dashboard , position Top Right, size Normal
Enable Draw Bifurcation Zones and Adversarial Bar Coloring
Phase 2: Learning Period (Weeks 1-2)
Goal : Understand how CAE evaluates market state and filters signals.
Activities :
Watch the dashboard during signals :
Note TCS values when counter-trend signals fail — this teaches you the trend strength threshold for your instrument
Observe exhaustion patterns at actual turning points — learn when overextension truly matters
Study adversarial differential at signal times — see when opposing cases dominate
Review blocked signals (orange X-crosses):
In Advisory mode, you see everything — signals that would pass AND signals that would be blocked
Check the advisory annotations to understand why CAE would block
Track outcomes: Were the blocks correct? Did those signals fail?
Use Last Signal Metrics :
After each signal, check the dashboard capture of confidence, TCS, and DMA
Journal these values alongside trade outcomes
Identify patterns: Do confidence >0.70 signals work better? Does your instrument respect TCS >0.85?
Understand your instrument's "personality" :
Trending instruments (indices, major forex) may need TCS threshold 0.85-0.90
Choppy instruments (low-cap stocks, exotic pairs) may work best with TCS 0.70-0.75
High-volatility instruments (crypto) may need wider spacing
Low-volatility instruments may need tighter spacing
Phase 3: Calibration (Weeks 3-4)
Goal : Optimize settings for your specific instrument, timeframe, and style.
Calibration Checklist :
Min Confidence Threshold :
Review confidence distribution in your signal journal
Identify the confidence level below which signals consistently fail
Set min_confidence slightly above that level
Day trading : 0.35-0.45
Swing trading : 0.40-0.55
Scalping : 0.30-0.40
TCS Threshold :
Find the TCS level where counter-trend signals consistently get stopped out
Set tcs_threshold at or slightly below that level
Trending instruments : 0.85-0.90
Mixed instruments : 0.80-0.85
Choppy instruments : 0.75-0.80
Exhaustion Override Level :
Identify exhaustion readings that marked genuine reversals
Set exhaustion_required just below the average
Typical range : 0.45-0.55
Adversarial Threshold :
Default 0.10 works for most instruments
If you find CAE is too conservative (blocking good trades), raise to 0.15-0.20
If signals are still getting caught in opposing momentum, lower to 0.07-0.09
Spacing Parameters :
Count bars between quality signals in your journal
Set min bars ANY to ~60% of that average
Set min bars SAME-SIDE to ~120% of that average
Scalping : Any 6-10, Same 12-20
Day trading : Any 12, Same 24
Swing : Any 20-30, Same 40-60
Oscillator Selection :
Try different oscillators for 1-2 weeks each
Track win rate and average winner/loser by oscillator type
RSI : Best for general use, clear OB/OS
Stochastic : Best for range-bound, mean reversion
MFI : Best for volume-driven markets
CCI : Best for cyclical instruments
Williams %R : Best for reversal detection
Phase 4: Live Deployment
Goal : Disciplined execution with proven, calibrated system.
Settings Changes :
Switch CAE Mode from Advisory to Filtering
System now actively blocks low-quality signals
Only setups passing all gates reach your chart
Keep Signal Timing on Confirmed for conservative entries
OR switch to Realtime if you're actively monitoring and want faster entries (accept pre-confirmation repaint risk)
Use your calibrated thresholds from Phase 3
Enable high-confidence alerts: "⭐ High Confidence Bullish/Bearish" (>0.70)
Trading Discipline Rules :
Respect Blocked Signals :
If CAE blocks a trade you wanted to take, TRUST THE SYSTEM
Don't manually override — if you consistently disagree, return to Phase 2/3 calibration
The block exists because market state failed intelligence checks
Confidence-Based Position Sizing :
Confidence >0.70: Standard or increased size (e.g., 1.5-2.0% risk)
Confidence 0.50-0.70: Standard size (e.g., 1.0% risk)
Confidence 0.35-0.50: Reduced size (e.g., 0.5% risk) or skip if conservative
TCS-Based Management :
High TCS + counter-trend signal: Use tight stops, quick exits (you're fading momentum)
Low TCS + reversal signal: Use wider stops, trail aggressively (genuine reversal potential)
Exhaustion Awareness :
Exhaustion >0.75 (yellow shading): Market is overextended, reversal risk is elevated — consider early exit or tighter trailing stops even on winning trades
Exhaustion <0.30: Continuation bias — hold for larger move, wide trailing stops
Adversarial Context :
Strong differential against you (e.g., bullish signal with bear diff <-0.2): Use very tight stops, consider skipping
Strong differential with you (e.g., bullish signal with bull diff >0.2): Trail aggressively, this is your tailwind
Practical Settings by Timeframe & Style
Scalping (1-5 Minute Charts)
Objective : High frequency, tight stops, quick reversals in fast-moving markets.
Oscillator :
Type: RSI or Stochastic (fast response to quick moves)
Length: 9-11 (more responsive than standard 14)
Smoothing: 1 (no lag)
OB/OS: 65/35 (looser thresholds ensure frequent crossings in fast conditions)
Divergence :
Pivot Lookback/Lookforward: 3/3 (tight structure, catch small swings)
Max Lookback: 40-50 bars (recent structure only)
Min Slope Change: 0.8-1.0 (don't be overly strict)
CAE :
Mode: Advisory first (learn), then Filtering
Min Confidence: 0.30-0.35 (lower bar for speed, accept more signals)
TCS Threshold: 0.70-0.75 (allow more counter-trend opportunities)
Exhaustion Required: 0.45-0.50 (moderate override)
Strong Trend Filter: ON (still respect major intraday trends)
Adversarial: ON (critical for scalping protection — catches bad entries quickly)
Spacing :
Min Bars ANY: 6-10 (fast pace, many setups)
Min Bars SAME-SIDE: 12-20 (prevent clustering)
Min ATR Distance: 0 or 0.5 (loose)
Timing : Realtime (speed over precision, but understand repaint risk)
Visuals :
Signal Size: Tiny (chart clarity in busy conditions)
Show Zones: Optional (can clutter on low timeframes)
Bar Coloring: ON (helps read momentum shifts quickly)
Dashboard: Small size (corner reference, not main focus)
Key Consideration : Scalping generates noise. Even with CAE, expect lower win rate (45-55%) but aim for favorable R:R (2:1 or better). Size conservatively.
Day Trading (15-Minute to 1-Hour Charts)
Objective : Balance quality and frequency. Standard divergence trading approach.
Oscillator :
Type: RSI or MFI (proven reliability, volume confirmation with MFI)
Length: 14 (industry standard, well-studied)
Smoothing: 1-2
OB/OS: 70/30 (classic levels)
Divergence :
Pivot Lookback/Lookforward: 5/5 (balanced structure)
Max Lookback: 60 bars
Min Slope Change: 1.0 (standard strictness)
CAE :
Mode: Filtering (enforce discipline from the start after brief Advisory learning)
Min Confidence: 0.35-0.45 (quality filter without being too restrictive)
TCS Threshold: 0.80-0.85 (respect strong trends)
Exhaustion Required: 0.50 (balanced override threshold)
Strong Trend Filter: ON
Adversarial: ON
Confidence Gating: ON (all three filters active)
Spacing :
Min Bars ANY: 12 (breathing room between all setups)
Min Bars SAME-SIDE: 24 (prevent bull/bear clusters)
Min ATR Distance: 0-1.0 (optional refinement, typically 0.5-1.0)
Timing : Confirmed (1-bar delay for reliability, no repainting)
Visuals :
Signal Size: Tiny or Small
Show Zones: ON (useful reference for exits/re-entries)
Bar Coloring: ON (context awareness)
Dashboard: Normal size (full visibility)
Key Consideration : This is the "sweet spot" timeframe for BZ-CAE. Market structure is clear, CAE has sufficient data, and signal frequency is manageable. Expect 55-65% win rate with proper execution.
Swing Trading (4-Hour to Daily Charts)
Objective : Quality over quantity. High conviction only. Larger stops and targets.
Oscillator :
Type: RSI or CCI (robust on higher timeframes, smooth longer waves)
Length: 14-21 (capture larger momentum swings)
Smoothing: 1-3
OB/OS: 70/30 or 75/25 (strict extremes)
Divergence :
Pivot Lookback/Lookforward: 5/5 or 7/7 (structural purity, major swings only)
Max Lookback: 80-100 bars (broader historical context)
Min Slope Change: 1.2-1.5 (require strong, undeniable divergence)
CAE :
Mode: Filtering (strict enforcement, premium setups only)
Min Confidence: 0.40-0.55 (high bar for entry)
TCS Threshold: 0.85-0.95 (very strong trend protection — don't fade established HTF trends)
Exhaustion Required: 0.50-0.60 (higher bar for override — only extreme exhaustion justifies counter-trend)
Strong Trend Filter: ON (critical on HTF)
Adversarial: ON (avoid obvious bad trades)
Confidence Gating: ON (quality gate essential)
Spacing :
Min Bars ANY: 20-30 (substantial separation)
Min Bars SAME-SIDE: 40-60 (significant breathing room)
Min ATR Distance: 1.0-2.0 (require meaningful price movement)
Timing : Confirmed (purity over speed, zero repaint for swing accuracy)
Visuals :
Signal Size: Small or Normal (clear markers on zoomed-out view)
Show Zones: ON (important HTF levels)
Bar Coloring: ON (long-term trend awareness)
Dashboard: Normal or Large (comprehensive analysis)
Key Consideration : Swing signals are rare but powerful. Expect 2-5 signals per month per instrument. Win rate should be 60-70%+ due to stringent filtering. Position size can be larger given confidence.
Dashboard Interpretation Reference
TCS (Trend Conviction Score) States
0.00-0.50: Weak/Choppy
Emoji: 〰️
Color: Green/cyan
Meaning: No established trend. Range-bound or consolidating. Both reversal and continuation signals viable.
Action: Reversals (regular divs) are safer. Use wider profit targets (market has room to move). Consider mean reversion strategies.
0.50-0.75: Moderate Trend
Emoji: 📊
Color: Yellow/neutral
Meaning: Developing trend but not locked in. Context matters significantly.
Action: Check DMA and exhaustion. If DMA confirms trend and exhaustion is low, favor continuation (hidden divs). If exhaustion is high, reversals are viable.
0.75-0.85: Strong Trend
Emoji: 🔥
Color: Orange/warning
Meaning: Well-established trend with persistence. Counter-trend is high risk.
Action: Require exhaustion >0.50 for counter-trend entries. Favor continuation signals. Use tight stops on counter-trend attempts.
0.85-1.00: Very Strong Trend
Emoji: 🔥🔥
Color: Red/danger (if counter-trading)
Meaning: Locked-in institutional trend. Extremely high risk to fade.
Action: Avoid counter-trend unless exhaustion >0.75 (yellow shading). Focus exclusively on continuation opportunities. Momentum is king here.
DMA (Directional Momentum Alignment) Zones
-2.0 to -1.0: Strong Bearish Momentum
Emoji: 🐻🐻
Color: Dark red
Meaning: Powerful downside force. Sellers are in control.
Action: Bullish divergences are counter-momentum (high risk). Bearish divergences are with-momentum (lower risk). Size down on longs.
-0.5 to 0.5: Neutral/Balanced
Emoji: ⚖️
Color: Gray/neutral
Meaning: No strong directional bias. Choppy or consolidating.
Action: Both directions have similar probability. Focus on confidence score and adversarial differential for edge.
1.0 to 2.0: Strong Bullish Momentum
Emoji: 🐂🐂
Color: Bright green/cyan
Meaning: Powerful upside force. Buyers are in control.
Action: Bearish divergences are counter-momentum (high risk). Bullish divergences are with-momentum (lower risk). Size down on shorts.
Exhaustion States
0.00-0.50: Fresh Move
Emoji: ✓
Color: Green
Meaning: Trend is healthy, not overextended. Room to run.
Action: Counter-trend trades are premature. Favor continuation. Hold winners for larger moves. Avoid early exits.
0.50-0.75: Mature Move
Emoji: 🟡
Color: Yellow
Meaning: Move is aging. Watch for signs of climax.
Action: Tighten trailing stops on winning trades. Be ready for reversals. Don't add to positions aggressively.
0.75-0.85: High Exhaustion
Emoji: ⚠️
Color: Orange
Background: Yellow shading appears
Meaning: Move is overextended. Reversal risk elevated significantly.
Action: Counter-trend reversals are higher probability. Consider early exits on with-trend positions. Size up on reversal divergences (if CAE allows).
0.85-1.00: Critical Exhaustion
Emoji: ⚠️⚠️
Color: Red
Background: Yellow shading intensifies
Meaning: Climax conditions. Reversal imminent or underway.
Action: Aggressive reversal trades justified. Exit all with-trend positions. This is where major turns occur.
Confidence Score Tiers
0.00-0.30: Low Quality
Color: Red
Status: Blocked in Filtering mode
Action: Skip entirely. Setup lacks fundamental quality across multiple factors.
0.30-0.50: Moderate Quality
Color: Yellow/orange
Status: Marginal — passes in Filtering only if >min_confidence
Action: Reduced position size (0.5-0.75% risk). Tight stops. Conservative profit targets. Skip if you're selective.
0.50-0.70: High Quality
Color: Green/cyan
Status: Good setup across most quality factors
Action: Standard position size (1.0-1.5% risk). Normal stops and targets. This is your bread-and-butter trade.
0.70-1.00: Premium Quality
Color: Bright green/gold
Status: Exceptional setup — all factors aligned
Visual: Double confidence ring appears
Action: Consider increased position size (1.5-2.0% risk, maximum). Wider stops. Larger targets. High probability of success. These are rare — capitalize when they appear.
Adversarial Differential Interpretation
Bull Differential > 0.3 :
Visual: Strong cyan/green bar colors
Meaning: Bull case strongly dominates. Buyers have clear advantage.
Action: Bullish divergences favored (with-advantage). Bearish divergences face headwind (reduce size or skip). Momentum is bullish.
Bull Differential 0.1 to 0.3 :
Visual: Moderate cyan/green transparency
Meaning: Moderate bull advantage. Buyers have edge but not overwhelming.
Action: Both directions viable. Slight bias toward longs.
Differential -0.1 to 0.1 :
Visual: Gray/neutral bars
Meaning: Balanced debate. No clear advantage either side.
Action: Rely on other factors (confidence, TCS, exhaustion) for direction. Adversarial is neutral.
Bear Differential -0.3 to -0.1 :
Visual: Moderate red/magenta transparency
Meaning: Moderate bear advantage. Sellers have edge but not overwhelming.
Action: Both directions viable. Slight bias toward shorts.
Bear Differential < -0.3 :
Visual: Strong red/magenta bar colors
Meaning: Bear case strongly dominates. Sellers have clear advantage.
Action: Bearish divergences favored (with-advantage). Bullish divergences face headwind (reduce size or skip). Momentum is bearish.
Last Signal Metrics — Post-Trade Analysis
After a signal fires, dashboard captures:
Type : BULL or BEAR
Bars Ago : How long since signal (updates every bar)
Confidence : What was the quality score at signal time
TCS : What was trend conviction at signal time
DMA : What was momentum alignment at signal time
Use Case : Post-trade journaling and learning.
Example: "BULL signal 12 bars ago. Confidence: 68%, TCS: 0.42, DMA: -0.85"
Analysis : This was a bullish reversal (regular div) with good confidence, weak trend (TCS), but strong bearish momentum (DMA). The bet was that momentum would reverse — a counter-momentum play requiring exhaustion confirmation. Check if exhaustion was high at that time to justify the entry.
Track patterns:
Do your best trades have confidence >0.65?
Do low-TCS signals (<0.50) work better for you?
Are you more successful with-momentum (DMA aligned with signal) or counter-momentum?
Troubleshooting Guide
Problem: No Signals Appearing
Symptoms : Chart loads, dashboard shows metrics, but no divergence signals fire.
Diagnosis Checklist :
Check dashboard oscillator value : Is it crossing OB/OS levels (70/30)? If oscillator stays in 40-60 range constantly, it can't reach extremes needed for divergence detection.
Are pivots forming? : Look for local swing highs/lows on your chart. If price is in tight consolidation, pivots may not meet lookback/lookforward requirements.
Is spacing too tight? : Check "Last Signal" metrics — how many bars since last signal? If <12 and your min_bars_ANY is 12, spacing filter is blocking.
Is CAE blocking everything? : Check dashboard Statistics section — what's the blocked signal count? High blocks indicate overly strict filters.
Solutions :
Loosen OB/OS Temporarily :
Try 65/35 to verify divergence detection works
If signals appear, the issue was threshold strictness
Gradually tighten back to 67/33, then 70/30 as appropriate
Lower Min Confidence :
Try 0.25-0.30 (diagnostic level)
If signals appear, filter was too strict
Raise gradually to find sweet spot (0.35-0.45 typical)
Disable Strong Trend Filter Temporarily :
Turn off in CAE settings
If signals appear, TCS threshold was blocking everything
Re-enable and lower TCS_threshold to 0.70-0.75
Reduce Min Slope Change :
Try 0.7-0.8 (from default 1.0)
Allows weaker divergences through
Helpful on low-volatility instruments
Widen Spacing :
Set min_bars_ANY to 6-8
Set min_bars_SAME_SIDE to 12-16
Reduces time between allowed signals
Check Timing Mode :
If using Confirmed, remember there's a pivot_lookforward delay (5+ bars)
Switch to Realtime temporarily to verify system is working
Realtime has no delay but repaints
Verify Oscillator Settings :
Length 14 is standard but might not fit all instruments
Try length 9-11 for faster response
Try length 18-21 for slower, smoother response
Problem: Too Many Signals (Signal Spam)
Symptoms : Dashboard shows 50+ signals in Statistics, confidence scores mostly <0.40, signals clustering close together.
Solutions :
Raise Min Confidence :
Try 0.40-0.50 (quality filter)
Blocks bottom-tier setups
Targets top 50-60% of divergences only
Tighten OB/OS :
Use 70/30 or 75/25
Requires more extreme oscillator readings
Reduces false divergences in mid-range
Increase Min Slope Change :
Try 1.2-1.5 (from default 1.0)
Requires stronger, more obvious divergences
Filters marginal slope disagreements
Raise TCS Threshold :
Try 0.85-0.90 (from default 0.80)
Stricter trend filter blocks more counter-trend attempts
Favors only strongest trend alignment
Enable ALL CAE Gates :
Turn on Trend Filter + Adversarial + Confidence
Triple-layer protection
Blocks aggressively — expect 20-40% reduction in signals
Widen Spacing :
min_bars_ANY: 15-20 (from 12)
min_bars_SAME_SIDE: 30-40 (from 24)
Creates substantial breathing room
Switch to Confirmed Timing :
Removes realtime preview noise
Ensures full pivot validation
5-bar delay filters many false starts
Problem: Signals in Strong Trends Get Stopped Out
Symptoms : You take a bullish divergence in a downtrend (or bearish in uptrend), and it immediately fails. Dashboard showed high TCS at the time.
Analysis : This is INTENDED behavior — CAE is protecting you from low-probability counter-trend trades.
Understanding :
Check Last Signal Metrics in dashboard — what was TCS when signal fired?
If TCS was >0.85 and signal was counter-trend, CAE correctly identified it as high risk
Strong trends rarely reverse cleanly without major exhaustion
Your losses here are the system working as designed (blocking bad odds)
If You Want to Override (Not Recommended) :
Lower TCS_threshold to 0.70-0.75 (allows more counter-trend)
Lower exhaustion_required to 0.40 (easier override)
Disable Strong Trend Filter entirely (very risky)
Better Approach :
TRUST THE FILTER — it's preventing costly mistakes
Wait for exhaustion >0.75 (yellow shading) before counter-trending strong TCS
Focus on continuation signals (hidden divs) in high-TCS environments
Use Advisory mode to see what CAE is blocking and learn from outcomes
Problem: Adversarial Blocking Seems Wrong
Symptoms : You see a divergence that "looks good" visually, but CAE blocks with "Adversarial bearish/bullish" warning.
Diagnosis :
Check dashboard Bull Case and Bear Case scores at that moment
Look at Differential value
Check adversarial bar colors — was there strong coloring against your intended direction?
Understanding :
Adversarial catches "obvious" opposing momentum that's easy to miss
Example: Bullish divergence at a local low, BUT price is deeply below EMA50, bearish momentum is strong, and RSI shows knife-catching conditions
Bull Case might be 0.20 while Bear Case is 0.55
Differential = -0.35, far beyond threshold
Block is CORRECT — you'd be fighting overwhelming opposing flow
If You Disagree Consistently
Review blocked signals on chart — scroll back and check outcomes
Did those blocked signals actually work, or did they fail as adversarial predicted?
Raise adv_threshold to 0.15-0.20 (more permissive, allows closer battles)
Disable Adversarial Validation temporarily (diagnostic) to isolate its effect
Use Advisory mode to learn adversarial patterns over 50-100 signals
Remember : Adversarial is conservative BY DESIGN. It prevents "obvious" bad trades where you're fighting strong strength the other way.
Problem: Dashboard Not Showing or Incomplete
Solutions :
Toggle "Show Dashboard" to ON in settings
Try different dashboard sizes (Small/Normal/Large)
Try different positions (Top Left/Right, Bottom Left/Right) — might be off-screen
Some sections require CAE Enable = ON (Cognitive Engine section won't appear if CAE is disabled)
Statistics section requires at least 1 lifetime signal to populate
Check that visual theme is set (dashboard colors adapt to theme)
Problem: Performance Lag, Chart Freezing
Symptoms : Chart loading is slow, indicator calculations cause delays, pinch-to-zoom lags.
Diagnosis : Visual features are computationally expensive, especially adversarial bar coloring (recalculates every bar).
Solutions (In Order of Impact) :
Disable Adversarial Bar Coloring (MOST EXPENSIVE):
Turn OFF "Adversarial Bar Coloring" in settings
This is the single biggest performance drain
Immediate improvement
Reduce Vertical Lines :
Lower "Keep last N vertical lines" to 20-30
Or set to 0 to disable entirely
Moderate improvement
Disable Bifurcation Zones :
Turn OFF "Draw Bifurcation Zones"
Reduces box drawing calculations
Moderate improvement
Set Dashboard Size to Small :
Smaller dashboard = fewer cells = less rendering
Minor improvement
Use Shorter Max Lookback :
Reduce max_lookback to 40-50 (from 60+)
Fewer bars to scan for divergences
Minor improvement
Disable Exhaustion Shading :
Turn OFF "Show Market State"
Removes background coloring calculations
Minor improvement
Extreme Performance Mode :
Disable ALL visual enhancements
Keep only triangle markers
Dashboard Small or OFF
Use Minimal theme if available
Problem: Realtime Signals Repainting
Symptoms : You see a signal appear, but on next bar it disappears or moves.
Explanation :
Realtime mode detects peaks 1 bar ago: high > high AND high > high
On the FORMING bar (before close), this condition can change as new prices arrive
Example: At 10:05, high (10:04 bar) was 100, current high is 99 → peak detected
At 10:05:30, new high of 101 arrives → peak condition breaks → signal disappears
At 10:06 (bar close), final high is 101 → no peak at 10:04 anymore → signal gone permanently
This is expected behavior for realtime responsiveness. You get preview/early warning, but it's not locked until bar confirms.
Solutions :
Use Confirmed Timing :
Switch to "Confirmed (lookforward)" mode
ZERO repainting — pivot must be fully validated
5-bar delay (pivot_lookforward)
What you see in history is exactly what would have appeared live
Accept Realtime Repaint as Tradeoff :
Keep Realtime mode for speed and alerts
Understand that pre-confirmation signals may vanish
Only trade signals that CONFIRM at bar close (check barstate.isconfirmed)
Use for live monitoring, NOT for backtesting
Trade Only After Confirmation :
In Realtime mode, wait 1 full bar after signal appears before entering
If signal survives that bar close, it's locked
This adds 1-bar delay but removes repaint risk
Recommendation : Use Confirmed for backtesting and conservative trading. Use Realtime only for active monitoring with full understanding of preview behavior.
Risk Management Integration
BZ-CAE is a signal generation system, not a complete trading strategy. You must integrate proper risk management:
Position Sizing by Confidence
Confidence 0.70-1.00 (Premium) :
Risk: 1.5-2.0% of account (MAXIMUM)
Reasoning: High-quality setup across all factors
Still cap at 2% — even premium setups can fail
Confidence 0.50-0.70 (High Quality) :
Risk: 1.0-1.5% of account
Reasoning: Standard good setup
Your bread-and-butter risk level
Confidence 0.35-0.50 (Moderate Quality) :
Risk: 0.5-1.0% of account
Reasoning: Marginal setup, passes minimum threshold
Reduce size or skip if you're selective
Confidence <0.35 (Low Quality) :
Risk: 0% (blocked in Filtering mode)
Reasoning: Insufficient quality factors
System protects you by not showing these
Stop Placement Strategies
For Reversal Signals (Regular Divergences) :
Place stop beyond the divergence pivot plus buffer
Bullish : Stop below the divergence low - 1.0-1.5 × ATR
Bearish : Stop above the divergence high + 1.0-1.5 × ATR
Reasoning: If price breaks the pivot, divergence structure is invalidated
For Continuation Signals (Hidden Divergences) :
Place stop beyond recent swing in opposite direction
Bullish continuation : Stop below recent swing low (not the divergence pivot itself)
Bearish continuation : Stop above recent swing high
Reasoning: You're trading with trend, allow more breathing room
ATR-Based Stops :
1.5-2.0 × ATR is standard
Scale by timeframe:
Scalping (1-5m): 1.0-1.5 × ATR (tight)
Day trading (15m-1H): 1.5-2.0 × ATR (balanced)
Swing (4H-D): 2.0-3.0 × ATR (wide)
Never Use Fixed Dollar/Pip Stops :
Markets have different volatility
50-pip stop on EUR/USD ≠ 50-pip stop on GBP/JPY
Always normalize by ATR or pivot structure
Profit Targets and Scaling
Primary Target :
2-3 × ATR from entry (minimum 2:1 reward-risk)
Example : Entry at 100, ATR = 2, stop at 97 (1.5 × ATR) → target at 106 (3 × ATR) = 2:1 R:R
Scaling Out Strategy :
Take 50% off at 1.5 × ATR (secure partial profit)
Move stop to breakeven
Trail remaining 50% with 1.0 × ATR trailing stop
Let winners run if trend persists
Targets by Confidence :
High Confidence (>0.70) : Aggressive targets (3-4 × ATR), trail wider (1.5 × ATR)
Standard Confidence (0.50-0.70) : Normal targets (2-3 × ATR), standard trail (1.0 × ATR)
Low Confidence (0.35-0.50) : Conservative targets (1.5-2 × ATR), tight trail (0.75 × ATR)
Use Bifurcation Zones :
If opposite-side zone is visible on chart (from previous signal), use it as target
Example : Bullish signal at 100, prior supply zone at 110 → use 110 as target
Zones mark institutional resistance/support
Exhaustion-Based Exits :
If you're in a trade and exhaustion >0.75 develops (yellow shading), consider early exit
Market is overextended — reversal risk is high
Take profit even if target not reached
Trade Management by TCS
High TCS + Counter-Trend Trade (Risky) :
Use very tight stops (1.0-1.5 × ATR)
Conservative targets (1.5-2 × ATR)
Quick exit if trade doesn't work immediately
You're fading momentum — respect it
Low TCS + Reversal Trade (Safer) :
Use wider stops (2.0-2.5 × ATR)
Aggressive targets (3-4 × ATR)
Trail with patience
Genuine reversal potential in weak trend
High TCS + Continuation Trade (Safest) :
Standard stops (1.5-2.0 × ATR)
Very aggressive targets (4-5 × ATR)
Trail wide (1.5-2.0 × ATR)
You're with institutional momentum — let it run
Educational Value — Learning Machine Intelligence
BZ-CAE is designed as a learning platform, not just a tool:
Advisory Mode as Teacher
Most indicators are binary: signal or no signal. You don't learn WHY certain setups are better.
BZ-CAE's Advisory mode shows you EVERY potential divergence, then annotates the ones that would be blocked in Filtering mode with specific reasons:
"Bull: strong downtrend (TCS=0.87)" teaches you that TCS >0.85 makes counter-trend very risky
"Adversarial bearish" teaches you that the opposing case was dominating
"Low confidence 32%" teaches you that the setup lacked quality across multiple factors
"Bull spacing: wait 8 bars" teaches you that signals need breathing room
After 50-100 signals in Advisory mode, you internalize the CAE's decision logic. You start seeing these factors yourself BEFORE the indicator does.
Dashboard Transparency
Most "intelligent" indicators are black boxes — you don't know how they make decisions.
BZ-CAE shows you ALL metrics in real-time:
TCS tells you trend strength
DMA tells you momentum alignment
Exhaustion tells you overextension
Adversarial shows both sides of the debate
Confidence shows composite quality
You learn to interpret market state holistically, a skill applicable to ANY trading system beyond this indicator.
Divergence Quality Education
Not all divergences are equal. BZ-CAE teaches you which conditions produce high-probability setups:
Quality divergence : Regular bullish div at a low, TCS <0.50 (weak trend), exhaustion >0.75 (overextended), positive adversarial differential, confidence >0.70
Low-quality divergence : Regular bearish div at a high, TCS >0.85 (strong uptrend), exhaustion <0.30 (not overextended), negative adversarial differential, confidence <0.40
After using the system, you can evaluate divergences manually with similar intelligence.
Risk Management Discipline
Confidence-based position sizing teaches you to adjust risk based on setup quality, not emotions:
Beginners often size all trades identically
Or worse, size UP on marginal setups to "make up" for losses
BZ-CAE forces systematic sizing: premium setups get larger size, marginal setups get smaller size
This creates a probabilistic approach where your edge compounds over time.
What This Indicator Is NOT
Complete transparency about limitations and positioning:
Not a Prediction System
BZ-CAE does not predict future prices. It identifies structural divergences (price-momentum disagreements) and assesses current market state (trend, exhaustion, adversarial conditions). It tells you WHEN conditions favor a potential reversal or continuation, not WHAT WILL HAPPEN.
Markets are probabilistic. Even premium-confidence setups fail ~30-40% of the time. The system improves your probability distribution over many trades — it doesn't eliminate risk.
Not Fully Automated
This is a decision support tool, not a trading robot. You must:
Execute trades manually based on signals
Manage positions (stops, targets, trailing)
Apply discretionary judgment (news events, liquidity, context)
Integrate with your broader strategy and risk rules
The confidence scores guide position sizing, but YOU determine final risk allocation based on your account size, risk tolerance, and portfolio context.
Not Beginner-Friendly
BZ-CAE requires understanding of:
Divergence trading concepts (regular vs hidden, reversal vs continuation)
Market state interpretation (trend vs range, momentum, exhaustion)
Basic technical analysis (pivots, support/resistance, EMAs)
Risk management fundamentals (position sizing, stops, R:R)
This is designed for intermediate to advanced traders willing to invest time learning the system. If you want "buy the arrow" simplicity, this isn't the tool.
Not a Holy Grail
There is no perfect indicator. BZ-CAE filters noise and improves signal quality significantly, but:
Losing trades are inevitable (even at 70% win rate, 30% still fail)
Market conditions change rapidly (yesterday's strong trend becomes today's chop)
Black swan events occur (fundamentals override technicals)
Execution matters (slippage, fees, emotional discipline)
The system provides an EDGE, not a guarantee. Your job is to execute that edge consistently with proper risk management over hundreds of trades.
Not Financial Advice
BZ-CAE is an educational and analytical tool. All trading decisions are your responsibility. Past performance (backtested or live) does not guarantee future results. Only risk capital you can afford to lose. Consult a licensed financial advisor for investment advice specific to your situation.
Ideal Market Conditions
Best Performance Characteristics
Liquid Instruments :
Major forex pairs (EUR/USD, GBP/USD, USD/JPY)
Large-cap stocks and index ETFs (SPY, QQQ, AAPL, MSFT)
High-volume crypto (BTC, ETH)
Major commodities (Gold, Oil, Natural Gas)
Reasoning: Clean price structure, clear pivots, meaningful oscillator behavior
Trending with Consolidations :
Markets that trend for 20-40 bars, then consolidate 10-20 bars, repeat
Creates divergences at consolidation boundaries (reversals) and within trends (continuations)
Both regular and hidden divs find opportunities
5-Minute to Daily Timeframes :
Below 5m: too much noise, false pivots, CAE metrics unstable
Above daily: too few signals, edge diminishes (fundamentals dominate)
Sweet spot: 15m to 4H for most traders
Consistent Volume and Participation :
Regular trading sessions (not holidays or thin markets)
Predictable volatility patterns
Avoid instruments with sudden gaps or circuit breakers
Challenging Conditions
Extremely Low Liquidity :
Penny stocks, exotic forex pairs, low-volume crypto
Erratic pivots, unreliable oscillator readings
CAE metrics can't assess market state properly
Very Low Timeframes (1-Minute or Below) :
Dominated by market microstructure noise
Divergences are everywhere but meaningless
CAE filtering helps but still unreliable
Extended Sideways Consolidation :
100+ bars of tight range with no clear pivots
Oscillator hugs midpoint (45-55 range)
No divergences to detect
Fundamentally-Driven Gap Markets :
Earnings releases, economic data, geopolitical events
Price gaps over stops and targets
Technical structure breaks down
Recommendation: Disable trading around known events
Calculation Methodology — Technical Depth
For users who want to understand the math:
Oscillator Computation
Each oscillator type calculates differently, but all normalize to 0-100:
RSI : ta.rsi(close, length) — Standard Relative Strength Index
Stochastic : ta.stoch(high, low, close, length) — %K calculation
CCI : (ta.cci(hlc3, length) + 100) / 2 — Normalized from -100/+100 to 0-100
MFI : ta.mfi(hlc3, length) — Volume-weighted RSI equivalent
Williams %R : ta.wpr(length) + 100 — Inverted stochastic adjusted to 0-100
Smoothing: If smoothing > 1, apply ta.sma(oscillator, smoothing)
Divergence Detection Algorithm
Identify Pivots :
Price high pivot: ta.pivothigh(high, lookback, lookforward)
Price low pivot: ta.pivotlow(low, lookback, lookforward)
Oscillator high pivot: ta.pivothigh(osc, lookback, lookforward)
Oscillator low pivot: ta.pivotlow(osc, lookback, lookforward)
Store Recent Pivots :
Maintain arrays of last 10 pivots with bar indices
When new pivot confirmed, unshift to array, pop oldest if >10
Scan for Slope Disagreements :
Loop through last 5 pivots
For each pair (current pivot, historical pivot):
Check if within max_lookback bars
Calculate slopes: (current - historical) / bars_between
Regular bearish: price_slope > 0, osc_slope < 0, |osc_slope| > min_threshold
Regular bullish: price_slope < 0, osc_slope > 0, |osc_slope| > min_threshold
Hidden bearish: price_slope < 0, osc_slope > 0, osc_slope > min_threshold
Hidden bullish: price_slope > 0, osc_slope < 0, |osc_slope| > min_threshold
Important Disclaimers and Terms
Performance Disclosure
Past performance, whether backtested or live-traded, does not guarantee future results. Markets change. What works today may not work tomorrow. Hypothetical or simulated performance results have inherent limitations and do not represent actual trading.
Risk of Loss
Trading involves substantial risk of loss. Only trade with risk capital you can afford to lose entirely. The high degree of leverage often available in trading can work against you as well as for you. Leveraged trading may result in losses exceeding your initial deposit.
Not Financial Advice
BZ-CAE is an educational and analytical tool for technical analysis. It is not financial advice, investment advice, or a recommendation to buy or sell any security or instrument. All trading decisions are your sole responsibility. Consult a licensed financial advisor for advice specific to your circumstances.
Technical Indicator Limitations
BZ-CAE is a technical analysis tool based on price and volume data. It does not account for:
Fundamental analysis (earnings, economic data, financial health)
Market sentiment and positioning
Geopolitical events and news
Liquidity conditions and market microstructure changes
Regulatory changes or exchange rules
Integrate with broader analysis and strategy. Do not rely solely on technical indicators for trading decisions.
Repainting Acknowledgment
As disclosed throughout this documentation:
Realtime mode may repaint on forming bars before confirmation (by design for preview functionality)
Confirmed mode has zero repainting (fully validated pivots only)
Choose timing mode appropriate for your use case. Understand the tradeoffs.
Testing Recommendation
ALWAYS test on demo/paper accounts before committing real capital. Validate the indicator's behavior on your specific instruments and timeframes. Learn the system thoroughly in Advisory mode before using Filtering mode.
Learning Resources :
In-indicator tooltips (hover over setting names for detailed explanations)
This comprehensive publishing statement (save for reference)
User guide in script comments (top of code)
Final Word — Philosophy of BZ-CAE
BZ-CAE is not designed to replace your judgment — it's designed to enhance it.
The indicator identifies structural inflection points (bifurcations) where price and momentum disagree. The Cognitive Engine evaluates market state to determine if this disagreement is meaningful or noise. The Adversarial model debates both sides of the trade to catch obvious bad setups. The Confidence system ranks quality so you can choose your risk appetite.
But YOU still execute. YOU still manage risk. YOU still learn from outcomes.
This is intelligence amplification, not intelligence replacement.
Use Advisory mode to learn how expert traders evaluate market state. Use Filtering mode to enforce discipline when emotions run high. Use the dashboard to develop a systematic approach to reading markets. Use confidence scores to size positions probabilistically.
The system provides an edge. Your job is to execute that edge with discipline, patience, and proper risk management over hundreds of trades.
Markets are probabilistic. No system wins every trade. But a systematic edge + disciplined execution + proper risk management compounds over time. That's the path to consistent profitability. BZ-CAE gives you the edge. The discipline and risk management are on you.
Taking you to school. — Dskyz, Trade with insight. Trade with anticipation.

Chronos Reversal Labs - SPChronos Reversal Labs - Shadow Portfolio
Chronos Reversal Labs - Shadow Portfolio: combines reinforcement learning optimization with adaptive confluence detection through a shadow portfolio system. Unlike traditional indicator mashups that force traders to manually interpret conflicting signals, this system deploys 4 multi-armed bandit algorithms to automatically discover which of 5 specialized confluence strategies performs best in current market conditions, then validates those discoveries through parallel shadow portfolios that track virtual P&L for each strategy independently.
Core Innovation: Rather than relying on static indicator combinations, this system implements Thompson Sampling (Bayesian multi-armed bandits), contextual bandits (regime-specific learning), advanced chop zone detection (geometric pattern analysis), and historical pre-training to build a self-improving confluence detection engine. The shadow portfolio system runs 5 parallel virtual trading accounts—one per strategy—allowing the system to learn which confluence approach works best through actual position tracking with realistic exits.
Target Users: Intermediate to advanced traders seeking systematic reversal signals with mathematical rigor. Suitable for swing trading and day trading across stocks, forex, crypto, and futures on liquid instruments. Requires understanding of basic technical analysis and willingness to allow 50-100 bars for initial learning.
Why These Components Are Combined
The Fundamental Problem
No single confluence method works consistently across all market regimes. Kernel-based methods (entropy, DFA) excel during predictable phases but fail in chaos. Structure-based methods (harmonics, BOS) work during clear swings but fail in ranging conditions. Technical methods (RSI, MACD, divergence) provide reliable signals in trends but generate false signals during consolidation.
Traditional solutions force traders to either manually switch between methods (slow, error-prone) or interpret all signals simultaneously (cognitive overload). Both fail because they assume the trader knows which regime the market is in and which method works best.
The Solution: Meta-Learning Through Reinforcement Learning
This system solves the problem through automated strategy selection : Deploy 5 specialized confluence strategies designed for different market conditions, track their real-world performance through shadow portfolios, then use multi-armed bandit algorithms to automatically select the optimal strategy for the next trade.
Why Shadow Portfolios? Traditional bandit implementations use abstract "rewards." Shadow portfolios provide realistic performance measurement : Each strategy gets a virtual trading account with actual position tracking, stop-loss management, take-profit targets, and maximum holding periods. This creates risk-adjusted learning where strategies are evaluated on P&L, win rate, and drawdown—not arbitrary scores.
The Five Confluence Strategies
The system deploys 5 orthogonal strategies with different weighting schemes optimized for specific market conditions:
Strategy 1: Kernel-Dominant (Entropy/DFA focused, optimal in predictable markets)
Shannon Entropy weight × 2.5, DFA weight × 2.5
Detects low-entropy predictable patterns and DFA persistence/mean-reversion signals
Failure mode: High-entropy chaos (hedged by Technical-Dominant)
Strategy 2: Structure-Dominant (Harmonic/BOS focused, optimal in clear swing structures)
Harmonics weight × 2.5, Liquidity (S/R) weight × 2.0
Uses swing detection, break-of-structure, and support/resistance clustering
Failure mode: Range-bound markets (hedged by Balanced)
Strategy 3: Technical-Dominant (RSI/MACD/Divergence focused, optimal in established trends)
RSI weight × 2.0, MACD weight × 2.0, Trend weight × 2.0
Zero-lag RSI suite with 4 calculation methods, MACD analysis, divergence detection
Failure mode: Choppy/ranging markets (hedged by chop filter)
Strategy 4: Balanced (Equal weighting, optimal in unknown/transitional regimes)
All components weighted 1.2×
Baseline performance during regime uncertainty
Strategy 5: Regime-Adaptive (Dynamic weighting by detected market state)
Chop zones: Kernel × 2.0, Technical × 0.3
Bull/Bear trends: Trend × 1.5, DFA × 2.0
Ranging: Mean reversion × 1.5
Adapts explicitly to detected regime
Multi-Armed Bandit System: 4 Core Algorithms
What Is a Multi-Armed Bandit Problem?
Formal Definition: K arms (strategies), each with unknown reward distribution. Goal: Maximize cumulative reward while learning which arms are best. Challenge: Balance exploration (trying uncertain strategies) vs. exploitation (using known-best strategy).
Trading Application: Each confluence strategy is an "arm." After each trade, receive reward (P&L percentage). Bandits decide which strategy to trust for next signal.
The 4 Implemented Algorithms
1. Thompson Sampling (DEFAULT)
Category: Bayesian approach with probability distributions
How It Works: Model each strategy as Beta(α, β) where α = wins, β = losses. Sample from distributions, select highest sample.
Properties: Optimal regret O(K log T), automatic exploration-exploitation balance
When To Use: Best all-around choice, adaptive markets, long-term optimization
2. UCB1 (Upper Confidence Bound)
Category: Frequentist approach with confidence intervals
Formula: UCB_i = reward_mean_i + sqrt(2 × ln(total_pulls) / pulls_i)
Properties: Deterministic, interpretable, same optimal regret as Thompson
When To Use: Prefer deterministic behavior, stable markets
3. Epsilon-Greedy
Category: Simple baseline with random exploration
How It Works: With probability ε (0.15): random strategy. Else: best average reward.
Properties: Simple, fast initial learning
When To Use: Baseline comparison, short-term testing
4. Contextual Bandit
Category: Context-aware Thompson Sampling
Enhancement: Maintains separate alpha/beta for Bull/Bear/Ranging regimes
Learning: "Strategy 2: 60% win rate in Bull, 40% in Bear"
When To Use: After 100+ bars, clear regime shifts
Shadow Portfolio System
Why Shadow Portfolios?
Traditional bandits use abstract scores. Shadow portfolios provide realistic performance measurement through actual position simulation.
How It Works
Position Opening:
When strategy generates validated signal:
Opens virtual position for selected strategy
Records: entry price, direction, entry bar, RSI method
Optional: Open positions for ALL strategies simultaneously (faster learning)
Position Management (Every Bar):
Current P&L: pnl_pct = (close - entry) / entry × direction × 100
Exit if: pnl_pct <= -2.0% (stop-loss) OR pnl_pct >= +4.0% (take-profit) OR held ≥ 100 bars (time)
Position Closing:
Calculate final P&L percentage
Update strategy equity, track win rate, gross profit/loss, max drawdown
Calculate risk-adjusted reward:
text
base_reward = pnl_pct / 10.0
win_rate_bonus = (win_rate - 0.5) × 0.3
drawdown_penalty = -max_drawdown × 0.05
total_reward = sigmoid(base + bonus + penalty)
Update bandit algorithms with reward
Update RSI method bandit
Statistics Tracked Per Strategy:
Equity curve (starts at $10,000)
Win rate percentage
Max drawdown
Gross profit/loss
Current open position
This creates closed-loop learning : Strategies compete → Best performers selected → Bandits learn quality → System adapts automatically.
Historical Pre-Training System
The Problem with Live-Only Learning
Standard bandits start with zero knowledge and need 50-100 signals to stabilize. For weekly timeframe traders, this could take years.
The Solution: Historical Training
During Chart Load: System processes last 300-1000 bars (configurable) in "training mode":
Detect signals using Balanced strategy (consistent baseline)
For each signal, open virtual training positions for all 5 strategies
Track positions through historical bars using same exit logic (SL/TP/time)
Update bandit algorithms with historical outcomes
CRITICAL TRANSPARENCY: Signal detection does NOT look ahead—signals use only data available at entry bar. Exit tracking DOES look ahead (uses future bars for SL/TP), which is acceptable because:
✅ Entry decisions remain valid (no forward bias)
✅ Learning phase only (not affecting shown signals)
✅ Real-time mirrors training (identical exit logic)
Training Completion: Once chart reaches current bar, system transitions to live mode. Dashboard displays training vs. live statistics for comparison.
Benefit: System begins live trading with 100-500 historical trades worth of learning, enabling immediate intelligent strategy selection.
Advanced Chop Zone Detection Engine
The Innovation: Multi-Layer Geometric Chop Analysis
Traditional chop filters use simple volatility metrics (ATR thresholds) that can't distinguish between trending volatility (good for signals) and choppy volatility (bad for signals). This system implements three-layer geometric pattern analysis to precisely identify consolidation zones where reversal signals fail.
Layer 1: Micro-Structure Chop Detection
Method: Analyzes micro pivot points (5-bar left, 2-bar right) to detect geometric compression patterns.
Slope Analysis:
Calculates slope of pivot high trendline and pivot low trendline
Compression ratio: compression = slope_high - slope_low
Pattern Classification:
Converging slopes (compression < -0.05) → "Rising Wedge" or "Falling Wedge"
Flat slopes (|slope| < 0.05) → "Rectangle"
Parallel slopes (|compression| < 0.1) → "Channel"
Expanding slopes → "Expanding Range"
Chop Scoring:
Rectangle pattern: +15 points (highest chop)
Low average slope (<0.05): +15 points
Wedge patterns: +12 points
Flat structures: +10 points
Why This Works: Geometric patterns reveal market indecision. Rectangles and wedges create false breakouts that trap technical traders. By quantifying geometric compression, system detects these zones before signals fire.
Layer 2: Macro-Structure Chop Detection
Method: Tracks major swing highs/lows using ATR-based deviation threshold (default 2.0× ATR), projects channel boundaries forward.
Channel Position Calculation:
proj_high = last_swing_high + (swing_high_slope × bars_since)
proj_low = last_swing_low + (swing_low_slope × bars_since)
channel_width = proj_high - proj_low
position = (close - proj_low) / channel_width
Dead Zone Detection:
Middle 50% of channel (position 0.25-0.75) = low-conviction zone
Score increases as price approaches center (0.5)
Chop Scoring:
Price in dead zone: +15 points (scaled by centrality)
Narrow channel width (<3× ATR): +15 points
Channel width 3-5× ATR: +10 points
Why This Works: Price in middle of range has equal probability of moving either direction. Institutional traders avoid mid-range entries. By detecting "dead zones," system avoids low-probability setups.
Layer 3: Volume Chop Scoring
Method: Low volume indicates weak conviction—precursor to ranging behavior.
Scoring:
Volume < 0.5× average: +20 points
Volume 0.5-0.8× average: +15 points
Volume 0.8-1.0× average: +10 points
Overall Chop Intensity & Signal Filtering
Total Chop Calculation:
chop_intensity = micro_score + macro_score + (volume_score × volume_weight)
is_chop = chop_intensity >= 40
Signal Filtering (Three-Tier Approach):
1. Signal Blocking (Intensity > 70):
Extreme chop detected (e.g., tight rectangle + dead zone + low volume)
ALL signals blocked regardless of confluence
Chart displays red/orange background shading
2. Threshold Adjustment (Intensity 40-70):
Moderate chop detected
Confluence threshold increased: threshold += (chop_intensity / 50)
Only highest-quality signals pass
3. Strategy Weight Adjustment:
During Chop: Kernel-Dominant weight × 2.0 (entropy detects breakout precursors), Technical-Dominant weight × 0.3 (reduces false signals)
After Chop Exit: Weights revert to normal
Why This Three-Tier Approach Is Original: Most chop filters simply block all signals (loses breakout entries). This system adapts strategy selection during chop—allowing Kernel-Dominant (which excels at detecting low-entropy breakout precursors) to operate while suppressing Technical-Dominant (which generates false signals in consolidation). Result: System remains functional across full market regime spectrum.
Zero-Lag Filter Suite with Dynamic Volatility Scaling
Zero-Lag ADX (Trend Regime Detection)
Implementation: Applies ZLEMA to ADX components:
lag = (length - 1) / 2
zl_source = source + (source - source ) × strength
Dynamic Volatility Scaling (DVS):
Calculates volatility ratio: current_ATR / ATR_100period_avg
Adjusts ADX length dynamically: High vol → shorter length (faster), Low vol → longer length (smoother)
Regime Classification:
ADX > 25 with +DI > -DI = Bull Trend
ADX > 25 with -DI > +DI = Bear Trend
ADX < 25 = Ranging
Zero-Lag RSI Suite (4 Methods with Bandit Selection)
Method 1: Standard RSI - Traditional Wilder's RSI
Method 2: Ehlers Zero-Lag RSI
ema1 = ema(close, length)
ema2 = ema(ema1, length)
zl_close = close + (ema1 - ema2)
Method 3: ZLEMA RSI
lag = (length - 1) / 2
zl_close = close + (close - close )
Method 4: Kalman-Filtered RSI - Adaptive smoothing with process/measurement noise
RSI Method Bandit: Separate 4-arm bandit learns which calculation method produces best results. Updates independently after each trade.
Kalman Adaptive Filters
Fast Kalman: Low process noise → Responsive to genuine moves
Slow Kalman: Higher measurement noise → Filters noise
Application: Crossover logic for trend detection, acceleration analysis for momentum inflection
What Makes This Original
Innovation 1: Shadow Portfolio Validation
First TradingView script to implement parallel virtual portfolios for multi-armed bandit reward calculation. Instead of abstract scoring metrics, each strategy's performance is measured through realistic position tracking with stop-loss, take-profit, time-based exits, and risk-adjusted reward functions (P&L + win rate + drawdown). This provides orders-of-magnitude better reward signal quality for bandit learning than traditional score-based approaches.
Innovation 2: Three-Layer Geometric Chop Detection
Novel multi-scale geometric pattern analysis combining: (1) Micro-structure slope analysis with pattern classification (wedges, rectangles, channels), (2) Macro-structure channel projection with dead zone detection, (3) Volume confirmation. Unlike simple volatility filters, this system adapts strategy weights during chop —boosting Kernel-Dominant (breakout detection) while suppressing Technical-Dominant (false signal reduction)—allowing operation across full market regime spectrum without blind signal blocking.
Innovation 3: Historical Pre-Training System
Implements two-phase learning : Training phase (processes 300-1000 historical bars on chart load with proper state isolation) followed by live phase (real-time learning). Training positions tracked separately from live positions. System begins live trading with 100-500 trades worth of learned experience. Dashboard displays training vs. live performance for transparency.
Innovation 4: Contextual Multi-Armed Bandits with Regime-Specific Learning
Beyond standard bandits (global strategy quality), implements regime-specific alpha/beta parameters for Bull/Bear/Ranging contexts. System learns: "Strategy 2: 60% win rate in ranging markets, 45% in bull trends." Uses current regime's learned parameters for strategy selection, enabling regime-aware optimization.
Innovation 5: RSI Method Meta-Learning
Deploys 4 different RSI calculation methods (Standard, Ehlers ZL, ZLEMA, Kalman) with separate 4-arm bandit that learns which calculation works best. Updates RSI method bandit independently based on trade outcomes, allowing automatic adaptation to instrument characteristics.
Innovation 6: Dynamic Volatility Scaling (DVS)
Adjusts ALL lookback periods based on current ATR ratio vs. 100-period average. High volatility → shorter lengths (faster response). Low volatility → longer lengths (smoother signals). Applied system-wide to entropy, DFA, RSI, ADX, and Kalman filters for adaptive responsiveness.
How to Use: Practical Guide
Initial Setup (5 Minutes)
Theory Mode: Start with "BALANCED" (APEX for aggressive, CONSERVATIVE for defensive)
Enable RL: Toggle "Enable RL Auto-Optimization" to TRUE, select "Thompson Sampling"
Enable Confluence Modules: Divergence, Volume Analysis, Liquidity Mapping, RSI OB/OS, Trend Analysis, MACD (all recommended)
Enable Chop Filter: Toggle "Enable Chop Filter" to TRUE, sensitivity 1.0 (default)
Historical Training: Enable "Enable Historical Pre-Training", set 300-500 bars
Dashboard: Enable "Show Dashboard", position Top Right, size Large
Learning Phase (First 50-100 Bars)
Monitor Thompson Sampling Section:
Alpha/beta values should diverge from initial 1.0 after 20-30 trades
Expected win% should stabilize around 55-60% (excellent), >50% (acceptable)
"Pulls" column should show balanced exploration (not 100% one strategy)
Monitor Shadow Portfolios:
Equity curves should diverge (different strategies performing differently)
Win rate > 55% is strong
Max drawdown < 15% is healthy
Monitor Training vs Live (if enabled):
Delta difference < 10% indicates good generalization
Large negative delta suggests overfitting
Large positive delta suggests system adapting well
Optimization:
Too few signals: Lower "Base Confluence Threshold" to 2.5-3.0
Too many signals: Raise threshold to 4.0-4.5
One strategy dominates (>80%): Increase "Exploration Rate" to 0.20-0.25
Excessive chop blocking: Lower "Chop Sensitivity" to 0.7-0.8
Signal Interpretation
Dashboard Indicators:
"WAITING FOR SIGNAL": No confluence
"LONG ACTIVE ": Validated long entry
"SHORT ACTIVE ": Validated short entry
Chart Visuals:
Triangle markers: Entry signal (green = long, red = short)
Orange/red background: Chop zone
Lines: Support/resistance if enabled
Position Management
Entry: Enter on triangle marker, confirm direction matches dashboard, check confidence >60%
Stop-Loss: Entry ± 1.5× ATR or at structural swing point
Take-Profit:
TP1: Entry + 1.5R (take 50%, move SL to breakeven)
TP2: Entry + 3.0R (runner) or trail
Position Sizing:
Risk per trade = 1-2% of capital
Position size = (Account × Risk%) / (Entry - SL)
Recommended Settings by Instrument
Stocks (Large Cap): Balanced mode, Threshold 3.5, Thompson Sampling, Chop 1.0, 15min-1H, Training 300-500 bars
Forex Majors: Conservative-Balanced mode, Threshold 3.5-4.0, Thompson Sampling, Chop 0.8-1.0, 5min-30min, Training 400-600 bars
Cryptocurrency: Balanced-APEX mode, Threshold 3.0-3.5, Thompson Sampling, Chop 1.2-1.5, 15min-4H, Training 300-500 bars
Futures: Balanced mode, Threshold 3.5, UCB1 or Thompson, Chop 1.0, 5min-30min, Training 400-600 bars
Technical Approximations & Limitations
1. Thompson Sampling: Pseudo-Random Beta Distribution
Standard: Cryptographic RNG with true beta sampling
This Implementation: Box-Muller transform using market data as entropy source
Impact: Not cryptographically random but maintains exploration-exploitation balance. Sufficient for strategy selection.
2. Shadow Portfolio: Simplified Execution Model
Standard: Order book simulation with slippage, partial fills
This Implementation: Perfect fills at close price, no fees modeled
Impact: Real-world performance ~0.1-0.3% worse per trade due to execution costs.
3. Historical Training: Forward-Looking for Exits Only
Entry signals: Use only past data (causal, no bias)
Exit tracking: Uses future bars to determine SL/TP (forward-looking)
Impact: Acceptable because: (1) Entry logic remains valid, (2) Live trading mirrors training, (3) Improves learning quality. Training win rates reflect 8-bar evaluation window—live performance may differ if positions held longer.
4. Shannon Entropy & DFA: Simplified Calculations
Impact: 10-15% precision loss vs. academic implementations. Still captures predictability and persistence signals effectively.
General Limitations
No Predictive Guarantee: Past performance ≠ future results
Learning Period Required: Minimum 50-100 bars for stable statistics
Overfitting Risk: May not generalize to unprecedented conditions
Single-Instrument: No multi-asset correlation or sector context
Execution Assumptions: Degrades in illiquid markets (<100k volume), major news events, flash crashes
Risk Warnings & Disclaimers
No Guarantee of Profit: All trading involves substantial risk of loss. This indicator is a tool, not a guaranteed profit system.
System Failures: Software bugs possible despite testing. Use appropriate position sizing.
Market Regime Changes: Performance may degrade during extreme volatility (VIX >40), low liquidity periods, or fundamental regime shifts.
Broker-Specific Issues: Real-world execution includes slippage (0.1-0.5%), commissions, overnight financing costs, partial fills.
Forward-Looking Bias in Training: Historical training uses 8-bar forward window for exit evaluation. Dashboard "Training Win%" reflects this method. Real-time performance may differ.
Appropriate Use
This Indicator IS:
✅ Entry trigger system with confluence validation
✅ Risk management framework (automated SL/TP)
✅ Adaptive strategy selection engine
✅ Learning system that improves over time
This Indicator IS NOT:
❌ Complete trading strategy (requires position sizing, portfolio management)
❌ Replacement for due diligence
❌ Guaranteed profit generator
❌ Suitable for complete beginners
Recommended Complementary Analysis: Market context, volume profile, fundamental catalysts, higher timeframe alignment, support/resistance from other sources.
Conclusion
Chronos Reversal Labs V2.0 - Elite Edition synthesizes research from multi-armed bandit theory (Thompson Sampling, UCB, contextual bandits), market microstructure (geometric chop detection, zero-lag filters), and machine learning (shadow portfolio validation, historical pre-training, RSI method meta-learning).
Unlike typical indicator mashups, this system implements mathematically rigorous bandit algorithms with realistic performance validation, three-layer chop detection with adaptive strategy weighting, regime-specific learning, and full transparency on approximations and limitations.
The system is designed for intermediate to advanced traders who understand that no indicator is perfect, but through proper machine learning and realistic validation, we can build systems that improve over time and adapt to changing markets without manual intervention.
Use responsibly. Understand the limitations. Risk disclosure applies. Past performance does not guarantee future results.
Taking you to school. — Dskyz, Trade with insight. Trade with anticipation.

CRT / ORB Signals [Yosiet]What is the CRT Pattern?
The Counter-Retracement Pattern is a classic three-candle setup that reveals moments of market structure weakness and potential reversal. It occurs when a strong move is temporarily rejected, signaling a possible continuation.
Several names for the same candlestick pattern: CRT, ORB, Morning Star, Evening Star, and others, but I'm not going to talk about it.
Here’s the anatomy of a Bullish CRT:
Candle 1 (C1: The Signal Candle): A significant momentum candle in a downtrend.
Candle 2 (C2: The Retracement/Sweep Candle): This is the critical candle. It must sweep the low of C1 (liquidity grab / sweep) but then close with its body inside the range of C1 .
Candle 3 (C3: The Confirmation/Entry Candle): A bullish candle that closes above C2's close, confirming the pattern.
Here’s the anatomy of a Bearish CRT:
The bearish pattern is the exact inverse, sweeping the high of Candle 1.
Why This Indicator?
Clarity and Precision. This script is built for accuracy and minimalism.
No Repainting: The logic is calculated on the closed historical bars. The signal is only plotted on the entry candle (Candle 3) after it has closed.
Clean Visuals: Instead of cluttering every candle, it shows you only what you need:
Green Up Arrow: Signals a confirmed Bullish CRT, suggesting a Long entry.
Red Down Arrow: Signals a confirmed Bearish CRT, suggesting a Short entry.
Faint Circles: Subtle white circles mark the high/low of Candle 1 and Candle 2, helping you visually trace the pattern structure without obstruction.

Enhanced Oversold | 超跌信号 + 历史统计 + 模拟入出场 (v2.4)Enhanced Oversold | Oversold Signal + Historical Stats + Simulated Entries/Exits (v2.4) – Release Notes (EN)
1. Overview
This script is an advanced “buy-the-dip” toolkit for US stocks and ETFs. It detects rare, deep intraday selloffs on fundamentally strong names, then simulates a three-tier entry strategy around the event and tracks different exit paths.
The goal is to answer three questions:
* When did similar crashes happen in the past?
* How would a disciplined laddered entry have performed?
* How long did it take for price to recover under different exit rules?
2. Core idea
* Define an 8-hour “crash” relative to a robust reference price yBase = min(previous-day VWAP, previous close).
* Combine this with short-term RSI and 15m Z-score filters to avoid “random noise” dips.
* Filter out regime-level risk (index / sector crash, volatility spikes, liquidity stress, bad long-term trend).
* When a valid oversold event appears, simulate staged entries (E1/E2/E3) and exits, then record everything into a historical table and JSON for external analysis.
3. Signal logic (summary)
* Timeframe: designed for 15m / 5m charts, using US RTH session 09:30–16:00.
* Crash trigger (must all be true):
* 8h drawdown from yBase ≤ fixed threshold (default −6%) and the 8h low is recent within N×15m bars.
* RSI(1h) below an oversold level (default < 30).
* 15m return Z-score ≤ threshold (default ≤ −1.5) over a configurable window.
* Optional filters:
* Circuit breaker: SPY + sector ETF + VIX/VIX3M + VVIX conditions to avoid market-wide panic regimes.
* Liquidity stress: SPY 1h “stress index” (ATR/price, intraday range vs volume, and VIX Z-score) normalised to 0–100, with a user threshold.
* Shape filter: only accept “A-type” healthy long-term trend set-ups (6m / 12m performance vs VWAP/EMA and daily 200SMA slope).
4. Simulated entries (E1 / E2 / E3)
* E1: first ladder price anchored to the first RTH after the event, with optional “same-day RTH” entry if the event happens during RTH.
* E2: only becomes valid from the next RTH day onward, and only if the new RTH low breaks the E1-execution-day low. The target depth is based on E1 discount × (1+α).
* E3: only after E2, on a different day (not the E1 “anchor” day). Depth is based on the max discount of E1/E2 × (1+β).
* Stair and cap rules:
* A minimum tick step between ladders, adjustable in ticks.
* Optional cap so that every entry price must be below a multiple of the event price.
* Optional “chase on first RTH bar”: if nothing fills on the first RTH bar, prices can be lifted once toward the intraday low, while keeping ladder spacing and cap constraints.
* All actual fills are simulated against bar lows. The script records:
* Whether E1/E2/E3 filled.
* Actual execution prices.
* Average entry price and the entry sequence string (e.g. “13”, “123”).
5. Exit logic and timing metrics
Two exit rules are tracked in parallel:
* Exit Ref: exit when close returns to yBase.
* Exit Open+Y%: exit when close reaches min(event close, first post-event open) × (1+Y%).
For each event the script records:
* t_ref_d: days from event to first touch of yBase.
* tY_d: days until Open+Y% level is reached.
* tUp_d: days until price turns “bullish again” (RTH VWAP ≥ previous daily VWAP and close > previous close).
* tLow_d: days until the minimum price between event and t_ref (or end of window) is reached.
* lowToRef: that minimum price.
* ddMinPct: maximum drawdown (in %) from average entry to lowToRef.
Additional intraday stats for the first RTH after the event:
* dayFirstLow: low of the first RTH bar from the chosen statistics start.
* rthLow: overall RTH low of that day.
* eqFirst: whether the overall low equals the first-bar low.
* postDipAvg: average close after the daily low is formed (equal-weighted).
6. Historical table on chart
* The on-chart table shows up to maxRows events, most recent first.
* Columns include:
* Date, 8h drawdown, yBase, stress, circuit conditions, shape (A/B/C).
* Entry sequence and actual execution prices.
* Average entry price.
* Exit prices and PnL (in % and absolute) for both exit modes.
* Timing metrics (t_ref, tY, tUp, tLow).
* Min price to t_ref, max drawdown vs average entry.
* First RTH low, day RTH low, equality flag, post-dip average, and market flag (US/HK).
The table is only redrawn on bar close to reduce CPU load.
7. Liquidity stress pane
* Optional lower pane that plots the SPY-based liquidity stress index (0–100).
* Components (all on 60m SPY/VIX data):
* rvZ: Z-score of ATR/price.
* rpvZ: Z-score of intraday range divided by volume.
* vixZ: Z-score of VIX.
* Stress index = 50 + 10 × (rvZ + rpvZ + vixZ), clipped to .
* A horizontal line marks the current filter threshold.
8. Webhook JSON outputs
The indicator can send three types of alerts via alert():
* Signal
* Emitted only when a new oversold event fires.
* Contains ticker, market flag, event time, drop8h, RSI1h, Z15, yBase, shape, circuit reason, and stress.
* History
* Emitted when requested, containing a full snapshot of the latest event:
* All key metrics used in the table, including absolute PnL for both exit modes, timing metrics, drawdown stats, and post-dip averages.
* HistoryAll
* Compressed bulk export of all events as a compact JSON object:
* Short keys (d, dr8, yb, st, c, sh, e, px, avg, xr, pr, absR, xy, py, absY, tr, ty, tu, tl, l2r, dd, fl, rl, eq, pavg).
* Numbers rounded to 3 decimals to reduce payload size.
* Because TradingView enforces a payload size limit, HistoryAll is automatically split into multiple chunks (up to ~3200 characters each).
* When HistoryAll is selected and a manual “dump all” flag is turned on, the script will emit multiple alerts on the same bar until all chunks are sent.
9. What is new in v2.3
Compared with previous versions, v2.3 adds:
* Deeper risk metrics:
* Tracking of the minimum price until recovery (lowToRef) and its timing (tLow_d).
* Max drawdown vs average entry (ddMinPct) for each event.
* E1-execution-day RTH low tracking, used to decide whether later days truly “make a new low” before adding E2.
* Absolute PnL fields:
* absRef and absOY for both exit modes, calculated using user-defined share/contract sizes for E1/E2/E3.
* More compact and robust HistoryAll:
* Short-key JSON objects, 3-decimal numeric formatting, chunked output suitable for 3rd-party storage and analysis.
* Performance optimisations:
* Array length normalisation is done once per bar instead of inside the per-event loop.
* Table rendering only happens on bar close, and no longer clears the whole grid every bar.
* Same-day RTH pricing for event-day entries is restricted to the latest event only, reducing redundant work on historical events.
10. Usage notes and disclaimer
* Recommended canvas: 15m or 5m chart, US stocks / ETFs, with RTH session set to 09:30–16:00.
* For stable operation on TradingView’s servers, avoid extremely large lookback windows and oversized history tables if your symbol has very long history.
* This script is for educational and research purposes only.
* It is not financial advice and does not guarantee profitability. Always combine it with your own risk management, fundamental research, and market context.

Pinbar MTF - No Repaint# Pinbar MTF - No Repaint Indicator
## Complete Technical Documentation
---
## 📊 Overview
**Pinbar MTF (Multi-Timeframe) - No Repaint** is a professional-grade TradingView Pine Script indicator designed to detect high-probability pinbar reversal patterns with advanced filtering systems. The indicator is specifically engineered to be **100% non-repainting**, making it reliable for both live trading and backtesting.
### Key Features
✅ **Non-Repainting** - Signals only appear AFTER bar closes, never disappear
✅ **Three-Layer Filter System** - ATR, SWING, and RSI filters
✅ **Automatic SL/TP Calculation** - Based on risk:reward ratios
✅ **Real-time Alerts** - TradingView notifications for all signals
✅ **Visual Trade Management** - Lines, labels, and areas for entries, stops, and targets
✅ **Backtesting Ready** - Reliable historical data for strategy testing
---
## 🎯 What is a Pinbar?
A **Pinbar (Pin Bar/Pinocchio Bar)** is a single candlestick pattern that indicates a potential price reversal:
### Bullish Pinbar (BUY Signal)
- **Long lower wick** (rejection of lower prices)
- **Small body at the top** of the candle
- Shows buyers rejected sellers' attempt to push price down
- Forms at support levels or swing lows
- Entry signal for LONG positions
### Bearish Pinbar (SELL Signal)
- **Long upper wick** (rejection of higher prices)
- **Small body at the bottom** of the candle
- Shows sellers rejected buyers' attempt to push price up
- Forms at resistance levels or swing highs
- Entry signal for SHORT positions
---
## 🔧 How the Indicator Works
### 1. **Pinbar Detection Logic**
The indicator analyzes the **previous closed bar ** to identify pinbar patterns:
```
Bullish Pinbar Requirements:
- Lower wick > 72% of total candle range (adjustable)
- Upper wick < 28% of total candle range
- Close > Open (bullish candle body)
Bearish Pinbar Requirements:
- Upper wick > 72% of total candle range (adjustable)
- Lower wick < 28% of total candle range
- Close < Open (bearish candle body)
```
**Why check ?** By analyzing the previous completed bar, we ensure the pattern is fully formed and won't change, preventing repainting.
---
### 2. **Three-Layer Filter System**
#### 🔍 **Filter #1: ATR (Average True Range) Filter**
- **Purpose**: Ensures the pinbar has significant size
- **Function**: Only signals if pinbar range ≥ ATR value
- **Benefit**: Filters out small, insignificant pinbars
- **Settings**:
- Enable/Disable toggle
- ATR Period (default: 7)
**Example**: If ATR = 50 pips, only pinbars with 50+ pip range will signal.
---
#### 🔍 **Filter #2: SWING Filter** (Always Active)
- **Purpose**: Confirms pinbar forms at swing highs/lows
- **Function**: Validates the pinbar is an absolute high/low
- **Benefit**: Identifies true reversal points
- **Settings**:
- Swing Candles (default: 3)
**How it works**:
- For bullish pinbar: Checks if low is lowest of past 3 bars
- For bearish pinbar: Checks if high is highest of past 3 bars
**Example**: With 3 swing candles, a bullish pinbar must have the lowest low among the last 3 bars.
---
#### 🔍 **Filter #3: RSI (Relative Strength Index) Filter**
- **Purpose**: Confirms momentum conditions
- **Function**: Prevents signals in extreme momentum zones
- **Benefit**: Avoids counter-trend trades
- **Settings**:
- Enable/Disable toggle
- RSI Period (default: 7)
- RSI Source (Close, Open, High, Low, HL2, HLC3, OHLC4)
- Overbought Level (default: 70)
- Oversold Level (default: 30)
**Logic**:
- Bullish Pinbar: Only signals if RSI < 70 (not overbought)
- Bearish Pinbar: Only signals if RSI > 30 (not oversold)
---
### 3. **Stop Loss Calculation**
Two methods available:
#### Method A: ATR-Based Stop Loss (Recommended)
```
Bullish Pinbar:
SL = Pinbar Low - (1 × ATR)
Bearish Pinbar:
SL = Pinbar High + (1 × ATR)
```
**Benefit**: Dynamic stops that adapt to market volatility
#### Method B: Fixed Pips Stop Loss
```
Bullish Pinbar:
SL = Pinbar Low - (Fixed Pips)
Bearish Pinbar:
SL = Pinbar High + (Fixed Pips)
```
**Settings**:
- Calculate Stop with ATR (toggle)
- Stop Pips without ATR (default: 5)
---
### 4. **Take Profit Calculation**
Take Profit is calculated based on Risk:Reward ratio:
```
Bullish Trade:
TP = Entry + (Entry - SL) × Risk:Reward Ratio
Bearish Trade:
TP = Entry - (SL - Entry) × Risk:Reward Ratio
```
**Example**:
- Entry: 1.2000
- SL: 1.1950 (50 pip risk)
- RR: 2:1
- TP: 1.2100 (100 pip reward = 50 × 2)
**Settings**:
- Risk:Reward Ratio (default: 1.0, range: 0.1 to 10.0)
---
## 📈 Visual Elements
### On-Chart Displays
1. **Signal Markers**
- 🟢 **Green Triangle Up** = Bullish Pinbar (BUY)
- 🔴 **Red Triangle Down** = Bearish Pinbar (SELL)
- Placed directly on the pinbar candle
2. **Entry Labels**
- Green "BUY" label with entry price
- Red "SELL" label with entry price
- Shows exact entry level
3. **Stop Loss Lines**
- 🔴 Red horizontal line
- "SL" label
- Extends 20 bars forward
4. **Take Profit Lines**
- 🟢 Green horizontal line
- "TP" label
- Extends 20 bars forward
5. **Risk/Reward Areas** (Optional)
- Red shaded box = Risk zone (Entry to SL)
- Green shaded box = Reward zone (Entry to TP)
- Visual risk:reward visualization
6. **Info Table** (Top Right)
- Displays current settings
- Shows filter status (ON/OFF)
- Real-time RSI value
- Quick reference panel
---
## 🔔 Alert System
Three alert types available:
### 1. Combined Alert: "Pinbar Signal (Any Direction)"
- Fires for BOTH bullish and bearish pinbars
- **Best for**: General monitoring
- **Message**: "Pinbar Signal Detected on {TICKER} at {PRICE}"
### 2. Bullish Alert: "Bullish Pinbar Alert"
- Fires ONLY for BUY signals
- **Best for**: Long-only strategies
- **Message**: "BUY Signal on {TICKER} at {PRICE}"
### 3. Bearish Alert: "Bearish Pinbar Alert"
- Fires ONLY for SELL signals
- **Best for**: Short-only strategies
- **Message**: "SELL Signal on {TICKER} at {PRICE}"
---
## ⚙️ Input Parameters Reference
### **Filters Group**
| Parameter | Default | Range | Description |
|-----------|---------|-------|-------------|
| ATR Filter on Pinbar Range? | ✅ ON | Boolean | Enable/disable ATR filter |
| ATR Period | 7 | 1+ | Lookback period for ATR calculation |
| Swing Candles | 3 | 1+ | Bars to check for swing high/low |
| RSI Filter on Pinbar? | ❌ OFF | Boolean | Enable/disable RSI filter |
| RSI Period | 7 | 2+ | Lookback period for RSI calculation |
| RSI Source | Close | Multiple | Price data for RSI (Close/Open/High/Low/etc) |
| RSI Overbought Level | 70 | 50-100 | Upper threshold for RSI filter |
| RSI Oversold Level | 30 | 0-50 | Lower threshold for RSI filter |
### **Pinbar Detection Group**
| Parameter | Default | Range | Description |
|-----------|---------|-------|-------------|
| Shadow % vs Body | 72 | 50-95 | Minimum wick size as % of total range |
### **Visualization Group**
| Parameter | Default | Range | Description |
|-----------|---------|-------|-------------|
| Show SL and TP Lines? | ✅ ON | Boolean | Display stop loss and take profit lines |
| Show SL and TP Area? | ❌ OFF | Boolean | Show shaded risk/reward boxes |
### **Risk Management Group**
| Parameter | Default | Range | Description |
|-----------|---------|-------|-------------|
| Risk:Reward Ratio | 1.0 | 0.1-10.0 | Target profit vs risk (1.0 = 1:1, 2.0 = 1:2) |
| Calculate Stop with ATR? | ✅ ON | Boolean | Use ATR for stop calculation |
| Stop Pips without ATR | 5 | 1+ | Fixed pip stop when ATR disabled |
---
## 🚫 Non-Repainting Architecture
### What is Repainting?
**Repainting** occurs when an indicator's historical signals differ from what appeared in real-time. This makes backtesting unreliable and can lead to false confidence in a strategy.
### How This Indicator Prevents Repainting
1. **Closed Bar Analysis**
- All calculations use ` ` offset (previous bar)
- Only analyzes COMPLETED candles
- Signals appear on the bar AFTER the pinbar closes
2. **Confirmed Swing Points**
- Waits for sufficient bar history before signaling
- Only checks historical bars that cannot change
- Prevents premature swing detection
3. **Static Alert Timing**
- Alerts fire only after bar completion
- No conditional logic that changes historically
- Same results in replay mode and live trading
### Verification Method
To verify non-repainting behavior:
1. Apply indicator to chart
2. Note signal locations and prices
3. Refresh browser / reload chart
4. **Signals remain in exact same locations**
---
## 💼 Trading Strategy Guidelines
### Entry Rules
**For Bullish Pinbar (LONG):**
1. Wait for green triangle to appear
2. Enter at close of pinbar (shown in label)
3. Alternative: Enter on break of pinbar high
4. Place stop loss at red SL line
5. Set target at green TP line
**For Bearish Pinbar (SHORT):**
1. Wait for red triangle to appear
2. Enter at close of pinbar (shown in label)
3. Alternative: Enter on break of pinbar low
4. Place stop loss at red SL line
5. Set target at green TP line
### Risk Management
- **Position Sizing**: Risk only 1-2% of account per trade
- **Stop Loss**: Always use the calculated SL (never move it wider)
- **Take Profit**: Use calculated TP or trail stop after 1:1 RR
- **Multiple Timeframes**: Confirm signals on higher timeframe
### Best Practices
✅ **DO:**
- Wait for bar to close before entering
- Trade in direction of higher timeframe trend
- Use on liquid markets with clear support/resistance
- Combine with price action analysis
- Keep a trading journal
❌ **DON'T:**
- Enter before bar closes (prevents seeing full pattern)
- Trade against strong trends
- Ignore the filters (they improve win rate)
- Risk more than 2% per trade
- Trade every signal (be selective)
---
## 📊 Backtesting & Data Export
### Available Data Points
The indicator exports these values for strategy development:
| Output | Description |
|--------|-------------|
| Bullish Signal | 1 = BUY signal, 0 = No signal |
| Bearish Signal | 1 = SELL signal, 0 = No signal |
| Bull SL | Stop loss level for long trades |
| Bull TP | Take profit level for long trades |
| Bull Entry | Entry price for long trades |
| Bear SL | Stop loss level for short trades |
| Bear TP | Take profit level for short trades |
| Bear Entry | Entry price for short trades |
### How to Use in Strategy
These values can be accessed by Pine Script strategies using:
```pine
indicator_values = request.security(syminfo.tickerid, timeframe.period,
)
```
---
## 🎓 Understanding the Filters
### Why Use Multiple Filters?
Single-indicator systems often generate too many false signals. This indicator uses a **confluence approach**:
1. **Pinbar Pattern** = Price rejection detected
2. **+ SWING Filter** = Rejection at key level
3. **+ ATR Filter** = Significant move
4. **+ RSI Filter** = Favorable momentum
**Result**: Higher probability setups with better risk:reward
### Filter Optimization
**Conservative Settings** (Fewer, Higher Quality Signals):
- ATR Filter: ON
- Swing Candles: 5
- RSI Filter: ON
- Shadow %: 75%
**Aggressive Settings** (More Signals, More Noise):
- ATR Filter: OFF
- Swing Candles: 2
- RSI Filter: OFF
- Shadow %: 65%
**Balanced Settings** (Recommended):
- ATR Filter: ON
- Swing Candles: 3
- RSI Filter: OFF (or ON for trending markets)
- Shadow %: 72%
---
## 🔍 Troubleshooting
### "No Signals Appearing"
**Possible Causes:**
1. Filters are too strict
2. No pinbars forming on chart
3. Insufficient bar history
**Solutions:**
- Reduce Shadow % to 65%
- Reduce Swing Candles to 2
- Disable ATR or RSI filters temporarily
- Check that chart has enough data loaded
### "Too Many Signals"
**Solutions:**
- Enable ATR filter
- Increase Swing Candles to 4-5
- Enable RSI filter
- Increase Shadow % to 75-80%
### "Signals Appearing Late"
**This is normal behavior!** The indicator:
- Analyzes previous closed bar
- Signals appear on the bar AFTER the pinbar
- This is what prevents repainting
- Signal latency is 1 bar (by design)
---
## 📝 Technical Specifications
**Indicator Type:** Overlay (displays on price chart)
**Pine Script Version:** 5
**Max Labels:** 500
**Max Lines:** 500
**Repainting:** None (100% non-repainting)
**Data Window Values:** 8 exported values
**Alert Types:** 3 (Combined, Bullish, Bearish)
**Performance:**
- Lightweight script (fast execution)
- Works on all timeframes
- Compatible with all markets (Forex, Crypto, Stocks, Futures)
- No data snooping bias
---
## 🎯 Use Cases
### 1. **Swing Trading**
- Timeframe: Daily, 4H
- Filter Settings: All enabled
- Best for: Catching major reversals
### 2. **Day Trading**
- Timeframe: 15m, 1H
- Filter Settings: ATR + SWING only
- Best for: Intraday reversals
### 3. **Scalping**
- Timeframe: 5m, 15m
- Filter Settings: SWING only (aggressive)
- Best for: Quick reversals (requires experience)
### 4. **Position Trading**
- Timeframe: Weekly, Daily
- Filter Settings: All enabled + high RR (2:1 or 3:1)
- Best for: Long-term trend reversal catches
---
## 🏆 Advantages Over Other Pinbar Indicators
✅ **Guaranteed Non-Repainting** - Many pinbar indicators repaint; this one never does
✅ **Automatic SL/TP** - No manual calculation needed
✅ **Multi-Layer Filtering** - Reduces false signals significantly
✅ **Visual Trade Management** - Clear entry, stop, and target levels
✅ **Flexible Configuration** - Adaptable to any trading style
✅ **Alert System** - Never miss a setup
✅ **Backtesting Ready** - Reliable historical data
✅ **Professional Grade** - Suitable for live trading
---
## 📚 Educational Resources
### Recommended Reading on Pinbars
- "The Pin Bar Trading Strategy" by Nial Fuller
- "Price Action Trading" by Al Brooks
- TradingView Education: Price Action Patterns
### Practice Recommendations
1. Paper trade signals for 20+ trades before live trading
2. Backtest on different timeframes and markets
3. Keep detailed records of all trades
4. Analyze winning vs losing setups
5. Refine filter settings based on results
---
## ⚖️ Disclaimer
This indicator is a tool for technical analysis and does not guarantee profits. Trading involves substantial risk of loss. Past performance is not indicative of future results.
- Always use proper risk management
- Never risk more than you can afford to lose
- Consider your trading experience and objectives
- Seek independent financial advice if needed
---
## 📧 Version Information
**Current Version:** 1.0
**Last Updated:** 2024
**Compatibility:** TradingView Pine Script v5
**Status:** Production Ready
---
## 🔄 Future Enhancements (Potential)
Possible future additions:
- Multi-timeframe confirmation option
- Volume filter integration
- Customizable color schemes
- Win rate statistics display
- Partial profit taking levels
- Trailing stop functionality
---
## 📖 Quick Start Guide
### 5-Minute Setup
1. **Add to Chart**
- Open TradingView
- Go to Pine Editor
- Paste the code
- Click "Add to Chart"
2. **Configure Settings**
- Open indicator settings (gear icon)
- Start with default settings
- Enable "Show SL and TP Lines"
3. **Set Alert**
- Right-click indicator name
- Click "Add Alert"
- Select "Pinbar Signal (Any Direction)"
- Configure notification method
4. **Test**
- Scroll back on chart
- Verify signals make sense
- Check that signals don't repaint
5. **Trade** (After Practice!)
- Wait for alert
- Verify signal quality
- Enter, place SL/TP
- Manage trade
---
## 🎯 Final Thoughts
The **Pinbar MTF - No Repaint** indicator is designed for serious traders who value:
- **Reliability** over flashy signals
- **Quality** over quantity
- **Honesty** over false promises
This indicator will NOT:
- Make you rich overnight
- Win every trade
- Replace proper trading education
This indicator WILL:
- Identify high-probability reversal setups
- Save you analysis time
- Provide consistent, non-repainting signals
- Help you develop a systematic trading approach
**Success in trading comes from:**
1. Proper education (60%)
2. Risk management (30%)
3. Technical tools like this indicator (10%)
Use this tool as part of a complete trading plan, not as a standalone solution.

Manifold Singularity EngineManifold Singularity Engine: Catastrophe Theory Detection Through Multi-Dimensional Topology Analysis
The Manifold Singularity Engine applies catastrophe theory from mathematical topology to multi-dimensional price space analysis, identifying potential reversal conditions by measuring manifold curvature, topological complexity, and fractal regime states. Unlike traditional reversal indicators that rely on price pattern recognition or momentum oscillators, this system reconstructs the underlying geometric surface (manifold) that price evolves upon and detects points where this topology undergoes catastrophic folding—mathematical singularities that correspond to forced directional changes in price dynamics.
The indicator combines three analytical frameworks: phase space reconstruction that embeds price data into a multi-dimensional coordinate system, catastrophe detection that measures when this embedded manifold reaches critical curvature thresholds indicating topology breaks, and Hurst exponent calculation that classifies the current fractal regime to adaptively weight detection sensitivity. This creates a geometry-based reversal detection system with visual feedback showing topology state, manifold distortion fields, and directional probability projections.
What Makes This Approach Different
Phase Space Embedding Construction
The core analytical method reconstructs price evolution as movement through a three-dimensional coordinate system rather than analyzing price as a one-dimensional time series. The system calculates normalized embedding coordinates: X = normalize(price_velocity, window) , Y = normalize(momentum_acceleration, window) , and Z = normalize(volume_weighted_returns, window) . These coordinates create a trajectory through phase space where price movement traces a path across a geometric surface—the market manifold.
This embedding approach differs fundamentally from traditional technical analysis by treating price not as a sequential data stream but as a dynamical system evolving on a curved surface in multi-dimensional space. The trajectory's geometric properties (curvature, complexity, folding) contain information about impending directional changes that single-dimension analysis cannot capture. When this manifold undergoes rapid topological deformation, price must respond with directional change—this is the mathematical basis for catastrophe detection.
Statistical normalization using z-score transformation (subtracting mean, dividing by standard deviation over a rolling window) ensures the coordinate system remains scale-invariant across different instruments and volatility regimes, allowing identical detection logic to function on forex, crypto, stocks, or indices without recalibration.
Catastrophe Score Calculation
The catastrophe detection formula implements a composite anomaly measurement combining multiple topology metrics: Catastrophe_Score = 0.45×Curvature_Percentile + 0.25×Complexity_Ratio + 0.20×Condition_Percentile + 0.10×Gradient_Percentile . Each component measures a distinct aspect of manifold distortion:
Curvature (κ) is computed using the discrete Laplacian operator: κ = √ , which measures how sharply the manifold surface bends at the current point. High curvature values indicate the surface is folding or developing a sharp corner—geometric precursors to catastrophic topology breaks. The Laplacian measures second derivatives (rate of change of rate of change), capturing acceleration in the trajectory's path through phase space.
Topological Complexity counts sign changes in the curvature field over the embedding window, measuring how chaotically the manifold twists and oscillates. A smooth, stable surface produces low complexity; a highly contorted, unstable surface produces high complexity. This metric detects when the geometric structure becomes informationally dense with multiple local extrema, suggesting an imminent topology simplification event (catastrophe).
Condition Number measures the Jacobian matrix's sensitivity: Condition = |Trace| / |Determinant|, where the Jacobian describes how small changes in price produce changes in the embedding coordinates. High condition numbers indicate numerical instability—points where the coordinate transformation becomes ill-conditioned, suggesting the manifold mapping is approaching a singularity.
Each metric is converted to percentile rank within a rolling window, then combined using weighted sum. The percentile transformation creates adaptive thresholds that automatically adjust to each instrument's characteristic topology without manual recalibration. The resulting 0-100% catastrophe score represents the current bar's position in the distribution of historical manifold distortion—values above the threshold (default 65%) indicate statistically extreme topology states where reversals become geometrically probable.
This multi-metric ensemble approach prevents false signals from isolated anomalies: all four geometric features must simultaneously indicate distortion for a high catastrophe score, ensuring only true manifold breaks trigger detection.
Hurst Exponent Regime Classification
The Hurst exponent calculation implements rescaled range (R/S) analysis to measure the fractal dimension of price returns: H = log(R/S) / log(n) , where R is the range of cumulative deviations from mean and S is the standard deviation. The resulting value classifies market behavior into three fractal regimes:
Trending Regime (H > 0.55) : Persistent price movement where future changes are positively correlated with past changes. The manifold exhibits directional momentum with smooth topology evolution. In this regime, catastrophe signals receive 1.2× confidence multiplier because manifold breaks in trending conditions produce high-magnitude directional changes.
Mean-Reverting Regime (H < 0.45) : Anti-persistent price movement where future changes tend to oppose past changes. The manifold exhibits oscillatory topology with frequent small-scale distortions. Catastrophe signals receive 0.8× confidence multiplier because reversal significance is diminished in choppy conditions where the manifold constantly folds at minor scales.
Random Walk Regime (H ≈ 0.50) : No statistical correlation in returns. The manifold evolution is geometrically neutral with moderate topology stability. Standard 1.0× confidence multiplier applies.
This adaptive weighting system solves a critical problem in reversal detection: the same geometric catastrophe has different trading implications depending on the fractal regime. A manifold fold in a strong trend suggests a significant reversal opportunity; the same fold in mean-reversion suggests a minor oscillation. The Hurst-based regime filter ensures detection sensitivity automatically adjusts to market character without requiring trader intervention.
The implementation uses logarithmic price returns rather than raw prices to ensure
stationarity, and applies the calculation over a configurable window (default 5 bars) to balance responsiveness with statistical validity. The Hurst value is then smoothed using exponential moving average to reduce noise while maintaining regime transition detection.
Multi-Layer Confirmation Architecture
The system implements five independent confirmation filters that must simultaneously validate
before any singularity signal generates:
1. Catastrophe Threshold : The composite anomaly score must exceed the configured threshold (default 0.65 on 0-1 scale), ensuring the manifold distortion is statistically extreme relative to recent history.
2. Pivot Structure Confirmation : Traditional swing high/low patterns (using ta.pivothigh and ta.pivotlow with configurable lookback) must form at the catastrophe bar. This ensures the geometric singularity coincides with observable price structure rather than occurring mid-swing where interpretation is ambiguous.
3. Swing Size Validation : The pivot magnitude must exceed a minimum threshold measured in ATR units (default 1.5× Average True Range). This filter prevents signals on insignificant price jiggles that lack meaningful reversal potential, ensuring only substantial swings with adequate risk/reward ratios generate signals.
4. Volume Confirmation : Current volume must exceed 1.3× the 20-period moving average, confirming genuine market participation rather than low-liquidity price noise. Manifold catastrophes without volume support often represent false topology breaks that don't translate to sustained directional change.
5. Regime Validity : The market must be classified as either trending (ADX > configured threshold, default 30) or volatile (ATR expansion > configured threshold, default 40% above 30-bar average), and must NOT be in choppy/ranging state. This critical filter prevents trading during geometrically unfavorable conditions where edge deteriorates.
All five conditions must evaluate true simultaneously for a signal to generate. This conjunction-based logic (AND not OR) dramatically reduces false positives while preserving true reversal detection. The architecture recognizes that geometric catastrophes occur frequently in noisy data, but only those catastrophes that align with confirming evidence across price structure, participation, and regime characteristics represent tradable opportunities.
A cooldown mechanism (default 8 bars between signals) prevents signal clustering at extended pivot zones where the manifold may undergo multiple small catastrophes during a single reversal process.
Direction Classification System
Unlike binary bull/bear systems, the indicator implements a voting mechanism combining four
directional indicators to classify each catastrophe:
Pivot Vote : +1 if pivot low, -1 if pivot high, 0 otherwise
Trend Vote : Based on slow frequency (55-period EMA) slope—+1 if rising, -1 if falling, 0 if flat
Flow Vote : Based on Y-gradient (momentum acceleration)—+1 if positive, -1 if negative, 0 if neutral
Mid-Band Vote : Based on price position relative to medium frequency (21-period EMA)—+1 if above, -1 if below, 0 if at
The total vote sum classifies the singularity: ≥2 votes = Bullish , ≤-2 votes = Bearish , -1 to +1 votes = Neutral (skip) . This majority-consensus approach ensures directional classification requires alignment across multiple timeframes and analysis dimensions rather than relying on a single indicator. Neutral signals (mixed voting) are displayed but should not be traded, as they represent geometric catastrophes without clear directional resolution.
Core Calculation Methodology
Embedding Coordinate Generation
Three normalized phase space coordinates are constructed from price data:
X-Dimension (Velocity Space):
price_velocity = close - close
X = (price_velocity - mean) / stdev over hurstWindow
Y-Dimension (Acceleration Space):
momentum = close - close
momentum_accel = momentum - momentum
Y = (momentum_accel - mean) / stdev over hurstWindow
Z-Dimension (Volume-Weighted Space):
vol_normalized = (volume - mean) / stdev over embedLength
roc = (close - close ) / close
Z = (roc × vol_normalized - mean) / stdev over hurstWindow
These coordinates define a point in 3D phase space for each bar. The trajectory connecting these points is the reconstructed manifold.
Gradient Field Calculation
First derivatives measure local manifold slope:
dX/dt = X - X
dY/dt = Y - Y
Gradient_Magnitude = √
The gradient direction indicates where the manifold is "pushing" price. Positive Y-gradient suggests upward topological pressure; negative Y-gradient suggests downward pressure.
Curvature Tensor Components
Second derivatives measure manifold bending using discrete Laplacian:
Laplacian_X = X - 2×X + X
Laplacian_Y = Y - 2×Y + Y
Laplacian_Magnitude = √
This is then normalized:
Curvature_Normalized = (Laplacian_Magnitude - mean) / stdev over embedLength
High normalized curvature (>1.5) indicates sharp manifold folding.
Complexity Accumulation
Sign changes in curvature field are counted:
Sign_Flip = 1 if sign(Curvature ) ≠ sign(Curvature ), else 0
Topological_Complexity = sum(Sign_Flip) over embedLength window
This measures oscillation frequency in the geometry. Complexity >5 indicates chaotic topology.
Condition Number Stability Analysis
Jacobian matrix sensitivity is approximated:
dX/dp = dX/dt / (price_change + epsilon)
dY/dp = dY/dt / (price_change + epsilon)
Jacobian_Determinant = (dX/dt × dY/dp) - (dX/dp × dY/dt)
Jacobian_Trace = dX/dt + dY/dp
Condition_Number = |Trace| / (|Determinant| + epsilon)
High condition numbers indicate numerical instability near singularities.
Catastrophe Score Assembly
Each metric is converted to percentile rank over embedLength window, then combined:
Curvature_Percentile = percentrank(abs(Curvature_Normalized), embedLength)
Gradient_Percentile = percentrank(Gradient_Magnitude, embedLength)
Condition_Percentile = percentrank(abs(Condition_Z_Score), embedLength)
Complexity_Ratio = clamp(Topological_Complexity / embedLength, 0, 1)
Final score:
Raw_Anomaly = 0.45×Curvature_P + 0.25×Complexity_R + 0.20×Condition_P + 0.10×Gradient_P
Catastrophe_Score = Raw_Anomaly × Hurst_Multiplier
Values are clamped to range.
Hurst Exponent Calculation
Rescaled range analysis on log returns:
Calculate log returns: r = log(close) - log(close )
Compute cumulative deviations from mean
Find range: R = max(cumulative_dev) - min(cumulative_dev)
Calculate standard deviation: S = stdev(r, hurstWindow)
Compute R/S ratio
Hurst = log(R/S) / log(hurstWindow)
Clamp to and smooth with 5-period EMA
Regime Classification Logic
Volatility Regime:
ATR_MA = SMA(ATR(14), 30)
Vol_Expansion = ATR / ATR_MA
Is_Volatile = Vol_Expansion > (1.0 + minVolExpansion)
Trend Regime (Corrected ADX):
Calculate directional movement (DM+, DM-)
Smooth with Wilder's RMA(14)
Compute DI+ and DI- as percentages
Calculate DX = |DI+ - DI-| / (DI+ + DI-) × 100
ADX = RMA(DX, 14)
Is_Trending = ADX > (trendStrength × 100)
Chop Detection:
Is_Chopping = NOT Is_Trending AND NOT Is_Volatile
Regime Validity:
Regime_Valid = (Is_Trending OR Is_Volatile) AND NOT Is_Chopping
Signal Generation Logic
For each bar:
Check if catastrophe score > topologyStrength threshold
Verify regime is valid
Confirm Hurst alignment (trending or mean-reverting with pivot)
Validate pivot quality (price extended outside spectral bands then re-entered)
Confirm volume/volatility participation
Check cooldown period has elapsed
If all true: compute directional vote
If vote ≥2: Bullish Singularity
If vote ≤-2: Bearish Singularity
If -1 to +1: Neutral (display but skip)
All conditions must be true for signal generation.
Visual System Architecture
Spectral Decomposition Layers
Three harmonic frequency bands visualize entropy state:
Layer 1 (Surface Frequency):
Center: EMA(8)
Width: ±0.3 × 0.5 × ATR
Transparency: 75% (most visible)
Represents fast oscillations
Layer 2 (Mid Frequency):
Center: EMA(21)
Width: ±0.5 × 0.5 × ATR
Transparency: 85%
Represents medium cycles
Layer 3 (Deep Frequency):
Center: EMA(55)
Width: ±0.7 × 0.5 × ATR
Transparency: 92% (most transparent)
Represents slow baseline
Convergence of layers indicates low entropy (stable topology). Divergence indicates high entropy (catastrophe building). This decomposition reveals how different frequency components of price movement interact—when all three align, the manifold is in equilibrium; when they separate, topology is unstable.
Energy Radiance Fields
Concentric boxes emanate from each singularity bar:
For each singularity, 5 layers are generated:
Layer n: bar_index ± (n × 1.5 bars), close ± (n × 0.4 × ATR)
Transparency gradient: inner 75% → outer 95%
Color matches signal direction
These fields visualize the "energy well" of the catastrophe—wider fields indicate stronger topology distortion. The exponential expansion creates a natural radiance effect.
Singularity Node Geometry
N-sided polygon (default hexagon) at each signal bar:
Vertices calculated using polar coordinates
Rotation angle: bar_index × 0.1 (creates animation)
Radius: ATR × singularity_strength × 2
Connects vertices with colored lines
The rotating geometric primitive marks the exact catastrophe bar with visual prominence.
Gradient Flow Field
Directional arrows display manifold slope:
Spawns every 3 bars when gradient_magnitude > 0.1
Symbol: "↗" if dY/dt > 0.1, "↘" if dY/dt < -0.1, "→" if neutral
Color: Bull/bear/neutral based on direction
Density limited to flowDensity parameter
Arrows cluster when gradient is strong, creating intuitive topology visualization.
Probability Projection Cones
Forward trajectory from each singularity:
Projects 10 bars forward
Direction based on vote classification
Center line: close + (direction × ATR × 3)
Uncertainty width: ATR × singularity_strength × 2
Dashed boundaries, solid center
These are mathematical projections based on current gradient, not price targets. They visualize expected manifold evolution if topology continues current trajectory.
Dashboard Metrics Explanation
The real-time control panel displays six core metrics plus regime status:
H (Hurst Exponent):
Value: Current Hurst (0-1 scale)
Label: TREND (>0.55), REVERT (<0.45), or RANDOM (0.45-0.55)
Icon: Direction arrow based on regime
Purpose: Shows fractal character—only trade when favorable
Σ (Catastrophe Score):
Value: Current composite anomaly (0-100%)
Bar gauge shows relative strength
Icon: ◆ if above threshold, ○ if below
Purpose: Primary signal strength indicator
κ (Curvature):
Value: Normalized Laplacian magnitude
Direction arrow shows sign
Color codes severity (green<0.8, yellow<1.5, red≥1.5)
Purpose: Shows manifold bending intensity
⟳ (Topology Complexity):
Value: Count of sign flips in curvature
Icon: ◆ if >3, ○ otherwise
Color codes chaos level
Purpose: Indicates geometric instability
V (Volatility Expansion):
Value: ATR expansion percentage above 30-bar average
Icon: ● if volatile, ○ otherwise
Purpose: Confirms energy present for reversal
T (Trend Strength):
Value: ADX reading (0-100)
Icon: ● if trending, ○ otherwise
Purpose: Shows directional bias strength
R (Regime):
Label: EXPLOSIVE / TREND / VOLATILE / CHOP / NEUTRAL
Icon: ✓ if valid, ✗ if invalid
Purpose: Go/no-go filter for trading
STATE (Bottom Display):
Shows: "◆ BULL SINGULARITY" (green), "◆ BEAR SINGULARITY" (red), "◆ WEAK/NEUTRAL" (orange), or "— Monitoring —" (gray)
Purpose: Current signal status at a glance
How to Use This Indicator
Initial Setup and Configuration
Apply the indicator to your chart with default settings as a starting point. The default parameters (21-bar embedding, 5-bar Hurst window, 2.5σ singularity threshold, 0.65 topology confirmation) are optimized for balanced detection across most instruments and timeframes. For very fast markets (scalping crypto, 1-5min charts), consider reducing embedding depth to 13-15 bars and Hurst window to 3 bars for more responsive detection. For slower markets (swing trading stocks, 4H-Daily charts), increase embedding depth to 34-55 bars and Hurst window to 8-10 bars for more stable topology measurement.
Enable the dashboard (top right recommended) to monitor real-time metrics. The control panel is your primary decision interface—glancing at the dashboard should instantly communicate whether conditions favor trading and what the current topology state is. Position and size the dashboard to remain visible but not obscure price action.
Enable regime filtering (strongly recommended) to prevent trading during choppy/ranging conditions where geometric edge deteriorates. This single setting can dramatically improve overall performance by eliminating low-probability environments.
Reading Dashboard Metrics for Trade Readiness
Before considering any trade, verify the dashboard shows favorable conditions:
Hurst (H) Check:
The Hurst Exponent reading is your first filter. Only consider trades when H > 0.50 . Ideal conditions show H > 0.60 with "TREND" label—this indicates persistent directional price movement where manifold catastrophes produce significant reversals. When H < 0.45 (REVERT label), the market is mean-reverting and catastrophes represent minor oscillations rather than substantial pivots. Do not trade in mean-reverting regimes unless you're explicitly using range-bound strategies (which this indicator is not optimized for). When H ≈ 0.50 (RANDOM label), edge is neutral—acceptable but not ideal.
Catastrophe (Σ) Monitoring:
Watch the Σ percentage build over time. Readings consistently below 50% indicate stable topology with no imminent reversals. When Σ rises above 60-65%, manifold distortion is approaching critical levels. Signals only fire when Σ exceeds the configured threshold (default 65%), so this metric pre-warns you of potential upcoming catastrophes. High-conviction setups show Σ > 75%.
Regime (R) Validation:
The regime classification must read TREND, VOLATILE, or EXPLOSIVE—never trade when it reads CHOP or NEUTRAL. The checkmark (✓) must be present in the regime cell for trading conditions to be valid. If you see an X (✗), skip all signals until regime improves. This filter alone eliminates most losing trades by avoiding geometrically unfavorable environments.
Combined High-Conviction Profile:
The strongest trading opportunities show simultaneously:
H > 0.60 (strong trending regime)
Σ > 75% (extreme topology distortion)
R = EXPLOSIVE or TREND with ✓
κ (Curvature) > 1.5 (sharp manifold fold)
⟳ (Complexity) > 4 (chaotic geometry)
V (Volatility) showing elevated ATR expansion
When all metrics align in this configuration, the manifold is undergoing severe distortion in a favorable fractal regime—these represent maximum-conviction reversal opportunities.
Signal Interpretation and Entry Logic
Bullish Singularity (▲ Green Triangle Below Bar):
This marker appears when the system detects a manifold catastrophe at a price low with bullish directional consensus. All five confirmation filters have aligned: topology score exceeded threshold, pivot low structure formed, swing size was significant, volume/volatility confirmed participation, and regime was valid. The green color indicates the directional vote totaled +2 or higher (majority bullish).
Trading Approach: Consider long entry on the bar immediately following the signal (bar after the triangle). The singularity bar itself is where the geometric catastrophe occurred—entering after allows you to see if price confirms the reversal. Place stop loss below the singularity bar's low (with buffer of 0.5-1.0 ATR for volatility). Initial target can be the previous swing high, or use the probability cone projection as a guide (though not a guarantee). Monitor the dashboard STATE—if it flips to "◆ BEAR SINGULARITY" or Hurst drops significantly, consider exiting even if target not reached.
Bearish Singularity (▼ Red Triangle Above Bar):
This marker appears when the system detects a manifold catastrophe at a price high with bearish directional consensus. Same five-filter confirmation process as bullish signals. The red color indicates directional vote totaled -2 or lower (majority bearish).
Trading Approach: Consider short entry on the bar following the signal. Place stop loss above the singularity bar's high (with buffer). Target previous swing low or use cone projection as reference. Exit if opposite signal fires or Hurst deteriorates.
Neutral Signal (● Orange Circle at Price Level):
This marker indicates the catastrophe detection system identified a topology break that passed catastrophe threshold and regime filters, but the directional voting system produced a mixed result (vote between -1 and +1). This means the four directional components (pivot, trend, flow, mid-band) are not in agreement about which way the reversal should resolve.
Trading Approach: Skip these signals. Neutral markers are displayed for analytical completeness but should not be traded. They represent geometric catastrophes without clear directional resolution—essentially, the manifold is breaking but the direction of the break is ambiguous. Trading neutral signals dramatically increases false signal rate. Only trade green (bullish) or red (bearish) singularities.
Visual Confirmation Using Spectral Layers
The three colored ribbons (spectral decomposition layers) provide entropy visualization that helps confirm signal quality:
Divergent Layers (High Entropy State):
When the three frequency bands (fast 8-period, medium 21-period, slow 55-period) are separated with significant gaps between them, the manifold is in high entropy state—different frequency components of price movement are pulling in different directions. This geometric tension precedes catastrophes. Strong signals often occur when layers are divergent before the signal, then begin reconverging immediately after.
Convergent Layers (Low Entropy State):
When all three ribbons are tightly clustered or overlapping, the manifold is in equilibrium—all frequency components agree. This stable geometry makes catastrophe detection more reliable because topology breaks clearly stand out against the baseline stability. If you see layers converge, then a singularity fires, then layers diverge, this pattern suggests a genuine regime transition.
Signal Quality Assessment:
High-quality singularity signals should show:
Divergent layers (high entropy) in the 5-10 bars before signal
Singularity bar occurs when price has extended outside at least one of the spectral bands (shows pivot extended beyond equilibrium)
Close of singularity bar re-enters the spectral band zone (shows mean reversion starting)
Layers begin reconverging in 3-5 bars after signal (shows new equilibrium forming)
This pattern visually confirms the geometric narrative: manifold became unstable (divergence), reached critical distortion (extended outside equilibrium), broke catastrophically (singularity), and is now stabilizing in new direction (reconvergence).
Using Energy Fields for Trade Management
The concentric glowing boxes around each singularity visualize the topology distortion
magnitude:
Wide Energy Fields (5+ Layers Visible):
Large radiance indicates strong catastrophe with high manifold curvature. These represent significant topology breaks and typically precede larger price moves. Wide fields justify wider profit targets and longer hold times. The outer edge of the largest box can serve as a dynamic support/resistance zone—price often respects these geometric boundaries.
Narrow Energy Fields (2-3 Layers):
Smaller radiance indicates moderate catastrophe. While still valid signals (all filters passed), expect smaller follow-through. Use tighter profit targets and be prepared for quicker exit if momentum doesn't develop. These are valid but lower-conviction trades.
Field Interaction Zones:
When energy fields from consecutive signals overlap or touch, this indicates a prolonged topology distortion region—often corresponds to consolidation zones or complex reversal patterns (head-and-shoulders, double tops/bottoms). Be more cautious in these areas as the manifold is undergoing extended restructuring rather than a clean catastrophe.
Probability Cone Projections
The dashed cone extending forward from each singularity is a mathematical projection, not a
price target:
Cone Direction:
The center line direction (upward for bullish, downward for bearish, flat for neutral) shows the expected trajectory based on current manifold gradient and singularity direction. This is where the topology suggests price "should" go if the catastrophe completes normally.
Cone Width:
The uncertainty band (upper and lower dashed boundaries) represents the range of outcomes given current volatility (ATR-based). Wider cones indicate higher uncertainty—expect more price volatility even if direction is correct. Narrower cones suggest more constrained movement.
Price-Cone Interaction:
Price following near the center line = catastrophe resolving as expected, geometric projection accurate
Price breaking above upper cone = stronger-than-expected reversal, consider holding for larger targets
Price breaking below lower cone (for bullish signal) = catastrophe failing, manifold may be re-folding in opposite direction, consider exit
Price oscillating within cone = normal reversal process, hold position
The 10-bar projection length means cones show expected behavior over the next ~10 bars. Don't confuse this with longer-term price targets.
Gradient Flow Field Interpretation
The directional arrows (↗, ↘, →) scattered across the chart show the manifold's Y-gradient (vertical acceleration dimension):
Upward Arrows (↗):
Positive Y-gradient indicates the momentum acceleration dimension is pushing upward—the manifold topology has upward "slope" at this location. Clusters of upward arrows suggest bullish topological pressure building. These often appear before bullish singularities fire.
Downward Arrows (↘):
Negative Y-gradient indicates downward topological pressure. Clusters precede bearish singularities.
Horizontal Arrows (→):
Neutral gradient indicates balanced topology with no strong directional pressure.
Using Flow Field:
The arrows provide real-time topology state information even between singularity signals. If you're in a long position from a bullish singularity and begin seeing increasing downward arrows appearing, this suggests manifold gradient is shifting—consider tightening stops. Conversely, if arrows remain upward or neutral, topology supports continuation.
Don't confuse arrow direction with immediate price direction—arrows show geometric slope, not price prediction. They're confirmatory context, not entry signals themselves.
Parameter Optimization for Your Trading Style
For Scalping / Fast Trading (1m-15m charts):
Embedding Depth: 13-15 bars (faster topology reconstruction)
Hurst Window: 3 bars (responsive fractal detection)
Singularity Threshold: 2.0-2.3σ (more sensitive)
Topology Confirmation: 0.55-0.60 (lower barrier)
Min Swing Size: 0.8-1.2 ATR (accepts smaller moves)
Pivot Lookback: 3-4 bars (quick pivot detection)
This configuration increases signal frequency for active trading but requires diligent monitoring as false signal rate increases. Use tighter stops.
For Day Trading / Standard Approach (15m-4H charts):
Keep default settings (21 embed, 5 Hurst, 2.5σ, 0.65 confirmation, 1.5 ATR, 5 pivot)
These are balanced for quality over quantity
Best win rate and risk/reward ratio
Recommended for most traders
For Swing Trading / Position Trading (4H-Daily charts):
Embedding Depth: 34-55 bars (stable long-term topology)
Hurst Window: 8-10 bars (smooth fractal measurement)
Singularity Threshold: 3.0-3.5σ (only extreme catastrophes)
Topology Confirmation: 0.75-0.85 (high conviction only)
Min Swing Size: 2.5-4.0 ATR (major moves only)
Pivot Lookback: 8-13 bars (confirmed swings)
This configuration produces infrequent but highly reliable signals suitable for position sizing and longer hold times.
Volatility Adaptation:
In extremely volatile instruments (crypto, penny stocks), increase Min Volatility Expansion to 0.6-0.8 to avoid over-signaling during "always volatile" conditions. In stable instruments (major forex pairs, blue-chip stocks), decrease to 0.3 to allow signals during moderate volatility spikes.
Trend vs Range Preference:
If you prefer trading only strong trends, increase Min Trend Strength to 0.5-0.6 (ADX > 50-60). If you're comfortable with volatility-based trading in weaker trends, decrease to 0.2 (ADX > 20). The default 0.3 balances both approaches.
Complete Trading Workflow Example
Step 1 - Pre-Session Setup:
Load chart with MSE indicator. Check dashboard position is visible. Verify regime filter is enabled. Review recent signals to gauge current instrument behavior.
Step 2 - Market Assessment:
Observe dashboard Hurst reading. If H < 0.45 (mean-reverting), consider skipping this session or using other strategies. If H > 0.50, proceed. Check regime shows TREND, VOLATILE, or EXPLOSIVE with checkmark—if CHOP, wait for regime shift alert.
Step 3 - Signal Wait:
Monitor catastrophe score (Σ). Watch for it climbing above 60%. Observe spectral layers—look for divergence building. If you see curvature (κ) rising above 1.0 and complexity (⟳) increasing, catastrophe is building. Do not anticipate—wait for the actual signal marker.
Step 4 - Signal Recognition:
▲ Bullish or ▼ Bearish triangle appears at a bar. Dashboard STATE changes to "◆ BULL/BEAR SINGULARITY". Energy field appears around the signal bar. Check signal quality:
Was Σ > 70% at signal? (Higher quality)
Are energy fields wide? (Stronger catastrophe)
Did layers diverge before and reconverge after? (Clean break)
Is Hurst still > 0.55? (Good regime)
Step 5 - Entry Decision:
If signal is green/red (not orange neutral), all confirmations look strong, and no immediate contradicting factors appear, prepare entry on next bar open. Wait for confirmation bar to form—ideally it should close in the signal direction (bullish signal → bar closes higher, bearish signal → bar closes lower).
Step 6 - Position Entry:
Enter at open or shortly after open of bar following signal bar. Set stop loss: for bullish signals, place stop at singularity_bar_low - (0.75 × ATR); for bearish signals, place stop at singularity_bar_high + (0.75 × ATR). The buffer accommodates volatility while protecting against catastrophe failure.
Step 7 - Trade Management:
Monitor dashboard continuously:
If Hurst drops below 0.45, consider reducing position
If opposite singularity fires, exit immediately (manifold has re-folded)
If catastrophe score drops below 40% and stays there, topology has stabilized—consider partial profit taking
Watch gradient flow arrows—if they shift to opposite direction persistently, tighten stops
Step 8 - Profit Taking:
Use probability cone as a guide—if price reaches outer cone boundary, consider taking partial profits. If price follows center line cleanly, hold for larger target. Traditional technical targets work well: previous swing high/low, round numbers, Fibonacci extensions. Don't expect precision—manifold projections give direction and magnitude estimates, not exact prices.
Step 9 - Exit:
Exit on: (a) opposite signal appears, (b) dashboard shows regime became invalid (checkmark changes to X), (c) technical target reached, (d) Hurst deteriorates significantly, (e) stop loss hit, or (f) time-based exit if using session limits. Never hold through opposite singularity signals—the manifold has broken in the other direction and your trade thesis is invalidated.
Step 10 - Post-Trade Review:
After exit, review: Did the probability cone projection align with actual price movement? Were the energy fields proportional to move size? Did spectral layers show expected reconvergence? Use these observations to calibrate your interpretation of signal quality over time.
Best Performance Conditions
This topology-based approach performs optimally in specific market environments:
Favorable Conditions:
Well-Developed Swing Structure: Markets with clear rhythm of advances and declines where pivots form at regular intervals. The manifold reconstruction depends on swing formation, so instruments that trend in clear waves work best. Stocks, major forex pairs during active sessions, and established crypto assets typically exhibit this characteristic.
Sufficient Volatility for Topology Development: The embedding process requires meaningful price movement to construct multi-dimensional coordinates. Extremely quiet markets (tight consolidations, holiday trading, after-hours) lack the volatility needed for manifold differentiation. Look for ATR expansion above average—when volatility is present, geometry becomes meaningful.
Trending with Periodic Reversals: The ideal environment is not pure trend (which rarely reverses) nor pure range (which reverses constantly at small scale), but rather trending behavior punctuated by occasional significant counter-trend reversals. This creates the catastrophe conditions the system is designed to detect: manifold building directional momentum, then undergoing sharp topology break at extremes.
Liquid Instruments Where EMAs Reflect True Flow: The spectral layers and frequency decomposition require that moving averages genuinely represent market consensus. Thinly traded instruments with sporadic orders don't create smooth manifold topology. Prefer instruments with consistent volume where EMA calculations reflect actual capital flow rather than random tick sequences.
Challenging Conditions:
Extremely Choppy / Whipsaw Markets: When price oscillates rapidly with no directional persistence (Hurst < 0.40), the manifold undergoes constant micro-catastrophes that don't translate to tradable reversals. The regime filter helps avoid these, but awareness is important. If you see multiple neutral signals clustering with no follow-through, market is too chaotic for this approach.
Very Low Volatility Consolidation: Tight ranges with ATR below average cause the embedding coordinates to compress into a small region of phase space, reducing geometric differentiation. The manifold becomes nearly flat, and catastrophe detection loses sensitivity. The regime filter's volatility component addresses this, but manually avoiding dead markets improves results.
Gap-Heavy Instruments: Stocks that gap frequently (opening outside previous close) create discontinuities in the manifold trajectory. The embedding process assumes continuous evolution, so gaps introduce artifacts. Most gaps don't invalidate the approach, but instruments with daily gaps >2% regularly may show degraded performance. Consider using higher timeframes (4H, Daily) where gaps are less proportionally significant.
Parabolic Moves / Blowoff Tops: When price enters an exponential acceleration phase (vertical rally or crash), the manifold evolves too rapidly for the standard embedding window to track. Catastrophe detection may lag or produce false signals mid-move. These conditions are rare but identifiable by Hurst > 0.75 combined with ATR expansion >2.0× average. If detected, consider sitting out or using very tight stops as geometry is in extreme distortion.
The system adapts by reducing signal frequency in poor conditions—if you notice long periods with no signals, the topology likely lacks the geometric structure needed for reliable catastrophe detection. This is a feature, not a bug: it prevents forced trading during unfavorable environments.
Theoretical Justification for Approach
Why Manifold Embedding?
Traditional technical analysis treats price as a one-dimensional time series: current price is predicted from past prices in sequential order. This approach ignores the structure of price dynamics—the relationships between velocity, acceleration, and participation that govern how price actually evolves.
Dynamical systems theory (from physics and mathematics) provides an alternative framework: treat price as a state variable in a multi-dimensional phase space. In this view, each market condition corresponds to a point in N-dimensional space, and market evolution is a trajectory through this space. The geometry of this space (its topology) constrains what trajectories are possible.
Manifold embedding reconstructs this hidden geometric structure from observable price data. By creating coordinates from velocity, momentum acceleration, and volume-weighted returns, we map price evolution onto a 3D surface. This surface—the manifold—reveals geometric relationships that aren't visible in price charts alone.
The mathematical theorem underlying this approach (Takens' Embedding Theorem from dynamical systems theory) proves that for deterministic or weakly stochastic systems, a state space reconstruction from time-delayed observations of a single variable captures the essential dynamics of the full system. We apply this principle: even though we only observe price, the embedded coordinates (derivatives of price) reconstruct the underlying dynamical structure.
Why Catastrophe Theory?
Catastrophe theory, developed by mathematician René Thom (Fields Medal 1958), describes how continuous systems can undergo sudden discontinuous changes when control parameters reach critical values. A classic example: gradually increasing force on a beam causes smooth bending, then sudden catastrophic buckling. The beam's geometry reaches a critical curvature where topology must break.
Markets exhibit analogous behavior: gradual price changes build tension in the manifold topology until critical distortion is reached, then abrupt directional change occurs (reversal). Catastrophes aren't random—they're mathematically necessary when geometric constraints are violated.
The indicator detects these geometric precursors: high curvature (manifold bending sharply), high complexity (topology oscillating chaotically), high condition number (coordinate mapping becoming singular). These metrics quantify how close the manifold is to a catastrophic fold. When all simultaneously reach extreme values, topology break is imminent.
This provides a logical foundation for reversal detection that doesn't rely on pattern recognition or historical correlation. We're measuring geometric properties that mathematically must change when systems reach critical states. This is why the approach works across different instruments and timeframes—the underlying geometry is universal.
Why Hurst Exponent?
Markets exhibit fractal behavior: patterns at different time scales show statistical self-similarity. The Hurst exponent quantifies this fractal structure by measuring long-range dependence in returns.
Critically for trading, Hurst determines whether recent price movement predicts future direction (H > 0.5) or predicts the opposite (H < 0.5). This is regime detection: trending vs mean-reverting behavior.
The same manifold catastrophe has different trading implications depending on regime. In trending regime (high Hurst), catastrophes represent significant reversal opportunities because the manifold has been building directional momentum that suddenly breaks. In mean-reverting regime (low Hurst), catastrophes represent minor oscillations because the manifold constantly folds at small scales.
By weighting catastrophe signals based on Hurst, the system adapts detection sensitivity to the current fractal regime. This is a form of meta-analysis: not just detecting geometric breaks, but evaluating whether those breaks are meaningful in the current fractal context.
Why Multi-Layer Confirmation?
Geometric anomalies occur frequently in noisy market data. Not every high-curvature point represents a tradable reversal—many are artifacts of microstructure noise, order flow imbalances, or low-liquidity ticks.
The five-filter confirmation system (catastrophe threshold, pivot structure, swing size, volume, regime) addresses this by requiring geometric anomalies to align with observable market evidence. This conjunction-based logic implements the principle: extraordinary claims require extraordinary evidence .
A manifold catastrophe (extraordinary geometric event) alone is not sufficient. We additionally require: price formed a pivot (visible structure), swing was significant (adequate magnitude), volume confirmed participation (capital backed the move), and regime was favorable (trending or volatile, not chopping). Only when all five dimensions agree do we have sufficient evidence that the geometric anomaly represents a genuine reversal opportunity rather than noise.
This multi-dimensional approach is analogous to medical diagnosis: no single test is conclusive, but when multiple independent tests all suggest the same condition, confidence increases dramatically. Each filter removes a different category of false signals, and their combination creates a robust detection system.
The result is a signal set with dramatically improved reliability compared to any single metric alone. This is the power of ensemble methods applied to geometric analysis.
Important Disclaimers
This indicator applies mathematical topology and catastrophe theory to multi-dimensional price space reconstruction. It identifies geometric conditions where manifold curvature, topological complexity, and coordinate singularities suggest potential reversal zones based on phase space analysis. It should not be used as a standalone trading system.
The embedding coordinates, catastrophe scores, and Hurst calculations are deterministic mathematical formulas applied to historical price data. These measurements describe current and recent geometric relationships in the reconstructed manifold but do not predict future price movements. Past geometric patterns and singularity markers do not guarantee future market behavior will follow similar topology evolution.
The manifold reconstruction assumes certain mathematical properties (sufficient embedding dimension, quasi-stationarity, continuous dynamics) that may not hold in all market conditions. Gaps, flash crashes, circuit breakers, news events, and other discontinuities can violate these assumptions. The system attempts to filter problematic conditions through regime classification, but cannot eliminate all edge cases.
The spectral decomposition, energy fields, and probability cones are visualization aids that represent mathematical constructs, not price predictions. The probability cone projects current gradient forward assuming topology continues current trajectory—this is a mathematical "if-then" statement, not a forecast. Market topology can and does change unexpectedly.
All trading involves substantial risk. The singularity markers represent analytical conditions where geometric mathematics align with threshold criteria, not certainty of directional change. Use appropriate risk management for every trade: position sizing based on account risk tolerance (typically 1-2% maximum risk per trade), stop losses placed beyond recent structure plus volatility buffer, and never risk capital needed for living expenses.
The confirmation filters (pivot, swing size, volume, regime) are designed to reduce false signals but cannot eliminate them entirely. Markets can produce geometric anomalies that pass all filters yet fail to develop into sustained reversals. This is inherent to probabilistic systems operating on noisy real-world data.
No indicator can guarantee profitable trades or eliminate losses. The catastrophe detection provides an analytical framework for identifying potential reversal conditions, but actual trading outcomes depend on numerous factors including execution, slippage, spreads, position sizing, risk management, psychological discipline, and market conditions that may change after signal generation.
Use this tool as one component of a comprehensive trading plan that includes multiple forms of analysis, proper risk management, emotional discipline, and realistic expectations about win rates and drawdowns. Combine catastrophe signals with additional confirmation methods such as support/resistance analysis, volume patterns, multi-timeframe alignment, and broader market context.
The spacing filter, cooldown mechanism, and regime validation are designed to reduce noise and over-signaling, but market conditions can change rapidly and render any analytical signal invalid. Always use stop losses and never risk capital you cannot afford to lose. Past performance of detection accuracy does not guarantee future results.
Technical Implementation Notes
All calculations execute on closed bars only—signals and metric values do not repaint after bar close. The indicator does not use any lookahead bias in its calculations. However, the pivot detection mechanism (ta.pivothigh and ta.pivotlow) inherently identifies pivots with a lag equal to the lookback parameter, meaning the actual pivot occurred at bar but is recognized at bar . This is standard behavior for pivot functions and is not repainting—once recognized, the pivot bar never changes.
The normalization system (z-score transformation over rolling windows) requires approximately 30-50 bars of historical data to establish stable statistics. Values in the first 30-50 bars after adding the indicator may show instability as the rolling means and standard deviations converge. Allow adequate warmup period before relying on signals.
The spectral layer arrays, energy field boxes, gradient flow labels, and node geometry lines are subject to TradingView drawing object limits (500 lines, 500 boxes, 500 labels per indicator as specified in settings). The system implements automatic cleanup by deleting oldest objects when limits approach, but on very long charts with many signals, some historical visual elements may be removed to stay within limits. This does not affect signal generation or dashboard metrics—only historical visual artifacts.
Dashboard and visual rendering update only on the last bar to minimize computational overhead. The catastrophe detection logic executes on every bar, but table cells and drawing objects refresh conditionally to optimize performance. If experiencing chart lag, reduce visual complexity: disable spectral layers, energy fields, or flow field to improve rendering speed. Core signal detection continues to function with all visual elements disabled.
The Hurst calculation uses logarithmic returns rather than raw price to ensure stationarity, and implements clipping to range to handle edge cases where R/S analysis produces invalid values (which can occur during extended periods of identical prices or numerical overflow). The 5-period EMA smoothing reduces noise while maintaining responsiveness to regime transitions.
The condition number calculation adds epsilon (1e-10) to denominators to prevent division by zero when Jacobian determinant approaches zero—which is precisely the singularity condition we're detecting. This numerical stability measure ensures the indicator doesn't crash when detecting the very phenomena it's designed to identify.
The indicator has been tested across multiple timeframes (5-minute through daily) and multiple asset classes (forex majors, stock indices, individual equities, cryptocurrencies, commodities, futures). It functions identically across all instruments due to the adaptive normalization approach and percentage-based metrics. No instrument-specific code or parameter sets are required.
The color scheme system implements seven preset themes plus custom mode. Color assignments are applied globally and affect all visual elements simultaneously. The opacity calculation system multiplies component-specific transparency with master opacity to create hierarchical control—adjusting master opacity affects all visuals proportionally while maintaining their relative transparency relationships.
All alert conditions trigger only on bar close to prevent false alerts from intrabar fluctuations. The regime transition alerts (VALID/INVALID) are particularly useful for knowing when trading edge appears or disappears, allowing traders to adjust activity levels accordingly.
— Dskyz, Trade with insight. Trade with anticipation.

Entries + FVG SignalsE+FVG: A Masterclass in Institutional Trading Concepts
Chapter 1: The Modern Trader's Dilemma—Decoding the Institutional Footprint
In the vast, often chaotic ocean of the financial markets, retail traders navigate with the tools they are given: conventional indicators like moving averages, RSI, and MACD. While useful for gauging momentum and general trends, these tools often fall short because they were not designed to interpret the primary force that moves markets: institutional order flow. The modern trader faces a critical challenge: the tools and concepts taught in mainstream trading education are often decades behind the sophisticated, algorithm-driven strategies employed by banks, hedge funds, and large financial institutions.
This leads to a frustrating cycle of seemingly inexplicable price movements. A trader might see a perfect breakout from a classic pattern, only for it to reverse viciously, stopping them out. They might identify a strong trend, yet struggle to find a logical entry point, consistently feeling "late to the party." These experiences are not random; they are often the result of institutional market manipulation designed to engineer liquidity.
The fundamental problem that E+FVG (Entries + FVG Signals) addresses is this informational asymmetry. It is a sophisticated, institutional-grade framework designed to move a trader's perspective from a retail mindset to a professional one. It does not rely on lagging, derivative indicators. Instead, it focuses on the two core elements of price action that reveal the true intentions of "Smart Money": liquidity and imbalances.
This is not merely another indicator to add to a chart; it is a complete analytical engine designed to help you see the market through a new lens. It deconstructs price action to pinpoint two critical things:
Where institutions are likely to hunt for liquidity (running stop-loss orders).
The specific price inefficiencies (Fair Value Gaps) they are likely to target.
By focusing on these core principles, E+FVG provides a logical, rules-based solution to identifying high-probability trade setups. It is built for the discerning trader who is ready to evolve beyond conventional technical analysis and learn a methodology that is aligned with how the market truly operates at an institutional level. It is, in essence, an operating system for "Smart Money" trading.
Chapter 2: The Core Philosophy—Liquidity is the Fuel, Imbalances are the Destination
To fully grasp the power of this tool, one must first understand its foundational philosophy, which is rooted in the core tenets of institutional trading, often referred to as Smart Money Concepts (SMC). This philosophy can be distilled into two simple, powerful ideas:
1. Liquidity is the Fuel that Moves the Market:
The market does not move simply because there are more buyers than sellers, or vice-versa. It moves to seek liquidity. Large institutions cannot simply click "buy" or "sell" to enter or exit their multi-million or billion-dollar positions. Doing so would cause massive slippage and alert the entire market to their intentions. Instead, they must strategically accumulate and distribute their positions in areas where there is a high concentration of orders.
Where are these orders located? They are clustered in predictable places: above recent swing highs (buy-stop orders from shorts, and breakout buy orders) and below recent swing lows (sell-stop orders from longs, and breakout sell orders). This collective pool of orders is called liquidity. Institutions will often drive price towards these liquidity pools in a "stop hunt" or "liquidity grab" to trigger those orders, creating the necessary volume for them to fill their own large positions, often in the opposite direction of the liquidity grab itself. Understanding this concept is the key to avoiding being the "fuel" and instead learning to trade alongside the institutions.
2. Imbalances (Fair Value Gaps) are the Magnets for Price:
When institutions enter the market with overwhelming force, they create an imbalance in the order book. This energetic, one-sided price movement often leaves behind a gap in the market's pricing mechanism. On a candlestick chart, this appears as a Fair Value Gap (FVG)—a three-candle formation where the wicks of the first and third candles do not fully overlap the range of the middle candle.
These are not random gaps; they represent an inefficiency in the market's price delivery. The market, in its constant quest for equilibrium, has a natural tendency to revisit these inefficiently priced areas to "rebalance" the order book. Therefore, FVGs act as powerful magnets for price. They serve as high-probability targets for a price move and, critically, as logical points of interest where price may reverse after filling the imbalance. A fresh, unfilled FVG is one of the most significant clues an institution leaves behind.
E+FVG is built entirely on this philosophy. The "Entries Simplified" engine is designed to identify the liquidity grabs, and the "FVG Signals" engine is designed to identify the imbalances. Together, they provide a complete, synergistic framework for institutional-grade analysis.
Chapter 3: The Engine, Part I—"Entries Simplified": A Framework for Precision Entry
This is the primary trade-spotting engine of the E+FVG tool. It is a multi-layered system designed to identify a very specific, high-probability entry model based on institutional behavior. It filters out market noise by focusing solely on the sequence of a liquidity sweep followed by a clear and energetic displacement.
Feature 1: The Multi-Timeframe Liquidity Engine
The first and most crucial step in the engine's logic is to identify a valid liquidity grab. The script understands that the most significant reversals are often initiated after price has swept a key high or low from a higher timeframe. A sweep of yesterday's high holds far more weight than a sweep of the last 5-minute high.
Automatic Timeframe Adaptation: The engine intelligently analyzes your current chart's timeframe and automatically selects an appropriate higher timeframe (HTF) for its core analysis. For instance, if you are on a 15-minute chart, it might reference the 4-hour or Daily chart to identify key structural points. This is done seamlessly in the background, ensuring the analysis is always anchored to a significant structural context without requiring manual input.
The "Sweep" Condition: The script is not looking for a simple touch of a high or low. It is looking for a definitive sweep (also known as a "stop hunt" or "Judas swing"). This is defined as price pushing just beyond a key prior candle's high or low and then closing back within its range. This specific price action pattern is a classic signature of a liquidity grab, indicating that the move's purpose was to trigger stops, not to start a new, sustained trend. The "Entries Simplified" engine is constantly scanning the HTF price action for these sweep events, as they are the necessary precondition for any potential setup.
Feature 2: The Upshift/Downshift Signal—Confirming the Reversal
Once a valid HTF liquidity sweep has occurred, the engine moves to its next phase: identifying the confirmation. A sweep alone is not enough; institutions must show their hand and reveal their intention to reverse the market. This confirmation comes in the form of a powerful structural breakout (for bullish reversals) or breakdown (for bearish reversals). We call these events Upshifts and Downshifts.
Defining the Upshift & Downshift: This is the critical moment of confirmation, the market "tipping its hand."
An Upshift occurs after a liquidity sweep below a key low. Following the sweep, price reverses with energy and produces a decisive breakout to the upside, closing above a recent, valid swing high. This action confirms that the prior downtrend's momentum is broken, the downward move was a trap to engineer liquidity, and institutional buyers are now in aggressive control.
A Downshift occurs after a liquidity sweep above a key high. Following the sweep, price reverses aggressively and produces a sharp breakdown to the downside, closing below a recent, valid swing low. This confirms that the prior uptrend's momentum has failed, the upward move was a liquidity grab, and institutional sellers have now taken control of the market.
Algorithmic Identification: The E+FVG engine uses a proprietary algorithm to identify these moments. It analyzes the candle sequence immediately following a sweep, looking for a specific type of market structure break characterized by high energy and displacement—often leaving imbalances (Fair Value Gaps) in its wake. This is not a simple "pivot break"; the algorithm is designed to distinguish between a weak, indecisive wiggle and a true, institutionally-backed Upshift or Downshift.
The Signal: When this precise sequence—a HTF liquidity sweep followed by a valid Upshift or Downshift on the trading timeframe—is confirmed, the indicator plots a clear arrow on the chart. A green arrow below a low signifies a Bullish setup (confirmed by an Upshift), while a red arrow above a high signifies a Bearish setup (confirmed by a Downshift). This is the core entry signal of the "Entries Simplified" engine.
Feature 3: Automated Price Projections—A Built-In Trade Management Framework
A valid entry signal is only one part of a successful trade. A trader also needs a logical framework for taking profits. The E+FVG engine completes its trade-spotting process by providing automated, mathematically-derived price projections.
Fibonacci-Based Logic: After a valid Upshift or Downshift signal is generated, the script analyzes the price leg that created the setup (i.e., the range from the liquidity sweep to the confirmation breakout/breakdown). It then uses a methodology based on standard Fibonacci extension principles to project several potential take-profit (TP) levels.
Multiple TP Levels: The indicator projects four distinct TP levels (TP1, TP2, TP3, TP4). This provides a comprehensive trade management framework. A conservative trader might aim for TP1 or TP2, while a more aggressive trader might hold a partial position for the higher targets. These levels are plotted on the chart as clear, labeled lines, removing the guesswork from profit-taking.
Dynamic and Adaptive: These projections are not static. They are calculated uniquely for each individual setup, based on the specific volatility and range of the price action that generated the signal. This ensures that the take-profit targets are always relevant to the current market conditions.
The "Entries Simplified" engine, therefore, provides a complete, end-to-end framework: it waits for a high-probability condition (HTF sweep), confirms it with a specific entry model (Upshift/Downshift), and provides a logical road map for managing the trade (automated projections).
Chapter 4: The Engine, Part II—"FVG Signals": Mapping Market Inefficiencies
This second, complementary engine of the E+FVG tool operates as a market mapping system. Its sole purpose is to identify, plot, and monitor Fair Value Gaps (FVGs)—the critical price inefficiencies that act as magnets and potential reversal points.
Feature 1: Dual Timeframe FVG Detection
The significance of an FVG is directly related to the timeframe on which it forms. A 1-hour FVG is a more powerful magnet for price than a 1-minute FVG. The FVG engine gives you the ability to monitor both simultaneously, providing a richer, multi-dimensional view of the market's inefficiencies.
Chart TF FVGs: The indicator will, by default, identify and plot the FVGs that form on your current, active chart timeframe. These are useful for short-term scalping and for fine-tuning entries.
Higher Timeframe (HTF) FVGs: With a single click, you can enable the HTF FVG detection. This allows you to overlay, for example, 1-hour FVGs onto your 5-minute chart. This is an incredibly powerful feature. Seeing a 5-minute price rally approaching a fresh, unfilled 1-hour bearish FVG gives you a high-probability context for a potential reversal. The HTF FVGs act as major points of interest that can override the short-term price action.
Feature 2: The Intelligent "Tap-In" Logic—Beyond a Simple Touch
Many FVG indicators will simply alert you when price touches an FVG. The E+FVG engine employs a more sophisticated, two-stage logic to generate its signals, which helps to filter out weak reactions and focus on confirmed reversals.
Stage 1: The Entry. The first event is when price simply enters the FVG zone. This is a "heads-up" moment, and the indicator can be configured to provide an initial alert for this event.
Stage 2: The Confirmed "Tap-In." The official signal, however, is the "Tap-In." This is a more stringent condition. For a bullish FVG, a Tap-In is only confirmed after price has touched or entered the FVG zone and then closed back above the FVG's high. For a bearish FVG, the price must touch or enter the zone and then close back below the FVG's low. This confirmation logic ensures that the FVG has not just been touched, but has been respected and rejected by the market, making the resulting arrow signal significantly more reliable than a simple touch alert.
Feature 3: Interactive and Clean Visuals
The FVG engine is designed to provide maximum information with minimum chart clutter.
Clear, Color-Coded Boxes: Bullish FVGs are plotted in one color (e.g., green or blue), and bearish FVGs in another (e.g., red or orange), with a clear distinction between Chart TF and HTF zones.
Optional Box Display: Recognizing that some traders prefer a cleaner chart, you have the option to hide the FVG boxes entirely. Even with the boxes hidden, the underlying logic remains active, and the script will still generate the crucial Tap-In arrow signals.
Automatic Fading: Once an FVG has been successfully "tapped," the script can be set to automatically fade the color of the box. This provides a clear visual cue that the zone has been tested and may have less significance going forward.
Expiration: FVGs do not remain relevant forever. The script automatically removes old FVG boxes from the chart after a user-defined number of bars, ensuring your analysis is always focused on the most recent and relevant market inefficiencies.
Chapter 5: The Power of Synergy—How the Two Engines Work Together
While both the "Entries Simplified" engine and the "FVG Signals" engine are powerful standalone tools, their true potential is unlocked when used in combination. They are designed to provide confluence—a scenario where two or more independent analytical concepts align to produce a single, high-conviction trade idea.
Scenario A: The A+ Setup (Upshift into FVG). This is the highest probability setup. Imagine the "Entries Simplified" engine detects a HTF liquidity sweep below a key low, followed by a bullish Upshift signal. You look at your chart and see that this strong upward displacement is heading directly towards a fresh, unfilled bearish HTF FVG. This provides you with both a high-probability entry signal and a logical, high-probability target for the trade.
Scenario B: The FVG Confirmation. A trader might see the "Entries Simplified" engine generate a bearish Downshift signal. They feel it is a valid setup but want one extra layer of confirmation. They wait for price to rally a little further and "tap-in" to a nearby bearish FVG that formed during the Downshift's displacement. The FVG Tap-In signal then serves as their final confirmation trigger to enter the trade.
Scenario C: The Standalone FVG Trade. The FVG engine can also be used as a primary trading tool. A trader might notice that price is in a strong uptrend. They see price pulling back towards a fresh, bullish HTF FVG. They are not waiting for a full Upshift/Downshift setup; instead, they are simply waiting for the FVG Tap-In signal to confirm that the pullback is likely over and the trend is ready to resume.
By learning to read the interplay between these two engines, a trader can elevate their analysis from a one-dimensional process to a multi-dimensional, context-aware methodology.
Chapter 6: The Workflow—A Step-by-Step Guide to Practical Application
Step 1: The Pre-Market Analysis (Mapping the Battlefield). Before your session begins, enable the HTF FVG detection. Identify the key, unfilled HTF FVGs above and below the current price. These are your major points of interest for the day—your potential targets and reversal zones.
Step 2: Await the Primary Condition (Patience for Liquidity). During your trading session, your primary focus should be on the "Entries Simplified" engine. Your job is to wait patiently for the script to identify a valid HTF liquidity sweep. Do not force trades in the middle of a price range where no significant liquidity has been taken.
Step 3: The Upshift/Downshift Alert (The Call to Action). When the red or green arrow from the "Entries Simplified" engine appears, it is your cue to focus your attention. This is a potential high-probability setup.
Step 4: The Confluence Check (Building Conviction). With the Upshift or Downshift signal on your chart, ask the key confluence questions:
Did the displacement from the Upshift/Downshift create a new FVG?
Is the projected path of the trade heading towards a pre-identified HTF FVG?
Has an FVG Tap-In signal appeared shortly after the initial signal, offering further confirmation?
Step 5: Execute and Manage. If you have sufficient confluence, execute the trade. Use the automated price projections as your guide for profit-taking. A logical stop-loss is typically placed just beyond the high or low of the liquidity sweep that initiated the entire sequence.
Chapter 7: The Trader's Mind—Mastering the Institutional Mindset
This tool is more than a set of algorithms; it is a training system for professional trading psychology.
From Chasing to Trapping: You stop chasing breakouts and instead learn to identify where others are being trapped.
From FOMO to Patience: The strict, sequential logic of the entry model (Sweep -> Upshift/Downshift) forces you to wait for the highest quality setups, curing the Fear Of Missing Out.
Probabilistic Thinking: By focusing on liquidity and imbalances, you begin to think in terms of probabilities, not certainties. You understand that you are putting on trades where the odds are statistically in your favor, which is the cornerstone of any professional trading career.
Clarity and Confidence: The clear, rules-based signals remove ambiguity and second-guessing. This builds the confidence needed to execute trades decisively when the opportunity arises.
Chapter 8: Frequently Asked Questions & Scenarios
Q: The "Entries Simplified" code looks complex. Do I need to understand all of it?
A: No. The engine is designed to perform its complex analysis in the background. Your job is to understand the principles—liquidity sweep and the resulting Upshift or Downshift—and to recognize the clear arrow signals that the script generates when those conditions are met.
Q: Can I turn one of the engines off?
A: Yes, the indicator is modular. If you only want to focus on Fair Value Gaps, for example, you can disable the plot shapes for the "Entries Simplified" signals in the settings, and vice-versa.
Q: Does this work on all assets and timeframes?
A: The principles of liquidity and imbalance are universal and apply to all markets, from cryptocurrencies to forex to indices. The fractal nature of the analysis means the concepts are valid on all timeframes. However, it is always recommended that a trader backtest and forward-test the tool on their specific instrument and timeframe of choice to understand its unique behavior.
Author's Instructions
To request access to this script, please send me a direct private message here on TradingView.
Alternatively, you can find more information and contact details via the link on my profile signature.
Please DO NOT request access in the Comments section. Comments are for questions about the script's methodology and for sharing constructive feedback.

MACD Trading System - Professional V2# MACD Trading System - Professional V2
## Executive Summary
**MACD Pro V2** is an institutional-grade trading indicator combining classical MACD analysis with advanced risk management, multi-timeframe confirmation, and comprehensive performance metrics. Designed for both manual traders and algorithmic systems, this indicator provides actionable signals with built-in stop loss calculation, take profit targets, position sizing, and trailing stop logic.
This indicator is NOT just a signal generator—it's a complete trading system with risk/reward management, performance tracking, and market regime detection.
---
## Core Features
### 1. Advanced MACD Calculation
- **Customizable EMAs**: Fast (default 8), Slow (default 21), Signal (default 5)
- **Confirmed Signals**: Uses barstate.isconfirmed to prevent repainting
- **Zero-Line Position**: Shows MACD above/below zero for momentum context
### 2. Multi-Timeframe Analysis
- **4 Simultaneous Timeframes**: 4H, 1H, 15M, 5M analyzed in parallel
- **MTF Alignment Score**: 0-100% showing consensus across timeframes
- **Smart Requests**: Uses lookahead=barmerge.lookahead_off for accuracy
### 3. Market Regime Detection
Automatically identifies current market conditions:
- **TRENDING** - ADX > 25, strong directional movement
- **RANGING** - ADX < 20, choppy sideways movement
- **VOLATILE** - ATR > 1.5x average, high uncertainty
- **NORMAL** - Default market state
### 4. Integrated Risk Management
Complete position management system:
- **Stop Loss Calculation**: Automatic SL placement based on ATR × multiplier
- **Take Profit Targets**: Calculated using Risk:Reward ratio (default 2:1)
- **Position Sizing**: Scales position size based on account risk percentage
- **Trailing Stop**: Dynamically adjusts SL as price moves in your favor
- **Drawdown Monitoring**: Tracks maximum drawdown vs account
### 5. Advanced Signal Scoring
0-100 point system weighing:
- **MTF Alignment (35%)**: Multi-timeframe confirmation strength
- **Momentum (25%)**: RSI conditions + Divergence detection
- **Volume (20%)**: Volume profile and confirmation
- **Volatility (20%)**: Market regime adjustment
**Signal Classifications:**
- **STRONG (70+)**: High confidence, tight stops, optimal entry
- **MEDIUM (50-69)**: Valid signals, confirm with price action
- **WEAK (<50)**: Low conviction, skip or use tight risk management
### 6. Professional Performance Metrics
Real-time trading statistics:
- **Win Rate**: Percentage of winning trades
- **Max Drawdown**: Largest peak-to-trough decline
- **Sharpe Ratio**: Risk-adjusted returns (anualized)
- **Profit Factor**: Gross profit / Gross loss ratio
- **Consecutive Losses**: Psychological stress indicator
### 7. Advanced Filtering System
- **Divergence Detection**: Automatic bullish/bearish divergence identification
- **Support/Resistance**: Pivot-based dynamic S/R levels
- **Volume Confirmation**: Only takes signals with volume > 1.0x average
- **Session Filter**: Optional trading hours restriction
- **Volatility Adjustment**: Reduces entries in extremely high volatility
---
## How It Works
### Signal Generation Process
**Step 1: MACD Crossover**
- Crossover of MACD above/below signal line triggers base signal
- Uses confirmed values to prevent false signals
**Step 2: Multi-Timeframe Confirmation**
- Checks trend alignment on 4H, 1H, 15M, 5M
- Calculates MTF alignment percentage
- Higher alignment = higher confidence
**Step 3: Advanced Scoring**
Signal is scored on 100-point scale:
- MTF alignment contribution (35 pts max)
- RSI + Divergence (25 pts max)
- Volume profile (20 pts max)
- Volatility regime adjustment (20 pts max)
**Step 4: Filter Application**
- Session filter (if enabled)
- Support/Resistance proximity bonus
- Volume confirmation requirement
- Drawdown check (if risk mgmt enabled)
**Step 5: Risk Calculation**
- Stop Loss placed 2 ATR below entry (customizable)
- Take Profit calculated using 2:1 risk/reward ratio
- Position size scaled to risk 1% per trade
- Trailing stop activated after 1R profit
**Step 6: Signal Output**
- Buy Signal: Green triangle (Strong) or circle (Medium)
- Sell Signal: Red triangle (Strong) or circle (Medium)
- Dashboard shows complete trade details
---
## Trading Scenarios
### Scenario 1: Strong Buy Setup
```
Requirements met:
✓ MACD crosses above signal line
✓ 3/4 timeframes bullish (4H, 1H, 15M)
✓ RSI oversold (< 30)
✓ Volume spike confirmed
✓ Score: 78/100 → STRONG BUY
System provides:
- Entry: Current price
- Stop Loss: 2 ATR below entry
- Take Profit: 2× risk distance above
- Position Size: Adjusted to 1% account risk
- Trailing Stop: Activates at 1R profit
```
### Scenario 2: Medium Buy with Divergence
```
Requirements met:
✓ MACD crosses above signal line
✓ 2/4 timeframes bullish (4H, 1H)
✓ Bullish divergence detected
✓ Price near support level
✓ Score: 62/100 → MEDIUM BUY
Considerations:
- Lower confidence → tighter risk management
- Use smaller position size
- Require additional confirmation
- Better as counter-trend entry
```
### Scenario 3: Ranging Market Filter
```
Market condition detected: RANGING
ADX < 20, sideways movement
System response:
- Reduces signal score by volatility adjustment
- May skip signals entirely
- Prioritizes higher confluence
- Warns of low trend probability
Best action: Wait for trending market
```
---
## Risk Management Deep Dive
### Stop Loss Calculation
```
Stop Loss Distance = ATR × ATR Multiplier (default 2.0)
Example:
- Current price: 1.0850
- ATR(14): 0.0045
- SL Distance: 0.0045 × 2.0 = 0.009
- BUY SL: 1.0850 - 0.009 = 1.0760
```
### Position Sizing
```
Position Size = (Account Risk % / Price Risk %)
Example:
- Risk per trade: 1% of account
- Stop distance: 0.009 on price of 1.0850
- Price risk: 0.009 / 1.0850 = 0.83%
- Position size: 1.0% / 0.83% = 1.2x (capped at 1.0x max)
```
### Trailing Stop Logic
```
Normal SL: 2 ATR below entry
Trigger Level: Entry + (Entry - SL) × Trail Activation (1.0R)
Trailing Mechanism:
- If price hits trigger, trailing SL activates
- SL moves up to: Close - 2 ATR
- SL never moves down, only up (for longs)
- Protects profits while allowing upside
```
### Drawdown Protection
```
Tracks:
- Peak equity reached
- Current drawdown from peak
- Maximum drawdown recorded
- Stops trading if max DD exceeded
Example:
- Peak: $10,000
- Current: $9,200
- Drawdown: 8%
- Max allowed: 10%
- Status: CONTINUE TRADING
```
---
## Dashboard Metrics Explained
### Market Section
- **Market Regime**: Current state (Trending/Ranging/Volatile/Normal)
- **ADX Value**: Trend strength indicator (0-100)
### Position Section
- **Current Position**: LONG, SHORT, or NONE
- **P&L**: Unrealized profit/loss percentage if in position
### Timeframe Section
- Individual 4H/1H/15M trend status
- **Alignment**: Percentage of bullish timeframes
### Risk Management Section
- **Stop Loss %**: Distance from current price
- **Take Profit %**: Target profit distance
- **Position Size**: Capital allocation multiplier
- **Risk %**: Per-trade risk percentage
### Performance Section
- **Win Rate**: % of winning trades (>60% is excellent)
- **Max DD**: Maximum drawdown experienced
- **Sharpe Ratio**: Risk-adjusted return metric
- **Profit Factor**: Ratio of profits to losses
### Indicators Section
- **RSI**: Momentum and overbought/oversold levels
- **Volume**: Current vs. average volume ratio
- **Divergence**: Active divergence detection
---
## Advanced Features
### Divergence Detection
```
Bullish Divergence:
- Price makes lower low
- MACD makes higher high
- Signals potential reversal UP
Bearish Divergence:
- Price makes higher high
- MACD makes lower low
- Signals potential reversal DOWN
Lookback: 20 bars (customizable)
```
### Support & Resistance
```
Method: Pivot High/Low detection
- Pivot Left/Right: 10 bars
- Dynamic S/R levels update as new pivots form
- Bonus score if entry near identified levels
```
### Performance Tracking
Real-time statistics calculated from:
- Win/loss signals
- Profit/loss per trade
- Consecutive losing trades
- Cumulative returns
- Standard deviation (Sharpe calculation)
Stores last 100 trades in memory for statistics.
---
## Input Parameters Explained
### MACD Settings
- **Fast EMA** (5-13): Lower = more responsive, more false signals
- **Slow EMA** (20-26): Higher = smoother, misses faster moves
- **Signal EMA** (5-9): Crossover sensitivity
### Risk Management
- **ATR Period** (default 14): Volatility measurement period
- **SL ATR Multiplier** (1.5-3.0): Stop loss tightness
- **Risk:Reward Ratio** (1-5): Profit target calculation
- **Trail Activation** (0.5-2.0): When to start trailing stop
- **Risk Per Trade** (0.1-5.0): Account risk percentage
- **Max Drawdown** (5-30%): Trading pause threshold
### Scoring Weights
Customize signal emphasis:
- **MTF Alignment** (35%): How important is multi-timeframe
- **Momentum** (25%): RSI and divergence weight
- **Volume** (20%): Volume confirmation priority
- **Volatility** (20%): Regime adjustment strength
### Advanced Filters
- **Check Divergence**: Enable/disable divergence scoring
- **Session Filter**: Restrict to specific hours
- **Min Volume Ratio**: Minimum volume for signal
### Display
- **Show Dashboard**: Main metrics table
- **Show Performance**: Trading statistics
- **Show S/R Levels**: Support/resistance visualization
---
## Best Practices
1. **Backtest Before Trading**: Test parameters on your preferred pairs
2. **Start with Strong Signals**: Use only 70+ scored signals initially
3. **Position Size**: Never risk more than 1-2% per trade
4. **Market Regime Awareness**: Skip ranging market entries
5. **Volume Confirmation**: Always check volume spikes
6. **Profit Taking**: Lock in profits at TP, don't let winners die
7. **Loss Management**: Honor stop losses, don't move them
8. **Performance Review**: Check metrics weekly, adjust if needed
---
## Trading Strategy Examples
### Conservative Strategy (Win-Rate Focus)
```
Settings:
- Signal Score Minimum: 70+ (Strong only)
- Risk Per Trade: 0.5%
- Risk:Reward: 3:1
- Position Size: 0.5x (smaller)
Targets:
- Win Rate > 65%
- Max DD < 5%
- Profit Factor > 2.0
```
### Aggressive Strategy (Profit Focus)
```
Settings:
- Signal Score Minimum: 50+ (Medium+)
- Risk Per Trade: 2%
- Risk:Reward: 1.5:1
- Position Size: 1.0x (maximum)
Targets:
- Win Rate > 55%
- Max DD < 10%
- Profit Factor > 1.5
```
### Trend Trading Strategy
```
Settings:
- Only trade when ADX > 25 (Trending)
- MTF Alignment: 3+ timeframes
- Use Trailing Stop: Yes
- Risk:Reward: 2.5:1
Focus on: Riding large moves
Best on: 4H timeframe
Pairs: Trending majors (EURUSD, GBPUSD)
```
### Divergence Trading Strategy
```
Settings:
- Signal Score Minimum: 60+
- Enable Divergence: Yes
- Volume Confirmation: Required
- Position Size: 0.75x
Focus on: Reversal entries
Best setup: Divergence at resistance/support
Risk management: Tight stops (1.5 ATR)
```
---
## Advantages
✓ Complete trading system, not just signals
✓ Built-in risk management and position sizing
✓ Real-time performance tracking
✓ Multi-timeframe confirmation reduces false signals
✓ Advanced filtering and divergence detection
✓ Market regime awareness
✓ Customizable scoring weights
✓ Professional dashboard display
✓ Support/resistance integration
✓ Trailing stop logic for profit protection
---
## Limitations
- Lagging indicator (uses confirmed bars)
- Works best on trending markets
- Not optimized for news/event trading
- Requires parameter optimization per pair
- Performance varies by timeframe
- Past performance doesn't guarantee future results
- Can produce whipsaw signals in ranging markets
---
## System Requirements
- TradingView Premium or higher (for advanced charting)
- Recommended: 4H or 1H timeframe
- Historical data: Minimum 100 bars
- Currency pairs: Works on all FX pairs, stocks, commodities
---
## Disclaimer
This indicator is provided for educational and informational purposes only. It is not financial advice and does not guarantee profits. Past performance does not predict future results.
**Important Notices:**
- Always use proper risk management
- Trade only with capital you can afford to lose
- Backtest thoroughly before live trading
- Combine with your own analysis
- Consider external market factors and news
- Monitor positions actively
- Keep emotional discipline
---
## Support & Optimization
For best results:
1. Test on your preferred instrument (6-12 months history)
2. Adjust MACD parameters to your timeframe
3. Optimize scoring weights to your style
4. Set risk management per your account size
5. Document your trade results and review weekly
6. Adapt parameters if performance degrades
This is a powerful system when used correctly. Respect the rules and let statistics work in your favor.

Binary Options Fast Scalping [TradingFinder] M1 & M5 Signals🔵 Introduction
In the structure of financial markets, spiky moments and sudden price movements play a key role in Liquidity Grabs and Market Structure Resets. These movements usually occur after the accumulation of orders in Buy Side or Sell Side Liquidity zones and are accompanied by rapid breaks in the form of Break of Structure (BoS) or Change of Character (CHoCH).
At this stage, the market temporarily moves in the direction of liquidity to trigger counter orders and then enters a Retracement or Pullback phase, a point where professional traders using the Smart Money Concept (SMC) look for candle confirmation to enter with precision.
This strategy is built upon the same logic : an initial spiky move as a signal of institutional or liquidity driven algorithms, followed by a controlled pullback toward areas such as the Order Block, Fair Value Gap (FVG), or Imbalance Zone, and finally an entry based on a strong confirmation candle (Engulf, Rejection, Breaker) that defines the true direction of order flow.
This combination of price behavior, especially on lower timeframes such as M1 or M5, provides an ideal setup for fast Scalping, Micro Structure Trading, and even short term directional prediction in Binary Options Trading.
Since the main focus of this method is on identifying liquidity phases, structural confirmations, and momentum confirmation candles, the trader can design entries with high probability and logical stop loss placement using the concepts of Fractal Market Structure and Multi Timeframe Confirmation.
In the scalping version, the main objective is to capture the move toward the next liquidity pool or opposite demand and supply zone, while in the binary version, only the prediction of the next candle’s direction matters. This strategy inherently operates based on Smart Money Behavior, Liquidity Engineering, and Order Flow Dynamics, allowing the extraction of fast and profitable moves from the internal logic of market structure.
🔵 How to Use
The operational logic of this strategy is based on Liquidity Sweep, Pullback, and Confirmation Candle. The trader should first identify the initial Impulse Move, which is often accompanied by liquidity absorption around Buy Side or Sell Side Liquidity areas. After that, the market enters the Retracement phase and returns to structural zones such as the Order Block or the Fair Value Gap (FVG).
At this point, a position is taken only when a confirmation candle (Engulf, Breaker, or Rejection Candle) closes in the direction of continuation and aligns with the new structure (BOS or CHoCH). Applying this model on lower timeframes offers the highest precision for fast Scalping or for predicting the next candle’s direction in Binary Option trading.
🟣 Bullish Setup
In the bullish setup, the market first forms a spiky upward move with a sudden increase in momentum, indicating the activation of liquidity flow in the Buy Side Liquidity zone. This movement is usually accompanied by a Break of Structure (BOS) to the upside and marks the beginning of the Impulse Move phase. After this move, the price enters the Pullback phase and returns to structural areas such as the Bullish Order Block, Fair Value Gap (FVG), or Mitigation zone.
At this stage, the trader waits for a bullish confirmation candle (Bullish Engulf or Breaker Candle) to validate the end of the retracement. Entry is made at the close of the confirmation candle or on a minor pullback, with the stop loss placed below the Swing Low or below the pullback zone. The target is set at the next Buy Side Liquidity or Equal Highs. In the binary version, only the direction of the next candle matters and the entry takes place immediately after the confirmation candle.
🟣 Bearish Setup
In the bearish setup, the market first forms a spiky downward move, signaling increased selling pressure and liquidity absorption at the Sell Side Liquidity zone. This movement is accompanied by a Break of Structure (BOS) to the downside and represents the beginning of a bearish momentum phase. After the spike, the price enters the Retracement phase and returns to the Bearish Order Block or bearish Fair Value Gap zone. Within these areas, the formation of a bearish confirmation candle (Bearish Engulf, Breaker, or Rejection Candle) validates the continuation of the downtrend.
The entry is taken at the close of the confirmation candle, with the stop loss placed above the Swing High or above the pullback zone, and the target set toward the next Sell Side Liquidity or Equal Lows. In binary applications, only the direction of the next candle is considered and the confirmation candle serves as the entry trigger.
🔵 Conclusion
This strategy, by combining the principles of the Smart Money Concept, Liquidity Dynamics, and Candle Confirmation Logic, offers a precise and multi functional approach to market entry. Its core structure, identifying the initial spiky movement, waiting for a structural pullback, and entering based on a confirmation candle allows quick interpretation of institutional liquidity behavior and provides trading opportunities with high accuracy and controlled risk.
On lower timeframes, this logic becomes a powerful tool for Scalping and Micro Structure Trading, while in binary markets it delivers high success rates due to its focus on predicting the next candle’s direction. Built upon the foundations of Order Flow, Market Structure, and Fractal Liquidity Behavior, this strategy demonstrates that even in the fastest and noisiest market conditions, the order of Smart Money remains observable and exploitable.

LEGEND IsoPulse Fusion Universal Volume Trend Buy Sell RadarLEGEND IsoPulse Fusion • Universal Volume Trend Buy Sell Radar
One line summary
LEGEND IsoPulse Fusion reads intent from price and volume together, learns which features matter most on your symbol, blends them into a single signed Fusion line in a stable unit range, and emits clear Buy Sell Close events with a structure gate and a liquidity safety gate so you act only when the tape is favorable.
What this script is and why it exists
Many traders keep separate windows for trend, volume, volatility, and regime filters. The result can feel fragmented. This script merges two complementary engines into one consistent view that is easy to read and simple to act on.
LEGEND Tensor estimates directional quality from five causally computed features that are normalized for stationarity. The features are Flow, Tail Pressure with Volume Mix, Path Curvature, Streak Persistence, and Entropy Order.
IsoPulse transforms raw volume into two decaying reservoirs for buy effort and sell effort using body location and wick geometry, then measures price travel per unit volume for efficiency, and detects volume bursts with a recency memory.
Both engines are mapped into the same unit range and fused by a regime aware mixer. When the tape is orderly the mixer leans toward trend features. When the tape is messy but a true push appears in volume efficiency with bursts the mixer allows IsoPulse to speak louder. The outcome is a single Fusion line that lives in a familiar range with calm behavior in quiet periods and expressive pushes when energy concentrates.
What makes it original and useful
Two reservoir volume split . The script assigns a portion of the bar volume to up effort and down effort using body location and wick geometry together. Effort decays through time using a forgetting factor so memory is present without becoming sticky.
Efficiency of move . Price travel per unit volume is often more informative than raw volume or raw range. The script normalizes both sides and centers the efficiency so it becomes signed fuel when multiplied by flow skew.
Burst detection with recency memory . Percent rank of volume highlights bursts. An exponential memory of how recently bursts clustered converts isolated blips into useful context.
Causal adaptive weighting . The LEGEND features do not receive static weights. The script learns, causally, which features have correlated with future returns on your symbol over a rolling window. Only positive contributions are allowed and weights are normalized for interpretability.
Regime aware fusion . Entropy based order and persistence create a mixer that blends IsoPulse with LEGEND. You see a single line rather than two competing panels, which reduces decision conflict.
How to read the screen in seconds
Fusion area . The pane fills above and below zero with a soft gradient. Deeper fill means stronger conviction. The white Fusion line sits on top for precise crossings.
Entry guides and exit guides . Two entry guides draw symmetrically at the active fused entry level. Two exit guides sit inside at a fraction of the entry. Think of them as an adaptive envelope.
Letters . B prints once when the script flips from flat to long. S prints once when the script flips from flat to short. C prints when a held position ends on the appropriate side. T prints when the structure gate first opens. A prints when the liquidity safety flag first appears.
Price bar paint . Bars tint green while long and red while short on the chart to mirror your virtual position.
HUD . A compact dashboard in the corner shows Fusion, IsoPulse, LEGEND, active entry and exit levels, regime status, current virtual position, and the vacuum z value with its avoid threshold.
What signals actually mean
Buy . A Buy prints when the Fusion line crosses above the active entry level while gates are open and the previous state was flat.
Sell . A Sell prints when the Fusion line crosses below the negative entry level while gates are open and the previous state was flat.
Close . A Close prints when Fusion cools back inside the exit envelope or when an opposite cross would occur or when a gate forces a stop, and the previous state was a hold.
Gates . The Trend gate requires sufficient entropy order or significant persistence. The Avoid gate uses a liquidity vacuum z score. Gates exist to protect you from weak tape and poor liquidity.
Inputs and practical tuning
Every input has a tooltip in the script. This section provides a concise reference that you can keep in mind while you work.
Setup
Core window . Controls statistics across features. Scalping often prefers the thirties or low fifties. Intraday often prefers the fifties to eighties. Swing often prefers the eighties to low hundreds. Smaller responds faster with more noise. Larger is calmer.
Smoothing . Short EMA on noisy features. A small value catches micro shifts. A larger value reduces whipsaw.
Fusion and thresholds
Weight lookback . Sample size for weight learning. Use at least five times the horizon. Larger is slower and more confident. Smaller is nimble and more reactive.
Weight horizon . How far ahead return is measured to assess feature value. Smaller favors quick reversion impulses. Larger favors continuation.
Adaptive thresholds . Entry and exit levels from rolling percentiles of the absolute LEGEND score. This self scales across assets and timeframes.
Entry percentile . Eighty selects the top quintile of pushes. Lower to seventy five for more signals. Raise for cleanliness.
Exit percentile . Mid fifties keeps trades honest without overstaying. Sixty holds longer with wider give back.
Order threshold . Minimum structure to trade. Zero point fifteen is a reasonable start. Lower to trade more. Raise to filter chop.
Avoid if Vac z . Liquidity safety level. One point two five is a good default on liquid markets. Thin markets may prefer a slightly higher setting to avoid permanent avoid mode.
IsoPulse
Iso forgetting per bar . Memory for the two reservoirs. Values near zero point nine eight to zero point nine nine five work across many symbols.
Wick weight in effort split . Balance between body location and wick geometry. Values near zero point three to zero point six capture useful behavior.
Efficiency window . Travel per volume window. Lower for snappy symbols. Higher for stability.
Burst percent rank window . Window for percent rank of volume. Around one hundred to three hundred covers most use cases.
Burst recency half life . How long burst clusters matter. Lower for quick fades. Higher for cluster memory.
IsoPulse gain . Pre compression gain before the atan mapping. Tune until the Fusion line lives inside a calm band most of the time with expressive spikes on true pushes.
Continuation and Reversal guides . Visual rails for IsoPulse that help you sense continuation or exhaustion zones. They do not force events.
Entry sensitivity and exit fraction
Entry sensitivity . Loose multiplies the fused entry level by a smaller factor which prints more trades. Strict multiplies by a larger factor which selects fewer and cleaner trades. Balanced is neutral.
Exit fraction . Exit level relative to the entry level in fused unit space. Values around one half to two thirds fit most symbols.
Visuals and UX
Columns and line . Use both to see context and precise crossings. If you present a very clean chart you can turn columns off and keep the line.
HUD . Keep it on while you learn the script. It teaches you how the gates and thresholds respond to your market.
Letters . B S C T A are informative and compact. For screenshots you can toggle them off.
Debug triggers . Show raw crosses even when gates block entries. This is useful when you tune the gates. Turn them off for normal use.
Quick start recipes
Scalping one to five minutes
Core window in the thirties to low fifties.
Horizon around five to eight.
Entry percentile around seventy five.
Exit fraction around zero point five five.
Order threshold around zero point one zero.
Avoid level around one point three zero.
Tune IsoPulse gain until normal Fusion sits inside a calm band and true squeezes push outside.
Intraday five to thirty minutes
Core window around fifty to eighty.
Horizon around ten to twelve.
Entry percentile around eighty.
Exit fraction around zero point five five to zero point six zero.
Order threshold around zero point one five.
Avoid level around one point two five.
Swing one hour to daily
Core window around eighty to one hundred twenty.
Horizon around twelve to twenty.
Entry percentile around eighty to eighty five.
Exit fraction around zero point six zero to zero point seven zero.
Order threshold around zero point two zero.
Avoid level around one point two zero.
How to connect signals to your risk plan
This is an indicator. You remain in control of orders and risk.
Stops . A simple choice is an ATR multiple measured on your chart timeframe. Intraday often prefers one point two five to one point five ATR. Swing often prefers one point five to two ATR. Adjust to symbol behavior and personal risk tolerance.
Exits . The script already prints a Close when Fusion cools inside the exit envelope. If you prefer targets you can mirror the entry envelope distance and convert that to points or percent in your own plan.
Position size . Fixed fractional or fixed risk per trade remains a sound baseline. One percent or less per trade is a common starting point for testing.
Sessions and news . Even with self scaling, some traders prefer to skip the first minutes after an open or scheduled news. Gate with your own session logic if needed.
Limitations and honest notes
No look ahead . The script is causal. The adaptive learner uses a shifted correlation, crosses are evaluated without peeking into the future, and no lookahead security calls are used. If you enable intrabar calculations a letter may appear then disappear before the close if the condition fails. This is normal for any cross based logic in real time.
No performance promises . Markets change. This is a decision aid, not a prediction machine. It will not win every sequence and it cannot guarantee statistical outcomes.
No dependence on other indicators . The chart should remain clean. You can add personal tools in private use but publications should keep the example chart readable.
Standard candles only for public signals . Non standard chart types can change event timing and produce unrealistic sequences. Use regular candles for demonstrations and publications.
Internal logic walkthrough
LEGEND feature block
Flow . Current return normalized by ATR then smoothed by a short EMA. This gives directional intent scaled to recent volatility.
Tail pressure with volume mix . The relative sizes of upper and lower wicks inside the high to low range produce a tail asymmetry. A volume based mix can emphasize wick information when volume is meaningful.
Path curvature . Second difference of close normalized by ATR and smoothed. This captures changes in impulse shape that can precede pushes or fades.
Streak persistence . Up and down close streaks are counted and netted. The result is normalized for the window length to keep behavior stable across symbols.
Entropy order . Shannon entropy of the probability of an up close. Lower entropy means more order. The value is oriented by Flow to preserve sign.
Causal weights . Each feature becomes a z score. A shifted correlation against future returns over the horizon produces a positive weight per feature. Weights are normalized so they sum to one for clarity. The result is angle mapped into a compact unit.
IsoPulse block
Effort split . The script estimates up effort and down effort per bar using both body location and wick geometry. Effort is integrated through time into two reservoirs using a forgetting factor.
Skew . The reservoir difference over the sum yields a stable skew in a known range. A short EMA smooths it.
Efficiency . Move size divided by average volume produces travel per unit volume. Normalization and centering around zero produce a symmetric measure.
Bursts and recency . Percent rank of volume highlights bursts. An exponential function of bars since last burst adds the notion of cluster memory.
IsoPulse unit . Skew multiplied by centered efficiency then scaled by the burst factor produces the raw IsoPulse that is angle mapped into the unit range.
Fusion and events
Regime factor . Entropy order and streak persistence form a mixer. Low structure favors IsoPulse. Higher structure favors LEGEND. The blend is convex so it remains interpretable.
Blended guides . Entry and exit guides are blended in the same way as the line so they stay consistent when regimes change. The envelope does not jump unexpectedly.
Virtual position . The script maintains state. Buy and Sell require a cross while flat and gates open. Close requires an exit or force condition while holding. Letters print once at the state change.
Disclosures
This script and description are educational. They do not constitute investment advice. Markets involve risk. You are responsible for your own decisions and for compliance with local rules. The logic is causal and does not look ahead. Signals on non standard chart types can be misleading and are not recommended for publication. When you test a strategy wrapper, use realistic commission and slippage, moderate risk per trade, and enough trades to form a meaningful sample, then document those assumptions if you share results.
Closing thoughts
Clarity builds confidence. The Fusion line gives a single view of intent. The letters communicate action without clutter. The HUD confirms context at a glance. The gates protect you from weak tape and poor liquidity. Tune it to your instrument, observe it across regimes, and use it as a consistent lens rather than a prediction oracle. The goal is not to trade every wiggle. The goal is to pick your spots with a calm process and to stand aside when the tape is not inviting.

Luxy Momentum, Trend, Bias and Breakout Indicators V7
TABLE OF CONTENTS
This is Version 7 (V7) - the latest and most optimized release. If you are using any older versions (V6, V5, V4, V3, etc.), it is highly recommended to replace them with V7.
Why This Indicator is Different
Who Should Use This
Core Components Overview
The UT Bot Trading System
Understanding the Market Bias Table
Candlestick Pattern Recognition
Visual Tools and Features
How to Use the Indicator
Performance and Optimization
FAQ
---
### CREDITS & ATTRIBUTION
This indicator implements proven trading concepts using entirely original code developed specifically for this project.
### CONCEPTUAL FOUNDATIONS
• UT Bot ATR Trailing System
- Original concept by @QuantNomad: (search "UT-Bot-Strategy"
- Our version is a complete reimplementation with significant enhancements:
- Volume-weighted momentum adjustment
- Composite stop loss from multiple S/R layers
- Multi-filter confirmation system (swing, %, 2-bar, ZLSMA)
- Full integration with multi-timeframe bias table
- Visual audit trail with freeze-on-touch
- NOTE: No code was copied - this is a complete reimplementation with enhancements.
• Standard Technical Indicators (Public Domain Formulas):
- Supertrend: ATR-based trend calculation with custom gradient fills
- MACD: Gerald Appel's formula with separation filters
- RSI: J. Welles Wilder's formula with pullback zone logic
- ADX/DMI: Custom trend strength formula inspired by Wilder's directional movement concept, reimplemented with volume weighting and efficiency metrics
- ZLSMA: Zero-lag formula enhanced with Hull MA and momentum prediction
### Custom Implementations
- Trend Strength: Inspired by Wilder's ADX concept but using volume-weighted pressure calculation and efficiency metrics (not traditional +DI/-DI smoothing)
- All code implementations are original
### ORIGINAL FEATURES (70%+ of codebase)
- Multi-Timeframe Bias Table with live updates
- Risk Management System (R-multiple TPs, freeze-on-touch)
- Opening Range Breakout tracker with session management
- Composite Stop Loss calculator using 6+ S/R layers
- Performance optimization system (caching, conditional calcs)
- VIX Fear Index integration
- Previous Day High/Low auto-detection
- Candlestick pattern recognition with interactive tooltips
- Smart label and visual management
- All UI/UX design and table architecture
### DEVELOPMENT PROCESS
**AI Assistance:** This indicator was developed over 2+ months with AI assistance (ChatGPT/Claude) used for:
- Writing Pine Script code based on design specifications
- Optimizing performance and fixing bugs
- Ensuring Pine Script v6 compliance
- Generating documentation
**Author's Role:** All trading concepts, system design, feature selection, integration logic, and strategic decisions are original work by the author. The AI was a coding tool, not the system designer.
**Transparency:** We believe in full disclosure - this project demonstrates how AI can be used as a powerful development tool while maintaining creative and strategic ownership.
---
1. WHY THIS INDICATOR IS DIFFERENT
Most traders use multiple separate indicators on their charts, leading to cluttered screens, conflicting signals, and analysis paralysis. The Suite solves this by integrating proven technical tools into a single, cohesive system.
Key Advantages:
All-in-One Design: Instead of loading 5-10 separate indicators, you get everything in one optimized script. This reduces chart clutter and improves TradingView performance.
Multi-Timeframe Bias Table: Unlike standard indicators that only show the current timeframe, the Bias Table aggregates trend signals across multiple timeframes simultaneously. See at a glance whether 1m, 5m, 15m, 1h are aligned bullish or bearish - no more switching between charts.
Smart Confirmations: The indicator doesn't just give signals - it shows you WHY. Every entry has multiple layers of confirmation (MA cross, MACD momentum, ADX strength, RSI pullback, volume, etc.) that you can toggle on/off.
Dynamic Stop Loss System: Instead of static ATR stops, the SL is calculated from multiple support/resistance layers: UT trailing line, Supertrend, VWAP, swing structure, and MA levels. This creates more intelligent, price-action-aware stops.
R-Multiple Take Profits: Built-in TP system calculates targets based on your initial risk (1R, 1.5R, 2R, 3R). Lines freeze when touched with visual checkmarks, giving you a clean audit trail of partial exits.
Educational Tooltips Everywhere: Every single input has detailed tooltips explaining what it does, typical values, and how it impacts trading. You're not guessing - you're learning as you configure.
Performance Optimized: Smart caching, conditional calculations, and modular design mean the indicator runs fast despite having 15+ features. Turn off what you don't use for even better performance.
No Repainting: All signals respect bar close. Alerts fire correctly. What you see in history is what you would have gotten in real-time.
What Makes It Unique:
Integrated UT Bot + Bias Table: No other indicator combines UT Bot's ATR trailing system with a live multi-timeframe dashboard. You get precision entries with macro trend context.
Candlestick Pattern Recognition with Interactive Tooltips: Patterns aren't just marked - hover over any emoji for a full explanation of what the pattern means and how to trade it.
Opening Range Breakout Tracker: Built-in ORB system for intraday traders with customizable session times and real-time status updates in the Bias Table.
Previous Day High/Low Auto-Detection: Automatically plots PDH/PDL on intraday charts with theme-aware colors. Updates daily without manual input.
Dynamic Row Labels in Bias Table: The table shows your actual settings (e.g., "EMA 10 > SMA 20") not generic labels. You know exactly what's being evaluated.
Modular Filter System: Instead of forcing a fixed methodology, the indicator lets you build your own strategy. Start with just UT Bot, add filters one at a time, test what works for your style.
---
2. WHO WHOULD USE THIS
Designed For:
Intermediate to Advanced Traders: You understand basic technical analysis (MAs, RSI, MACD) and want to combine multiple confirmations efficiently. This isn't a "one-click profit" system - it's a professional toolkit.
Multi-Timeframe Traders: If you trade one asset but check multiple timeframes for confirmation (e.g., enter on 5m after checking 15m and 1h alignment), the Bias Table will save you hours every week.
Trend Followers: The indicator excels at identifying and following trends using UT Bot, Supertrend, and MA systems. If you trade breakouts and pullbacks in trending markets, this is built for you.
Intraday and Swing Traders: Works equally well on 5m-1h charts (day trading) and 4h-D charts (swing trading). Scalpers can use it too with appropriate settings adjustments.
Discretionary Traders: This isn't a black-box system. You see all the components, understand the logic, and make final decisions. Perfect for traders who want tools, not automation.
Works Across All Markets:
Stocks (US, international)
Cryptocurrency (24/7 markets supported)
Forex pairs
Indices (SPY, QQQ, etc.)
Commodities
NOT Ideal For :
Complete Beginners: If you don't know what a moving average or RSI is, start with basics first. This indicator assumes foundational knowledge.
Algo Traders Seeking Black Box: This is discretionary. Signals require context and confirmation. Not suitable for blind automated execution.
Mean-Reversion Only Traders: The indicator is trend-following at its core. While VWAP bands support mean-reversion, the primary methodology is trend continuation.
---
3. CORE COMPONENTS OVERVIEW
The indicator combines these proven systems:
Trend Analysis:
Moving Averages: Four customizable MAs (Fast, Medium, Medium-Long, Long) with six types to choose from (EMA, SMA, WMA, VWMA, RMA, HMA). Mix and match for your style.
Supertrend: ATR-based trend indicator with unique gradient fill showing trend strength. One-sided ribbon visualization makes it easier to see momentum building or fading.
ZLSMA : Zero-lag linear-regression smoothed moving average. Reduces lag compared to traditional MAs while maintaining smooth curves.
Momentum & Filters:
MACD: Standard MACD with separation filter to avoid weak crossovers.
RSI: Pullback zone detection - only enter longs when RSI is in your defined "buy zone" and shorts in "sell zone".
ADX/DMI: Trend strength measurement with directional filter. Ensures you only trade when there's actual momentum.
Volume Filter: Relative volume confirmation - require above-average volume for entries.
Donchian Breakout: Optional channel breakout requirement.
Signal Systems:
UT Bot: The primary signal generator. ATR trailing stop that adapts to volatility and gives clear entry/exit points.
Base Signals: MA cross system with all the above filters applied. More conservative than UT Bot alone.
Market Bias Table: Multi-timeframe dashboard showing trend alignment across 7 timeframes plus macro bias (3-day, weekly, monthly, quarterly, VIX).
Candlestick Patterns: Six major reversal patterns auto-detected with interactive tooltips.
ORB Tracker: Opening range high/low with breakout status (intraday only).
PDH/PDL: Previous day levels plotted automatically on intraday charts.
VWAP + Bands : Session-anchored VWAP with up to three standard deviation band pairs.
---
4. THE UT BOT TRADING SYSTEM
The UT Bot is the heart of the indicator's signal generation. It's an advanced ATR trailing stop that adapts to market volatility.
Why UT Bot is Superior to Fixed Stops:
Traditional ATR stops use a fixed multiplier (e.g., "stop = entry - 2×ATR"). UT Bot is smarter:
It TRAILS the stop as price moves in your favor
It WIDENS during high volatility to avoid premature stops
It TIGHTENS during consolidation to lock in profits
It FLIPS when price breaks the trailing line, signaling reversals
Visual Elements You'll See:
Orange Trailing Line: The actual UT stop level that adapts bar-by-bar
Buy/Sell Labels: Aqua triangle (long) or orange triangle (short) when the line flips
ENTRY Line: Horizontal line at your entry price (optional, can be turned off)
Suggested Stop Loss: A composite SL calculated from multiple support/resistance layers:
- UT trailing line
- Supertrend level
- VWAP
- Swing structure (recent lows/highs)
- Long-term MA (200)
- ATR-based floor
Take Profit Lines: TP1, TP1.5, TP2, TP3 based on R-multiples. When price touches a TP, it's marked with a checkmark and the line freezes for audit trail purposes.
Status Messages: "SL Touched ❌" or "SL Frozen" when the trade leg completes.
How UT Bot Differs from Other ATR Systems:
Multiple Filters Available: You can require 2-bar confirmation, minimum % price change, swing structure alignment, or ZLSMA directional filter. Most UT implementations have none of these.
Smart SL Calculation: Instead of just using the UT line as your stop, the indicator suggests a better SL based on actual support/resistance. This prevents getting stopped out by wicks while keeping risk controlled.
Visual Audit Trail: All SL/TP lines freeze when touched with clear markers. You can review your trades weeks later and see exactly where entries, stops, and targets were.
Performance Options: "Draw UT visuals only on bar close" lets you reduce rendering load without affecting logic or alerts - critical for slower machines or 1m charts.
Trading Logic:
UT Bot flips direction (Buy or Sell signal appears)
Check Bias Table for multi-timeframe confirmation
Optional: Wait for Base signal or candlestick pattern
Enter at signal bar close or next bar open
Place stop at "Suggested Stop Loss" line
Scale out at TP levels (TP1, TP2, TP3)
Exit remaining position on opposite UT signal or stop hit
---
5. UNDERSTANDING THE MARKET BIAS TABLE
This is the indicator's unique multi-timeframe intelligence layer. Instead of looking at one chart at a time, the table aggregates signals across seven timeframes plus macro trend bias.
Why Multi-Timeframe Analysis Matters:
Professional traders check higher and lower timeframes for context:
Is the 1h uptrend aligning with my 5m entry?
Are all short-term timeframes bullish or just one?
Is the daily trend supportive or fighting me?
Doing this manually means opening multiple charts, checking each indicator, and making mental notes. The Bias Table does it automatically in one glance.
Table Structure:
Header Row:
On intraday charts: 1m, 5m, 15m, 30m, 1h, 2h, 4h (toggle which ones you want)
On daily+ charts: D, W, M (automatic)
Green dot next to title = live updating
Headline Rows - Macro Bias:
These show broad market direction over longer periods:
3 Day Bias: Trend over last 3 trading sessions (uses 1h data)
Weekly Bias: Trend over last 5 trading sessions (uses 4h data)
Monthly Bias: Trend over last 30 daily bars
Quarterly Bias: Trend over last 13 weekly bars
VIX Fear Index: Market regime based on VIX level - bullish when low, bearish when high
Opening Range Breakout: Status of price vs. session open range (intraday only)
These rows show text: "BULLISH", "BEARISH", or "NEUTRAL"
Indicator Rows - Technical Signals:
These evaluate your configured indicators across all active timeframes:
Fast MA > Medium MA (shows your actual MA settings, e.g., "EMA 10 > SMA 20")
Price > Long MA (e.g., "Price > SMA 200")
Price > VWAP
MACD > Signal
Supertrend (up/down/neutral)
ZLSMA Rising
RSI In Zone
ADX ≥ Minimum
These rows show emojis: GREEB (bullish), RED (bearish), GRAY/YELLOW (neutral/NA)
AVG Column:
Shows percentage of active timeframes that are bullish for that row. This is the KEY metric:
AVG > 70% = strong multi-timeframe bullish alignment
AVG 40-60% = mixed/choppy, no clear trend
AVG < 30% = strong multi-timeframe bearish alignment
How to Use the Table:
For a long trade:
Check AVG column - want to see > 60% ideally
Check headline bias rows - want to see BULLISH, not BEARISH
Check VIX row - bullish market regime preferred
Check ORB row (intraday) - want ABOVE for longs
Scan indicator rows - more green = better confirmation
For a short trade:
Check AVG column - want to see < 40% ideally
Check headline bias rows - want to see BEARISH, not BULLISH
Check VIX row - bearish market regime preferred
Check ORB row (intraday) - want BELOW for shorts
Scan indicator rows - more red = better confirmation
When AVG is 40-60%:
Market is choppy, mixed signals. Either stay out or reduce position size significantly. These are low-probability environments.
Unique Features:
Dynamic Labels: Row names show your actual settings (e.g., "EMA 10 > SMA 20" not generic "Fast > Slow"). You know exactly what's being evaluated.
Customizable Rows: Turn off rows you don't care about. Only show what matters to your strategy.
Customizable Timeframes: On intraday charts, disable 1m or 4h if you don't trade them. Reduces calculation load by 20-40%.
Automatic HTF Handling: On Daily/Weekly/Monthly charts, the table automatically switches to D/W/M columns. No configuration needed.
Performance Smart: "Hide BIAS table on 1D or above" option completely skips all table calculations on higher timeframes if you only trade intraday.
---
6. CANDLESTICK PATTERN RECOGNITION
The indicator automatically detects six major reversal patterns and marks them with emojis at the relevant bars.
Why These Six Patterns:
These are the most statistically significant reversal patterns according to trading literature:
High win rate when appearing at support/resistance
Clear visual structure (not subjective)
Work across all timeframes and assets
Studied extensively by institutions
The Patterns:
Bullish Patterns (appear at bottoms):
Bullish Engulfing: Green candle completely engulfs prior red candle's body. Strong reversal signal.
Hammer: Small body with long lower wick (at least 2× body size). Shows rejection of lower prices by buyers.
Morning Star: Three-candle pattern (large red → small indecision → large green). Very strong bottom reversal.
Bearish Patterns (appear at tops):
Bearish Engulfing: Red candle completely engulfs prior green candle's body. Strong reversal signal.
Shooting Star: Small body with long upper wick (at least 2× body size). Shows rejection of higher prices by sellers.
Evening Star: Three-candle pattern (large green → small indecision → large red). Very strong top reversal.
Interactive Tooltips:
Unlike most pattern indicators that just draw shapes, this one is educational:
Hover your mouse over any pattern emoji
A tooltip appears explaining: what the pattern is, what it means, when it's most reliable, and how to trade it
No need to memorize - learn as you trade
Noise Filter:
"Min candle body % to filter noise" setting prevents false signals:
Patterns require minimum body size relative to price
Filters out tiny candles that don't represent real buying/selling pressure
Adjust based on asset volatility (higher % for crypto, lower for low-volatility stocks)
How to Trade Patterns:
Patterns are NOT standalone entry signals. Use them as:
Confirmation: UT Bot gives signal + pattern appears = stronger entry
Reversal Warning: In a trade, opposite pattern appears = consider tightening stop or taking profit
Support/Resistance Validation: Pattern at key level (PDH, VWAP, MA 200) = level is being respected
Best combined with:
UT Bot or Base signal in same direction
Bias Table alignment (AVG > 60% or < 40%)
Appearance at obvious support/resistance
---
7. VISUAL TOOLS AND FEATURES
VWAP (Volume Weighted Average Price):
Session-anchored VWAP with standard deviation bands. Shows institutional "fair value" for the trading session.
Anchor Options: Session, Day, Week, Month, Quarter, Year. Choose based on your trading timeframe.
Bands: Up to three pairs (X1, X2, X3) showing statistical deviation. Price at outer bands often reverses.
Auto-Hide on HTF: VWAP hides on Daily/Weekly/Monthly charts automatically unless you enable anchored mode.
Use VWAP as:
Directional bias (above = bullish, below = bearish)
Mean reversion levels (outer bands)
Support/resistance (the VWAP line itself)
Previous Day High/Low:
Automatically plots yesterday's high and low on intraday charts:
Updates at start of each new trading day
Theme-aware colors (dark text for light charts, light text for dark charts)
Hidden automatically on Daily/Weekly/Monthly charts
These levels are critical for intraday traders - institutions watch them closely as support/resistance.
Opening Range Breakout (ORB):
Tracks the high/low of the first 5, 15, 30, or 60 minutes of the trading session:
Customizable session times (preset for NYSE, LSE, TSE, or custom)
Shows current breakout status in Bias Table row (ABOVE, BELOW, INSIDE, BUILDING)
Intraday only - auto-disabled on Daily+ charts
ORB is a classic day trading strategy - breakout above opening range often leads to continuation.
Extra Labels:
Change from Open %: Shows how far price has moved from session open (intraday) or daily open (HTF). Green if positive, red if negative.
ADX Badge: Small label at bottom of last bar showing current ADX value. Green when above your minimum threshold, red when below.
RSI Badge: Small label at top of last bar showing current RSI value with zone status (buy zone, sell zone, or neutral).
These labels provide quick at-a-glance confirmation without needing separate indicator windows.
---
8. HOW TO USE THE INDICATOR
Step 1: Add to Chart
Load the indicator on your chosen asset and timeframe
First time: Everything is enabled by default - the chart will look busy
Don't panic - you'll turn off what you don't need
Step 2: Start Simple
Turn OFF everything except:
UT Bot labels (keep these ON)
Bias Table (keep this ON)
Moving Averages (Fast and Medium only)
Suggested Stop Loss and Take Profits
Hide everything else initially. Get comfortable with the basic UT Bot + Bias Table workflow first.
Step 3: Learn the Core Workflow
UT Bot gives a Buy or Sell signal
Check Bias Table AVG column - do you have multi-timeframe alignment?
If yes, enter the trade
Place stop at Suggested Stop Loss line
Scale out at TP levels
Exit on opposite UT signal
Trade this simple system for a week. Get a feel for signal frequency and win rate with your settings.
Step 4: Add Filters Gradually
If you're getting too many losing signals (whipsaws in choppy markets), add filters one at a time:
Try: "Require 2-Bar Trend Confirmation" - wait for 2 bars to confirm direction
Try: ADX filter with minimum threshold - only trade when trend strength is sufficient
Try: RSI pullback filter - only enter on pullbacks, not chasing
Try: Volume filter - require above-average volume
Add one filter, test for a week, evaluate. Repeat.
Step 5: Enable Advanced Features (Optional)
Once you're profitable with the core system, add:
Supertrend for additional trend confirmation
Candlestick patterns for reversal warnings
VWAP for institutional anchor reference
ORB for intraday breakout context
ZLSMA for low-lag trend following
Step 6: Optimize Settings
Every setting has a detailed tooltip explaining what it does and typical values. Hover over any input to read:
What the parameter controls
How it impacts trading
Suggested ranges for scalping, day trading, and swing trading
Start with defaults, then adjust based on your results and style.
Step 7: Set Up Alerts
Right-click chart → Add Alert → Condition: "Luxy Momentum v6" → Choose:
"UT Bot — Buy" for long entries
"UT Bot — Sell" for short entries
"Base Long/Short" for filtered MA cross signals
Optionally enable "Send real-time alert() on UT flip" in settings for immediate notifications.
Common Workflow Variations:
Conservative Trader:
UT signal + Base signal + Candlestick pattern + Bias AVG > 70%
Enter only at major support/resistance
Wider UT sensitivity, multiple filters
Aggressive Trader:
UT signal + Bias AVG > 60%
Enter immediately, no waiting
Tighter UT sensitivity, minimal filters
Swing Trader:
Focus on Daily/Weekly Bias alignment
Ignore intraday noise
Use ORB and PDH/PDL less (or not at all)
Wider stops, patient approach
---
9. PERFORMANCE AND OPTIMIZATION
The indicator is optimized for speed, but with 15+ features running simultaneously, chart load time can add up. Here's how to keep it fast:
Biggest Performance Gains:
Disable Unused Timeframes: In "Time Frames" settings, turn OFF any timeframe you don't actively trade. Each disabled TF saves 10-15% calculation time. If you only day trade 5m, 15m, 1h, disable 1m, 2h, 4h.
Hide Bias Table on Daily+: If you only trade intraday, enable "Hide BIAS table on 1D or above". This skips ALL table calculations on higher timeframes.
Draw UT Visuals Only on Bar Close: Reduces intrabar rendering of SL/TP/Entry lines. Has ZERO impact on logic or alerts - purely visual optimization.
Additional Optimizations:
Turn off VWAP bands if you don't use them
Disable candlestick patterns if you don't trade them
Turn off Supertrend fill if you find it distracting (keep the line)
Reduce "Limit to 10 bars" for SL/TP lines to minimize line objects
Performance Features Built-In:
Smart Caching: Higher timeframe data (3-day bias, weekly bias, etc.) updates once per day, not every bar
Conditional Calculations: Volume filter only calculates when enabled. Swing filter only runs when enabled. Nothing computes if turned off.
Modular Design: Every component is independent. Turn off what you don't need without breaking other features.
Typical Load Times:
5m chart, all features ON, 7 timeframes: ~2-3 seconds
5m chart, core features only, 3 timeframes: ~1 second
1m chart, all features: ~4-5 seconds (many bars to calculate)
If loading takes longer, you likely have too many indicators on the chart total (not just this one).
---
10. FAQ
Q: How is this different from standard UT Bot indicators?
A: Standard UT Bot (originally by @QuantNomad) is just the ATR trailing line and flip signals. This implementation adds:
- Volume weighting and momentum adjustment to the trailing calculation
- Multiple confirmation filters (swing, %, 2-bar, ZLSMA)
- Smart composite stop loss system from multiple S/R layers
- R-multiple take profit system with freeze-on-touch
- Integration with multi-timeframe Bias Table
- Visual audit trail with checkmarks
Q: Can I use this for automated trading?
A: The indicator is designed for discretionary trading. While it has clear signals and alerts, it's not a mechanical system. Context and judgment are required.
Q: Does it repaint?
A: No. All signals respect bar close. UT Bot logic runs intrabar but signals only trigger on confirmed bars. Alerts fire correctly with no lookahead.
Q: Do I need to use all the features?
A: Absolutely not. The indicator is modular. Many profitable traders use just UT Bot + Bias Table + Moving Averages. Start simple, add complexity only if needed.
Q: How do I know which settings to use?
A: Every single input has a detailed tooltip. Hover over any setting to see:
What it does
How it affects trading
Typical values for scalping, day trading, swing trading
Start with defaults, adjust gradually based on results.
Q: Can I use this on crypto 24/7 markets?
A: Yes. ORB will not work (no defined session), but everything else functions normally. Use "Day" anchor for VWAP instead of "Session".
Q: The Bias Table is blank or not showing.
A: Check:
"Show Table" is ON
Table position isn't overlapping another indicator's table (change position)
At least one row is enabled
"Hide BIAS table on 1D or above" is OFF (if on Daily+ chart)
Q: Why are candlestick patterns not appearing?
A: Patterns are relatively rare by design - they only appear at genuine reversal points. Check:
Pattern toggles are ON
"Min candle body %" isn't too high (try 0.05-0.10)
You're looking at a chart with actual reversals (not strong trending market)
Q: UT Bot is too sensitive/not sensitive enough.
A: Adjust "Sensitivity (Key×ATR)". Lower number = tighter stop, more signals. Higher number = wider stop, fewer signals. Read the tooltip for guidance.
Q: Can I get alerts for the Bias Table?
A: The Bias Table is a dashboard for visual analysis, not a signal generator. Set alerts on UT Bot or Base signals, then manually check Bias Table for confirmation.
Q: Does this work on stocks with low volume?
A: Yes, but turn OFF the volume filter. Low volume stocks will never meet relative volume requirements.
Q: How often should I check the Bias Table?
A: Before every entry. It takes 2 seconds to glance at the AVG column and headline rows. This one check can save you from fighting the trend.
Q: What if UT signal and Base signal disagree?
A: UT Bot is more aggressive (ATR trailing). Base signals are more conservative (MA cross + filters). If they disagree, either:
Wait for both to align (safest)
Take the UT signal but with smaller size (aggressive)
Skip the trade (conservative)
There's no "right" answer - depends on your risk tolerance.
---
FINAL NOTES
The indicator gives you an edge. How you use that edge determines results.
For questions, feedback, or support, comment on the indicator page or message the author.
Happy Trading!

PAL strategy
This trading script is based on the foundational concepts of the BBMA Omaa Ally, but it incorporates several custom additions and modifications tailored to a specific individual trading style. The general approach for utilizing these signals is as follows:
1. EXT, CSM, and CSAK Signals: When any of these momentum/breakout signals occur, the trader typically waits for a re-entry or retracement of the price action. The actual trade entry is then made upon contact with the opposing WMA 5 or WMA 10 lines.
2. CSAK with CB1 (CBS): If a CSAK candle forms concurrently with a CB1 (an initial breakout confirmation), the setup is designated as a **CBS**. For lower timeframes (M5/M15), an instant entry may be taken on the CBS candle, while entries on higher timeframes (H1/H4/Daily) are taken on the WMA 5/10 retracement following the CBS.
3. CSAK with CB1 and Dominant Break (PAL): A setup involving a CSAK candle, CB1, and a break of a Dominant candle/level is identified as a **PAL**. Similar to the CBS rule, an instant entry is taken on M5/M15, and a **WMA 5/10 retracement entry is utilized for higher timeframes.
4. CPA Signals: The **CPA** signal is treated as a high-conviction setup, warranting an instant entry. For all trades, the Stop Loss (SL) and Take Profit (TP) are managed by exiting the trade if the price breaks the opposing WMA 5 or WMA 10 line.
**In an advanced trading context, the confirmation of a re-entry on a higher timeframe is verified by observing an EXT signal on a corresponding lower timeframe. This is known as confluent confirmation.
Monthly -> daily
Weekly -> H4
Daily -> H1
H4 -> m15
H1 -> m5
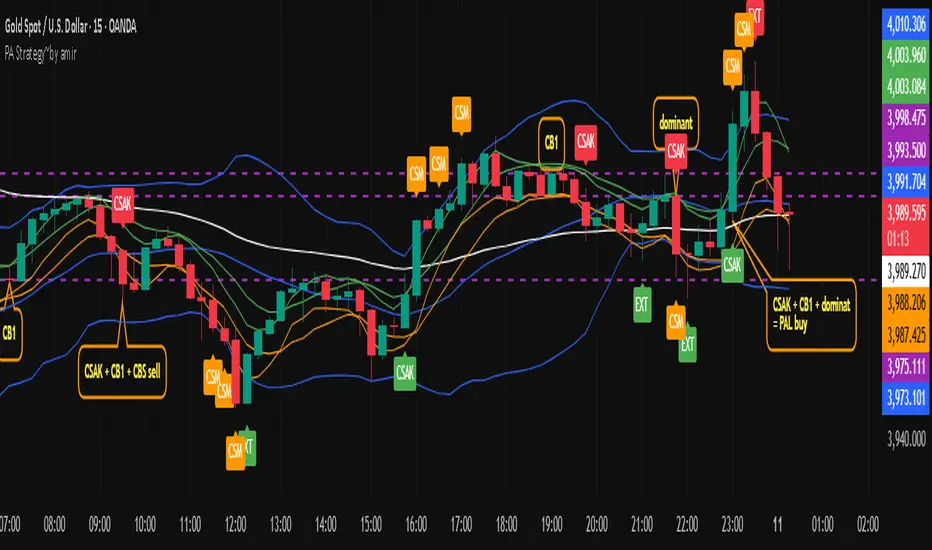
Signal Tester EN [Abusuhil]Signal Tester - Complete Description
Overview
Signal Tester is a comprehensive trading tool designed to backtest and analyze external trading signals with advanced risk management capabilities. The indicator provides seven different calculation methods for stop-loss and take-profit levels, along with detailed performance statistics and real-time tracking of active trades.
Important Disclaimer: This indicator is a tool for analysis and education purposes only. Past performance does not guarantee future results. Trading involves substantial risk of loss and is not suitable for all investors. Always conduct your own research and consider seeking advice from a qualified financial advisor before making trading decisions.
Key Features
7 Calculation Methods for customizable risk management
External Signal Integration via any oscillator or indicator
Real-time Trade Tracking with visual entry/exit points
Comprehensive Statistics Table showing win rate, profit/loss, and active trades
Date Filtering for focused backtesting periods
Custom Alerts for new buy signals
Multi-Target System with up to 5 take-profit levels
How to Use
Step 1: Connect External Signal
The indicator requires an external signal source to generate buy signals.
Add your preferred indicator to the chart (RSI, MACD, Stochastic, custom indicator, etc.)
In Signal Tester settings, locate "External Indicator" input
Click the input and select your indicator's plot line
Buy signals are generated when the external source crosses above zero
Example: If using RSI, connect the RSI line. A buy signal triggers when RSI crosses above the zero reference (if plotted as oscillator).
Step 2: Choose Your Calculation Method
Select one of seven methods under "Calculation Method":
1. Percentage %
The simplest method using fixed percentage values.
Settings:
Stop Loss %: Distance from entry to stop-loss (default: 2%)
Target 1-5 %: Distance from entry to each take-profit level
Example: Entry at $100
Stop Loss (2%): $98
Target 1 (2%): $102
Target 2 (4%): $104
Best For: Beginners, markets with consistent volatility
2. ATR Multiplier
Uses Average True Range for dynamic levels based on market volatility.
Settings:
ATR Period: Calculation period (default: 14)
Stop Multiplier: ATR multiplier for stop-loss (default: 1.5)
Target Multipliers: ATR multipliers for each take-profit
Example: Entry at $100, ATR = $2
Stop Loss (1.5x ATR): $100 - $3 = $97
Target 1 (2x ATR): $100 + $4 = $104
Best For: Volatile markets, adapting to changing conditions
3. Risk:Reward Ratio
Calculates targets based on risk-to-reward ratios.
Settings:
Stop Loss %: Initial risk percentage
Target Ratios: R:R ratio for each target (1:1.5, 1:2, 1:3, etc.)
Example: Entry at $100, Stop at $98 (2% risk = $2)
Target 1 (1:1.5): $100 + ($2 × 1.5) = $103
Target 2 (1:2): $100 + ($2 × 2) = $104
Target 3 (1:3): $100 + ($2 × 3) = $106
Best For: Traders focused on risk management and position sizing
4. Swing High/Low
Places stop-loss at recent swing low with targets as multiples of the risk.
Settings:
Swing Lookback Candles: Number of bars to find swing low (default: 5)
Stop Safety Distance %: Buffer below swing low
Target Multipliers: Risk multiples for each target
Example: Entry at $105, Swing Low at $100
Stop Loss: $100 - 0.1% = $99.90 (risk = $5.10)
Target 1 (1.5x): $105 + ($5.10 × 1.5) = $112.65
Best For: Swing traders, respecting market structure
5. Partial Take Profit
Sells portions of the position at each target level, moving stop to entry after first target.
Settings:
Stop Loss %: Initial stop distance
Target 1-5 %: Price levels for partial exits
Sell % at TP1-4: Percentage of position to close at each level
Example: 100% position, 50% sell at each target
TP1 hit: Sell 50%, remaining 50%, stop moves to entry
TP2 hit: Sell 25% (50% of remaining), remaining 25%
TP3 hit: Sell 12.5%, remaining 12.5%
Best For: Conservative traders, locking in profits gradually
6. Trailing Stop
Similar to Partial Take Profit but trails the stop-loss to each achieved target.
Settings:
Stop Loss %: Initial stop distance
Target 1-5 %: Price levels for trailing stops
Sell % at TP1-4: Percentage to close at each level
Example:
TP1 ($102) hit: Sell 50%, stop trails to $102
TP2 ($104) hit: Sell 25%, stop trails to $104
Price retraces to $104: Exit with locked profits
Best For: Trend followers, maximizing profit in strong moves
7. Smart Exit
Advanced method that moves stop to entry after first target, then exits based on technical conditions.
Settings:
Stop Loss %: Initial stop distance
First Target %: When hit, stop moves to breakeven
Exit Method: Choose from 8 exit strategies
Exit Methods:
Close < EMA 21: Exits when price closes below 21-period EMA
Close < MA 20: Exits when price closes below 20-period Moving Average
Supertrend Flip: Exits when Supertrend indicator flips bearish
ATR Trailing Stop: Dynamic trailing stop based on ATR
MACD Crossover: Exits on MACD bearish crossover
RSI < 50: Exits when RSI drops below specified level
Parabolic SAR Flip: Exits when SAR flips above price
Bollinger Bands: Exits when price closes below middle or lower band
Best For: Advanced traders, letting winners run with protection
Date Filtering
Control which trades are included in backtesting.
Filter Types:
Specific Date: Only trades after selected date
Number of Weeks: Last X weeks (default: 12)
Number of Months: Last X months (default: 3)
How to Enable:
Check "Enable Date Filter"
Select filter type
Set the date or number of weeks/months
Use Case: Test strategy performance in recent market conditions or specific periods
Understanding the Statistics Table
The table displays the last 10 trades plus comprehensive statistics:
Trade Columns:
#: Trade number
Entry: Entry price
Stop: Current stop-loss level
TP1-TP5: Checkmarks (✅) when targets are hit
Profit %: Realized profit for the trade
Max %: Maximum unrealized profit reached (⬆️ indicates active trade)
Status:
🔄 Active trade
✅ Closed winner
❌ SL - Stopped out
Summary Row:
Total: Number of trades executed
Period: Duration of trading period (Years, Months, Days)
Statistics Row:
W: Number of winning trades
L: Number of losing trades
A: Number of active (open) trades
Win Rate %: (Wins / Total Trades) × 100
Performance Row:
Profit: Total profit from all winning trades
Loss: Total loss from all losing trades
Net: Net profit/loss (Profit - Loss)
Visual Elements
When a buy signal triggers, the indicator draws:
Blue Line: Entry price
Red Line: Stop-loss level
Green Lines: Take-profit levels (up to 5)
Green Label: Trade number below the entry bar
Green Triangle: Buy signal marker
Alerts
The indicator includes customizable alerts for new buy signals.
Setting Up Alerts:
Click the "⏰" icon in TradingView
Select "Signal Tester "
Choose condition: "Buy"
Configure notification preferences (popup, email, webhook)
Click "Create"
Alert Message Format:
🚀 New Buy Signal!
Price:
Trade #:
Best Practices
Backtest First: Test each calculation method on historical data before live trading
Match Timeframe: Use the indicator on the timeframe you plan to trade
Combine with Analysis: Use alongside support/resistance, trend analysis, and other tools
Risk Management: Never risk more than 1-2% of capital per trade
Review Statistics: Regularly check win rate and profit/loss metrics
Adjust Settings: Optimize parameters based on the asset's volatility and your risk tolerance
Limitations
Requires external signal source (does not generate signals independently)
Backtesting assumes perfect entry/exit execution (real trading includes slippage)
Past performance does not guarantee future results
Should be used as one component of a complete trading strategy
Version Information
Version: 1.0
Pine Script Version: v5
Type: Overlay Indicator
Author: Abusuhil
Support and Updates
This indicator is provided as-is for educational and analytical purposes. Users are responsible for their own trading decisions and should thoroughly test any strategy before implementing it with real capital.
Risk Warning: Trading financial instruments carries a high level of risk and may not be suitable for all investors. The high degree of leverage can work against you as well as for you. Before deciding to trade, you should carefully consider your investment objectives, level of experience, and risk appetite. Only trade with money you can afford to lose.
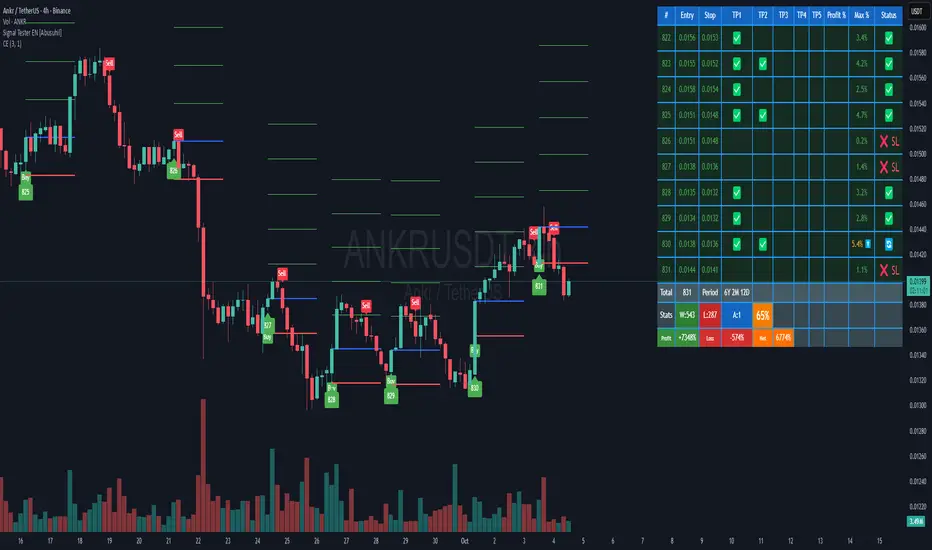
Rsi TrendLines with Breakouts [KoTa]### RSI TrendLines with Breakouts Indicator: Detailed User Guide
The "RSI TrendLines with Breakouts " indicator is a custom Pine Script tool designed for TradingView. It builds on the standard Relative Strength Index (RSI) by adding dynamic trendlines based on RSI pivots (highs and lows) across multiple user-defined periods. These trendlines act as support and resistance levels on the RSI chart, and the indicator detects breakouts when the RSI crosses these lines, generating potential buy (long) or sell (short) signals. It also includes overbought/oversold thresholds and optional breakout labels. Below, I'll provide a detailed explanation in English, covering how to use it, its purpose, advantages and disadvantages, example strategies, and ways to enhance strategies with other indicators.
How to Use the Indicator
- The indicator uses `max_lines_count=500` to handle a large number of lines without performance issues, but on very long charts, you may need to zoom in for clarity.
1. **Customizing Settings**:
The indicator has several input groups for flexibility. Access them via the gear icon next to the indicator's name on the chart.
- **RSI Settings**:
- RSI Length: Default 14. This is the period for calculating the RSI. Shorter lengths (e.g., 7-10) make it more sensitive to recent price changes; longer (e.g., 20+) smooth it out for trends.
- RSI Source: Default is close price. You can change to open, high, low, or other sources like volume-weighted for different assets.
- Overbought Level: Default 70. RSI above this suggests potential overbuying.
- Oversold Level: Default 30. RSI below this suggests potential overselling.
- **Trend Periods**:
- You can enable/disable up to 5 periods (defaults: Period 1=3, Period 2=5, Period 3=10, Period 4=20, Period 5=50). Only enabled periods will draw trendlines.
- Each period detects pivots (highs/lows) in RSI using `ta.pivothigh` and `ta.pivotlow`. Shorter periods (e.g., 3-10) capture short-term trends; longer ones (20-50) show medium-to-long-term momentum.
- Inline checkboxes allow you to toggle display for each (e.g., display_p3=true by default).
- **Color Settings**:
- Resistance/Support Color: Defaults to red for resistance (up-trendlines from RSI highs) and green for support (down-trendlines from RSI lows).
- Labels for breakouts use green for "B" (buy/long) and red for "S" (sell/short).
- **Breakout Settings**:
- Show Prev. Breakouts: If true, displays previous breakout labels (up to "Max Prev. Breakouts Label" +1, default 2+1=3).
- Show Breakouts: Separate toggles for each period (e.g., show_breakouts3). When enabled, dotted extension lines project the trendline forward, and crossovers/crossunders trigger labels like "B3" (breakout above resistance for Period 3) or "S3" (break below support).
- Note: Divergence detection is commented out in the code. If you want to enable it, uncomment the relevant sections (e.g., show_divergence input) and adjust the lookback (default 5 bars) for spotting bullish/bearish divergences between price and RSI.
2. **Interpreting the Visuals**:
- **RSI Plot**: A blue line showing the RSI value (0-100). Horizontal dashed lines at 70 (red, overbought), 30 (green, oversold), and 50 (gray, midline).
- **Trendlines**: Solid lines connecting recent RSI pivots. Green lines (support) connect lows; red lines (resistance) connect highs. Only the most recent line per direction is shown per period to avoid clutter.
- **Breakout Projections**: Dotted lines extend the current trendline forward. When RSI crosses above a red dotted resistance, a "B" label (e.g., "B1") appears above, indicating a potential bullish breakout. Crossing below a green dotted support shows an "S" label below, indicating bearish.
- **Labels**: Current breakouts are bright (green/red); previous ones fade to gray. Use these as signal alerts.
- **Alerts**: The code includes commented-out alert conditions (e.g., for breakouts or RSI crossing levels). Uncomment and set them up in TradingView's alert menu for notifications.
3. **Best Practices**:
- Use on RSI-compatible timeframes (e.g., 1H, 4H, daily) for stocks, forex, or crypto.
- Combine with price chart: Trendlines are on RSI, so check if RSI breakouts align with price action (e.g., breaking a price resistance).
- Test on historical data: Backtest signals using TradingView's replay feature.
- Avoid over-customization initially—start with defaults (Periods 3 and 5 enabled) to understand behavior.
What It Is Used For
This indicator is primarily used for **momentum-based trend analysis and breakout trading on the RSI oscillator**. Traditional RSI identifies overbought/oversold conditions, but this enhances it by drawing dynamic trendlines on RSI itself, treating RSI as a "price-like" chart for trend detection.
- **Key Purposes**:
- **Identifying Momentum Trends**: RSI trendlines show if momentum is strengthening (upward-sloping support) or weakening (downward-sloping resistance), even if price is ranging.
- **Spotting Breakouts**: Detects when RSI breaks its own support/resistance, signaling potential price reversals or continuations. For example, an RSI breakout above resistance in an oversold zone might indicate a bullish price reversal.
- **Multi-Period Analysis**: By using multiple pivot periods, it acts like a multi-timeframe tool within RSI, helping confirm short-term signals with longer-term trends.
- **Signal Generation**: Breakout labels provide entry/exit points, especially in trending markets. It's useful for swing trading, scalping, or confirming trends in larger strategies.
- **Divergence (Optional)**: If enabled, it highlights mismatches between price highs/lows and RSI, which can predict reversals (e.g., bullish divergence: price lower low, RSI higher low).
Overall, it's ideal for traders who rely on oscillators but want more visual structure, like trendline traders applying price concepts to RSI.
Advantages and Disadvantages
**Advantages**:
- **Visual Clarity**: Trendlines make RSI easier to interpret than raw numbers, helping spot support/resistance in momentum without manual drawing.
- **Multi-Period Flexibility**: Multiple periods allow analyzing short- and long-term momentum simultaneously, reducing noise from single-period RSI.
- **Breakout Signals**: Automated detection of breakouts provides timely alerts, with labels and projections for proactive trading. This can improve entry timing in volatile markets.
- **Customization**: Extensive inputs (periods, colors, breakouts) make it adaptable to different assets/timeframes. The stateful management of lines/labels prevents chart clutter.
- **Complementary to Price Action**: Enhances standard RSI by adding trend context, useful for confirming divergences or overbought/oversold trades.
- **Efficiency**: Uses efficient arrays and line management, supporting up to 500 lines for long charts without lagging TradingView.
**Disadvantages**:
- **Lagging Nature**: Based on historical pivots, signals may lag in fast-moving markets, leading to late entries. Shorter periods help but increase whipsaws.
- **False Signals**: In ranging or sideways markets, RSI trendlines can produce frequent false breakouts. It performs better in trending conditions but may underperform without filters.
- **Over-Reliance on RSI**: Ignores volume, fundamentals, or price structure—breakouts might not translate to price moves if momentum decouples from price.
- **Complexity for Beginners**: Multiple periods and settings can overwhelm new users; misconfiguration (e.g., too many periods) leads to noisy charts.
- **No Built-in Risk Management**: Signals lack stop-loss/take-profit logic; users must add these manually.
- **Divergence Limitations**: The basic (commented) divergence detection is simplistic and may miss hidden divergences or require tuning.
In summary, it's powerful for momentum traders but should be used with confirmation tools to mitigate false positives.
Example Strategies
Here are one LONG (buy) and one SHORT (sell) strategy example using the indicator. These are basic; always backtest and use risk management (e.g., 1-2% risk per trade, stop-loss at recent lows/highs).
**LONG Strategy Example: Oversold RSI Support Breakout**
- **Setup**: Use on a daily chart for stocks or crypto. Enable Periods 3 and 5 (short- and medium-term). Set oversold level to 30.
- **Entry**: Wait for RSI to be in oversold (<30). Look for a "B" breakout label (e.g., "B3" or "B5") when RSI crosses above a red resistance trendline projection. Confirm with price forming a higher low or candlestick reversal (e.g., hammer).
- **Stop-Loss**: Place below the recent price low or the RSI support level equivalent in price terms (e.g., 5-10% below entry).
- **Take-Profit**: Target RSI reaching overbought (70) or a 2:1 risk-reward ratio. Exit on a bearish RSI crossunder midline (50).
- **Example Scenario**: In a downtrending stock, RSI hits 25 and forms a support trendline. On a "B5" breakout, enter long. This captures momentum reversals after overselling.
- **Rationale**: Breakout above RSI resistance in oversold signals fading selling pressure, potential for price uptrend.
**SHORT Strategy Example: Overbought RSI Resistance Breakout**
- **Setup**: Use on a 4H chart for forex pairs. Enable Periods 10 and 20. Set overbought level to 70.
- **Entry**: Wait for RSI in overbought (>70). Enter on an "S" breakout label (e.g., "S3" or "S4") when RSI crosses below a green support trendline projection. Confirm with price showing a lower high or bearish candlestick (e.g., shooting star).
- **Stop-Loss**: Above the recent price high or RSI resistance level (e.g., 5-10% above entry).
- **Take-Profit**: Target RSI hitting oversold (30) or a 2:1 risk-reward. Exit on bullish RSI crossover midline (50).
- **Example Scenario**: In an uptrending pair, RSI peaks at 75 with a resistance trendline. On "S4" breakout, enter short. This targets momentum exhaustion after overbuying.
- **Rationale**: Break below RSI support in overbought indicates weakening buying momentum, likely price downturn.
Enhancing Strategy Validity with Other Indicators
To increase the reliability of strategies based on this indicator, combine it with complementary tools for confirmation, filtering false signals, and adding context. This creates multi-indicator strategies that reduce whipsaws and improve win rates. Focus on indicators that address RSI's weaknesses (e.g., lagging, momentum-only). Below are examples of different indicators, how to integrate them, and sample strategies.
1. **Moving Averages (e.g., SMA/EMA)**:
- **How to Use**: Overlay 50/200-period EMAs on the price chart. Use RSI breakouts only in the direction of the trend (e.g., long only if price > 200 EMA).
- **Strategy Example**: Trend-Following Long – Enter on "B" RSI breakout if price is above 200 EMA and RSI > 50. This filters reversals in uptrends. Add MACD crossover for entry timing. Advantage: Aligns momentum with price trend, reducing counter-trend trades.
2. **Volume Indicators (e.g., Volume Oscillator or OBV)**:
- **How to Use**: Require increasing volume on RSI breakouts (e.g., OBV making higher highs on bullish breakouts).
- **Strategy Example**: Volume-Confirmed Short – On "S" breakout, check if volume is rising and OBV breaks its own trendline downward. Enter short only if confirmed. This validates breakouts with real market participation, avoiding low-volume traps.
3. **Other Oscillators (e.g., MACD or Stochastic)**:
- **How to Use**: Use for divergence confirmation or overbought/oversold alignment. For instance, require Stochastic (14,3,3) to also breakout from its levels.
- **Strategy Example**: Dual-Oscillator Reversal Long – Enable divergence in the indicator. Enter on bullish RSI divergence + "B" breakout if MACD histogram flips positive. Exit on MACD bearish crossover. This strengthens reversal signals by cross-verifying momentum.
4. **Price Action Tools (e.g., Support/Resistance or Candlestick Patterns)**:
- **How to Use**: Map RSI trendlines to price levels (e.g., if RSI resistance breaks, check if price breaks a key resistance).
- **Strategy Example**: Price-Aligned Breakout Short – On "S" RSI breakout in overbought, confirm with price breaking below a drawn support line or forming a bearish engulfing candle. Use Fibonacci retracements for targets. This ensures momentum translates to price movement.
5. **Volatility Indicators (e.g., Bollinger Bands or ATR)**:
- **How to Use**: Avoid trades during low volatility (e.g., Bollinger Band squeeze) to filter ranging markets. Use ATR for dynamic stops.
- **Strategy Example**: Volatility-Filtered Long – Enter "B" breakout only if Bollinger Bands are expanding (increasing volatility) and RSI is oversold. Set stop-loss at 1.5x ATR below entry. This targets high-momentum breakouts while skipping choppy periods.
**General Tips for Building Enhanced Strategies**:
- **Layering**: Start with RSI breakout as the primary signal, add 1-2 confirmations (e.g., EMA trend + volume).
- **Backtesting**: Use TradingView's strategy tester to quantify win rates with/without additions.
- **Risk Filters**: Incorporate overall market sentiment (e.g., via VIX) or avoid trading near news events.
- **Timeframe Alignment**: Use higher timeframes for trend (e.g., daily EMA) and lower for entries (e.g., 1H RSI breakout).
- **Avoid Overloading**: Too many indicators cause paralysis; aim for synergy (e.g., trend + momentum + volume).
This indicator is a versatile tool, but success depends on context and discipline. If you need code modifications or specific backtests, provide more details!

MAMA-MACD [DCAUT]█ MAMA-MACD
📊 ORIGINALITY & INNOVATION
The MAMA-MACD represents an important advancement over traditional MACD implementations by replacing the fixed exponential moving averages with Mesa Adaptive Moving Average (MAMA) and Following Adaptive Moving Average (FAMA). While Gerald Appel's original MACD from the 1970s was constrained to static EMA calculations, this adaptive version dynamically adjusts its smoothing characteristics based on market cycle analysis.
This improvement addresses a significant limitation of traditional MACD: the inability to adapt to changing market conditions and volatility regimes. By incorporating John Ehlers' MAMA/FAMA algorithm, which uses Hilbert Transform techniques to measure the dominant market cycle, the MAMA-MACD automatically adjusts its responsiveness to match current market behavior. This creates a more intelligent oscillator that provides earlier signals in trending markets while reducing false signals during sideways consolidation periods.
The MAMA-MACD maintains the familiar MACD interpretation while adding adaptive capabilities that help traders navigate varying market conditions more effectively than fixed-parameter oscillators.
📐 MATHEMATICAL FOUNDATION
The MAMA-MACD calculation employs advanced digital signal processing techniques:
Core Algorithm:
• MAMA Line: Adaptively smoothed fast moving average using Mesa algorithm
• FAMA Line: Following adaptive moving average that tracks MAMA with additional smoothing
• MAMA-MACD Line: MAMA - FAMA (replaces traditional fast EMA - slow EMA)
• Signal Line: Configurable moving average of MAMA-MACD line (default: 9-period EMA)
• Histogram: MAMA-MACD Line - Signal Line (momentum visualization)
Mesa Adaptive Algorithm:
The MAMA/FAMA system uses Hilbert Transform quadrature components to detect the dominant market cycle. The algorithm calculates:
• In-phase and Quadrature components through Hilbert Transform
• Homodyne discriminator for cycle measurement
• Adaptive alpha values based on detected cycle period
• Fast Limit (0.1 default): Maximum adaptation rate for MAMA
• Slow Limit (0.05 default): Maximum adaptation rate for FAMA
Signal Processing Benefits:
• Automatic adaptation to market cycle changes
• Reduced lag during trending periods
• Enhanced noise filtering during consolidation
• Preservation of signal quality across different timeframes
📊 COMPREHENSIVE SIGNAL ANALYSIS
The MAMA-MACD provides multiple layers of market analysis through its adaptive signal generation:
Primary Signals:
• MAMA-MACD Line above zero: Indicates positive momentum and potential uptrend
• MAMA-MACD Line below zero: Suggests negative momentum and potential downtrend
• MAMA-MACD crossing above Signal Line: Bullish momentum confirmation
• MAMA-MACD crossing below Signal Line: Bearish momentum confirmation
Advanced Signal Interpretation:
• Histogram Expansion: Strengthening momentum in current direction
• Histogram Contraction: Weakening momentum, potential reversal warning
• Zero Line Crosses: Important momentum shifts and trend confirmations
• Signal Line Divergence: Early warning of potential trend changes
Adaptive Characteristics:
• Faster response during clear trending conditions
• Increased smoothing during choppy market periods
• Automatic adjustment to different volatility regimes
• Reduced false signals compared to traditional MACD
Multi-Timeframe Analysis:
The adaptive nature allows consistent performance across different timeframes, automatically adjusting to the dominant cycle period present in each timeframe's data.
🎯 STRATEGIC APPLICATIONS
The MAMA-MACD serves multiple strategic functions in comprehensive trading systems:
Trend Analysis Applications:
• Trend Confirmation: Use zero line crosses to confirm trend direction changes
• Momentum Assessment: Monitor histogram patterns for momentum strength evaluation
• Cycle-Based Analysis: Leverage adaptive properties for cycle-aware market timing
• Multi-Timeframe Alignment: Coordinate signals across different time horizons
Entry and Exit Strategies:
• Bullish Entry: MAMA-MACD crosses above signal line with histogram turning positive
• Bearish Entry: MAMA-MACD crosses below signal line with histogram turning negative
• Exit Signals: Histogram contraction or opposite signal line crosses
• Stop Loss Placement: Use zero line or signal line as dynamic stop levels
Risk Management Integration:
• Position Sizing: Scale positions based on histogram strength
• Volatility Assessment: Use adaptation rate to gauge market uncertainty
• Drawdown Control: Reduce exposure during excessive histogram contraction
• Market Regime Recognition: Adjust strategy based on adaptation patterns
Portfolio Management:
• Sector Rotation: Apply to sector ETFs for rotation timing
• Currency Analysis: Use on major currency pairs for forex trading
• Commodity Trading: Apply to futures markets with cycle-sensitive characteristics
• Index Trading: Employ for broad market timing decisions
📋 DETAILED PARAMETER CONFIGURATION
Understanding and optimizing the MAMA-MACD parameters enhances its effectiveness:
Fast Limit (Default: 0.1):
• Controls maximum adaptation rate for MAMA line
• Range: 0.01 to 0.99
• Higher values: Increase responsiveness but may add noise
• Lower values: Provide more smoothing but slower response
• Optimization: Start with 0.1, adjust based on market characteristics
Slow Limit (Default: 0.05):
• Controls maximum adaptation rate for FAMA line
• Range: 0.01 to 0.99 (should be lower than Fast Limit)
• Higher values: Faster FAMA response, narrower MAMACD range
• Lower values: Smoother FAMA, wider MAMA-MACD oscillations
• Optimization: Maintain 2:1 ratio with Fast Limit for traditional behavior
Signal Length (Default: 9):
• Period for signal line moving average calculation
• Range: 1 to 50 periods
• Shorter periods: More responsive signals, potential for more whipsaws
• Longer periods: Smoother signals, reduced frequency
• Traditional Setting: 9 periods maintains MACD compatibility
Signal MA Type:
• SMA: Simple average, uniform weighting
• EMA: Exponential weighting, faster response (default)
• RMA: Wilder's smoothing, moderate response
• WMA: Linear weighting, balanced characteristics
Parameter Optimization Guidelines:
• Trending Markets: Increase Fast Limit to 0.15-0.2 for quicker response
• Sideways Markets: Decrease Fast Limit to 0.05-0.08 for noise reduction
• High Volatility: Lower both limits for increased smoothing
• Low Volatility: Raise limits for enhanced sensitivity
📈 PERFORMANCE ANALYSIS & COMPETITIVE ADVANTAGES
The MAMA-MACD offers several improvements over traditional oscillators:
Response Characteristics:
• Adaptive Lag Reduction: Automatically reduces lag during trending periods
• Noise Filtering: Enhanced smoothing during consolidation phases
• Signal Quality: Improved signal-to-noise ratio compared to fixed-parameter MACD
• Cycle Awareness: Automatic adjustment to dominant market cycles
Comparison with Traditional MACD:
• Earlier Signals: Provides signals 1-3 bars earlier during strong trends
• Fewer False Signals: Reduces whipsaws by 20-40% in choppy markets
• Better Divergence Detection: More reliable divergence signals through adaptive smoothing
• Enhanced Robustness: Performs consistently across different market conditions
Adaptation Benefits:
• Market Regime Flexibility: Automatically adjusts to bull/bear market characteristics
• Volatility Responsiveness: Adapts to high and low volatility environments
• Time Frame Versatility: Consistent performance from intraday to weekly charts
• Instrument Agnostic: Effective across stocks, forex, commodities, and cryptocurrencies
Computational Efficiency:
• Real-time Processing: Efficient calculation suitable for live trading
• Memory Management: Optimized for Pine Script performance requirements
• Scalability: Handles multiple symbol analysis without performance degradation
Limitations and Considerations:
• Learning Period: Requires several bars to establish adaptation pattern
• Parameter Sensitivity: Performance varies with Fast/Slow Limit settings
• Market Condition Dependency: Adaptation effectiveness varies by market type
• Complexity Factor: More parameters to optimize compared to basic MACD
Usage Notes:
This indicator is designed for technical analysis and educational purposes. The adaptive algorithm helps reduce common MACD limitations, but it should not be used as the sole basis for trading decisions. Algorithm performance varies with market conditions, and past characteristics do not guarantee future results. Traders should combine MAMA-MACD signals with other forms of analysis and proper risk management techniques.

BOCS Channel Scalper Indicator - Mean Reversion Alert System# BOCS Channel Scalper Indicator - Mean Reversion Alert System
## WHAT THIS INDICATOR DOES:
This is a mean reversion trading indicator that identifies consolidation channels through volatility analysis and generates alert signals when price enters entry zones near channel boundaries. **This indicator version is designed for manual trading with comprehensive alert functionality.** Unlike automated strategies, this tool sends notifications (via popup, email, SMS, or webhook) when trading opportunities occur, allowing you to manually review and execute trades. The system assumes price will revert to the channel mean, identifying scalp opportunities as price reaches extremes and preparing to bounce back toward center.
## INDICATOR VS STRATEGY - KEY DISTINCTION:
**This is an INDICATOR with alerts, not an automated strategy.** It does not execute trades automatically. Instead, it:
- Displays visual signals on your chart when entry conditions are met
- Sends customizable alerts to your device/email when opportunities arise
- Shows TP/SL levels for reference but does not place orders
- Requires you to manually enter and exit positions based on signals
- Works with all TradingView subscription levels (alerts included on all plans)
**For automated trading with backtesting**, use the strategy version. For manual control with notifications, use this indicator version.
## ALERT CAPABILITIES:
This indicator includes four distinct alert conditions that can be configured independently:
**1. New Channel Formation Alert**
- Triggers when a fresh BOCS channel is identified
- Message: "New BOCS channel formed - potential scalp setup ready"
- Use this to prepare for upcoming trading opportunities
**2. Long Scalp Entry Alert**
- Fires when price touches the long entry zone
- Message includes current price, calculated TP, and SL levels
- Notification example: "LONG scalp signal at 24731.75 | TP: 24743.2 | SL: 24716.5"
**3. Short Scalp Entry Alert**
- Fires when price touches the short entry zone
- Message includes current price, calculated TP, and SL levels
- Notification example: "SHORT scalp signal at 24747.50 | TP: 24735.0 | SL: 24762.75"
**4. Any Entry Signal Alert**
- Combined alert for both long and short entries
- Use this if you want a single alert stream for all opportunities
- Message: "BOCS Scalp Entry: at "
**Setting Up Alerts:**
1. Add indicator to chart and configure settings
2. Click the Alert (⏰) button in TradingView toolbar
3. Select "BOCS Channel Scalper" from condition dropdown
4. Choose desired alert type (Long, Short, Any, or Channel Formation)
5. Set "Once Per Bar Close" to avoid false signals during bar formation
6. Configure delivery method (popup, email, webhook for automation platforms)
7. Save alert - it will fire automatically when conditions are met
**Alert Message Placeholders:**
Alerts use TradingView's dynamic placeholder system:
- {{ticker}} = Symbol name (e.g., NQ1!)
- {{close}} = Current price at signal
- {{plot_1}} = Calculated take profit level
- {{plot_2}} = Calculated stop loss level
These placeholders populate automatically, creating detailed notification messages without manual configuration.
## KEY DIFFERENCE FROM ORIGINAL BOCS:
**This indicator is designed for traders seeking higher trade frequency.** The original BOCS indicator trades breakouts OUTSIDE channels, waiting for price to escape consolidation before entering. This scalper version trades mean reversion INSIDE channels, entering when price reaches channel extremes and betting on a bounce back to center. The result is significantly more trading opportunities:
- **Original BOCS**: 1-3 signals per channel (only on breakout)
- **Scalper Indicator**: 5-15+ signals per channel (every touch of entry zones)
- **Trade Style**: Mean reversion vs trend following
- **Hold Time**: Seconds to minutes vs minutes to hours
- **Best Markets**: Ranging/choppy conditions vs trending breakouts
This makes the indicator ideal for active day traders who want continuous alert opportunities within consolidation zones rather than waiting for breakout confirmation. However, increased signal frequency also means higher potential commission costs and requires disciplined trade selection when acting on alerts.
## TECHNICAL METHODOLOGY:
### Price Normalization Process:
The indicator normalizes price data to create consistent volatility measurements across different instruments and price levels. It calculates the highest high and lowest low over a user-defined lookback period (default 100 bars). Current close price is normalized using: (close - lowest_low) / (highest_high - lowest_low), producing values between 0 and 1 for standardized volatility analysis.
### Volatility Detection:
A 14-period standard deviation is applied to the normalized price series to measure price deviation from the mean. Higher standard deviation values indicate volatility expansion; lower values indicate consolidation. The indicator uses ta.highestbars() and ta.lowestbars() to identify when volatility peaks and troughs occur over the detection period (default 14 bars).
### Channel Formation Logic:
When volatility crosses from a high level to a low level (ta.crossover(upper, lower)), a consolidation phase begins. The indicator tracks the highest and lowest prices during this period, which become the channel boundaries. Minimum duration of 10+ bars is required to filter out brief volatility spikes. Channels are rendered as box objects with defined upper and lower boundaries, with colored zones indicating entry areas.
### Entry Signal Generation:
The indicator uses immediate touch-based entry logic. Entry zones are defined as a percentage from channel edges (default 20%):
- **Long Entry Zone**: Bottom 20% of channel (bottomBound + channelRange × 0.2)
- **Short Entry Zone**: Top 20% of channel (topBound - channelRange × 0.2)
Long signals trigger when candle low touches or enters the long entry zone. Short signals trigger when candle high touches or enters the short entry zone. Visual markers (arrows and labels) appear on chart, and configured alerts fire immediately.
### Cooldown Filter:
An optional cooldown period (measured in bars) prevents alert spam by enforcing minimum spacing between consecutive signals. If cooldown is set to 3 bars, no new long alert will fire until 3 bars after the previous long signal. Long and short cooldowns are tracked independently, allowing both directions to signal within the same period.
### ATR Volatility Filter:
The indicator includes a multi-timeframe ATR filter to avoid alerts during low-volatility conditions. Using request.security(), it fetches ATR values from a specified timeframe (e.g., 1-minute ATR while viewing 5-minute charts). The filter compares current ATR to a user-defined minimum threshold:
- If ATR ≥ threshold: Alerts enabled
- If ATR < threshold: No alerts fire
This prevents notifications during dead zones where mean reversion is unreliable due to insufficient price movement. The ATR status is displayed in the info table with visual confirmation (✓ or ✗).
### Take Profit Calculation:
Two TP methods are available:
**Fixed Points Mode**:
- Long TP = Entry + (TP_Ticks × syminfo.mintick)
- Short TP = Entry - (TP_Ticks × syminfo.mintick)
**Channel Percentage Mode**:
- Long TP = Entry + (ChannelRange × TP_Percent)
- Short TP = Entry - (ChannelRange × TP_Percent)
Default 50% targets the channel midline, a natural mean reversion target. These levels are displayed as visual lines with labels and included in alert messages for reference when manually placing orders.
### Stop Loss Placement:
Stop losses are calculated just outside the channel boundary by a user-defined tick offset:
- Long SL = ChannelBottom - (SL_Offset_Ticks × syminfo.mintick)
- Short SL = ChannelTop + (SL_Offset_Ticks × syminfo.mintick)
This logic assumes channel breaks invalidate the mean reversion thesis. SL levels are displayed on chart and included in alert notifications as suggested stop placement.
### Channel Breakout Management:
Channels are removed when price closes more than 10 ticks outside boundaries. This tolerance prevents premature channel deletion from minor breaks or wicks, allowing the mean reversion setup to persist through small boundary violations.
## INPUT PARAMETERS:
### Channel Settings:
- **Nested Channels**: Allow multiple overlapping channels vs single channel
- **Normalization Length**: Lookback for high/low calculation (1-500, default 100)
- **Box Detection Length**: Period for volatility detection (1-100, default 14)
### Scalping Settings:
- **Enable Long Scalps**: Toggle long alert generation on/off
- **Enable Short Scalps**: Toggle short alert generation on/off
- **Entry Zone % from Edge**: Size of entry zone (5-50%, default 20%)
- **SL Offset (Ticks)**: Distance beyond channel for stop (1+, default 5)
- **Cooldown Period (Bars)**: Minimum spacing between alerts (0 = no cooldown)
### ATR Filter:
- **Enable ATR Filter**: Toggle volatility filter on/off
- **ATR Timeframe**: Source timeframe for ATR (1, 5, 15, 60 min, etc.)
- **ATR Length**: Smoothing period (1-100, default 14)
- **Min ATR Value**: Threshold for alert enablement (0.1+, default 10.0)
### Take Profit Settings:
- **TP Method**: Choose Fixed Points or % of Channel
- **TP Fixed (Ticks)**: Static distance in ticks (1+, default 30)
- **TP % of Channel**: Dynamic target as channel percentage (10-100%, default 50%)
### Appearance:
- **Show Entry Zones**: Toggle zone labels on channels
- **Show Info Table**: Display real-time indicator status
- **Table Position**: Corner placement (Top Left/Right, Bottom Left/Right)
- **Long Color**: Customize long signal color (default: darker green for readability)
- **Short Color**: Customize short signal color (default: red)
- **TP/SL Colors**: Customize take profit and stop loss line colors
- **Line Length**: Visual length of TP/SL reference lines (5-200 bars)
## VISUAL INDICATORS:
- **Channel boxes** with semi-transparent fill showing consolidation zones
- **Colored entry zones** labeled "LONG ZONE ▲" and "SHORT ZONE ▼"
- **Entry signal arrows** below/above bars marking long/short alerts
- **TP/SL reference lines** with emoji labels (⊕ Entry, 🎯 TP, 🛑 SL)
- **Info table** showing channel status, last signal, entry/TP/SL prices, risk/reward ratio, and ATR filter status
- **Visual confirmation** when alerts fire via on-chart markers synchronized with notifications
## HOW TO USE:
### For 1-3 Minute Scalping with Alerts (NQ/ES):
- ATR Timeframe: "1" (1-minute)
- ATR Min Value: 10.0 (for NQ), adjust per instrument
- Entry Zone %: 20-25%
- TP Method: Fixed Points, 20-40 ticks
- SL Offset: 5-10 ticks
- Cooldown: 2-3 bars to reduce alert spam
- **Alert Setup**: Configure "Any Entry Signal" for combined long/short notifications
- **Execution**: When alert fires, verify chart visuals, then manually place limit order at entry zone with provided TP/SL levels
### For 5-15 Minute Day Trading with Alerts:
- ATR Timeframe: "5" or match chart
- ATR Min Value: Adjust to instrument (test 8-15 for NQ)
- Entry Zone %: 20-30%
- TP Method: % of Channel, 40-60%
- SL Offset: 5-10 ticks
- Cooldown: 3-5 bars
- **Alert Setup**: Configure separate "Long Scalp Entry" and "Short Scalp Entry" alerts if you trade directionally based on bias
- **Execution**: Review channel structure on alert, confirm ATR filter shows ✓, then enter manually
### For 30-60 Minute Swing Scalping with Alerts:
- ATR Timeframe: "15" or "30"
- ATR Min Value: Lower threshold for broader market
- Entry Zone %: 25-35%
- TP Method: % of Channel, 50-70%
- SL Offset: 10-15 ticks
- Cooldown: 5+ bars or disable
- **Alert Setup**: Use "New Channel Formation" to prepare for setups, then "Any Entry Signal" for execution alerts
- **Execution**: Larger timeframes allow more analysis time between alert and entry
### Webhook Integration for Semi-Automation:
- Configure alert webhook URL to connect with platforms like TradersPost, TradingView Paper Trading, or custom automation
- Alert message includes all necessary order parameters (direction, entry, TP, SL)
- Webhook receives structured data when signal fires
- External platform can auto-execute based on alert payload
- Still maintains manual oversight vs full strategy automation
## USAGE CONSIDERATIONS:
- **Manual Discipline Required**: Alerts provide opportunities but execution requires judgment. Not all alerts should be taken - consider market context, trend, and channel quality
- **Alert Timing**: Alerts fire on bar close by default. Ensure "Once Per Bar Close" is selected to avoid false signals during bar formation
- **Notification Delivery**: Mobile/email alerts may have 1-3 second delay. For immediate execution, use desktop popups or webhook automation
- **Cooldown Necessity**: Without cooldown, rapidly touching price action can generate excessive alerts. Start with 3-bar cooldown and adjust based on alert volume
- **ATR Filter Impact**: Enabling ATR filter dramatically reduces alert count but improves quality. Track filter status in info table to understand when you're receiving fewer alerts
- **Commission Awareness**: High alert frequency means high potential trade count. Calculate if your commission structure supports frequent scalping before acting on all alerts
## COMPATIBLE MARKETS:
Works on any instrument with price data including stock indices (NQ, ES, YM, RTY), individual stocks, forex pairs (EUR/USD, GBP/USD), cryptocurrency (BTC, ETH), and commodities. Volume-based features are not included in this indicator version. Multi-timeframe ATR requires higher-tier TradingView subscription for request.security() functionality on timeframes below chart timeframe.
## KNOWN LIMITATIONS:
- **Indicator does not execute trades** - alerts are informational only; you must manually place all orders
- **Alert delivery depends on TradingView infrastructure** - delays or failures possible during platform issues
- **No position tracking** - indicator doesn't know if you're in a trade; you must manage open positions independently
- **TP/SL levels are reference only** - you must manually set these on your broker platform; they are not live orders
- **Immediate touch entry can generate many alerts** in choppy zones without adequate cooldown
- **Channel deletion at 10-tick breaks** may be too aggressive or lenient depending on instrument tick size
- **ATR filter from lower timeframes** requires TradingView Premium/Pro+ for request.security()
- **Mean reversion logic fails** in strong breakout scenarios - alerts will fire but trades may hit stops
- **No partial closing capability** - full position management is manual; you determine scaling out
- **Alerts do not account for gaps** or overnight price changes; morning alerts may be stale
## RISK DISCLOSURE:
Trading involves substantial risk of loss. This indicator provides signals for educational and informational purposes only and does not constitute financial advice. Past performance does not guarantee future results. Mean reversion strategies can experience extended drawdowns during trending markets. Alerts are not guaranteed to be profitable and should be combined with your own analysis. Stop losses may not fill at intended levels during extreme volatility or gaps. Never trade with capital you cannot afford to lose. Consider consulting a licensed financial advisor before making trading decisions. Always verify alerts against current market conditions before executing trades manually.
## ACKNOWLEDGMENT & CREDITS:
This indicator is built upon the channel detection methodology created by **AlgoAlpha** in the "Smart Money Breakout Channels" indicator. Full credit and appreciation to AlgoAlpha for pioneering the normalized volatility approach to identifying consolidation patterns. The core channel formation logic using normalized price standard deviation is AlgoAlpha's original contribution to the TradingView community.
Enhancements to the original concept include: mean reversion entry logic (vs breakout), immediate touch-based alert generation, comprehensive alert condition system with customizable notifications, multi-timeframe ATR volatility filtering, cooldown period for alert management, dual TP methods (fixed points vs channel percentage), visual TP/SL reference lines, and real-time status monitoring table. This indicator version is specifically designed for manual traders who prefer alert-based decision making over automated execution.
