스크립트에서 "entry"에 대해 찾기

Amazing Crossover SystemEntry Rules
BUY when the 5 EMA crosses above the 10 EMA from underneath and the RSI crosses above the 50.0 mark from the bottom.
SELL when the 5 EMA crosses below the 10 EMA from the top and the RSI crosses below the 50.0 mark from the top.
Make sure that the RSI did cross 50.0 from the top or bottom and not just ranging tightly around the level.
How to setup Alert:
1) Add the Amazing Crossover System to your chart via Indicators
2) Find your currency pair
3) Set the timeframe on the chart to 1 hour
4) Press 'Alt + A' (create alert shortcut)
5) Set the following criteria for the alert:
Condition = 'Amazing Crossover System', Plot, ' BUY Signal'
The rest of the alert can be customized to your preferences
5) Repeat steps 1 - 4, but set the Condition = 'Amazing Crossover System', Plot, ' SELL Signal'

Guru Dronacharya Option Pair Intelligence SystemGuru Dronacharya – Option Pair Intelligence System
________________________________________
🔹 Overview
Guru Dronacharya is an advanced intraday options trading indicator designed for index and stock options.
It intelligently analyses CALL–PUT option pairs, identifies premium compression zones, tracks institutional price interaction, and generates high-probability Buy Call / Buy Put signals with pre-defined option targets.
The system combines:
• Option pair behavior
• Volatility expansion
• Hedge & re-entry detection
⚠️ This indicator is only for options trading, not for spot or futures.
________________________________________
🔹 How to Use (Step-by-Step)
Step 1: Select Underlying & Spot Price
• Choose the Index / Stock from the dropdown.
• Enter the spot price using the first 5-minute candle close.
• Price must be rounded according to strike interval (e.g. 26000 / 26050 / 26100).
________________________________________
Step 2: Select Expiry
• Select expiry day, month, and year.
• The script automatically builds option symbols internally.
________________________________________
Step 3: Identify Best CE–PE Pair
• A CE vs PE interaction table appears at the top.
• Cells marked with ✓✓ indicate strong price overlap / compression.
• The script automatically highlights the lowest premium matched pair.
• Use that CALL & PUT in the symbol selector below.
________________________________________
Step 4: Observe Candle & Volatility Behavior
• CALL and PUT candles plot together in the same pane.
• Candle colors change based on volatility expansion (BBW).
• EMA (optional) helps confirm trend direction.
________________________________________
Step 5: Trade Signals
🔵 Buy Call Signal
Triggered when:
• CALL price breaks above PUT resistance
• Previous candle confirms breakout
• Option structure supports bullish dominance
🔴 Buy Put Signal
Triggered when:
• PUT price breaks above CALL resistance
• Previous candle confirms breakout
• Option structure supports bearish dominance
Each signal plots:
• Entry label
• Momentum hint
• Multiple projected targets
________________________________________
Step 6: Target & Hedge Management
• Targets auto-draw using option-specific Fibonacci expansion
• Hedge signal appears when price revisits risk zones
• Helps in re-entry or risk neutralization
________________________________________
🔹 Key Features (Specific Review)
✅ Option Pair Intelligence
• CE–PE overlap detection
• Premium compression identification
• Lowest price matched pair auto-selection
________________________________________
✅ Volatility-Aware Entries
• Bollinger Band Width expansion filter
• Prevents low-energy fake breakouts
• Adaptive candle coloring
________________________________________
✅ Structured Buy Signals
• Buy Call / Buy Put based on option dominance
• Multi-set tracking (up to 4 per day)
• Each set independently monitored
• Targets auto-extend only for active trades
________________________________________
✅ Hedge & Re-Entry Logic
• Detects retracement near option zones
• Ideal for straddle / strangle traders
________________________________________
✅ Fully Configurable
• Auto / manual strike factor
• Optional EMA filter
________________________________________
🔹 Best Suited For
✔ Intraday Index Option Traders
✔ Option Scalpers
✔ Hedge & Straddle Traders
✔ Experienced Price Action Traders
________________________________________
⚠️ Disclaimer
This indicator is a decision-support tool, not financial advice.
Options trading involves substantial risk. Always trade with proper risk management.
This indicator is for educational and analytical purposes only.
The author is not responsible for any financial losses.
Please consult a licensed financial advisor before trading.

ema200 filler═══════════════════════════════════════════════════════════════
TRADINGVIEW INDICATOR DESCRIPTION
═══════════════════════════════════════════════════════════════
TITLE: EMA 200 Filler - Visual Trend Indicator
SHORT DESCRIPTION:
Instantly see trend direction with color-coded shading between price and the 200 EMA. Green above = bullish, Red below = bearish.
═══════════════════════════════════════════════════════════════
MAIN DESCRIPTION
═══════════════════════════════════════════════════════════════
🎨 SEE THE TREND AT A GLANCE
This elegant indicator fills the space between price and the 200-period Exponential Moving Average (EMA) with color-coded shading, making trend direction instantly obvious without any analysis required.
✨ KEY FEATURES:
• Visual Trend Clarity - Green fill = bullish zone, Red fill = bearish zone
• EMA 200 Line - The institutional trader's favorite trend indicator
• Dynamic Shading - Fill automatically adjusts as price moves
• Clean Design - Semi-transparent fills won't clutter your chart
• Zero Configuration - Works perfectly right out of the box
• Universal Application - Works on any timeframe, any asset
📊 WHAT YOU SEE:
🟢 GREEN SHADED AREA
→ Price is ABOVE the 200 EMA
→ Bullish trend in effect
→ Look for LONG opportunities
🔴 RED SHADED AREA
→ Price is BELOW the 200 EMA
→ Bearish trend in effect
→ Look for SHORT opportunities
🔵 BLUE LINE = 200 EMA
→ The dividing line between bull and bear zones
→ Major support/resistance level
→ Institutional trend filter
💡 WHY THE 200 EMA MATTERS:
The 200-period EMA is one of the most widely watched technical indicators by:
✓ Institutional traders and hedge funds
✓ Day traders and swing traders
✓ Algorithmic trading systems
✓ Technical analysis professionals
When millions of traders watch the same level, it becomes a self-fulfilling prophecy - making it incredibly powerful for entries, exits, and stop placement.
🎯 TRADING APPLICATIONS:
✓ **Trend Filter** - Only take longs in green, shorts in red
✓ **Trend Confirmation** - Strong trends stay on one side for extended periods
✓ **Reversal Signals** - Watch for crossovers when price crosses the 200 EMA
✓ **Support/Resistance** - 200 EMA acts as dynamic support in uptrends, resistance in downtrends
✓ **Stay Out Zones** - Avoid trading when price chops around the 200 EMA (mixed colors)
📈 PERFECT FOR:
✓ Swing traders who need clear trend direction
✓ Day traders using the 200 EMA as a filter
✓ Beginners who want simple trend identification
✓ Multi-timeframe analysis (check higher timeframe trend)
✓ Anyone who wants cleaner charts with instant trend clarity
⚙️ WORKS WITH:
• All asset classes (stocks, forex, crypto, commodities, indices)
• All timeframes (1-minute to monthly charts)
• Combines perfectly with other indicators
• No special settings required - just add and trade
🌟 CLEAN & PROFESSIONAL:
• Semi-transparent fills (70% opacity) - won't hide candles or other indicators
• White price line for clear visibility
• Blue EMA line - industry standard color
• Minimalist design philosophy
🚀 INSTANT SETUP:
1. Add indicator to chart
2. Start trading with the trend
3. That's it - no configuration needed!
The simplest way to visualize trend direction. When you see green, think bullish. When you see red, think bearish. Trading doesn't get more straightforward than this.
═══════════════════════════════════════════════════════════════
CATEGORIES:
• Trend Analysis
• Moving Averages
• Overlays
TAGS:
ema, ema 200, moving average, trend indicator, trend filter, visual indicator, exponential moving average, 200 ema, trend following, color coded, bullish bearish
═══════════════════════════════════════════════════════════════
QUICK START GUIDE
═══════════════════════════════════════════════════════════════
🚀 QUICK START - EMA 200 Filler
──────────────────────────────────────────────────────────────
STEP 1: ADD TO CHART
──────────────────────────────────────────────────────────────
1. Open TradingView
2. Load any chart (stocks, forex, crypto - anything!)
3. Click "Indicators" button at top
4. Search: "EMA 200 Filler"
5. Click to add
You're done! No settings to adjust.
──────────────────────────────────────────────────────────────
STEP 2: UNDERSTAND THE COLORS
──────────────────────────────────────────────────────────────
The indicator fills the space between PRICE and the 200 EMA:
🟢 GREEN FILL = BULLISH ZONE
• Price is above the 200 EMA
• Uptrend is active
• Bias: Look for LONG entries only
🔴 RED FILL = BEARISH ZONE
• Price is below the 200 EMA
• Downtrend is active
• Bias: Look for SHORT entries only
🔵 BLUE LINE = 200 EMA
• The trend dividing line
• Acts as support in uptrends
• Acts as resistance in downtrends
──────────────────────────────────────────────────────────────
STEP 3: BASIC TRADING RULES
──────────────────────────────────────────────────────────────
📈 RULE #1: TRADE WITH THE COLOR
In GREEN zone:
→ Only look for LONG setups
→ Buy dips toward the 200 EMA
→ Avoid shorting against the trend
In RED zone:
→ Only look for SHORT setups
→ Sell rallies toward the 200 EMA
→ Avoid longing against the trend
──────────────────────────────────────────────────────────────
🎯 RULE #2: USE THE 200 EMA AS SUPPORT/RESISTANCE
In GREEN (uptrend):
→ 200 EMA acts as SUPPORT
→ Price bouncing off 200 EMA = buy opportunity
→ Price breaking BELOW 200 EMA = trend change warning
In RED (downtrend):
→ 200 EMA acts as RESISTANCE
→ Price rejecting at 200 EMA = sell opportunity
→ Price breaking ABOVE 200 EMA = trend change warning
──────────────────────────────────────────────────────────────
⚠️ RULE #3: AVOID THE CHOP ZONE
When price keeps crossing the 200 EMA (color changing frequently):
→ Market is RANGING, not trending
→ Stay out or reduce position size
→ Wait for a clear trend to establish
──────────────────────────────────────────────────────────────
STEP 4: TRADING STRATEGIES
──────────────────────────────────────────────────────────────
✅ STRATEGY #1: TREND FOLLOWING (PULLBACK ENTRIES)
Wait for GREEN zone (bullish trend):
1. Price pulls back toward the 200 EMA (blue line)
2. Look for bullish reversal candle near 200 EMA
3. Enter LONG
4. Stop below 200 EMA
5. Hold while in green zone
Example:
• Chart shows green shading
• Price dips to 200 EMA and bounces
• Enter long at bounce confirmation
• Stop 5-10 pips below 200 EMA
• Exit when price crosses back below 200 EMA (turns red)
──────────────────────────────────────────────────────────────
✅ STRATEGY #2: BREAKOUT TRADING (TREND CHANGE)
Watch for color change (crossover):
GREEN → RED (bearish reversal):
1. Price crosses below 200 EMA
2. Fill turns from green to red
3. Enter SHORT on next pullback to 200 EMA
4. Stop above 200 EMA
5. Ride the new downtrend
RED → GREEN (bullish reversal):
1. Price crosses above 200 EMA
2. Fill turns from red to green
3. Enter LONG on next pullback to 200 EMA
4. Stop below 200 EMA
5. Ride the new uptrend
──────────────────────────────────────────────────────────────
✅ STRATEGY #3: HIGHER TIMEFRAME FILTER
Use this indicator on a HIGHER timeframe as a filter:
Example for day trading:
• Add indicator to DAILY chart
• Check the color: Green or Red?
• Switch back to your trading timeframe (5m, 15m, etc.)
• Only take trades in the direction of daily trend
If daily = GREEN → Only take longs on lower timeframes
If daily = RED → Only take shorts on lower timeframes
This keeps you aligned with the bigger trend!
──────────────────────────────────────────────────────────────
STEP 5: REAL TRADING EXAMPLES
──────────────────────────────────────────────────────────────
📊 EXAMPLE #1: LONG ENTRY IN UPTREND
Chart: SPY on 1-hour timeframe
Indicator: Green fill (price above 200 EMA)
Setup:
• Price at 450, 200 EMA at 445
• Green shading shows bullish trend
• Price pulls back to 446 (near 200 EMA)
• Bullish hammer candle forms at 200 EMA
Trade:
→ Enter LONG at 446.50
→ Stop at 444.50 (below 200 EMA)
→ Target: Previous high at 452
→ Risk: 2 points | Reward: 5.50 points = 2.75:1 R/R
──────────────────────────────────────────────────────────────
📊 EXAMPLE #2: SHORT ENTRY IN DOWNTREND
Chart: EUR/USD on 4-hour timeframe
Indicator: Red fill (price below 200 EMA)
Setup:
• Price at 1.0850, 200 EMA at 1.0900
• Red shading shows bearish trend
• Price rallies to 1.0895 (near 200 EMA)
• Bearish rejection candle at 200 EMA
Trade:
→ Enter SHORT at 1.0890
→ Stop at 1.0910 (above 200 EMA)
→ Target: 1.0820 (recent support)
→ Risk: 20 pips | Reward: 70 pips = 3.5:1 R/R
──────────────────────────────────────────────────────────────
📊 EXAMPLE #3: AVOID THE CHOP
Chart: Bitcoin on 15-minute timeframe
Indicator: Color keeps changing (green/red/green/red)
Observation:
• Price crossed 200 EMA 4 times in 2 hours
• No clear trend established
• Whipsaw action
Action:
→ STAY OUT - wait for clear trend
→ Check higher timeframe for direction
→ Come back when one color dominates
──────────────────────────────────────────────────────────────
STEP 6: PRO TIPS
──────────────────────────────────────────────────────────────
💡 **Combine with Price Action**
Don't just enter because it's green - wait for bullish candle patterns (hammer, engulfing, etc.) at the 200 EMA for high-probability setups.
💡 **Respect the 200 EMA**
The longer price stays on one side, the stronger that side becomes. A stock green for months has strong bullish momentum.
💡 **Watch Volume at Crossovers**
When price crosses the 200 EMA with HIGH volume = strong signal
Low volume crossover = might be false breakout
💡 **Use Multiple Timeframes**
• Daily chart = overall trend direction
• 4H chart = swing trade setups
• 1H chart = day trade entries
Always align smaller timeframe trades with larger timeframe color!
💡 **Strongest Setups = Clean Trends**
Best trades happen when:
• Chart stays ONE color for extended period
• Price respects 200 EMA as support/resistance
• No frequent crossovers
──────────────────────────────────────────────────────────────
COMMON QUESTIONS
──────────────────────────────────────────────────────────────
❓ "What if price crosses the 200 EMA frequently?"
→ That's a ranging market. Stay out or trade smaller size. Wait for a clear trend.
❓ "Can I change the colors?"
→ Not in this version, but green/red is universal and intuitive.
❓ "Does this work on all timeframes?"
→ Yes! But longer timeframes (4H, Daily) tend to give cleaner signals.
❓ "Should I always use the 200 EMA?"
→ The 200 is the institutional standard. Stick with it for consistency.
❓ "What about the 50 or 20 EMA?"
→ You can add those separately. This indicator focuses on the proven 200 EMA.
──────────────────────────────────────────────────────────────
THE GOLDEN RULE
──────────────────────────────────────────────────────────────
🟢 GREEN = GO LONG (or stay long)
🔴 RED = GO SHORT (or stay short)
🔄 FREQUENT CHANGES = STAY OUT
It's that simple. The trend is your friend - this indicator just makes it impossible to miss!
──────────────────────────────────────────────────────────────
Happy Trading! 📈
──────────────────────────────────────────────────────────────

Wyckoff Dual WaveBased on the Wyckoff Method this indicator identifies small and large wave structures and generates trend following signals. It uses dual moving averages Small Wave MA and Large Wave MA to analyze wave cycles combined with volume confirmation KD stochastic and double top and bottom patterns for entry and exit signals.
Key featuresDual wave analysis for small and large timeframes. Customizable MA periods and trend confirmation rules including 3 Day Breakaway and Close Confirmation. Volume based signal validation and KD oscillator filters. Visual wave lines trend colors and clear buy and sell labels such as Long Short DBOT DTOP V BUY and V SELL.
Adjust MA periods PCT factors and signal toggles to fit different assets and timeframes. Ideal for Wyckoff focused traders seeking structured wave and trend analysis. Note For optimal use combine with price action and market context.
No suitable analytical tools for Wyckoff waves have been found so far, and most of the indicator’s concepts are derived from Wyckoff’s book The Tape Reading and Market Tactics.
The traditional Wyckoff Theory focuses on wave analysis and daily timeframe analysis, with waves based on percentage changes. This indicator is mainly designed for intraday trading. I developed it on 15-second charts, and it can also be applied to 1-minute, 3-minute, 5-minute and other short timeframes. For Wyckoff wave analysis on the daily timeframe, I will specifically develop a dedicated percentage-based daily Wyckoff wave tool in the future.
Wyckoff waves emphasize dynamic analysis. It is recommended to use this indicator together with support and resistance tools for dynamic analysis. Observe the price behavior when it touches support or resistance levels to decide the next trading move.

FibLevel Size CalculatorThis skript calculates position sizes and new take profits for sizing into an long or short position with 3 entrys defined at custom fibonacci retracement levels.
TP: -0,272
Entry1: 0.382
Entry2: 0.618
Entry3: 0.83
SL: 1.05
Expected RR per trade is 0.2 with a High Win rate definitly profitable.
Search for an established trend on the higher timeframe, drop to the smaller ones and look for correction waves. Once they break to the trenddirection of the higher timeframe take the fib from lowest to highes point. Draw a fib level on the chart and use the Indicator to define these Levels above. The calculator gives you the Margin to use in each position, and will check that you will not get liquidated an that you have enough margin. It tells you the new TP for Limit2 and Limit3 if they get hit so you can get out of the trade full TP with a small bounce.
Inputs:
Account Balance, Risk Percentage, and Leverage: These inputs are used to calculate the position size and risk.
Entry 1, Entry 2, Entry 3, Take Profit (TP), and Stop Loss (SL): These prices are used for calculating position sizes, risk, and profit for up to three entry points.
Calculations:
Risk Amount: Calculated based on the account balance and risk percentage.
Position Sizes (Qty): For each entry point, the position size is determined. The second and third entries have a multiplier (3x for Entry 2, 5x for Entry 3) compared to the first.
Stop Loss and Profit Calculation: The script calculates the potential profit and adjusts the TP levels based on the average entries for Limit 2 and Limit 3.
Margin Calculation: Margin requirements for each position are calculated based on leverage.
Output:
Table Display: A table shows key values like entry prices, position sizes, TP levels, potential profit, and margin requirements for each limit.
Warnings: It includes a liquidation warning and a check for whether the account is at risk of liquidation based on leverage.
Position Type: It automatically detects if the trade is a long or short based on the relationship between TP and SL.
Visualization:
Lines: It draws horizontal lines on the chart to visually represent the entry, TP, and SL levels.
Overall, this script is designed to help traders manage risk and calculate position sizes for multi-level entries using leverage.
Pls drop feedback in the comments.

Nef33 Forex & Crypto Trading Signals PRO
1. Understanding the Indicator's Context
The indicator generates signals based on confluence (trend, volume, key zones, etc.), but it does not include predefined SL or TP levels. To establish them, we must:
Use dynamic or static support/resistance levels already present in the script.
Incorporate volatility (such as ATR) to adjust the levels based on market conditions.
Define a risk/reward ratio (e.g., 1:2).
2. Options for Determining SL and TP
Below, I provide several ideas based on the tools available in the script:
Stop Loss (SL)
The SL should protect you from adverse movements. You can base it on:
ATR (Volatility): Use the smoothed ATR (atr_smooth) multiplied by a factor (e.g., 1.5 or 2) to set a dynamic SL.
Buy: SL = Entry Price - (atr_smooth * atr_mult).
Sell: SL = Entry Price + (atr_smooth * atr_mult).
Key Zones: Place the SL below a support (for buys) or above a resistance (for sells), using Order Blocks, Fair Value Gaps, or Liquidity Zones.
Buy: SL below the nearest ob_lows or fvg_lows.
Sell: SL above the nearest ob_highs or fvg_highs.
VWAP: Use the daily VWAP (vwap_day) as a critical level.
Buy: SL below vwap_day.
Sell: SL above vwap_day.
Take Profit (TP)
The TP should maximize profits. You can base it on:
Risk/Reward Ratio: Multiply the SL distance by a factor (e.g., 2 or 3).
Buy: TP = Entry Price + (SL Distance * 2).
Sell: TP = Entry Price - (SL Distance * 2).
Key Zones: Target the next resistance (for buys) or support (for sells).
Buy: TP at the next ob_highs, fvg_highs, or liq_zone_high.
Sell: TP at the next ob_lows, fvg_lows, or liq_zone_low.
Ichimoku: Use the cloud levels (Senkou Span A/B) as targets.
Buy: TP at senkou_span_a or senkou_span_b (whichever is higher).
Sell: TP at senkou_span_a or senkou_span_b (whichever is lower).
3. Practical Implementation
Since the script does not automatically draw SL/TP, you can:
Calculate them manually: Observe the chart and use the levels mentioned.
Modify the code: Add SL/TP as labels (label.new) at the moment of the signal.
Here’s an example of how to modify the code to display SL and TP based on ATR with a 1:2 risk/reward ratio:
Modified Code (Signals Section)
Find the lines where the signals (trade_buy and trade_sell) are generated and add the following:
pinescript
// Calculate SL and TP based on ATR
atr_sl_mult = 1.5 // Multiplier for SL
atr_tp_mult = 3.0 // Multiplier for TP (1:2 ratio)
sl_distance = atr_smooth * atr_sl_mult
tp_distance = atr_smooth * atr_tp_mult
if trade_buy
entry_price = close
sl_price = entry_price - sl_distance
tp_price = entry_price + tp_distance
label.new(bar_index, low, "Buy: " + str.tostring(math.round(bull_conditions, 1)), color=color.green, textcolor=color.white, style=label.style_label_up, size=size.tiny)
label.new(bar_index, sl_price, "SL: " + str.tostring(math.round(sl_price, 2)), color=color.red, textcolor=color.white, style=label.style_label_down, size=size.tiny)
label.new(bar_index, tp_price, "TP: " + str.tostring(math.round(tp_price, 2)), color=color.blue, textcolor=color.white, style=label.style_label_up, size=size.tiny)
if trade_sell
entry_price = close
sl_price = entry_price + sl_distance
tp_price = entry_price - tp_distance
label.new(bar_index, high, "Sell: " + str.tostring(math.round(bear_conditions, 1)), color=color.red, textcolor=color.white, style=label.style_label_down, size=size.tiny)
label.new(bar_index, sl_price, "SL: " + str.tostring(math.round(sl_price, 2)), color=color.red, textcolor=color.white, style=label.style_label_up, size=size.tiny)
label.new(bar_index, tp_price, "TP: " + str.tostring(math.round(tp_price, 2)), color=color.blue, textcolor=color.white, style=label.style_label_down, size=size.tiny)
Code Explanation
SL: Calculated by subtracting/adding sl_distance to the entry price (close) depending on whether it’s a buy or sell.
TP: Calculated with a double distance (tp_distance) for a 1:2 risk/reward ratio.
Visualization: Labels are added to the chart to display SL (red) and TP (blue).
4. Practical Strategy Without Modifying the Code
If you don’t want to modify the script, follow these steps manually:
Entry: Take the trade_buy or trade_sell signal.
SL: Check the smoothed ATR (atr_smooth) on the chart or calculate a fixed level (e.g., 1.5 times the ATR). Also, review nearby key zones (OB, FVG, VWAP).
TP: Define a target based on the next key zone or multiply the SL distance by 2 or 3.
Example:
Buy at 100, ATR = 2.
SL = 100 - (2 * 1.5) = 97.
TP = 100 + (2 * 3) = 106.
5. Recommendations
Test in Demo: Apply this logic in a demo account to adjust the multipliers (atr_sl_mult, atr_tp_mult) based on the market (forex or crypto).
Combine with Zones: If the ATR-based SL is too wide, use the nearest OB or FVG as a reference.
Risk/Reward Ratio: Adjust the TP based on your tolerance (1:1, 1:2, 1:3)

Risk & Position DashboardRisk & Position Dashboard
Overview
The Risk & Position Dashboard is a comprehensive trading tool designed to help traders calculate optimal position sizes, manage risk, and visualize potential profit/loss scenarios before entering trades. This indicator provides real-time calculations for position sizing based on account size, risk percentage, and stop-loss levels, while displaying multiple take-profit targets with customizable risk-reward ratios.
Key Features
Position Sizing & Risk Management:
Automatic position size calculation based on account size and risk percentage
Support for leveraged trading with maximum leverage limits
Fractional shares support for brokers that allow partial share trading
Real-time fee calculation including entry, stop-loss, and take-profit fees
Break-even price calculation including trading fees
Multi-Target Profit Management:
Support for up to 3 take-profit levels with individual portion allocations
Customizable risk-reward ratios for each take-profit target
Visual profit/loss zones displayed as colored boxes on the chart
Individual profit calculations for each take-profit level
Visual Dashboard:
Clean, customizable table display showing all key metrics
Configurable label positioning and styling options
Real-time tracking of whether stop-loss or take-profit levels have been reached
Color-coded visual zones for easy identification of risk and reward areas
Advanced Configuration:
Comprehensive input validation and error handling
Support for different chart timeframes and symbols
Customizable colors, fonts, and display options
Hide/show individual data fields for personalized dashboard views
How to Use
Set Account Parameters: Configure your account size, maximum risk percentage per trade, and trading fees in the "Account Settings" section.
Define Trade Setup: Use the "Entry" time picker to select your entry point on the chart, then input your entry price and stop-loss level.
Configure Take Profits: Set your desired risk-reward ratios and portion allocations for each take-profit level. The script supports 1-3 take-profit targets.
Analyze Results: The dashboard will automatically calculate and display position size, number of shares, potential profits/losses, fees, and break-even levels.
Visual Confirmation: Colored boxes on the chart show profit zones (green) and loss zones (red), with lines extending to current price levels.
Reset Entry and SL:
You can easily reset the entry and stop-loss by clicking the "Reset points..." button from the script's "More" menu.
This is useful if you want to quickly clear your current trade setup and start fresh without manually adjusting the points on the chart.
Calculations
The script performs sophisticated calculations including:
Position size based on risk amount and price difference between entry and stop-loss
Leverage requirements and position amount calculations
Fee-adjusted risk-reward ratios for realistic profit expectations
Break-even price including all trading costs
Individual profit calculations for partial position closures
Detailed Take-Profit Calculation Formula:
The take-profit prices are calculated using the following mathematical formula:
// Core variables:
// risk_amount = account_size * (risk_percentage / 100)
// total_risk_per_share = |entry_price - sl_price| + (entry_price * fee%) + (sl_price * fee%)
// shares = risk_amount / total_risk_per_share
// direction_factor = 1 for long positions, -1 for short positions
// Take-profit calculation:
net_win = total_risk_per_share * shares * RR_ratio
tp_price = (net_win + (direction_factor * entry_price * shares) + (entry_price * fee% * shares)) / (direction_factor * shares - fee% * shares)
Step-by-step example for a long position (based on screenshot):
Account Size: 2,000 USDT, Risk: 2% = 40 USDT
Entry: 102,062.9 USDT, Stop Loss: 102,178.4 USDT, Fee: 0.06%
Risk per share: |102,062.9 - 102,178.4| + (102,062.9 × 0.0006) + (102,178.4 × 0.0006) = 115.5 + 61.24 + 61.31 = 238.05 USDT
Shares: 40 ÷ 238.05 = 0.168 shares (rounded to 0.17 in display)
Position Size: 0.17 × 102,062.9 = 17,350.69 USDT
Position Amount (with 9x leverage): 17,350.69 ÷ 9 = 1,927.85 USDT
For 2:1 RR: Net win = 238.05 × 0.17 × 2 = 80.94 USDT
TP1 price = (80.94 + (1 × 102,062.9 × 0.17) + (102,062.9 × 0.0006 × 0.17)) ÷ (1 × 0.17 - 0.0006 × 0.17) = 101,464.7 USDT
For 3:1 RR: TP2 price = 101,226.7 USDT (following same formula with RR=3)
This ensures that after accounting for all fees, the actual risk-reward ratio matches the specified target ratio.
Risk Management Features
Maximum Trade Amount: Optional setting to limit position size regardless of account size
Leverage Limits: Built-in maximum leverage protection
Fee Integration: All calculations include realistic trading fees for accurate expectations
Validation: Automatic checking that take-profit portions sum to 100%
Historical Tracking: Visual indication when stop-loss or take-profit levels are reached (within last 5000 bars)
Understanding Max Trade Amount - Multiple Simultaneous Trades:
The "Max Trade Amount" feature is designed for traders who want to open multiple positions simultaneously while maintaining proper risk management. Here's how it works:
Key Concept:
- Risk percentage (2%) always applies to your full Account Size
- Max Trade Amount limits the capital allocated per individual trade
- This allows multiple trades with full risk on each trade
Example from Screenshot:
Account Size: 2,000 USDT
Max Trade Amount: 500 USDT
Risk per Trade: 2% × 2,000 = 40 USDT per trade
Stop Loss Distance: 0.11% from entry
Result: Position Size = 17,350.69 USDT with 35x leverage
Total Risk (including fees): 40.46 USDT
Multiple Trades Strategy:
With this setup, you can open:
Trade 1: 40 USDT risk, 495.73 USDT position amount (35x leverage)
Trade 2: 40 USDT risk, 495.73 USDT position amount (35x leverage)
Trade 3: 40 USDT risk, 495.73 USDT position amount (35x leverage)
Trade 4: 40 USDT risk, 495.73 USDT position amount (35x leverage)
Total Portfolio Exposure:
- 4 simultaneous trades = 4 × 495.73 = 1,982.92 USDT position amount
- Total risk exposure = 4 × 40 = 160 USDT (8% of account)

PivotBoss VWAP Bands (Auto TF) - FixedWhat this indicator shows (high level)
The indicator plots a VWAP line and three bands above (R1, R2, R3) and three bands below (S1, S2, S3).
Band spacing is computed from STD(abs(VWAP − price), N) and multiplied by 1, 2 and 3 to form R1–R3 / S1–S3. The script is timeframe-aware: on 30m/1H charts it uses Weekly VWAP and weekly bands; on Daily charts it uses Monthly VWAP and monthly bands; otherwise it uses the session/chart VWAP.
VWAP = the market’s volume-weighted average price (a measure of fair value). Bands = volatility-scaled zones around that fair value.
Trading idea — concept summary
VWAP = fair value. Price above VWAP implies bullish bias; below VWAP implies bearish bias.
Bands = graded overbought/oversold zones. R1/S1 are near-term limits, R2/S2 are stronger, R3/S3 are extreme.
Use trend alignment + price action + volume to choose higher-probability trades. VWAP bands give location and magnitude; confirmations reduce false signals.
Entry rules (multiple strategies with examples)
A. Momentum breakout (trend-following) — preferred on trending markets
Setup: Price consolidates near or below R1 and then closes above R1 with above-average volume. Chart: 30m/1H (Weekly VWAP) or Daily (Monthly VWAP) depending on your timeframe.
Entry: Enter long at the close of the breakout bar that closes above R1.
Stop-loss: Place initial stop below the higher of (VWAP or recent swing low). Example: if price broke R1 at ₹1,200 and VWAP = ₹1,150, set stop at ₹1,145 (5 rupee buffer below VWAP) or below the last swing low if that is wider.
Target: Partial target at R2, full target at R3. Trail stop to VWAP or to R1 after price reaches R2.
Example numeric: Weekly VWAP = ₹1,150, R1 = ₹1,200, R2 = ₹1,260. Buy at ₹1,205 (close above R1), stop ₹1,145, target1 ₹1,260 (R2), target2 ₹1,320 (R3).
B. Mean-reversion fade near bands — for range-bound markets
Setup: Market is not trending (VWAP flatish). Price rallies up to R2 or R3 and shows rejection (pin bar, bearish engulfing) on increasing or neutral volume.
Entry: Enter short after a confirmed rejection candle that fails to sustain above R2 or R3 (prefer confirmation: close back below R1 or below the rejection candle low).
Stop-loss: Just above the recent high (e.g., 1–2 ATR or a fixed buffer above R2/R3).
Target: First target VWAP, second target S1. Reduce size if taking R3 fade as it’s an extreme.
Example numeric: VWAP = ₹950, R2 = ₹1,020. Price spikes to ₹1,025 and forms a bearish engulfing candle. Enter short at ₹1,015 after the next close below ₹1,020. Stop at ₹1,035, target VWAP ₹950.
C. Pullback entries in trending markets — higher probability
Setup: Price is above VWAP and trending higher (higher highs and higher lows). Price pulls back toward VWAP or S1 with decreasing downside volume and a reversal candle forms.
Entry: Long when price forms a bullish reversal (hammer/inside-bar) with a close back above the pullback candle.
Stop-loss: Below the pullback low (or below S2 if a larger stop is justified).
Target: VWAP then R1; if momentum resumes, trail toward R2/R3.
Example numeric: Price trending above Weekly VWAP at ₹1,400; pullback to S1 at ₹1,360. Enter long at ₹1,370 when a bullish candle closes; stop at ₹1,350; first target VWAP ₹1,400, second target R1 ₹1,450.
Exit rules and money management
Basic exit hierarchy
Hard stop exit — when price hits initial stop-loss. Always use.
Target exit — take partial profits at R1/R2 (for longs) or S1/S2 (for shorts). Use trailing stops for the remainder.
VWAP invalidation — if you entered long above VWAP and price returns and closes significantly below VWAP, consider exiting (condition depends on timeframe and trade size).
Price action exit — reversal patterns (strong opposite candle, bearish/bullish engulfing) near targets or beyond signals to exit.
Trailing rules
After price reaches R2, move stop to breakeven + a small buffer or to VWAP.
After price reaches R3, trail by 1 ATR or lock a defined profit percentage.
Position sizing & risk
Risk per trade: commonly 0.5–2% of account equity.
Determine position size by RiskAmount ÷ (EntryPrice − StopPrice).
If the stop distance is large (e.g., trading R3 fades), reduce position size.
Filters & confirmation (to reduce false signals)
Volume filter: For breakouts, require volume above short-term average (e.g., >20-period average). Breakouts on low volume are suspect.
Trend filter: Only take breakouts in the direction of the higher-timeframe trend (for example, use Daily/Weekly trend when trading 30m/1H).
Candle confirmation: Prefer entries on close of the confirming candle (not intrabar noise).
Multiple confirmations: When R1 break happens but RSI/plotted momentum indicator does not confirm, treat signal as lower probability.
Special considerations for timeframe-aware logic
On 30m/1H the script uses Weekly VWAP/bands. That means band levels change only on weekly candles — they are strong, structural levels. Treat R1/R2/R3 as significant and expect fewer, stronger signals.
On Daily, the script uses Monthly VWAP/bands. These are wider; trades should allow larger stops and smaller position sizes (or be used for swing trades).
On other intraday charts you get session VWAP (useful for intraday scalps).
Example: If you trade 1H and the Weekly R1 is at ₹2,400 while session VWAP is ₹2,350, a close above Weekly R1 represents a weekly-level breakout — prefer that for swing entries rather than scalps.
Example trade walkthrough (step-by-step)
Context: 1H chart, auto-mapped → Weekly VWAP used.
Weekly VWAP = ₹3,000; R1 = ₹3,080; R2 = ₹3,150.
Price consolidates below R1. A large bullish candle closes at ₹3,085 with volume 40% above the 20-bar average.
Entry: Buy at close ₹3,085.
Stop: Place stop at ₹2,995 (just under Weekly VWAP). Risk = ₹90.
Position size: If risking ₹900 per trade → size = 900 ÷ 90 = 10 units.
Targets: Partial take-profit at R2 = ₹3,150; rest trailed with stop moved to breakeven after R2 is hit.
If price reverses and closes below VWAP within two bars, exit immediately to limit drawdown.
When to avoid trading these signals
High-impact news (earnings, macro announcements) that can gap through bands unpredictably.
Thin markets with low volume — VWAP loses significance when volumes are extremely low.
When weekly/monthly bands are flat but intraday price is volatile without clear structure — prefer session VWAP on smaller timeframes.
Alerts & automation suggestions
Alert on close above R1 / below S1 (use the built-in alertcondition the script adds). For higher-confidence alerts, require volume filter in the alert condition.
Automated order rules (if you automate): use limit entry at breakout close plus a small slippage buffer, immediate stop order, and OCO for TP and SL.

AI Strat ATR Dinamico + ADX + Trend Adaptivo (No Repaint)Below is a fully self-contained, English-language description of every input, function, and logical block inside the “AI Strat ATR Dinamico + ADX + Trend Adaptivo (No Repaint)” indicator. You can copy and paste this into TradingView’s “Description” field when you publish, without exposing any Pine code.
---
## Indicator Name and Purpose
**Name (Short Title):**
AI Strat Adaptive v3 (NoRepaint)
**Overview:**
This indicator combines multiple technical tools—RSI, EMA, ATR (with a dynamic multiplier), ADX/DI, and an “AI‐style” scoring mechanism—to generate trend-filtered and reversal signals. It also optionally confirms signals on a higher timeframe, dynamically adjusts its sensitivity based on volatility, and plots intrabar stop‐loss (SL) and take‐profit (TP) levels derived from ATR. Special care has been taken to ensure that no signals “repaint” (i.e., once drawn on a closed bar, they never disappear or shift).
---
## 1. Main Inputs
All of the inputs appear in the Settings dialog for the published indicator. Below is a detailed explanation of each input, grouped by logical category.
### A. RSI & EMA Base Parameters
1. **RSI Length (Base)**
* **Input type:** Integer (default 14)
* **Description:** Number of bars used to calculate the Relative Strength Index (RSI). A shorter RSI reacts more quickly to price changes; a longer RSI is smoother.
2. **RSI Overbought Threshold**
* **Input type:** Integer (default 60)
* **Description:** If the RSI value rises above this level, it contributes a “sell” signal component. You can adjust this (e.g., 70) to make your system more conservative.
3. **RSI Oversold Threshold**
* **Input type:** Integer (default 40)
* **Description:** If the RSI falls below this level, it contributes a “buy” signal component. Raising this threshold (e.g., 50) makes the strategy more aggressive in seeking reversals.
4. **EMA Length (Base)**
* **Input type:** Integer (default 20)
* **Description:** Number of bars for the Exponential Moving Average (EMA). A shorter EMA will produce more frequent crossovers, a longer EMA is smoother.
### B. ATR & Volatility Filter Parameters
5. **ATR Length (Base)**
* **Input type:** Integer (default 14)
* **Description:** Number of bars to calculate Average True Range (ATR). The ATR is used both for measuring volatility and for dynamic SL/TP levels.
6. **ATR SMA Length**
* **Input type:** Integer (default 50)
* **Description:** Number of bars to compute a Simple Moving Average of the ATR itself. This gives a baseline of “normal” volatility. If ATR rises significantly above this SMA, the indicator treats the market as “high volatility.”
7. **ATR Multiplier Base**
* **Input type:** Float (default 1.2, step 0.1)
* **Description:** Base multiplier for ATR when filtering for volatility. The actual threshold is computed as `ATR_SMA × (ATR_Multiplier Base) × sqrt(current_ATR / ATR_SMA)`. In other words, the multiplier becomes larger if volatility is rising, and smaller if volatility is falling.
8. **Disable Volatility Filter**
* **Input type:** Boolean (default false)
* **Description:** If enabled (true), the indicator will ignore any volatility‐based filtering, using signals regardless of ATR behavior. If disabled (false), signals only fire when ATR > (ATR\_SMA × dynamic multiplier).
### C. Price-Change & “AI Score” Parameters
9. **Price Change Period (bars)**
* **Input type:** Integer (default 3)
* **Description:** The number of bars back to measure percentage price change. Used to ensure that a “trend” signal is accompanied by a sufficiently positive (for longs) or negative (for shorts) price movement over this many bars.
10. **Base AI Score Threshold**
* **Input type:** Float (default 0.1)
* **Description:** The indicator computes a composite “AI-style” score by combining the RSI signal (overbought/oversold) and an EMA crossover signal. Only if the absolute value of that composite score exceeds this threshold will a trend signal be eligible. Raising it makes signals rarer but (potentially) higher-conviction.
### D. SMA “ICT” Trend Filter Parameters
11. **ICT SMA Long Length (Base)**
* **Input type:** Integer (default 50)
* **Description:** Number of bars for the “long” Simple Moving Average (SMA) used in the internal trend filter. Typically, price must be above this SMA (and ADX must be strong) to confirm an uptrend, or below it (and ADX strong) to confirm a downtrend.
12. **ICT SMA Short1 Length (Base)**
* **Input type:** Integer (default 10)
* **Description:** Secondary “fast” SMA used both for reversal logic (e.g., price crossing above it can count as a bullish reversal) and part of the internal trend confirmation.
13. **ICT SMA Short2 Length (Base)**
* **Input type:** Integer (default 20)
* **Description:** A second “medium” SMA used for reversal triggers (e.g., crossovers or crossunders alongside RSI conditions).
### E. ADX & DI Parameters
14. **Base ADX Length**
* **Input type:** Integer (default 14)
* **Description:** Number of bars for the ADX (Average Directional Index) moving averages, which measure trend strength. The same length is used for +DI and –DI smoothing.
15. **Base ADX Threshold**
* **Input type:** Float (default 25.0, step 0.5)
* **Description:** If ADX > this threshold and +DI > –DI, we consider an uptrend; if ADX > this threshold and –DI > +DI, we consider a downtrend. Raising this value demands stronger trends to qualify.
### F. Sensitivity & Cooldown
16. **Sensitivity (0–1)**
* **Input type:** Float between 0.0 and 1.0 (default 0.5)
* **Description:** A general “mixture” parameter used internally to weight how aggressively the indicator leans into trend versus reversal. In practice, the code uses it to fine-tune exact thresholds for switching between trend and reversal conditions. You can leave it at 0.5 unless you want to bias more heavily toward either regime.
17. **Base Cooldown Bars Between Signals**
* **Input type:** Integer (default 5, min 0)
* **Description:** Once a long or short signal fires, the indicator will wait at least this many bars before allowing a new signal in the same direction. Prevents “signal flipping” on each bar. A higher number forces fewer, more spaced-out entries.
18. **Trend Confirmation Bars**
* **Input type:** Integer (default 3, min 1)
* **Description:** After the directional filters (+DI/–DI cross, price vs. SMA), the indicator still requires that price remains on the same side of the long SMA for at least this many consecutive bars before confirming “trend up” or “trend down.” Larger values smooth out false breakouts but may lag signals.
### G. Higher Timeframe Confirmation
19. **Use Higher Timeframe Confirmation**
* **Input type:** Boolean (default true)
* **Description:** If true, the indicator will request a block of values (SMA, +DI, –DI, ADX) from a higher timeframe (default 60 minutes) and require that the higher timeframe is also in agreement (strong uptrend or strong downtrend) before confirming your current-timeframe trend. This helps filter out lower-timeframe noise.
20. **Higher Timeframe (TF) for Confirmation**
* **Input type:** Timeframe (default “60”)
* **Description:** The chart timeframe (e.g., 5, 15, 60 minutes) whose trend conditions must also be true. It’s sent through a `request.security(..., lookahead=barmerge.lookahead_off)` call so that it never “paints ahead.”
### H. Dynamic TP/SL Parameters
21. **TP as ATR Multiple**
* **Input type:** Float (default 2.0, step 0.1)
* **Description:** When a trade is open, the “take-profit” price is determined by looking at the highest high (for longs) or lowest low (for shorts) observed since entry, and then plotting a cross (“X”) at that level when the trend finally flips. This is purely for display. However, separate from that, this parameter can be adapted if you want a strictly ATR–based TP. In the “Minimal” version, TP is ≈ (highest high) once trend inverts, but you could rewrite it to use `entry_price + ATR×TP_Multiplier`.
22. **SL as ATR Multiple**
* **Input type:** Float (default 1.0, step 0.1)
* **Description:** While in a trade, a trailing SL line is plotted each bar. Its value is always `entry_price ± (ATR × SL_Multiplier)`. When the trend inverts, the SL no longer updates, and you see it on the chart.
### I. Display and Mode Options
23. **Show Debug Lines**
* **Input type:** Boolean (default true)
* **Description:** When enabled, the indicator will plot all intermediate lines—ATR SMA, ATR Threshold, +DI, –DI, ADX (current and HTF), HTF SMA, etc.—so that you can diagnose exactly what’s happening. Turn this off to hide all debug information and only see entry/exit shapes.
24. **Enable Scalping Mode**
* **Input type:** Boolean (default false)
* **Description:** If true, many of the “base” parameters are halved (e.g., RSI length becomes 7 instead of 14, ATR length becomes 7 instead of 14, ADX length becomes 7, etc.), and the ADX threshold is multiplied by 0.8. This makes all oscillators and moving averages more reactive, suited for very short-term (scalping) setups.
---
## 2. Core Calculation Blocks
Below is a high-level description of each logical block (in code order), translated from Pine into conceptual steps.
### A. Adjust Inputs if “Scalping Mode” Is On
If **Scalping Mode** = true, then:
* `RSI_Length` becomes `max(1, round(Base_RSI_Length / 2))`
* `EMA_Length` becomes `max(1, round(Base_EMA_Length / 2))`
* `ATR_Length` becomes `max(1, round(Base_ATR_Length / 2))`
* `Price_Change_Period` becomes `max(1, round(Base_Price_Change_Period / 2))`
* `SMA_Long_Length`, `SMA_Short1_Length`, and `SMA_Short2_Length` are each halved (minimum 1).
* `ADX_Length` = `max(1, round(Base_ADX_Length / 2))`
* `ADX_Threshold` = `Base_ADX_Threshold × 0.8`
* `Cooldown_Bars` = `max(0, round(Base_Cooldown_Bars / 2))`
Otherwise, all adjusted lengths = their base values.
### B. RSI, EMA & “AI Score” on Current Timeframe
1. **Compute RSI:**
* Uses the (possibly adjusted) `RSI_Length`.
* Denote this as `RSI_Value`.
2. **Compute ATR & Its SMA:**
* `ATR_Value` = `ta.atr(ATR_Length)`.
* `ATR_SMA` = `ta.sma(ATR_Value, ATR_SMA_Length)`.
* Then define `Volatility_Increase` = (`ATR_Value > ATR_SMA`).
* If the volatility has increased, the weighting of RSI vs. EMA changes.
3. **Compute Weights:**
* If `Volatility_Increase == true`, then:
* `RSI_Weight = 0.7`
* `EMA_Weight = 0.3`
* Otherwise:
* `RSI_Weight = 0.3`
* `EMA_Weight = 0.7`
4. **RSI Signal Component (`RSI_Sig`):**
* If `RSI_Value > RSI_Overbought`, then `RSI_Sig = –1`.
* Else if `RSI_Value < RSI_Oversold`, then `RSI_Sig = +1`.
* Otherwise, `RSI_Sig = 0`.
5. **EMA Value & Signal Component (`EMA_Sig`):**
* `EMA_Value` = `ta.ema(close, EMA_Length)`.
* `EMA_Sig = +1` if the current close crosses **above** the EMA; `EMA_Sig = –1` if the current close crosses **below** the EMA; else `0`.
6. **Compute Raw “AI Score”:**
$$
Raw\_AI = (RSI\_Sig \times RSI\_Weight)\;+\;(EMA\_Sig \times EMA\_Weight)
$$
Then,
$$
AI\_Score = \frac{Raw\_AI}{(RSI\_Weight + EMA\_Weight)}
$$
(This normalization ensures the score always ranges between –1 and +1 if both weights sum to 1.)
### C. Dynamic ATR Multiplier & Volatility Filter
1. **Volatility Factor:**
$$
Volatility\_Factor = \frac{ATR\_Value}{ATR\_SMA}
$$
2. **Dynamic ATR Multiplier:**
$$
ATR\_Multiplier = ATR\_Multiplier\_Base \times \sqrt{Volatility\_Factor}
$$
3. **High Volatility Condition (`High_Volatility`):**
* If `Disable_Volatility_Filter == true`, then treat `High_Volatility = true` always.
* Else, `High_Volatility = (ATR_Value > ATR_SMA × ATR_Multiplier)`.
### D. Price Change Percentage
* **Compute Price Change:**
$$
Price\_Change = \frac{(Close - Close )}{Close } \times 100
$$
* This is the percent return from `Price_Change_Period` bars ago to now.
* For a valid long‐trend signal, we require `Price_Change > 0`; for a short trend, `Price_Change < 0`.
### E. Local SMAs for Trend/Reversal Filters
* `SMA_Close_Long` = `ta.sma(close, SMA_Long_Length)`.
* `SMA_Close_Short1` = `ta.sma(close, SMA_Short1_Length)`.
* `SMA_Close_Short2` = `ta.sma(close, SMA_Short2_Length)`.
These three SMAs help define the “local trend” and reversal breakout points:
* **Primary Trend Filter:**
* Price must be above `SMA_Close_Long` for an uptrend filter, or below `SMA_Close_Long` for a downtrend filter.
* **Reversal Filter:**
* A bullish reversal is detected if **(RSI < Oversold AND close crosses above EMA)** OR **(RSI < Oversold AND close crosses above SMA\_Close\_Short1)**.
* A bearish reversal is detected if **(RSI > Overbought AND close crosses below EMA)** OR **(RSI > Overbought AND close crosses below SMA\_Close\_Short1)**.
### F. Manual +DI, –DI & ADX on Current Timeframe
Instead of relying on the built-in `ta.adx`, the script calculates DI and ADX manually. This makes it easier to replicate the exact logic on a higher timeframe via `request.security`. The steps are:
1. **Directional Movement (DM) Components:**
* `Up_Move` = `high – high `
* `Down_Move` = `low – low`
* `Plus_DM` = `Up_Move` if (`Up_Move > Down_Move` AND `Up_Move > 0`), else `0`
* `Minus_DM` = `Down_Move` if (`Down_Move > Up_Move` AND `Down_Move > 0`), else `0`
2. **True Range (TR) Components:**
* `TR1` = `high – low`
* `TR2` = `abs(high – close )`
* `TR3` = `abs(low – close )`
* `True_Range` = `max(TR1, TR2, TR3)`
3. **Smoothed Averages (RMA):**
* `Sm_TR` = `ta.rma(True_Range, ADX_Length)`
* `Sm_Plus` = `ta.rma(Plus_DM, ADX_Length)`
* `Sm_Minus`= `ta.rma(Minus_DM, ADX_Length)`
4. **Compute DI%:**
$$
Plus\_DI = \frac{Sm\_Plus}{Sm\_TR} \times 100,\quad
Minus\_DI = \frac{Sm\_Minus}{Sm\_TR} \times 100
$$
5. **DX and ADX:**
$$
DX = \frac{|Plus\_DI - Minus\_DI|}{Plus\_DI + Minus\_DI} \times 100,\quad
ADX = ta.rma(DX, ADX_Length)
$$
These values are referred to as `(plus_di, minus_di, adx_val)` for the current timeframe.
---
## 3. Higher Timeframe (HTF) Confirmation Function
If **Use Higher Timeframe Confirmation** is enabled, the script calls a single helper (Pine) function `f_htf` with two parameters: the ADX length and the SMA length (both taken from the “base” or “scaled” values). Internally, `f_htf` simply reruns the manual DI/ADX logic (same as above) on the higher timeframe’s bar data, and also includes that timeframe’s closing price and its SMA for trend comparison.
* **Request.Security Call:**
```
= request.security(
syminfo.tickerid,
higher_tf,
f_htf(adx_length, sma_long_len),
lookahead=barmerge.lookahead_off
)
```
* `lookahead=barmerge.lookahead_off` ensures that no HTF value “paints” early; you always see only confirmed HTF bars.
* The returned tuple provides:
1. `ht_close` = HTF closing price
2. `ht_sma` = HTF SMA of length `sma_long_len`
3. `ht_pdi` = HTF +DI percentage
4. `ht_mdi` = HTF –DI percentage
5. `ht_adx` = HTF ADX value
---
## 4. Trend & Reversal Filters (Current & HTF)
### A. Current-Timeframe Trend Filter
1. **Uptrend\_Basic (Current TF)**
$$
(plus\_di > minus\_di)\;\land\;(adx\_val > ADX\_Threshold)\;\land\;(close > SMA\_Close\_Long)
$$
2. **Downtrend\_Basic (Current TF)**
$$
(minus\_di > plus\_di)\;\land\;(adx\_val > ADX\_Threshold)\;\land\;(close < SMA\_Close\_Long)
$$
3. **Trend Confirmation by Bars:**
* `Bars_Since_Below` = number of bars since `close <= SMA_Close_Long`.
* `Bars_Since_Above` = number of bars since `close >= SMA_Close_Long`.
* If `Uptrend_Basic == true` AND `Bars_Since_Below ≥ Trend_Confirmation_Bars` → mark `Uptrend_Confirm = true`.
* If `Downtrend_Basic == true` AND `Bars_Since_Above ≥ Trend_Confirmation_Bars` → mark `Downtrend_Confirm = true`.
### B. Reversal Filters (Current TF)
1. **Bullish Reversal (`Rev_Bullish`):**
* If `(RSI < RSI_Oversold AND close crosses above EMA_Value)` OR
`(RSI < RSI_Oversold AND close crosses above SMA_Close_Short1)`
→ then `Rev_Bullish = true`.
2. **Bearish Reversal (`Rev_Bearish`):**
* If `(RSI > RSI_Overbought AND close crosses below EMA_Value)` OR
`(RSI > RSI_Overbought AND close crosses below SMA_Close_Short1)`
→ then `Rev_Bearish = true`.
### C. Higher-Timeframe Trend Filter (HTF)
1. **HTF Uptrend (`HT_Uptrend`):**
$$
(ht\_pdi > ht\_mdi)\;\land\;(ht\_adx > ADX\_Threshold)\;\land\;(ht\_close > ht\_sma)
$$
2. **HTF Downtrend (`HT_Downtrend`):**
$$
(ht\_mdi > ht\_pdi)\;\land\;(ht\_adx > ADX\_Threshold)\;\land\;(ht\_close < ht\_sma)
$$
3. **Combine Current & HTF:**
* If **Use\_HTF\_Confirmation == true**, then:
* `Uptrend_Confirm := Uptrend_Confirm AND HT_Uptrend`
* `Downtrend_Confirm := Downtrend_Confirm AND HT_Downtrend`
* Otherwise, just use the current timeframe’s `Uptrend_Confirm` and `Downtrend_Confirm`.
4. **Define `CurrentTrend` (Integer):**
* `CurrentTrend = +1` if `Uptrend_Confirm == true`.
* `CurrentTrend = –1` if `Downtrend_Confirm == true`.
* Otherwise, `CurrentTrend = 0`.
5. **Reset “One Trade Per Trend”:**
* There is a persistent variable `LastTradeTrend`.
* Every time `CurrentTrend` flips (i.e., `CurrentTrend != CurrentTrend `), the code sets `LastTradeTrend := 0`.
* That allows one new entry once the detected trend has changed.
---
## 5. One‐Time “Cooldown” Logic
* **`LastSignalBar`**
* A persistent integer (initially undefined).
* After each confirmed long or short entry, `LastSignalBar` is set to the bar index where that signal fired.
* **`Bars_Since_Signal`**
* If `LastSignalBar` is undefined, treat as a very large number (so that initial signals are always allowed).
* Otherwise, `Bars_Since_Signal = bar_index – LastSignalBar`.
* **Cooldown Check:**
* A new long (or short) can only be generated if `(Bars_Since_Signal > Signal_Cooldown)`.
* This prevents multiple signals in rapid succession.
---
## 6. Entry Conditions (No Repaint)
All of the conditions below are calculated “intrabar,” but the script only actually registers a **signal** on **bar close** (`barstate.isconfirmed`) so that signals never repaint.
### A. Trend‐Based “Raw” Conditions
1. **Trend\_Long\_Raw:**
$$
(AI\_Score > AI\_Score\_Threshold)\;\land\;Uptrend\_Confirm\;\land\;High\_Volatility\;\land\;(Price\_Change > 0)
$$
2. **Trend\_Short\_Raw:**
$$
(AI\_Score < -AI\_Score\_Threshold)\;\land\;Downtrend\_Confirm\;\land\;High\_Volatility\;\land\;(Price\_Change < 0)
$$
### B. Reversal “Raw” Conditions
1. **Rev\_Long\_Raw:**
$$
Rev\_Bullish\;\land\;(CurrentTrend \neq +1)
$$
2. **Rev\_Short\_Raw:**
$$
Rev\_Bearish\;\land\;(CurrentTrend \neq -1)
$$
### C. Combine Raw Signals
* `Raw_Long = Trend_Long_Raw OR Rev_Long_Raw`.
* `Raw_Short = Trend_Short_Raw OR Rev_Short_Raw`.
### D. Confirmed Long/Short Signal Flags
On each new bar **close** (`barstate.isconfirmed == true`):
* **Long\_Signal\_Confirmed** can fire if:
1. `Raw_Long == true`
2. `LastTradeTrend != +1` (we haven’t already taken a long in this same trend)
3. `Bars_Since_Signal > Signal_Cooldown`
If all three hold, then on this bar close the code sets:
* `Long_Signal = true`
* `LastTradeTrend := +1`
* `LastSignalBar := bar_index`
Otherwise, `Long_Signal := false` on this bar.
* **Short\_Signal\_Confirmed** works the same way but with `Raw_Short`, `LastTradeTrend != -1`, etc.
If triggered, it sets `Short_Signal = true`, `LastTradeTrend := -1`, and `LastSignalBar := bar_index`. Otherwise `Short_Signal := false`.
* **Important:** If the bar is still forming (`else` branch of `barstate.isconfirmed`), then both `Long_Signal` and `Short_Signal` are forced to `false`. This guarantees that no shape or alert appears until the bar actually closes.
---
## 7. Plotting Entry/Exit Shapes
1. **Trend Long Signal (Triangle Up)**
* Condition: `Long_Signal == true` **AND** `Trend_Long_Raw == true`.
* Appearance: A small, semi-transparent lime green triangle drawn **below** the bar.
2. **Trend Short Signal (Triangle Down)**
* Condition: `Short_Signal == true` **AND** `Trend_Short_Raw == true`.
* Appearance: A small, semi-transparent maroon triangle drawn **above** the bar.
3. **Reversal Long Signal (Circle)**
* Condition: `Long_Signal == true` **AND** `Rev_Long_Raw == true`.
* Appearance: A tiny, more transparent green circle drawn **below** the bar.
4. **Reversal Short Signal (Circle)**
* Condition: `Short_Signal == true` **AND** `Rev_Short_Raw == true`.
* Appearance: A tiny, more transparent red circle drawn **above** the bar.
Since `Long_Signal` and `Short_Signal` only ever become true at bar close, these shapes are never repainted or removed once drawn.
---
## 8. Unified Alert Message
* As soon as a new bar closes with either `Long_Signal` or `Short_Signal == true`, an alert message is sent:
* If `Long_Signal`, then `alert_msg = "action=BUY"`.
* If `Short_Signal`, then `alert_msg = "action=SELL"`.
* If neither, `alert_msg = ""` (no alert).
* The code calls `alert(alert_msg, freq=alert.freq_once_per_bar)` only if `barstate.isconfirmed` and `alert_msg` is non‐empty. This ensures exactly one alert per confirmed bar, no intrabar pops.
---
## 9. Dynamic TP/SL Logic (Minimal Implementation)
Once a long or short position is “open,” the script tracks these variables:
1. **Persistent Flags and Prices** (all persist between bars until reset):
* `InLong` (Boolean)
* `InShort` (Boolean)
* `Long_Max` (Float)
* `Short_Min` (Float)
* `Entry_Price` (Float)
2. **On Bar Close:**
* If `Long_Signal == true` →
* Set `InLong := true`,
* `Entry_Price := close` of that bar,
* `Long_Max := high ` (last bar’s high, so that we’re not using “future” data).
* If `Short_Signal == true` →
* Set `InShort := true`,
* `Entry_Price := close`,
* `Short_Min := low `.
3. **While `InLong == true`:**
* Continuously update `Long_Max = max(Long_Max, current high)` on each bar (intrabar, but finalized each close).
* Compute a dynamic SL:
$$
SL_{Long} = Entry\_Price - (ATR \times SL\_ATR\_Multiplier).
$$
* If **current trend** flips to non-uptrend (`CurrentTrend != +1`), mark `ExitLong = true`.
* Then the routine plots `TP_Long = Long_Max` as a cross (“X”) at that level.
* Set `InLong := false` so that no further changes to `Long_Max` or `Entry_Price` happen on future bars.
4. **While `InShort == true`:**
* Continuously update `Short_Min = min(Short_Min, current low)`.
* Compute a dynamic SL:
$$
SL_{Short} = Entry\_Price + (ATR \times SL\_ATR\_Multiplier).
$$
* If trend flips to non-downtrend (`CurrentTrend != –1`), mark `ExitShort = true`.
* Then the routine plots `TP_Short = Short_Min`.
* Set `InShort := false` to freeze those values.
5. **Plotting TP/SL if “Show Debug” is On:**
* **TP Shapes:**
* When `ExitLong == true`, plot a solid lime “X” at `TP_Long` (highest high).
* When `ExitShort == true`, plot a solid maroon “X” at `TP_Short` (lowest low).
* **SL Lines:**
* If still `InLong`, draw a thin red line at `SL_Long` on each bar.
* If still `InShort`, draw a thin green line at `SL_Short`.
Thus, your charts visually show the highest‐high take-profit cross for longs, the lowest-low take-profit cross for shorts, and a continuously updating trailing SL until the trend flips. Because all of this is triggered on confirmed bars, nothing “jumps around” after the fact.
---
## 10. Debug‐Only Plot Lines (When Enabled)
When **Show Debug Lines** = true, the indicator will also plot:
1. **ATR SMA (Orange):**
* The simple moving average of ATR over `ATR_SMA_Length`.
2. **ATR Threshold (Yellow):**
* `ATR_SMA × ATR_Multiplier` (the dynamically scaled threshold).
3. **+DI & –DI (Current TF):**
* +DI plotted as a green line, –DI plotted as a red line (opacity \~70%).
4. **ADX (Current TF, Blue):**
* A blue line for the present timeframe’s ADX.
5. **ADX Threshold (Gray):**
* A horizontal gray line showing `ADX_Threshold`.
6. **+DI & –DI (HTF, Darker Colors):**
* If HTF confirmation is on, “HTF +DI” is a greener but more transparent line; “HTF –DI” is a redder but more transparent line.
7. **ADX (HTF, Blue but Transparent):**
* HTF ADX plotted in blue (high transparency).
8. **HTF SMA (Orange, Transparent):**
* The higher timeframe’s SMA (same length as `SMA_Long_Length`), drawn in fainter orange.
9. **Volatility Zone Fill (Yellow Tinted Area):**
* Fills the area between `ATR_SMA` and `ATR_SMA × ATR_Multiplier`.
* Indicates “normal” versus “high‐volatility” regimes.
These debug lines are purely visual aids. Disable them if you want a cleaner chart.
---
## 11. Putting It All Together — Step-By-Step Flow
1. **Read Inputs** (RSI lengths, EMA length, ATR settings, etc.).
2. **Optionally Halve All Lengths** if “Scalping Mode” is checked.
3. **Calculate Current TF Indicators:**
* RSI, ATR, ATR\_SMA, EMA, price change, various SMAs, DI/ADX.
4. **Compute “AI Score”** (weighted sum of RSI and EMA signals).
5. **Compute Dynamic ATR Multiplier** and decide if “High Volatility” is true.
6. **Compute Raw Trend/Reversal Conditions** on the current timeframe (without triggering yet).
7. **Fetch HTF Values** in one `request.security` call (SMAs, DI/ADX).
8. **Combine Current & HTF Trend Filters** to confirm `Uptrend_Confirm` or `Downtrend_Confirm`.
9. **Check Reversal Conditions** (price crossing EMA or SMA short, in overbought/oversold zones).
10. **Enforce “One Trade Per Trend”** (clear `LastTradeTrend` whenever `CurrentTrend` flips).
11. **Enforce Cooldown** (must wait at least `Signal_Cooldown` bars since the prior signal).
12. **On Bar Close:**
* If `Raw_Long` AND not already in a long trend AND cooldown met, then fire `Long_Signal`.
* Else if `Raw_Short` AND not already in a short trend AND cooldown met, then fire `Short_Signal`.
* Otherwise, no new signal on this bar.
13. **Plot Long/Short Entry Shapes** according to whether it was a Trend signal or a Reversal signal.
14. **Send Alert** (“action=BUY” or “action=SELL”) exactly once per confirmed bar.
15. **If New Long/Short Signal, Set `InLong`/`InShort`, Record Entry Price, Initialize `Long_Max`/`Short_Min`.**
16. **While `InLong` is true:** Update `Long_Max = max(previous Long_Max, current high)`. Compute `SL_Long`. If the current trend flips (no longer uptrend), set `ExitLong = true`, plot a “TP X,” and close the position logic.
17. **While `InShort` is true:** Similarly update `Short_Min`, compute `SL_Short`, and if trend flips, set `ExitShort = true`, plot a “TP X,” and close the position logic.
18. **Optionally Display Debug Lines** (ATR SMA, ATR threshold, DI/ADX, HTF DI/ADX, etc.).
---
## 12. How to Use in TradingView Community
When you publish this indicator to the TradingView community—choosing “Protected” or “Invite-only” visibility—you can paste the above description into the “Description” field. Users will see exactly what each input does, how signals are generated, and what the various plotted lines represent, **without ever seeing the script source**. In this way, the code itself remains hidden but the logic is fully documented.
1. **Go to “Create New Indicator”** on TradingView.
2. **Paste Your Pine Code** (the full indicator script) in the Pine editor and save it.
3. **Set Visibility = Protected** (or Invite-only).
4. **In the “Description” Text Box, paste the entirety of this document** (steps 1–11).
5. **Click “Publish Script.”**
Users who view your indicator will see its name (“AI Strat Adaptive v3 (NoRepaint)”), a list of all inputs (with default values), and the detailed English description above. They can then load it on any chart, adjust inputs, and see the plotted signals, TP/SL lines, and optional debug overlays—without accessing the underlying Pine code.
---
### Summary of Key Points
* **RSI, EMA, ATR, DI/ADX, and “AI Score”** work together to define “trend vs. reversal.”
* **Dynamic volatility filter** uses ATR and ATR\_SMA to adapt the weighting of RSI vs. EMA and decide whether “volatility is high enough” to permit a trend trade.
* **One trade per detected trend** and a **cooldown period** prevent over‐trading.
* **Higher timeframe confirmation** (optional) further filters out noise.
* **No-repaint logic**:
* All signals only appear at bar close (`barstate.isconfirmed`).
* HTF values are fetched with `lookahead=barmerge.lookahead_off`.
* **Entry shapes** (triangles and circles) clearly mark trend vs. reversal entries.
* **Dynamic TP/SL**: highest‐high (or lowest‐low) since entry is used as TP, ATR×multiplier as SL.
* **Debug mode** (optional) shows every intermediate line for full transparency.
Use this description verbatim (or adapt it slightly for your personal style) when publishing. That way, your community sees exactly how each component works—inputs, functions, filters—while the Pine source code remains private.
LE LevelsGENERAL OVERVIEW:
The LE Levels indicator plots yesterday’s high/low and today’s pre-market high/low directly on your chart, then layers signal logic around those levels and a set of EMA waves. You can choose “Inside” setups, “Outside” setups, or both. You can also pick entries that trigger at levels, entries that trigger off the EMA wave, or both.
This indicator was developed by Flux Charts in collaboration with Ellis Dillinger (Ellydtrades).
What is the purpose of the indicator?:
The purpose of the LE Levels indicator is to give traders a clear view of how price is behaving around key session levels and EMA structure. It follows the same model EllyD teaches by showing where price is relative to the Previous Day High and Low and the Pre-Market High and Low, then printing signals when specific reactions occur around those levels.
What is the theory behind the indicator?:
The theory behind the LE Levels indicator is based on the concept of inside and outside days. An inside day occurs when price trades within the previous day’s high and low, signaling compression and potential breakout conditions. An outside day occurs when price moves beyond those boundaries, confirming expansion and directional bias. When price trades above the PDH or PMH, it reflects bullish control and potential continuation if supported by volume and momentum. When price trades below the PDL or PML, it shows bearish control and possible downside continuation. The idea is to combine this logic with tickers that have catalysts or news, since these events often bring higher-than-normal volume.
LE SCANNER FEATURES:
Key Levels
Signals
EMA Waves
Key Levels:
The LE Levels indicator automatically plots four key levels each day:
Previous Day High (PDH)
Previous Day Low (PDL)
Pre-Market High (PMH)
Pre-Market Low (PML)
🔹How are Key Levels used in the indicator?:
The key levels are a crucial factor in determining if the trend is bullish, bearish, or neutral trend bias. The indicator uses the key levels as a condition for identifying inside or outside setups (explained below). After determining a trend bias and setup type, the indicator prints long and short entry signals based on how price interacts with the key levels and 8 EMA Wave. (explained below).
These levels define where price previously reacted or reversed, helping traders visualize how current price action relates to prior session structure. They update automatically each day and pre-market session, allowing traders to see if price is trading inside, above, or below prior key ranges without manually drawing them.
Please Note: Pre-market times are based on U.S. market hours (Eastern Standard Time) and may vary for non-U.S. tickers or exchanges.
🔹Previous Day High (PDH):
The PDH marks the highest price reached during the previous regular trading session. It shows where buyers pushed price to its highest point before the market closed. This value is automatically pulled from the daily chart and projected forward onto intraday timeframes.
🔹Previous Day Low (PDL):
The PDL marks the lowest price reached during the previous regular trading session. It shows where selling pressure reached its lowest point before buyers stepped in. Like the PDH, this level is retrieved from the prior day’s data and extended into the current session.
🔹Pre-Market High (PMH):
The PMH is the highest price reached between 4:00 AM and 9:29 AM EST, before the regular market open. It shows how far buyers managed to push price up during the pre-market session.
🔹Pre-Market Low (PML):
The PML is the lowest price reached between 4:00 AM and 9:29 AM EST, before the regular market open. It shows how far sellers were able to drive price down during the pre-market session.
🔹Customization Options:
Extend Levels:
Extends each plotted line a user-defined number of bars into the future, keeping them visible even as new candles print. This helps maintain a clear visual reference as the session progresses.
Extend PDH/L Left & Extend PMH/L Left:
These settings let you extend the Previous Day and Pre-Market levels back to their origin point, so you can see exactly where each level was formed on the prior trading day. This makes it easy to understand the context of each level and how it developed. When this option is disabled, the lines begin at the regular session open instead of extending backward into the previous day’s data.
Show Name / Show Price:
Enabling Show Name displays labels (PDH, PDL, PMH, PML) beside each line, while Show Price adds the exact price value. You can choose to show just the name, just the price, or both for a complete label format.
Line Color and Style:
Each level can be fully customized. You can change the line color and select between solid, dashed, or dotted styles to visually distinguish each level type.
At the bottom of the indicator settings, under the ‘Miscellaneous’ section, two additional options allow further control over how levels are displayed:
Hide Previous Day Highs/Lows:
When enabled, the previous day’s high and low levels aren’t shown. When disabled, users can view previous day levels without using replay mode. By default, this setting is enabled.
Disabled:
Enabled:
Hide Previous Pre-Market Highs/Lows:
When enabled, the previous pre-market high and low levels aren’t shown. When disabled, users can view previous pre-market levels without using replay mode. By default, this setting is enabled.
Disabled:
Enabled:
Signals:
The LE Levels indicator automatically prints long and short entry signals based on how price interacts with its key levels (PDH, PDL, PMH, PML) and the EMA Waves. It identifies moments when price either breaks out beyond prior ranges or retests those levels in alignment with momentum shown by the EMA Waves.
There are two types of setups (Inside and Outside) and two entry types ((L)evels and (E)MAs). Together, these settings allow traders to customize the type of structure the indicator recognizes and how signals are generated.
🔹What is an Inside Setup?
An Inside Setup occurs when the current trading session forms entirely within the previous day’s range, meaning price has not yet broken above the Previous Day High (PDH) or below the Previous Day Low (PDL). In the LE Levels indicator, inside setups are recognized when price trades within the previous day’s boundaries while also considering the pre-market range (Pre-Market High and Pre-Market Low).
Inside Setups have two main conditions, depending on directional bias:
Bullish Inside Setup:
Price trades above the Pre-Market High (PMH) and above the Previous Day Low (PDL), while still below the Previous Day High (PDH).
Bearish Inside Setup:
Price trades below the Pre-Market Low (PML) and below the Previous Day High (PDH), while still above the Previous Day Low (PDL).
🔹What is an Outside Setup?
An Outside Setup occurs when the current trading session extends beyond the previous day’s range, meaning price has broken above the Previous Day High (PDH) or below the Previous Day Low (PDL). This structure reflects expansion and directional control, showing that either buyers or sellers have taken price into new territory beyond the prior session’s boundaries.
In the indicator, an Outside Setup forms once price closes beyond both the previous day and pre-market boundaries, showing bias in one direction.
Bullish Outside Setup:
Price closes above both the PDH and the PMH, confirming buyers have pushed through every key resistance from the prior session and the pre-market.
Bearish Outside Setup:
Price closes below both the PDL and the PML, showing sellers have pushed price beneath all key support levels from the previous session and the pre-market.
🔹Entry Types: (L)evels and (E)MAs
Once a setup type (Inside or Outside) has been established, the LE Levels indicator generates trade signals using one of two entry confirmation methods: (L) for Key Level based Entries and (E) for EMA Wave based Entries. These determine how the signal prints and what triggers it within.
🔹(L)evels Entry:
The (L)evels entry type is built around how price reacts to the key levels (PDH, PDL, PMH, PML). It prints when price retests those levels during an active setup. The logic focuses on retests, where price returns to confirm a previous breakout or breakdown before continuing in the same direction.
Bullish Outside (L)evels Setup:
A Bullish Outside Setup forms when price breaks above both the PDH and PMH. Once this breakout occurs, the indicator waits for a pullback to one of those levels. For a signal to print, the 8 EMA Wave must also be near that level, showing momentum is supporting the structure. A small buffer is applied between price and the level so that even if price only comes close, without fully touching, the retest still counts. When price holds above the PDH or PMH with the 8 EMA nearby, the indicator prints an (L) ▲ entry.
Bearish Outside (L)evels Setup:
A Bearish Outside Setup forms when price breaks below both the PDL and PML. Once this breakdown occurs, the indicator waits for a pullback to one of those levels. For a signal to print, the 8 EMA Wave must also be near that area, confirming momentum is aligned with the move. A small buffer is included so that even if price comes close but doesn’t fully touch the level, the retest still qualifies. When price holds below the PDL or PML with the 8 EMA nearby, the indicator prints an (L) ▼ entry.
Bullish Inside (L)evels Setup:
A Bullish Inside Setup forms when price trades above the PMH but stays below the PDH and above the PDL. Once this condition is met, the indicator waits for a pullback to the PMH. For a signal to print, the 8 EMA Wave must also be near that level. A small buffer is applied so that even if price only comes close to the level, the retest still counts. When price holds above the PMH with the 8 EMA nearby, the indicator prints an (L) ▲ entry.
Bearish Inside (L)evels Setup:
A Bearish Inside Setup forms when price trades below the PML but stays above the PDL and below the PDH. Once this condition is met, the indicator waits for a pullback to the PML. For a signal to print, the 8 EMA Wave must also be near that level. A small buffer is applied so that even if price only comes close, the retest still counts. When price holds below the PML with the 8 EMA nearby, the indicator prints an (L) ▼ entry.
🔹(E)MAs Entry:
The (E)MA Entry type focuses on how price reacts to the 8 EMA Wave. It identifies when price first interacts with the EMAs, then confirms continuation once momentum resumes in the setup’s direction. The first candle that touches the EMA prints an (E) marker, and the confirmation signal triggers only after price breaks above or below that candle, depending on the bias.
Bullish Outside (E)MA Setup:
A Bullish Outside Setup forms when price is trading above both the PDH and PMH. Once this breakout occurs, the indicator waits for price to pull back and touch the 8 EMA Wave, which prints the initial (E) label. If price then breaks above that candle’s high, the continuation setup is confirmed.
Bearish Outside (E)MA Setup:
A Bearish Outside Setup forms when price is trading below both the PDL and PML. After the breakdown, the indicator waits for price to pull back to the 8 EMA Wave, marking the candle that touches it with an (E) label. If price then breaks below that candle’s low, the continuation setup is confirmed.
Bullish Inside (E)MA Setup:
A Bullish Inside Setup forms when price trades above the PMH but remains below the PDH and above the PDL. The indicator waits for price to retrace and touch the 8 EMA Wave, which prints the initial (E) label. If price then breaks above that candle’s high, the continuation setup is confirmed.
Bearish Inside (E)MA Setup:
A Bearish Inside Setup forms when price trades below the PML but remains above the PDL and below the PDH. Once price touches the 8 EMA Wave, the indicator prints an (E) marker. If price then breaks below that candle’s low, the continuation setup is confirmed.
🔹Signal Settings:
At the bottom of the indicator settings panel, three core controls define how signals are displayed and which setups the indicator actively scans for. These settings allow you to refine signal generation based on your trading approach and chart preference.
Setup Type:
This setting determines which structural conditions the indicator tracks.
Inside Setups: Signals only appear when price is trading within the previous day’s range (between PDH and PDL).
Outside Setups: Signals only appear when price breaks outside the previous day’s range (above PDH/PMH or below PDL/PML).
Both: Enables signals for both Inside and Outside setups.
Entry Type:
Controls how the indicator confirms entries.
(E)MAs: Prints signals based on price interacting with the 8 EMA Wave.
(L)evels: Prints signals based on price retesting key levels such as PDH, PDL, PMH, or PML.
Both: Allows both EMA and Level-based signals to appear on the same chart.
Signal Filters (Long, Short, and Re-Entry):
These toggles let you control which trade directions are active.
Long: Displays only bullish entries and ignores all short setups.
Short: Displays only bearish entries and ignores long setups.
Re-Entry: Enables or disables repeated signals in the same direction after the first valid setup has printed. When off, only the initial signal is shown until conditions reset.
EMA Waves:
The EMA Waves help identify potential entries and show directional bias. They’re made of grouped EMAs that form shaded areas to create a “wave” look. The color-coding on the waves allows users to view when price is consolidating, in a bullish trend, or in a bearish trend. The wave updates in real time as new candles form and does not repaint historical data.
🔹8 EMA Wave
The 8 EMA Wave is used directly in the indicator’s signal logic described earlier. It reacts fastest to price compared to the other EAM Waves and determines when (L) and (E) signals can trigger.
How It Works:
The wave is made from the 8, 9, and 10 EMAs and fills the space between them to create a “wave” look. The 8 EMA Wave continuously updates its color based on where price trades relative to the key levels (PDH, PDL, PMH, PML). The color changes are conditional and based solely on price position relative to key levels.
Price is above both PDH and PMH: The wave is bright green, and the top half is purple.
Price is between PDH and PMH: The wave is dark green, and the top half is purple.
Price is below both PDL and PML: The wave is bright red, and the bottom half is purple.
Price is between PDL and PML: The wave is dark red, and the bottom half is purple.
Price is between all four levels: The wave is gray to represent consolidation or neutral bias.
🔹8 EMA Wave Signal Function:
For (L)evels entries, the 8 EMA must be close to the key level being retested, with a small buffer that allows near touches to qualify.
For (E)MA entries, the first candle that touches the wave prints an (E), and the confirmation signal appears when price breaks that candle’s high or low.
🔹8 EMA Wave Customization:
Users can customize all colors for bullish, bearish, and neutral conditions directly in the settings. The purple overlay color cannot be changed, as it is hard-coded into the indicator. The 8 EMA Wave can also be toggled on or off. Turning it off only removes the visual display from the chart and does not affect signals.
🔹20 EMA Wave
The 20 EMA Wave measures medium-term momentum and helps visualize larger pullbacks. It reacts more slowly than the 8 EMA Wave, giving a smoother wave look. No signals are generated from it. It’s purely a visual guide for spotting potential pullback areas for continuation setups.
How It Works:
The wave is made from the 19, 20, and 21 EMAs and fills the space between them to create a shaded “wave.” The color updates continuously based on where price trades relative to the key levels (PDH, PDL, PMH, PML). The color changes are conditional and based only on price position relative to these levels.
Price is above both PDH and PMH: The wave is bright green, and the top half is blue.
Price is between PDH and PMH: The wave is dark green, and the top half is blue.
Price is below both PDL and PML: The wave is bright red, and the bottom half is blue.
Price is between PDL and PML: The wave is dark red, and the bottom half is blue.
Price is between all four levels: The wave is gray to represent consolidation or neutral bias.
🔹20 EMA Wave Use Case:
After 12:00 PM EST, the 20 EMA Wave is used to spot larger pullbacks that form later in the session. No signals are generated from it; it only serves as a visual guide for identifying potential continuation areas.
Bullish Continuation Pullback:
Bearish Continuation Pullback:
🔹20 EMA Wave Customization:
Users can customize all colors for bullish, bearish, and neutral conditions directly in the settings. The blue overlay color cannot be changed, as it is hard-coded into the indicator. The 20 EMA Wave can also be toggled on or off.
🔹200 EMA Wave
The 200 EMA Wave is used to determine long-term trend bias. When price is above it, the bias is bullish; when price is below it, the bias is bearish. It updates automatically in real time and is used to define the broader directional bias for the day.
How it Works:
The 200 EMA Wave is created using the 190, 199, and 200 EMAs, with the area between them shaded to form a “wave.”
🔹200 EMA Wave Use Case:
When price is above the 200 EMA Wave and both the 8 and 20 EMA Waves are stacked above it, the overall trend is bullish.
When price is below the 200 EMA Wave and both shorter-term waves are also below it, the overall trend is bearish.
🔹200 EMA Wave Customization:
Users can customize both colors that form the 200 EMA Wave. The entire wave can also be toggled on or off in the settings.
Uniqueness:
The LE Levels indicator is unique because it combines signal logic with a clear visual structure. It automatically detects inside and outside setups, printing (L) and (E) entries based on how price reacts to key levels and the EMA Waves. Each signal follows strict conditions tied to the 8 EMA and key levels. The color-coded EMA Waves make it simple to understand where price is in relation to the key levels and getting a quick trend bias overview.
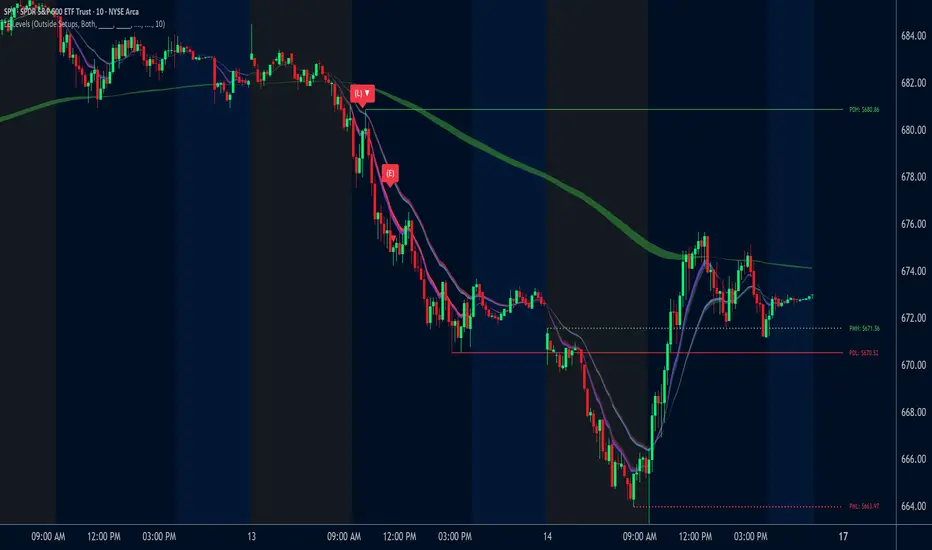
ORB Dashboard for the TFLX Strategy# ORB Range/ATR Dashboard - Technical Indicator Description
## Main Function
This indicator analyzes Opening Range Breakout (ORB) patterns by calculating a defined time period and its relation to historical volatility. The indicator combines multiple technical analysis methods and presents results in a configurable dashboard format.
**Purpose:** This indicator automates the manual calculation steps of the TFLX analysis methodology, providing real-time computation of volatility ratios, trend filters, and risk management parameters that would otherwise require manual calculation and monitoring.
## Requirements and Limitations
**Additional Indicator Required:** This dashboard indicator works in conjunction with a separate ORB range visualization indicator that displays the actual high/low range levels on the chart. The dashboard provides analysis and calculations, while the range indicator provides visual reference points.
**Important Notice:** This indicator serves as an analytical tool and calculation assistant for the TFLX methodology. It does not execute trades automatically but provides data analysis to support manual decision-making processes.
## TFLX Analysis Methodology Framework
### Core Analysis Rules (Discretionary Implementation)
**Primary Conditions:**
- Market position relative to neutral zones (BB analysis)
- Volatility range between 15-60% of ATR(3)
- News event screening (high-impact economic releases)
- Market session timing constraints (before calculated session end)
- US Bank Holiday considerations
**Exception Conditions:**
- High-impact news with rebreak patterns
- Reversal patterns during neutral market conditions
### Technical Specifications of the Methodology
**Range Definition:**
- Time Period: First 15 minutes after market open
- Measurement: High-Low range calculation
- Breakout Trigger: 5-minute close outside established range
**Volatility Analysis:**
- Formula: (Range Points / ATR(3) Previous Day) × 100
- Threshold Ranges:
- <15%: Below minimum threshold
- 15-20%: Low volatility range
- 25-30%: Moderate volatility range
- 30-40%: Good volatility range
- 40-50%: High volatility range
- 50-60%: Very high volatility range
- >60%: Above maximum threshold
**News Event Categories:**
- Major Events: NFP, CPI, PPI, FOMC releases
- Minor Events: All significant economic releases during market hours
- Impact Assessment: Market reaction analysis framework
**Trend Analysis Framework (1H Bollinger Bands):**
- Base Calculation: EMA(200) with standard deviation bands
- Reference Points: Market Open, ORB Close, Trigger Bar
- Decision Logic: 2 out of 3 reference points determine bias
- Zone Classifications:
- Within 0.5 multiplier: Neutral zone
- Within 1.5 multiplier: Directional bias zone
- Outside 1.5 multiplier: Strong directional zone
**Timing Constraints:**
- Session Window: Market open to calculated session end (typically 4.5 hours)
- Retracement Analysis: Maximum adverse movement before breakeven or stop loss
**Manual Calculation Process (Automated by Indicator):**
1. Measure range in points using chart measurement tools
2. Switch to daily timeframe
3. Set ATR period to 3
4. Extract previous day's ATR value
5. Calculate: (Range Points ÷ ATR Value) × 100
6. Apply percentage thresholds for analysis
## Core Components and Calculation Methods
### 1. Opening Range Calculation
**Data Source:** High/Low/Close prices of current timeframe
**Calculation:**
- Defines a configurable time period (default: 15 minutes)
- Collects during this period: `range_high = max(high)` and `range_low = min(low)`
- Calculates Range Size: `range_size = range_high - range_low`
- Stores the last close price of the period: `final_orb_close`
### 2. ATR (Average True Range) Integration
**Data Source:** Daily True Range values
**Calculation:**
```
daily_atr = ta.atr(length) // Default 3 periods
atr_yesterday = daily_atr // Previous trading day
```
**Available Methods:** RMA (default), SMA, EMA, WMA
### 3. Volatility Ratio Calculation
**Formula:**
```
ratio = (range_size / atr_yesterday) * 100
```
**Purpose:** Normalization of current range against historical volatility
**Configurable Parameters:** Min/Max thresholds (default: 15-60%)
### 4. Bollinger Bands Integration (1H Timeframe)
**Data Source:** 1-hour chart data via `request.security()`
**Calculation:**
```
bb_ema = ta.ema(close, 200) // 1H timeframe
bb_std = ta.stdev(close, 200) // 1H timeframe
bb_upper = bb_ema + (bb_std * multiplier)
bb_lower = bb_ema - (bb_std * multiplier)
```
**Configurable Multipliers:**
- Neutral Zone: 0.5x standard deviation
- Strong Zone: 1.5x standard deviation
### 5. Trend Filter System (2/3 Method)
**Components:**
1. **NY Open Signal:** Compares 1H open price with BB levels
2. **ORB Close Signal:** Compares final ORB close with BB levels
3. **Trigger Signal:** Compares breakout price with BB levels
**Logic:**
```
if (bullish_signals >= 2) → "BULLISH"
if (bearish_signals >= 2) → "BEARISH"
else → "MIXED" or "NO TREND"
```
## Component Interaction
### Trade Signal Generation
**Algorithm:**
```
trade_allowed = (orb_ratio >= min_threshold AND orb_ratio <= max_threshold)
AND (bb_signal != "NEUTRAL")
AND (trend_filter_result contains "BULLISH" OR "BEARISH")
```
### Risk Management Calculation
**Entry Points:**
- Long Entry: `range_high`
- Short Entry: `range_low`
**Stop Loss Calculation:**
```
sl_level = range_low + (range_size * sl_position_percent / 100)
```
**Take Profit Calculation:**
```
tp_distance = range_size * tp_factor_percent / 100
long_tp = long_entry + tp_distance
short_tp = short_entry - tp_distance
```
**Position Sizing (CFD-optimized):**
```
risk_per_contract = avg_risk_points * contract_value * lot_size
max_contracts = max_risk_amount / risk_per_contract
```
**Margin Calculation (CFDs):**
```
position_value = total_units * entry_price
margin_required = position_value / leverage
```
## Dashboard Elements
### 1. Volatility Filter Section
- **ORB Range:** Current range in points
- **ATR Previous:** Yesterday's ATR values
- **ORB Ratio:** Calculated ratio with color coding
### 2. Trend Filter Section
- **NY Open vs BB:** Position of 1H open relative to BB
- **ORB Close vs BB:** Position of ORB close relative to BB
- **Trigger Bar vs BB:** Position of breakout price relative to BB
- **Trend Result:** Summary of 2/3 filter
### 3. Risk Management Section (optional)
- **R/R Ratio:** Calculated from TP/SL distances
- **Risk per Lot:** Based on instrument type
- **Max Lot Packages:** Automatic position sizing calculation
- **Margin Required:** For CFD instruments
### 4. Journal Section (optional)
- **Breakout Timing:** Categorization by bars (1-3, 4-6, 7-9, 10-12, 13+)
- **Direction Tracking:** Bullish/Bearish breakout direction
- **Position Analysis:** Distance of breakout to ORB range
## Automatic Instrument Detection
**CFD/Index Treatment:**
```
if (syminfo.type == "cfd" OR syminfo.type == "index")
contract_value = 1.0 * cfd_lot_size
```
**Forex Treatment:**
```
if (syminfo.type == "forex")
contract_value = syminfo.pointvalue * cfd_lot_size
```
**Futures/Stocks:**
```
contract_value = syminfo.pointvalue
```
## Timezone Handling
- All time calculations based on configurable timezone
- Session End Time: ORB Start + 4.5 hours
- Automatic overflow handling for 24h format
## Alert System
**ORB Formation Alert:**
- Triggered upon completion of ORB period
- Includes: Range size, high/low values
**Breakout Alert:**
- Triggered on close price outside ORB range
- Includes: Direction, trade status based on filters
## Configuration Options
- **ORB Period:** Start/end time in hours/minutes
- **ATR Parameters:** Period and calculation method
- **Volatility Thresholds:** Min/max percentage limits
- **BB Parameters:** Period and multipliers
- **Risk Management:** Risk amount, SL/TP positions
- **Dashboard Layout:** Position, size, colors, visibility
## Data Integrity
- State variables with `var` declaration for persistence
- Daily reset of all relevant variables
- Lookahead bias prevention through `barmerge.lookahead_off`
- Multi-timeframe safety through `request.security()` functions
This technical implementation provides a comprehensive analysis framework for Opening Range Breakout patterns with integrated volatility, trend, and risk management components.

coinbot_ICT_Unicorn(AUTOTRADE)1. 🎯 핵심 기능: 자동매매 신호 전송 (Webhook)
이 스크립트는 매매 신호가 발생할 때마다, 사용자가 '자동매매 설정(Autotrade Settings)'에 입력한 값들을 조합하여 구체적인 JSON 메시지를 생성하고 alert() 함수를 통해 웹훅으로 전송합니다.
입력 설정: user_id, exchange(거래소), leverage(레버리지), capital_percent(투입 시드 %), sl_percent(손절 %), 그리고 3단계 분할 익절(tp1_price_percent, tp1_qty_percent 등) 설정을 입력받습니다.
신호 종류:
ENTRY (진입): 매수(buy) 또는 매도(sell) 신호가 발생하면, 위 모든 설정값을 포함한 진입 명령을 보냅니다.
CLOSE (손절): 전략의 내부 로직에 의해 손절가에 도달하면(slAlertTick), 포지션을 종료하라는 신호를 보냅니다.
TAKE_PROFIT (익절): 목표가에 도달하면(tpAlertTick), 설정된 물량만큼 익절하라는 신호를 보냅니다.
2. 📈 작동 원리: "ICT 유니콘" 매매 전략
이 스크립트의 진입 로직은 ICT(Inner Circle Trader) 개념 중 하나인 **'유니콘 모델'**을 따릅니다.
구성 요소 식별:
Breaker Block (BB): '브레이커 블록'을 식별합니다. 이는 특정 고점/저점을 만든 후 그 방향으로 가지 못하고 반대 방향으로 돌파(Break)된 오더 블록(Order Block)입니다.
Fair Value Gap (FVG): '공정 가치 갭' (가격 불균형 영역)을 식별합니다.
핵심 진입 신호 (Unicorn): 이 전략의 핵심 진입 조건은 **Breaker Block(BB)과 Fair Value Gap(FVG)이 중첩(Overlap)**되는, 소위 '유니콘'이라 불리는 강력한 지지/저항 영역이 발생하는 것입니다.
Long (매수) 진입:
가격이 하락하며 **'하락형 브레이커 블록(Bearish Breaker Block)'**을 만듭니다.
이후 가격이 상승 돌파하며 이 브레이커 블록 영역과 중첩되는 **'상승형 FVG(Bullish FVG)'**를 생성합니다.
이 중첩 영역(FVG-BB Overlap)이 바로 매수 진입의 근거가 됩니다. (코드가 dbgRequireRetracement 설정에 따라 FVG로의 되돌림을 기다리거나 즉시 진입 신호를 보냅니다.)
Short (매도) 진입:
가격이 상승하며 **'상승형 브레이커 블록(Bullish Breaker Block)'**을 만듭니다.
이후 가격이 하락 돌파하며 이 브레이커 블록 영역과 중첩되는 **'하락형 FVG(Bearish FVG)'**를 생성합니다.
이 중첩 영역이 매도 진입의 근거가 됩니다.
3. 📊 부가 기능
시각화: 차트 상에 FVG 영역과 Breaker Block 영역을 박스로 그려주어(설정에 따라 표시/숨김 가능) 매매 근거를 시각적으로 확인할 수 있게 합니다.
백테스팅 대시보드: 차트 우측 상단(기본값)에 이 전략의 누적 성과(총 진입 횟수, 승/패, 승률, 총수익률)를 보여주는 대시보드를 표시합니다.
요약
이 스크립트는 **"Breaker Block과 FVG의 중첩(유니콘 모델)"**을 유일한 진입 조건으로 사용하는 매우 구체적인 ICT 전략입니다. 이 조건이 충족되면, 사용자가 미리 설정한 상세한 리스크 관리 값들을 담아 자동매매 봇으로 즉시 실행 가능한 주문 신호를 전송하는 '올인원(All-in-One)' 전략 스크립트입니다.
요청하신 대로, 해당 지표 요약본을 영어로 번역하여 제공합니다.
This script is an automated trading (Autotrade) strategy signal generator based on the ICT "Unicorn" trading model.
As the "AUTOTRADE" in its name implies, the core purpose of this indicator is to detect specific conditions on the chart and send JSON-formatted order signals (webhooks) to an external automated trading bot.
Here are the core mechanics and features of this script:
1. 🎯 Core Feature: Automated Signal Transmission (Webhook)
Whenever a trade signal occurs, this script generates a specific JSON message by combining the values entered by the user in the "Autotrade Settings" and sends it via webhook using the alert() function.
Input Settings: It takes inputs for user_id, exchange, leverage, capital_percent (equity %), sl_percent (stop loss %), and settings for 3-stage split take-profits (e.g., tp1_price_percent, tp1_qty_percent).
Signal Types:
ENTRY: When a "buy" or "sell" signal occurs, it sends an entry command including all the settings above.
CLOSE (Stop-Loss): If the price hits the stop loss according to the strategy's internal logic (slAlertTick), it sends a signal to close the position.
TAKE_PROFIT: When a profit target is reached (tpAlertTick), it sends a signal to take profit on the specified quantity.
2. 📈 How It Works: The "ICT Unicorn" Strategy
The script's entry logic follows the "Unicorn Model," one of the concepts from ICT (Inner Circle Trader).
Identifying Components:
Breaker Block (BB): It identifies a "Breaker Block." This is an Order Block that, after creating a specific high/low, fails to continue in that direction and is instead broken through in the opposite direction.
Fair Value Gap (FVG): It identifies a "Fair Value Gap" (a price imbalance area).
Core Entry Signal (The Unicorn): The core entry condition for this strategy is the overlap of a Breaker Block (BB) and a Fair Value Gap (FVG), which creates a powerful support/resistance zone known as the "Unicorn."
Long Entry:
Price moves down, creating a "Bearish Breaker Block."
Subsequently, price breaks upward, creating a "Bullish FVG" that overlaps with this Breaker Block area.
This overlapping area (FVG-BB Overlap) becomes the basis for the long entry. (Depending on the dbgRequireRetracement setting, the code either waits for a retracement to the FVG or sends an immediate entry signal.)
Short Entry:
Price moves up, creating a "Bullish Breaker Block."
Subsequently, price breaks downward, creating a "Bearish FVG" that overlaps with this Breaker Block area.
This overlapping area becomes the basis for the short entry.
3. 📊 Additional Features
Visualization: It draws the FVG and Breaker Block zones as boxes on the chart (can be toggled in settings), allowing for visual confirmation of the trade setup.
Backtesting Dashboard: It displays a dashboard in the top-right corner (by default) showing the strategy's cumulative performance (total entries, wins/losses, win rate, total profit).
Summary
This script is a highly specific ICT strategy that uses the "overlap of a Breaker Block and an FVG (the Unicorn Model)" as its sole entry condition. When this condition is met, it transmits an immediately executable order signal to an automated trading bot, complete with all the detailed risk management values preset by the user. It is an "all-in-one" strategy script.

Katz Exploding PowerBand FilterUnderstanding the Katz Exploding PowerBand Filter (EPBF) v2.4
1. Indicator Overview
The Katz Exploding PowerBand Filter (EPBF) is an advanced technical indicator designed to identify moments of expanding bullish or bearish momentum, often referred to as "power." It operates as a standalone oscillator in a separate pane below the main price chart.
Its primary goal is to measure underlying market strength by calculating custom "Bull" and "Bear" power components. These components are then filtered through a versatile moving average and a dual signal line system to generate clear entry and exit signals. This indicator is not a simple momentum oscillator; it uses a unique calculation based on exponential envelopes of both price and squared price to derive its values.
2. On-Chart Lines and Components
The indicator pane consists of five main lines:
Bullish Component (Thick Green/Blue/Yellow/Gray Line): This is the core of the indicator. It represents the calculated bullish "power" or momentum in the market.
Bright Green: Indicates a strong, active long signal condition.
Blue: Shows the bull component is above the MA filter, but the filter itself is still pointing down—a potential sign of a reversal or weakening downtrend.
Yellow: A warning sign that bullish power is weakening and has fallen below the primary signal lines.
Gray: Represents neutral or insignificant bullish power.
Bearish Component (Thick Red/Purple/Yellow/Gray Line): This line represents the calculated bearish "power" or downward momentum.
Bright Red: Indicates a strong, active short signal condition.
Purple: Shows the bear component is above the MA filter, but the filter itself is still pointing down—a sign of potential trend continuation.
Yellow: A warning sign that bearish power is weakening.
Gray: Represents neutral or insignificant bearish power.
MA Filter (Purple Line): This is the main filter, calculated using the moving average type and length you select in the settings (e.g., HullMA, EMA). The Bull and Bear components are compared against this line to determine the underlying trend bias.
Signal Line 1 (Orange Line): A fast Exponential Moving Average (EMA) of the stronger power component. It acts as the first level of dynamic support or resistance for the power lines.
Signal Line 2 (Lime/Gray Line): A slower EMA that acts as a confirmation filter.
Lime Green: The line turns lime when it is rising and the faster Signal Line 1 is above it, indicating a confirmed bullish trend in momentum.
Gray: Indicates a neutral or bearish momentum trend.
3. On-Chart Symbols and Their Meanings
Various characters are plotted at the bottom of the indicator pane to provide clear, actionable signals.
L (Pre-Long Signal): The first sign of a potential long entry. It appears when the Bullish Component rises and crosses above both signal lines for the first time.
S (Pre-Short Signal): The first sign of a potential short entry. It appears when the Bearish Component rises and crosses above both signal lines for the first time.
▲ (Post-Long Signal): A stronger confirmation for a long entry. It appears with the 'L' signal only if the momentum trend is also confirmed bullish (i.e., the slower Signal Line 2 is lime green).
▼ (Post-Short Signal): A stronger confirmation for a short entry. It appears with the 'S' signal only if the momentum trend is confirmed bullish.
Exit / Take-Profit Symbols:
These symbols appear when a power component crosses below a line, suggesting that momentum is fading and it may be time to take profit.
⚠️ (Exit Signal 1): The Bull/Bear component has crossed below the main MA Filter. This is the first and most sensitive take-profit signal.
☣️ (Exit Signal 2): The Bull/Bear component has crossed below the faster Signal Line 1. This is a moderate take-profit signal.
🚼 (Exit Signal 3): The Bull/Bear component has crossed below the slower Signal Line 2. This is the slowest take-profit signal, suggesting the trend is more definitively exhausted.
4. Trading Strategy and Rules
Long Entry Rules:
Initial Signal: Wait for an L to appear at the bottom of the indicator. This confirms that bullish power is expanding.
Confirmation (Recommended): For a higher-probability trade, wait for a green ▲ symbol to appear. This confirms the underlying momentum trend aligns with the signal.
Entry: Enter a long (buy) position on the opening of the next candle after the signal appears.
Short Entry Rules:
Initial Signal: Wait for an S to appear at the bottom of the indicator. This confirms that bearish power is expanding.
Confirmation (Recommended): For a higher-probability trade, wait for a maroon ▼ symbol to appear. This confirms the underlying momentum trend aligns with the signal.
Entry: Enter a short (sell) position on the opening of the next candle after the signal appears.
Take Profit (TP) Rules:
The indicator provides three levels of take-profit signals. You can choose to exit your entire position or scale out at each level.
For a long trade, exit when you see ⚠️, ☣️, or 🚼 appear below the Bullish Component.
For a short trade, exit when you see ⚠️, ☣️, or 🚼 appear below the Bearish Component.
Stop Loss (SL) Rules:
The indicator does not provide an explicit stop loss. You must use your own risk management rules. Common methods include:
Swing High/Low: For a long position, place your stop loss below the most recent significant swing low on the price chart. For a short position, place it above the most recent swing high.
ATR-Based: Use an Average True Range (ATR) indicator to set a volatility-based stop loss.
Fixed Percentage: Risk a fixed percentage (e.g., 1-2%) of your account on the trade.
5. Disclaimer
This indicator is a tool for technical analysis and should not be considered financial advice. All trading involves significant risk, and past performance is not indicative of future results. The signals generated by this indicator are probabilistic and can result in losing trades. Always use proper risk management, such as setting a stop loss, and never risk more than you are willing to lose. It is recommended to backtest this indicator and use it in conjunction with other forms of analysis before trading with real capital. The indicator should only be used for educational purposes.

EAOBS by MIGVersion 1
1. Strategy Overview Objective: Capitalize on breakout movements in Ethereum (ETH) price after the Asian open pre-market session (7:00 PM–7:59 PM EST) by identifying high and low prices during the session and trading breakouts above the high or below the low.
Timeframe: Any (script is timeframe-agnostic, but align with session timing).
Session: Pre-market session (7:00 PM–7:59 PM EST, adjustable for other time zones, e.g., 12:00 AM–12:59 AM GMT).
Risk-Reward Ratios (R:R): Targets range from 1.2:1 to 5.2:1, with a fixed stop loss.
Instrument: Ethereum (ETH/USD or ETH-based pairs).
2. Market Setup Session Monitoring: Monitor ETH price action during the pre-market session (7:00 PM–7:59 PM EST), which aligns with the Asian market open (e.g., 9:00 AM–9:59 AM JST).
The script tracks the highest high and lowest low during this session.
Breakout Triggers: Buy Signal: Price breaks above the session’s high after the session ends (7:59 PM EST).
Sell Signal: Price breaks below the session’s low after the session ends.
Visualization: The session is highlighted on the chart with a white background.
Horizontal lines are drawn at the session’s high and low, extended for 30 bars, along with take-profit (TP) and stop-loss (SL) levels.
3. Entry Rules Long (Buy) Entry: Enter a long position when the price breaks above the session’s high price after 7:59 PM EST.
Entry price: Just above the session high (e.g., add a small buffer, like 0.1–0.5%, to avoid false breakouts, depending on volatility).
Short (Sell) Entry: Enter a short position when the price breaks below the session’s low price after 7:59 PM EST.
Entry price: Just below the session low (e.g., subtract a small buffer, like 0.1–0.5%).
Confirmation: Use a candlestick close above/below the breakout level to confirm the entry.
Optionally, add volume confirmation or a momentum indicator (e.g., RSI or MACD) to filter out weak breakouts.
Position Size: Calculate position size based on risk tolerance (e.g., 1–2% of account per trade).
Risk is determined by the stop-loss distance (10 points, as defined in the script).
4. Exit Rules Take-Profit Levels (in points, based on script inputs):TP1: 12 points (1.2:1 R:R).
TP2: 22 points (2.2:1 R:R).
TP3: 32 points (3.2:1 R:R).
TP4: 42 points (4.2:1 R:R).
TP5: 52 points (5.2:1 R:R).
Example for Long: If session high is 3000, TP levels are 3012, 3022, 3032, 3042, 3052.
Example for Short: If session low is 2950, TP levels are 2938, 2928, 2918, 2908, 2898.
Strategy: Scale out of the position (e.g., close 20% at TP1, 20% at TP2, etc.) or take full profit at a preferred TP level based on market conditions.
Stop-Loss: Fixed at 10 points from the entry.
Long SL: Session high - 10 points (e.g., entry at 3000, SL at 2990).
Short SL: Session low + 10 points (e.g., entry at 2950, SL at 2960).
Trailing Stop (Optional):After reaching TP2 or TP3, consider trailing the stop to lock in profits (e.g., trail by 10–15 points below the current price).
5. Risk Management per Trade: Limit risk to 1–2% of your trading account per trade.
Calculate position size: Account Size × Risk % ÷ (Stop-Loss Distance × ETH Price per Point).
Example: $10,000 account, 1% risk = $100. If SL = 10 points and 1 point = $1, position size = $100 ÷ 10 = 0.1 ETH.
Daily Risk Limit: Cap daily losses at 3–5% of the account to avoid overtrading.
Maximum Exposure: Avoid taking both long and short positions simultaneously unless using separate accounts or strategies.
Volatility Consideration: Adjust position size during high-volatility periods (e.g., major news events like Ethereum upgrades or macroeconomic announcements).
6. Trade Management Monitoring :Watch for breakouts after 7:59 PM EST.
Monitor price action near TP and SL levels using alerts or manual checks.
Trade Duration: Breakout lines extend for 30 bars (script parameter). Close trades if no TP or SL is hit within this period, or reassess based on market conditions.
Adjustments: If the market shows strong momentum, consider holding beyond TP5 with a trailing stop.
If the breakout fails (e.g., price reverses before TP1), exit early to minimize losses.
7. Additional Considerations Market Conditions: The 7:00 PM–7:59 PM EST session aligns with the Asian market open (e.g., Tokyo Stock Exchange open at 9:00 AM JST), which may introduce higher volatility due to Asian trading activity.
Avoid trading during low-liquidity periods or extreme volatility (e.g., major crypto news).
Check for upcoming events (e.g., Ethereum network upgrades, ETF decisions) that could impact price.
Backtesting: Test the strategy on historical ETH data using the session high/low breakouts for the 7:00 PM–7:59 PM EST window to validate performance.
Adjust TP/SL levels based on backtest results if needed.
Broker and Fees: Use a low-fee crypto exchange (e.g., Binance, Kraken, Coinbase Pro) to maximize R:R.
Account for trading fees and slippage in your position sizing.
Time zone Adjustment: Adjust session time input for your time zone (e.g., "0000-0059" for GMT).
Ensure your trading platform’s clock aligns with the script’s time zone (default: America/New_York).
8. Example Trade Scenario: Session (7:00 PM–7:59 PM EST) records a high of 3050 and a low of 3000.
Long Trade: Entry: Price breaks above 3050 (e.g., enter at 3051).
TP Levels: 3063 (TP1), 3073 (TP2), 3083 (TP3), 3093 (TP4), 3103 (TP5).
SL: 3040 (3050 - 10).
Position Size: For a $10,000 account, 1% risk = $100. SL = 11 points ($11). Size = $100 ÷ 11 = ~0.09 ETH.
Short Trade: Entry: Price breaks below 3000 (e.g., enter at 2999).
TP Levels: 2987 (TP1), 2977 (TP2), 2967 (TP3), 2957 (TP4), 2947 (TP5).
SL: 3010 (3000 + 10).
Position Size: Same as above, ~0.09 ETH.
Execution: Set alerts for breakouts, enter with limit orders, and monitor TPs/SL.
9. Tools and Setup Platform: Use TradingView to implement the Pine Script and visualize breakout levels.
Alerts: Set price alerts for breakouts above the session high or below the session low after 7:59 PM EST.
Set alerts for TP and SL levels.
Chart Settings: Use a 1-minute or 5-minute chart for precise session tracking.
Overlay the script to see high/low lines, TP levels, and SL levels.
Optional Indicators: Add RSI (e.g., avoid overbought/oversold breakouts) or volume to confirm breakouts.
10. Risk Warnings Crypto Volatility: ETH is highly volatile; unexpected news can cause rapid price swings.
False Breakouts: Breakouts may fail, especially in low-volume sessions. Use confirmation signals.
Leverage: Avoid high leverage (e.g., >5x) to prevent liquidation during volatile moves.
Session Accuracy: Ensure correct session timing for your time zone to avoid misaligned entries.
11. Performance Tracking Journaling :Record each trade’s entry, exit, R:R, and outcome.
Note market conditions (e.g., trending, ranging, news-driven).
Review: Weekly: Assess win rate, average R:R, and adherence to the plan.
Monthly: Adjust TP/SL or session timing based on performance.

ai quant oculusAI QUANT OCULUS
Version 1.0 | Pine Script v6
Purpose & Innovation
AI QUANT OCULUS integrates four distinct technical concepts—exponential trend filtering, adaptive smoothing, momentum oscillation, and Gaussian smoothing—into a single, cohesive system that delivers clear, objective buy and sell signals along with automatically plotted stop-loss and three profit-target levels. This mash-up goes beyond a simple EMA crossover or standalone TRIX oscillator by requiring confluence across trend, adaptive moving averages, momentum direction, and smoothed price action, reducing false triggers and focusing on high‐probability turning points.
How It Works & Why Its Components Matter
Trend Filter: EMA vs. Adaptive MA
EMA (20) measures the prevailing trend with fixed sensitivity.
Adaptive MA (also EMA-based, length 10) approximates a faster-responding moving average, standing in for a KAMA-style filter.
Bullish bias requires AMA > EMA; bearish bias requires AMA < EMA. This ensures signals align with both the underlying trend and a more nimble view of recent price action.
Momentum Confirmation: TRIX
Calculates a triple-smoothed EMA of price over TRIX Length (15), then converts it to a percentage rate-of-change oscillator.
Positive TRIX reinforces bullish entries; negative TRIX reinforces bearish entries. Using TRIX helps filter whipsaws by focusing on sustained momentum shifts.
Gaussian Price Smoother
Applies two back-to-back 5-period EMAs to the price (“gaussian” smoothing) to remove short-term noise.
Price above the smoothed line confirms strength for longs; below confirms weakness for shorts. This layer avoids entries on erratic spikes.
Confluence Signals
Buy Signal (isBull) fires only when:
AMA > EMA (trend alignment)
TRIX > 0 (momentum support)
Close > Gaussian (price strength)
Sell Signal (isBear) fires under the inverse conditions.
Requiring all three conditions simultaneously sharply reduces false triggers common to single-indicator systems.
Automatic Risk & Reward Plotting
On each new buy or sell signal (edge detection via not isBull or not isBear ), the script:
Stores entryPrice at the signal bar’s close.
Draws a stop-loss line at entry minus ATR(14) × Stop Multiplier (1.5) by default.
Plots three profit-target lines at entry plus ATR × Target Multiplier (1×, 1.5×, and 2×).
All previous labels and lines are deleted on each new signal, keeping the chart uncluttered and focusing only on the current trade.
Inputs & Customization
Input Description Default
EMA Length Period for the main trend EMA 20
Adaptive MA Length Period for the faster adaptive EM A substitute 10
TRIX Length Period for the triple-smoothed momentum oscillator 15
Dominant Cycle Length (Reserved) 40
Stop Multiplier ATR multiple for stop-loss distance 1.5
Target Multiplier ATR multiple for first profit target 1.5
Show Buy/Sell Signals Toggle on-chart labels for entry signals On
How to Use
Apply to Chart: Best on 15 m–1 h timeframes for swing entries or 5 m for agile scalps.
Wait for Full Confluence:
Look for the AMA to cross above/below the EMA and verify TRIX and Gaussian conditions on the same bar.
A bright “LONG” or “SHORT” label marks your entry.
Manage the Trade:
Place your stop where the red or green SL line appears.
Scale or exit at the three yellow TP1/TP2/TP3 lines, automatically drawn by volatility.
Repeat Cleanly: Each new signal clears prior annotations, ensuring you only track the active setup.
Why This Script Stands Out
Multi-Layer Confluence: Trend, momentum, and noise-reduction must all align, addressing the weaknesses of single-indicator strategies.
Automated Trade Management: No manual plotting—stop and target lines appear seamlessly with each signal.
Transparent & Customizable: All logic is open, adjustable, and clearly documented, allowing traders to tweak lengths and multipliers to suit different instruments.
Disclaimer
No indicator guarantees profit. Always backtest AI QUANT OCULUS extensively, combine its signals with your own analysis and risk controls, and practice sound money management before trading live.

AI QUANT OCULUSAI QUANT OCULUS
Version 1.0 | Pine Script v6
Purpose & Innovation
AI QUANT OCULUS integrates four distinct technical concepts—exponential trend filtering, adaptive smoothing, momentum oscillation, and Gaussian smoothing—into a single, cohesive system that delivers clear, objective buy and sell signals along with automatically plotted stop-loss and three profit-target levels. This mash-up goes beyond a simple EMA crossover or standalone TRIX oscillator by requiring confluence across trend, adaptive moving averages, momentum direction, and smoothed price action, reducing false triggers and focusing on high‐probability turning points.
How It Works & Why Its Components Matter
Trend Filter: EMA vs. Adaptive MA
EMA (20) measures the prevailing trend with fixed sensitivity.
Adaptive MA (also EMA-based, length 10) approximates a faster-responding moving average, standing in for a KAMA-style filter.
Bullish bias requires AMA > EMA; bearish bias requires AMA < EMA. This ensures signals align with both the underlying trend and a more nimble view of recent price action.
Momentum Confirmation: TRIX
Calculates a triple-smoothed EMA of price over TRIX Length (15), then converts it to a percentage rate-of-change oscillator.
Positive TRIX reinforces bullish entries; negative TRIX reinforces bearish entries. Using TRIX helps filter whipsaws by focusing on sustained momentum shifts.
Gaussian Price Smoother
Applies two back-to-back 5-period EMAs to the price (“gaussian” smoothing) to remove short-term noise.
Price above the smoothed line confirms strength for longs; below confirms weakness for shorts. This layer avoids entries on erratic spikes.
Confluence Signals
Buy Signal (isBull) fires only when:
AMA > EMA (trend alignment)
TRIX > 0 (momentum support)
Close > Gaussian (price strength)
Sell Signal (isBear) fires under the inverse conditions.
Requiring all three conditions simultaneously sharply reduces false triggers common to single-indicator systems.
Automatic Risk & Reward Plotting
On each new buy or sell signal (edge detection via not isBull or not isBear ), the script:
Stores entryPrice at the signal bar’s close.
Draws a stop-loss line at entry minus ATR(14) × Stop Multiplier (1.5) by default.
Plots three profit-target lines at entry plus ATR × Target Multiplier (1×, 1.5×, and 2×).
All previous labels and lines are deleted on each new signal, keeping the chart uncluttered and focusing only on the current trade.
Inputs & Customization
Input Description Default
EMA Length Period for the main trend EMA 20
Adaptive MA Length Period for the faster adaptive EM A substitute 10
TRIX Length Period for the triple-smoothed momentum oscillator 15
Dominant Cycle Length (Reserved) 40
Stop Multiplier ATR multiple for stop-loss distance 1.5
Target Multiplier ATR multiple for first profit target 1.5
Show Buy/Sell Signals Toggle on-chart labels for entry signals On
How to Use
Apply to Chart: Best on 15 m–1 h timeframes for swing entries or 5 m for agile scalps.
Wait for Full Confluence:
Look for the AMA to cross above/below the EMA and verify TRIX and Gaussian conditions on the same bar.
A bright “LONG” or “SHORT” label marks your entry.
Manage the Trade:
Place your stop where the red or green SL line appears.
Scale or exit at the three yellow TP1/TP2/TP3 lines, automatically drawn by volatility.
Repeat Cleanly: Each new signal clears prior annotations, ensuring you only track the active setup.
Why This Script Stands Out
Multi-Layer Confluence: Trend, momentum, and noise-reduction must all align, addressing the weaknesses of single-indicator strategies.
Automated Trade Management: No manual plotting—stop and target lines appear seamlessly with each signal.
Transparent & Customizable: All logic is open, adjustable, and clearly documented, allowing traders to tweak lengths and multipliers to suit different instruments.
Disclaimer
No indicator guarantees profit. Always backtest AI QUANT OCULUS extensively, combine its signals with your own analysis and risk controls, and practice sound money management before trading live.

Volume Strength IndicatorThis Indicator is built to give you an edge into the market. Given volume, volatility and price-action, it compares market conditions against the maximum that have occurred so far in the session. Useful for intraday and day trading for timing entries with the smart money.
The green/red histogram gives us a view into the relative strength of the current bar, whether they have strong buying or selling power.
The orange signal line gives us a view of the recent trend, which can be modified using the various inputs.

Cosmic Crypto Golden ZoneCosmic Crypto Golden Zone
## Overview
**Cosmic Crypto Golden Zone** is an all-in-one swing trading indicator designed to identify high-probability retracement entries using Fibonacci levels, multi-timeframe confluence, and a simple Buy/Sell scoring system. The indicator removes the guesswork from trading pullbacks by combining structure analysis, momentum indicators, and volume confirmation into a single, easy-to-read signal.
**Best Used For:** Swing trading on 15m, 1H, and 4H timeframes in crypto, forex, and stocks.
---
## Key Features
### 🎯 Golden Zone Detection
Automatically identifies the optimal entry zone (0.5 - 0.786 Fibonacci retracement) where price is most likely to reverse and continue the trend.
### 📊 Buy/Sell Scoring (1-10)
A simplified signal table that scores setups from 1-10, telling you exactly when to buy or sell without needing to interpret multiple indicators.
### 📈 Multi-Timeframe Confluence
Filters trades to align with the higher timeframe trend (default: 4H), ensuring you only trade in the dominant direction.
### 🔍 Structure Detection (HH/HL/LH/LL)
Tracks market structure with Higher Highs, Higher Lows, Lower Highs, and Lower Lows to determine trend direction.
### 💧 Liquidity Sweep Detection
Identifies when price sweeps beyond the 0.886 level (stop-hunting zone) and reclaims the entry zone—a premium reversal signal.
### 📉 RSI Divergence Detection
Spots bullish and bearish divergences within the golden zone for additional confirmation.
### 🛡️ Dynamic Stop Loss
ATR-based stop loss that adjusts to current volatility, protecting you in both calm and volatile markets.
### 🎯 Smart Take Profit
Calculates TP based on your chosen entry point (FOMO, ENTRY, or Average) with customizable Risk:Reward targeting.
---
## How to Read the Signal Table
The table in the bottom-right corner gives you everything you need at a glance:
| Row | What It Shows |
|-----|---------------|
| **BUY/SELL + Score** | Direction and strength (1-10) |
| **Action** | 🚀 NOW (8+), ✓ READY (6-7), 👀 WATCH (4-5), ⏳ WAIT (<4) |
| **Zone** | Whether price is IN the golden zone or waiting |
| **Entry / TP / SL** | Your exact trade levels |
| **R:R** | Risk-to-Reward ratio with quality indicator |
### Score Breakdown
| Score | Meaning | Action |
|-------|---------|--------|
| **8-10** | High conviction setup | Enter on next candle close |
| **6-7** | Good setup | Enter with confirmation candle |
| **4-5** | Possible setup | Wait for more confluence |
| **1-3** | Weak/No setup | Skip this trade |
---
## How to Use: Step-by-Step
### Step 1: Check the Trend Direction
Look at the **Structure** in the info display:
- **BULLISH** (HH + HL pattern) → Only look for BUY signals
- **BEARISH** (LL + LH pattern) → Only look for SELL signals
### Step 2: Wait for Price to Enter the Golden Zone
The golden zone is highlighted between the **FOMO (0.618)** and **ENTRY (0.786)** levels. The table will show "✓ IN ZONE" when price reaches this area.
### Step 3: Check Your Score
Wait for the Buy/Sell score to reach **6 or higher** before considering an entry. Higher scores = higher probability.
### Step 4: Look for Confirmation
The best entries have multiple confirmations:
- ✅ Score 6+
- ✅ In Golden Zone
- ✅ Stochastic oversold/overbought
- ✅ RSI Divergence (DIV label)
- ✅ Liquidity Sweep (LIQ label) — *Premium signal*
- ✅ Bullish/Bearish candle pattern
### Step 5: Execute the Trade
Use the levels shown on the chart and in the table:
- **Entry:** FOMO (aggressive) or ENTRY (conservative)
- **Stop Loss:** Below/above the SL line (red)
- **Take Profit:** At the TP line (green)
---
## Chart Labels Explained
| Label | Color | Meaning |
|-------|-------|---------|
| **FOMO: ** | Green | 0.618 Fib - Aggressive entry level |
| **ENTRY: ** | Yellow (Bold) | 0.786 Fib - Conservative entry level |
| **LIQ: ** | Red | 0.886 Fib - Liquidity/stop-hunt zone |
| **TP: ** | Green | Take Profit target |
| **SL: ** | Red (Bold) | Stop Loss level |
| **R:R ** | Green/Orange | Risk-to-Reward ratio |
| **HH/HL/LH/LL** | Various | Structure swing labels |
| **DIV** | Lime/Pink | RSI Divergence detected |
| **LIQ** (arrow) | Lime/Red | Liquidity sweep signal |
| **AE** | Green/Red | Williams Vix Fix Aggressive Entry |
| **B/S** | Green/Red | Buy/Sell signal with score |
---
## Recommended Settings
### For Crypto (BTC, ETH, Altcoins)
- **Timeframe:** 1H or 4H
- **HTF:** 4H or Daily
- **Use Logarithmic Fibs:** ✅ ON
- **TP R:R Target:** 2.0 - 3.0
### For Forex
- **Timeframe:** 15m or 1H
- **HTF:** 4H
- **Use Logarithmic Fibs:** ❌ OFF
- **TP R:R Target:** 1.5 - 2.0
### For Stocks
- **Timeframe:** 1H or Daily
- **HTF:** Daily or Weekly
- **Use Logarithmic Fibs:** ✅ ON
- **TP R:R Target:** 2.0
---
## Settings Reference
### Structure (ZigZag)
- **Left Bars:** Lookback period for pivot detection (default: 10)
- **Right Bars:** Confirmation bars (default: 2)
- **Show Swing Labels:** Display HH/HL/LH/LL markers
### Multi-Timeframe Confluence
- **Enable MTF Filter:** Only trade when aligned with HTF trend
- **Higher Timeframe:** The timeframe to check trend (default: 4H)
### ADX Trend Strength
- **Enable ADX Filter:** Filter out choppy/ranging markets
- **ADX Threshold:** Minimum ADX value for trend confirmation (default: 20)
### Auto Fib Settings
- **Use Logarithmic Fibs:** Better for large % moves (crypto/stocks)
- **Fib Length:** How far the fib lines extend
### Split-Entry Trade Planner
- **Entry 1 Ratio:** FOMO level (default: 0.618)
- **Entry 2 Ratio:** ENTRY level (default: 0.786)
- **TP Calculation Mode:** Base TP on ENTRY, FOMO, or Average
- **TP R:R Target:** Your desired risk-to-reward ratio
- **Use ATR-Based Dynamic SL:** Volatility-adjusted stop loss
- **SL ATR Multiplier:** How many ATRs below entry for SL
### Williams Vix Fix
- **Show Bullish/Bearish AE:** Aggressive entry signals based on volatility extremes
- **Only Show in Golden Zone:** Filter VixFix signals to golden zone only
---
## Pro Tips
### 1. The Liquidity Sweep is Gold
When you see the **LIQ** arrow after price wicks below 0.886 and reclaims 0.786, this is often the best entry. Stops have been hunted, weak hands are out, and smart money is entering.
### 2. Don't Fight the HTF Trend
If the 4H is bearish, don't take long signals on the 15m just because the score is high. Always align with the bigger picture.
### 3. Wait for "IN ZONE"
Patience pays. The best setups come when price actually pulls back to the golden zone. Chasing breakouts leads to poor R:R.
### 4. Score 6+ is the Minimum
Scores of 4-5 can work, but your win rate will be significantly higher waiting for 6+. Scores of 8+ are rare but highly reliable.
### 5. Use Multiple Timeframes
Check the setup on your trading timeframe AND one timeframe higher. If both show bullish structure with good scores, confidence is higher.
### 6. Respect the Stop Loss
The SL is placed below the liquidity zone for a reason. If price closes below it, the setup is invalidated. Don't move your stop.
---
## Alerts Available
- **High Confluence Long/Short** — When score reaches your threshold
- **Bullish/Bearish Liquidity Sweep** — Premium reversal signal
- **RSI Divergence Detected** — Divergence in golden zone
- **Williams Vix Fix AE** — Aggressive entry signal
---
## Credits
Created by **Cosmic Crypto**
Combines concepts from:
- Fibonacci Retracement Trading
- Smart Money Concepts (Liquidity Sweeps)
- Williams Vix Fix
- Multi-Timeframe Analysis
- Stochastic RSI
- ADX Trend Strength
---
*Trade responsibly. Past performance does not guarantee future results. Always use proper risk management.*

Chartology Strategy+🔍 Chartology Strategy+
This tool provides a comprehensive way for users to analyze trend levels and access other Matrix features across selected tickers and timeframes. Results can be tailored by strategy, with the option to filter displayed tickers based on custom user‑defined rules.
Bullish & Bearish Entry Signal (Safe & Scalping).
Entry Level, SL, T-SL & Two TP Levels (Based on Possible Movement).
Dashboard Table for Easy Presentation of All Levels.
Timeframe Scanner for Current Signal (Trend) on Different Timeframes.
Gap Up & Gap Down for Untraded Price Marking.
Institutional Candles for High Volume and Big Price Movement.
Neutral Candle for Low Volume and Small Price Movement.
Supply Demand (Based on Swing High & Low).
Mega Trend Band (Based on HMA) for Overall Trend.
🟢 Bullish & Bearish Entry Signals
Shows the expected direction of the symbol. It shows Bullish and Bearish direction mark on Chart. Entry Level is Closing of the Candle.
Input Settings
Signal Type: Safe
Appears after a proper trend confirmation.
Low frequency, fewer signals, but more reliable.
Best for swing traders who want strong confirmation before entering.
Signal Type: Scalping
Appears frequently during small downward moves.
High frequency, quick signals for short-term trades.
Best for intraday
Traders who want multiple opportunities in small movements.
🎯 Entry Level, SL, T-SL & TP Levels
Generated based on price movement and trend range.
Levels on Chart
Entry Level: Closing price of the candle where the signal appears.
SL (Stop Loss): Maximum risk allowed for the trade.
TSL (Trailing SL): Dynamic SL to reduce risk and lock profits.
Level 01: First TP level with 1:1 risk-reward ratio. Used for partial booking.
Level 02: Final TP level for full exit.
Input Settings
Levels: You can Increase or Decrease Level Amount for the Level 2.
Risk: You can Increase or Decrease Stop Loss (SL).
📊 Dashboard Table for Easy Presentation of All Levels.
Displays all key levels and metrics in one place:
Metrics
Symbol Name Shows the name of the current chart (e.g., NIFTY, BANKNIFTY).
Bar Age Displays the How many candles (Bars) before Latest signal appears.
Entry Shows the entry level where the latest bullish or bearish signal was generated.
Level 1 (TP1) First target level, based on 1:1 risk-reward ratio. Used for partial booking to secure profits.
Level 2 (TP2) Final target level where you can exit the remaining position.
SL (Stop Loss) Shows the maximum risk limit for the trade. Helps you control losses.
MTM (Mark to Market) Shows the difference between CMP and Entry Level. Helps track how far price has moved since entry.
P&L (Profit & Loss) Shows the difference between Entry and Target Level achieved. Helps measure actual gain or loss.
Date & Time Displays when the latest bullish or bearish signal was generated. Helps check how old or fresh the signal is.
Timeframe Scanner or Current Signal (Trend) on Different Timeframes. Shows the current signal across multiple timeframes.
Row 1 Fixed signals for 1M and 3M.
Row 2 Any 2 Custom Timeframes chosen in input settings.
Traders use this to confirm signals across different timeframes before entering trades. Example If the Day trend is bullish but the 15M chart shows bearish, many traders avoid that trade.
🚦 Gap Up & Gap Down for Untraded Price Marking.
Marks untraded price zones where price may react.
Gap Up & Down Flag Mark
Gap Up: Bullish Bias, Marked Green flag, plotted when candle opens above previous high.
Gap Down: Bearish Bias, Marked as Red flag, plotted when candle opens below previous low.
Input Settings
Enable / Disable from Chart
Threshold: Minimum gap size Threshold to detect
🟡 Institutional Candles for High Volume and Big Price Movement
Indicate strong price movement with high volume.
Marking
Displayed as Yellow Body Candles
Helps identify zones where big players are active.
Input Settings
Enable / Disable from Chart
Body %: Compare of Open & Close with High & Low
Size %: Compare Total Candle Size from Past Range
Volume %: Compare Total Candle Volume from Past Range
⚪ Neutral Candle for Low Volume and Small Price Movement
Shows low volume and minimal price movement.
Marking
Displayed as Hollow Body Candles
Traders usually avoid trading during these candles.
Input Settings
Enable / Disable from Chart.
Candle %: Compare Size of candles.
Volume %: Compare Volume of Candles from Previous Range.
🟥🟩 Supply Demand Zones (Based on Swing High & Low).
Based on swing highs and lows to identify possible reversals.
Zones
🟥Supply Zone: Near swing high, marked with Light Red Zone.
🟩Demand Zone: Near swing low, marked with Light Green Zone.
Input Settings:
Bars Left: How many past Bars Swing will Calculate.
Bars Right: After How many Bars, Zone will plot.
Max Zones: Number of Supply or Demand Zone want to plot on Chart
Delete Breaked Zones: Want to see Disappeared Zone, Uncheck it.
Extend Right: Want to see till End of the Chart, Uncheck it.
📈 Mega Trend Band (Based on HMA) for Overall Trend
Based on HMA (Hull Moving Average) to show overall trend and Help in Filters out trades against the main trend.
Working
Price above band → Bullish trend
Price below band → Bearish trend
Input Setting
Enable / Disable from Chart
HMA Period Setting: 45
👓 How to Use All together for Better Confidence.
🔍Watch for the New Entry icon on the chart.
Find New Signals with help of Automated Alerts.
Check Entry Level, SL, Level 1 and Level 2 (TP2).
Verify Date & Time → how fresh the signal is. Signal not too old.
🧭 Signal is not Self Sufficient for Good Accuracy. So, we suggest a few rules.
Cross‑Check Current Signal with Timeframe Scanner. Trade only when smaller timeframe aligns with bigger trend. (e.g., If Day = Bullish ▲ but 15M = Bearish ▼, avoid entry. Trend may not be stronger.)
Validate with Market Context of Gap. (e.g., If new signal came on Gap Up / Gap Down, avoid entry. Price may reverse.)
Zone Awareness Use Supply Demand zones to refine entries/exits and avoid false signals. (e.g., Entry: If any zone is available between Entry and Level 01, Avoid trade until Zone breaked, Exit: If Zone create between the trade, modify SL according to T-SL and wait.
Trend Filter of overall direction. (e.g., If Mega Trend Band Bullish and Trend is Bearish, Avoid the Trade.)
🕵🏻 Quick Checklist Before Trade
Bullish or Bearish signal?
Dashboard Table shows fresh entry?
SL defined and acceptable risk?
Timeframe Scanner aligned?
No Neutral candle interference?
Institutional candle or Gap supports move?
Supply/Demand zone not against trade?
✅ All Okay - Go for the ENTRY
Set a Proper Entry Point
Always respect SL, Good Trader Never avoid it.
Book partial profits at Level 1, It secure your Trade.
Keep Modifying your SL, According to T-SL Level.
On Level 2, Exit remaining All position for full profit.
📊 Healthy Trading Tips
Risk Small: Never risk more than 1–2% per trade.
Size Smart: Adjust position size to volatility and account size.
Diversify: Don’t put all money in one asset/sector.
Plan Ahead: Set entry, exit, and stop‑loss before trading.
Trade Less: Focus on quality setups, avoid overtrading.
Use Both Analyses: Combine technical charts with fundamental news/events.
Control Emotions: Stick to strategy, avoid fear/greed.
Journal Trades: Record reasons, outcomes, and lessons.
Stay Informed: Track economic calendars and global events.
Take Breaks: Step away after wins/losses to reset.
🎯 Advanced Discipline
Partial Exit: Book profits in stages (e.g., 50% at 1:1, 50% at Final Level).
Check News: Avoid trading during major announcements.
No Tweaks: Don’t change plan mid‑trade; wait for SL/TP.
Fixed Rules: Trade with fixed risk, fixed gains.
No Averaging Losses: Close bad trades, don’t add more.
Keep Learning: Evolve strategy with market changes.
Believe: Trust your plan and process.
Backtest: Practice setups until they’re second nature.
Daily Routine: Pre‑market Preparation, post‑market review.
Optimize Setup: Clean workspace, fast platform, no distractions.
Track Metrics: Win rate, average reward, expectancy, time of day, setup performance.
Trader Identity: Follow rules; money is a byproduct.
Liquidity Check: Avoid low‑volume instruments.
Respect Trend: Trade with momentum, not against it.
Avoid Over‑Leverage: Keep leverage low, avoid margin unless planned.
Risk Disclaimer
This content, including any tools, software, datafeeds, indicators, or scanners, is provided strictly for charting, educational, informational, and paper‑trading purposes only. It does not constitute investment advice, buy/sell recommendations, or real‑money trading strategies.
Not Advisors: We are not registered as investment advisors or research analysts.
Charting Only: Use is limited to testing strategies and evaluation; any application to real trading is at the user’s sole risk.
No Liability: No liability is accepted for financial loss, trading loss, or damages arising from use of the tools or data.
Data Limitations: Market data may be delayed, inaccurate, or incomplete. Past or hypothetical performance is not indicative of future results.
Signals Disclaimer: Automated signals are for evaluation only and should not be treated as accurate or real trading instructions.
High Risk: Trading and investing involve substantial risk and can result in losses beyond the initial capital.
Independent Judgment: Users must exercise independent judgment and consult licensed professionals before making financial decisions
⚠️ Final Note: Trading is speculative and may not be suitable for all investors. Use only risk capital and never invest money you cannot afford to lose.
✅ Always remember🧠 my 3R Rule💡: If the money💰 is yours then, RISK⚖️, REWARD🏆 and REGRET😔 are solely yours. 🔥

SK Alpha SuiteTrend Dots
Aqua Level 1 Bullish Entry1
Green Level 2 Bullish Entry2
Lime Leve 3 Bullish Entry3 (Full Position)
Light Red Level 1 Bearish : Partial Close 10%-30%
Full Red Level 3 Bearish: Major Close
No StopLoss line hit or its already ended: Full close.
Purple/White Lines
Stop loss line, distance specific to each asset volatility, not fixed distance for all assets.
Close, Medium, Relaxed based on how close you want your stop loss to be.
With in bullish sentiment, if stoploss hits, stoploss will reset again on that bar, shown with white separation

Contrarian Period High & LowContrarian Period High & Low
This indicator pairs nicely with the Contrarian 100 MA and can be located here:
Overview
The "Contrarian Period High & Low" indicator is a powerful technical analysis tool designed for traders seeking to identify key support and resistance levels and capitalize on contrarian trading opportunities. By tracking the highest highs and lowest lows over user-defined periods (Daily, Weekly, or Monthly), this indicator plots historical levels and generates buy and sell signals when price breaks these levels in a contrarian manner. A unique blue dot counter and action table enhance decision-making, making it ideal for swing traders, trend followers, and those trading forex, stocks, or cryptocurrencies. Optimized for daily charts, it can be adapted to other timeframes with proper testing.
How It Works
The indicator identifies the highest high and lowest low within a specified period (e.g., daily, weekly, or monthly) and draws horizontal lines for the previous period’s extremes on the chart. These levels act as dynamic support and resistance zones. Contrarian signals are generated when the price crosses below the previous period’s low (buy signal) or above the previous period’s high (sell signal), indicating potential reversals. A blue dot counter tracks consecutive buy signals, and a table displays the count and recommended action, helping traders decide whether to hold or flip positions.
Key Components
Period High/Low Levels: Tracks the highest high and lowest low for each period, plotting red lines for highs and green lines for lows from the bar where they occurred, extending for a user-defined length (default: 200 bars).
Contrarian Signals: Generates buy signals (blue circles) when price crosses below the previous period’s low and sell signals (white circles) when price crosses above the previous period’s high, designed to capture potential reversals.
Blue Dot Tracker: Counts consecutive buy signals (“blue dots”). If three or more occur, it suggests a stronger trend, with the table recommending whether to “Hold Investment” or “Flip Investment.”
Action Table: A 2x2 table in the bottom-right corner displays the blue dot count and action (“Hold Investment” if count ≥ 4, else “Flip Investment”) for quick reference.
Mathematical Concepts
Period Detection: Uses an approximate bar count to define periods (1 bar for Daily, 5 bars for Weekly, 20 bars for Monthly on a daily chart). When a new period starts, the previous period’s high/low is finalized and plotted.
High/Low Tracking:
Highest high (periodHigh) and lowest low (periodLow) are updated within the period.
Lines are drawn at these levels when the period ends, starting from the bar where the extreme occurred (periodHighBar, periodLowBar).
Signal Logic:
Buy signal: ta.crossunder(close , prevPeriodLow) and not lowBroken and barstate.isconfirmed
Sell signal: ta.crossover(close , prevPeriodHigh) and not highBroken and barstate.isconfirmed
Flags (highBroken, lowBroken) prevent multiple signals for the same level within a period.
Blue Dot Counter: Increments on each buy signal, resets on a sell signal or if price exceeds the entry price after three or more buy signals.
Entry and Exit Rules
Buy Signal (Blue Circle): Triggered when the price crosses below the previous period’s low, suggesting a potential oversold condition and buying opportunity. The signal appears as a blue circle below the price bar.
Sell Signal (White Circle): Triggered when the price crosses above the previous period’s high, indicating a potential overbought condition and selling opportunity. The signal appears as a white circle above the price bar.
Blue Dot Tracker:
Increments blueDotCount on each buy signal and sets an entryPrice on the first buy.
Resets on a sell signal or if price exceeds entryPrice after three or more buy signals.
If blueDotCount >= 3, the table suggests holding; if >= 4, it reinforces “Hold Investment.”
Exit Rules: Exit a buy position on a sell signal or when price exceeds the entry price after three or more buy signals. Combine with other tools (e.g., trendlines, support/resistance) for additional confirmation. Always apply proper risk management.
Recommended Usage
The "Contrarian Period High & Low" indicator is optimized for daily charts but can be adapted to other timeframes (e.g., 1H, 4H) with adjustments to the period bar count. It excels in markets with clear support/resistance levels and potential reversal zones. Traders should:
Backtest the indicator on their chosen asset and timeframe to validate signal reliability.
Combine with other technical tools (e.g., moving averages, Fibonacci levels) for stronger trade confirmation.
Adjust barsPerPeriod (e.g., ~120 bars for Weekly on hourly charts) based on the chart timeframe and market volatility.
Monitor the action table to guide position management based on blue dot counts.
Customization Options
Period Type: Choose between Daily, Weekly, or Monthly periods (default: Monthly).
Line Length: Set the length of high/low lines in bars (default: 200).
Show Highs/Lows: Toggle visibility of period high (red) and low (green) lines.
Max Lines to Keep: Limit the number of historical lines displayed (default: 10).
Hide Signals: Toggle buy/sell signal visibility for a cleaner chart.
Table Display: A fixed table in the bottom-right corner shows the blue dot count and action, with yellow (Hold) or green (Flip) backgrounds based on the count.
Why Use This Indicator?
The "Contrarian Period High & Low" indicator offers a unique blend of support/resistance visualization and contrarian signal generation, making it a versatile tool for identifying potential reversals. Its clear visual cues (lines and signals), blue dot tracker, and actionable table provide traders with an intuitive way to monitor market structure and manage trades. Whether you’re a beginner or an experienced trader, this indicator enhances your ability to spot key levels and time entries/exits effectively.
Tips for Users
Test the indicator thoroughly on your chosen market and timeframe to optimize settings (e.g., adjust barsPerPeriod for non-daily charts).
Use in conjunction with price action or other indicators for stronger trade setups.
Monitor the action table to decide whether to hold or flip positions based on blue dot counts.
Ensure your chart timeframe aligns with the selected period type (e.g., daily chart for Monthly periods).
Apply strict risk management to protect against false breakouts.
Happy trading with the Contrarian Period High & Low indicator! Share your feedback and strategies in the TradingView community!

Polaris Trend All-in-One📘 Polaris Trend Indicator: Trading Rules & Strategy
Guide
The Polaris Trend Indicator is designed to simplify trading decisions by identifying key entry
and exit signals without the need for excessive technical analysis. This system combines the
Polaris Trend with the Polaris Golden Wave and Market Bias tools to give you confidence
across multiple timeframes.
This guide outlines clear trading rules for two use cases:
● Swing Trading
● Long-Term Investing and Holding
⚡ Swing Trading Strategy
Swing trading can be challenging when the market direction is unclear. The Polaris Trend helps
traders stay on the right side of momentum with straightforward visual signals. This approach is
best used on the Daily or Weekly chart.
✅ Entry Criteria (Bullish Trades)
● A solid green column appears above the zero line.
● A green upward arrow confirms bullish momentum.
● Enter your trade immediately when the green column first appears.
● Hold the trade until a red column appears, signaling a shift in momentum.
🚫 Exit Criteria (Bullish Trades)
● The first appearance of a red column after a green run.
● Multiple green columns followed by a red column.
● Do not enter trades mid-trend; always enter on the first green flip.
***Recommended Swing Strategy
● When a new daily green column appears but the weekly columns are still red, stay
nimble. Enter your position when the Polaris Trend Indicator turns green and displays an
upward-pointing arrow.
● If the price pulls back to a higher low but a red daily column forms, sell 50% of your
position and move your stop loss to your original entry. Then, wait for the next daily
green column and arrow to reappear, this is your signal to reenter the 50% you exited.
● If the price continues to rise and the weekly columns also turn green, shift your focus
to the weekly chart. Ignore daily signals and hold the trade until the weekly column
turns red, which will be your cue to exit. The weekly green column is your confirmation of
a stronger uptrend and a potential longer hold.
🔻 Entry Criteria (Bearish Trades)
● A solid red column appears below the zero line.
● A red downward arrow confirms bearish momentum.
● Enter your short trade immediately when the red column first appears.
● Hold until a green column appears, indicating momentum has shifted.
🔁 Exit Criteria (Bearish Trades)
● The first green column that follows a red sequence.
● Same rule applies: enter only on the initial flip, not mid-trend.
Note: The first color flip is the most reliable entry point. Avoid entering positions
deep into a trend, wait for the clear signal from Polaris.
🧭 Long-Term Investing Strategy
This approach combines the Polaris Golden Wave, Polaris Trend, and Market Bias to help
long-term investors buy at deep value levels and scale into positions over time.
📉 Ideal Entry: Golden Zone + Polaris Trend Signal
● Use the Golden Wave to identify the monthly 0.618–0.826 retracement zone
(significant discount levels).
● When price enters the Golden Zone and the Polaris Trend shows a green column on
the Daily or Weekly, this is your optimal entry point.
● If the trend turns red inside the zone, consider trimming positions and re-entering on the
next bullish signal.
If price drops below the Golden Zone, the stock becomes even more undervalued,
wait for the next green Polaris Trend signal to enter.
💰 Secondary Entry: Market Bias Rebounds
● If you miss the Golden Zone entry or are dollar-cost averaging:
○ Use the Market Bias on a Weekly timeframe.
○ Wait for price to retrace into the Market Bias band after moving higher.
○ Look for a red Polaris Trend column, then wait for price to enter the Market
Bias band and once it enters, wait for Polaris Trend signal to flip back to green
for your entry. If the trend turns red inside the zone, consider trimming positions
and re-entering on the next bullish signal.
Think of the Market Bias like a lake and price like a skipping stone—you want to
buy when the stone comes down and touches the surface.
📊 Indicator Explanations
🔶 Golden Wave (Monthly Fibonacci Retracement Zones)
● Highlights key monthly retracement zones (0.618 to 0.826).
● Helps identify deep-value entries on longer timeframes.
● Visible across all chart timeframes for consistent macro reference.
🔴 Market Bias (Smoothed Heikin-Ashi Trend Filter)
● Measures trend direction and strength using smoothed Heikin-Ashi candles and
oscillation logic.
● Customizable smoothing, oscillator period, and timeframe inputs.
● Option to display trend signals in a separate pane with dynamic coloring.
This combined approach empowers traders to make high-quality decisions with clarity and
discipline. Whether you're entering short-term swings or building long-term positions, the
Polaris Trend system guides you with timely, data-driven signals.
