스크립트에서 "entry"에 대해 찾기
ENTRY CONFIRMATION V2An indicator from candle man. Helps determine whether supply and demand zone are truly supply or demand.

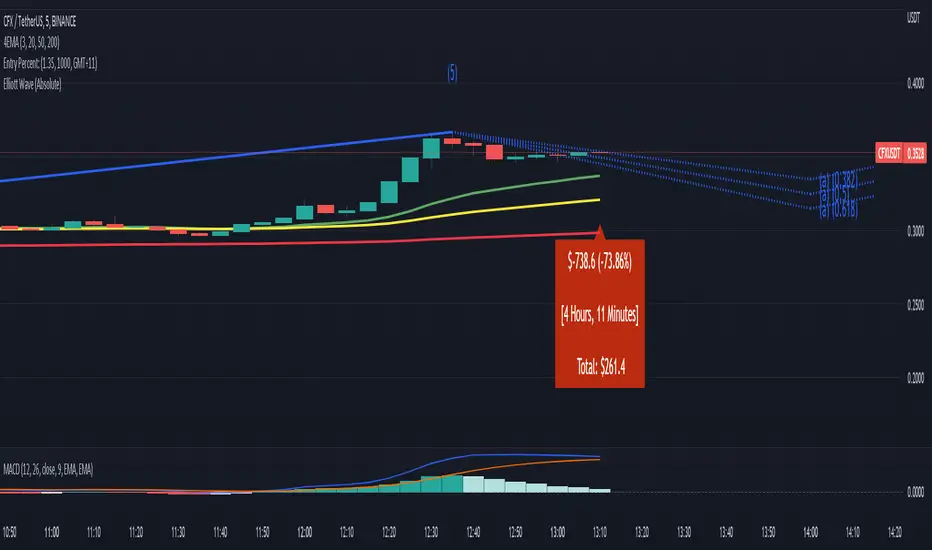
Entry Percent: EssamThis Pine Script code is designed to perform the task of computing and showcasing the profit percentage, profit value, and the duration for which a specific asset is held, all in real-time. The script effectively leverages the built-in resources to provide a seamless and robust experience, as it presents the calculated figures in an easily readable format on the chart, without causing any lag or disruptions to the chart.
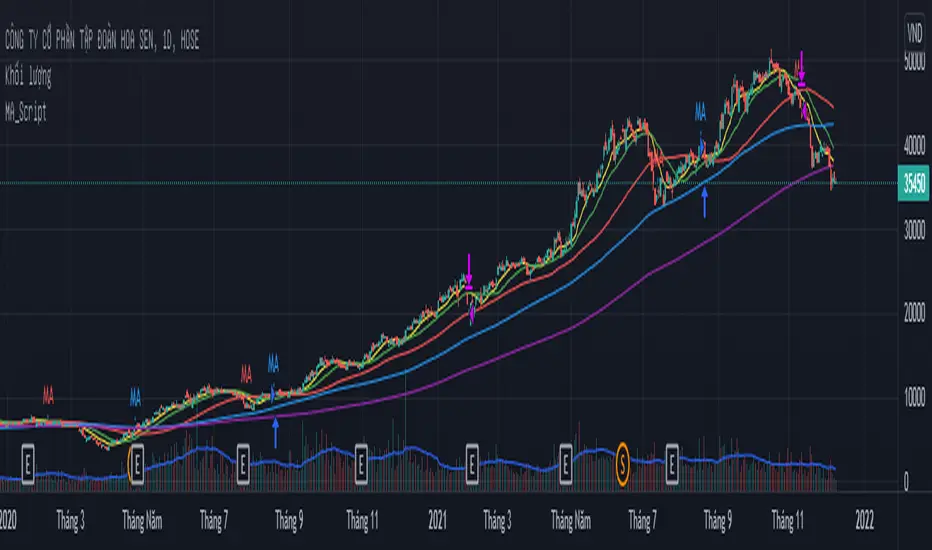
MA_Script- Entry Point : base on MA20, MA50, MA100, MA200.
- Exit Point : base on stop loss, MA and trailing stop.
sa-strategy with HTF-TSLEntry- based on HA close above HMA confirmation done with ST and HTF ATR
Exit- based on close below ATR which works as trailing SL

[MV] %B with SMA + Volume Based Colored Bars
Entry Signal when %B Crosses with SMA and this is more meaningful if it supports colored bars.
Black Bar when prices go down and volume is bigger than 150% of its average, that indicates us price action is supported by a strong bearish volume
Blue Bar when prices go up and volume bigger than 150% of its average, that indicates us price action is supported by a strong bullish volume
VBC author @KIVANCfr3762

FX Sniper: T3-CCI Strategy - With 100 IndicatorsEntry signal when moving above -100, sell signal when going below 100

Amazing Crossover SystemEntry Rules
BUY when the 5 EMA crosses above the 10 EMA from underneath and the RSI crosses above the 50.0 mark from the bottom.
SELL when the 5 EMA crosses below the 10 EMA from the top and the RSI crosses below the 50.0 mark from the top.
Make sure that the RSI did cross 50.0 from the top or bottom and not just ranging tightly around the level.
How to setup Alert:
1) Add the Amazing Crossover System to your chart via Indicators
2) Find your currency pair
3) Set the timeframe on the chart to 1 hour
4) Press 'Alt + A' (create alert shortcut)
5) Set the following criteria for the alert:
Condition = 'Amazing Crossover System', Plot, ' BUY Signal'
The rest of the alert can be customized to your preferences
5) Repeat steps 1 - 4, but set the Condition = 'Amazing Crossover System', Plot, ' SELL Signal'

Best Buying & Selling Flip Zone @MaxMaserati 3.0Best Buying & Selling Flip Zone 3.0 🐂🐻
Best Buying & Selling Flip Zone 3.0 is an advanced, multi-timeframe Price Action tool designed to identify high-probability institutional supply and demand zones.
By analyzing candle range and body size (Expander vs. Normal candles), this indicator categorizes market structure shifts into three distinct tiers of strength (A+++, A++, A+). It includes a built-in Trade Manager, Volume Tracking, and a unique "Defender/Attacker" Multi-Timeframe (MTF) entry confirmation system.
🚀 Key Features
Multi-Timeframe Analysis: Monitor Higher Timeframe (HTF) zones while trading on a Lower Timeframe (LTF).
Tiered Setup Grading: Automatically classifies zones based on the strength of the candle engulfing action (King Slayer, Crusher, Drift).
Smart Entry Confirmation: The script can wait for price to tap an HTF zone and then automatically search for a confirmation pattern on the current timeframe before signaling a trade.
Built-in Trade Management: Visualizes Entry, Stop Loss (SL), and Take Profit (TP) levels with customizable Risk:Reward ratios.
Volume Tracking: Monitors the volume utilized to create a zone and tracks "remaining" volume as price tests the zone.
Zone Deletion Logic: Automatically removes zones that have been invalidated by either a wick or a candle close.
🧠 How It Works: The "A-Grade" Logic
The indicator analyzes candles based on their body-to-range ratio to define "Expander" (Explosive move) vs. "Normal" candles. It then looks for engulfing behaviors to create zones:
A+++ (King Slayer):
Logic: A Bullish Expander engulfs a Bearish Expander (or vice versa).
Significance: This is the strongest signal, indicating a massive shift in momentum where aggressive buyers completely overwhelmed aggressive sellers.
A++ (Crusher):
Logic: A Bullish Expander engulfs a Bearish Normal candle.
Significance: Strong momentum overcoming standard price action. High probability.
A+ (Drift):
Logic: A Bullish Normal candle engulfs a Bearish Normal candle.
Significance: A standard flip zone. Good for continuation plays but less aggressive than KS or CR setups.
🛠️ Functionality Guide
1. General Filters & Timeframes
Higher Timeframe: Select a timeframe higher than your chart (e.g., Select 4H while trading on 15m). The indicator will draw the major zones from the 4H.
Deletion Logic:
Wick (Hard): Zone is removed immediately if price touches the invalidation level.
Close (Soft): Zone is removed only if a candle closes past the invalidation level.
2. LTF Entry Confirmation (The "Master" Switch)
When Show LTF Entry Logic is enabled, the indicator does not signal immediately upon an HTF zone creation. Instead:
It waits for the price to retraced and touch the HTF zone.
Once touched, it scans the current timeframe for a valid flip setup (KS, CR, or DR).
It creates a tighter entry box and draws trade lines only when this confirmation occurs.
3. Trade Management
Risk:Reward: Set your desired RR (e.g., 2.0).
SL Padding: Add breathing room (ticks) to your Stop Loss.
SL Source: Choose between a safer Stop Loss (based on the HTF zone) or a tighter Stop Loss (based on the LTF confirmation candle).
4. Volume Stats
Labels display the volume involved in the zone's creation. As price taps the zone, the volume is "depleted" from the label, giving you insight into the remaining order flow absorption.
🎨 Visual Customization
Colors: Fully customizable colors for Buyers (Green) and Sellers (Red) zones across all three strength tiers.
Labels: Toggle technical names, touch counts, and timeframe labels.
Lines: Option to show "Aggressive Open Lines" to mark the exact opening price of the flip zone extended forward.
⚠️ Disclaimer
This tool is for educational purposes and chart analysis assistance only. Past performance of a setup (A+++/King Slayer) does not guarantee future results. Always manage risk and use this in conjunction with your own trading strategy.

Funnelzon Graded Buy and Sell Signals (LITE) MFI MTFFunnelzon Buy and Sell Signals (EMA Zones) – LITE is a lightweight overlay indicator built for scalping and short-term trading. It generates BUY/SELL signals, grades each signal (A+ to F), and provides a clean Confirmation Box that summarizes multi-timeframe context so you can make faster, more structured decisions.
How it works
Signal Engine (LTF)
Signals are triggered using an ATR-based “scalp helper” logic with adjustable sensitivity.
A stop-state system helps reduce repeated or noisy entries.
Signal Scoring & Grades (A+ → F)
When a signal appears, it is evaluated by a context pipeline that considers:
Adaptive momentum/flow (AMF)
ALMA trend alignment
Support/Resistance proximity
Swing structure behavior
Market regime / trend strength (ADX-based)
The result is a score mapped to a grade:
A+ / A = strongest signals
B / C = mixed conditions
D / F = low-quality conditions
Optional Filters
MFI Filter: Helps avoid signals that do not meet Money Flow conditions.
HTF Confirmation (MTF): Uses HTF1 and HTF2 bias. Choose strict filtering or soft alignment.
Confirmation Box (Dashboard)
The box displays:
HTF State: Trend Long / Trend Short / HTF Conflict / Neutral
Market Mode: Trend / Pullback / Conflict
Trade Bias: Long-only / Short-only / Wait
ENTRY NOW? = “YES” when HTF bias and LTF signal align
MFI status + HTF1/HTF2 direction
Optional Structure Tools
EMA overlays: 9 / 12 / 20 / 50 / 100 / 200
Auto Supply/Demand zones (pivot-based, ATR thickness, configurable extension and limits)
Best practices (recommended workflow)
Prefer trading A+ / A signals only.
Trade in the direction of HTF State when possible.
If Market Mode shows PULLBACK or CONFLICT, reduce risk or wait for better alignment.
Use Supply/Demand zones and EMAs for structure (targets, invalidation, and bias).
Important: Confirmation with Stochastic + MACD
This script is a signal + context tool, not a guarantee. To validate signal confirmation, it is strongly recommended to use:
Stochastic Oscillator (momentum/exhaustion confirmation)
MACD (trend momentum and direction confirmation)
Only take trades when the script signal and your confirmation indicators agree.
Alerts
Includes alert conditions for:
Buy Signal
Sell Signal
Any Signal
ENTRY NOW (HTF + LTF aligned)
ENTRY NOW Long / ENTRY NOW Short
Disclaimer
This indicator is for educational purposes and does not constitute financial advice. Always backtest, manage risk, and confirm signals with your own rules.

Buyers & sellers Candle Control Dominance Zone @MaxMaserati 3.0Description
The Buyers & Sellers Candle Control Dominance Zone is a surgical price-action tool designed to identify and project key supply and demand zones derived from candle anatomy across multiple timeframes.
By splitting candles into "Sellers Control" (upper wick/shadow) and "Buyers Control" (lower wick/shadow) regions, this script visualizes exactly where price rejection and absorption are occurring. With the new HTF Engine, you can now view these institutional rejection zones from a Higher Timeframe (e.g., 4H) while trading on a Lower Timeframe (e.g., 15m).
How it Works
The indicator identifies specific "Control Zones" based on the battle between buyers and sellers:
Live Control (Current & HTF): Real-time monitoring of the developing candle. See a 4H wick forming live while watching the 1m chart.
Last Closed Control (Current & HTF): Projects the zones from the most recently completed candle.
Dominance Zones (BuBC & BeBC):
BuBC (Bullish Body Close): A "Dominance Zone" triggered when a candle closes above the previous candle's high. Signifies strong bullish momentum.
BeBC (Bearish Body Close): A "Dominance Zone" triggered when a candle closes below the previous candle's low. Signifies aggressive selling pressure.
Key Features
Multi-Timeframe (MTF) Overlay: Plot 4H, Daily, or Weekly control zones directly on your lower timeframe scalping charts.
Smart Labeling: HTF labels automatically update to show the zone type (e.g., "Sellers Control (Live) ") and whether the last candle was a Dominance candle (BuBC/BeBC).
Dynamic Extension: Zones are projected forward to help you catch retests of rejection levels.
Alerts Included: Built-in alerts trigger when price crosses into a Dominance Zone (BuBC/BeBC), allowing you to set it and forget it.
Can be use as:
Support & Resistance: Use Buyers Control zones (lower wicks) as demand zones for longs and Sellers Control zones (upper wicks) as supply zones for shorts.
Trend Confirmation: A BuBC zone often acts as a launchpad for continued upside. If price falls back into a BuBC zone and rejects, it is a high-probability continuation signal.
Fractal Entry: Use the HTF zones to find the "Big Picture" levels, then use the Current TF zones to refine your entry with precision.
Settings
Display Filter: Toggle Current TF zones (Live, Closed, BuBC, BeBC) independently.
Higher Timeframe Settings: Enable/Disable HTF overlay and select your preferred timeframe (e.g., 240 for 4H).
Visuals: Fully adjustable transparency, colors, and extension lengths to keep your chart clean.

SA Range Rank ALOG PRESSURE 1 AND 2This is a 4-candle market mechanic:
Bull pattern (orange)
Impulse up (strong bullish candle)
Stall / absorption (small candle; indecision)
Trap down (small bearish candle that fails to continue down)
Ignition up (bull candle breaks above the micro-range)
Bear pattern (yellow)
Impulse down
Stall / absorption
Trap up
Ignition down (bear candle breaks below micro-range)
Interpretation:
This is “pressure → absorption → reversal ignition.”
It’s meant to catch the moment where retail commits late and gets forced out.
How to Trade It on 15-Minute
15m is your structure execution timeframe: fewer signals, higher quality.
Recommended Indicator Settings (15m /NQ)
For CLEAN version (best baseline)
Sensitivity: BALANCED
Require VWAP bias: ON
Require EMA slope: ON
Targets: ON
Line extend bars: 40–60
For PRO (Looser) (more signals)
Keep defaults, then:
useVWAP: ON
useTrend: ON
useRetestHold: OFF (turn ON only if you want A+ only)
15m Entry Rules (Simple + Effective)
BULL (orange)
Enter on:
The close of the signal candle or
Next candle if it holds above the breakout area (safer)
BEAR (yellow)
Enter on:
The close of the signal candle or
Next candle if it holds below the breakdown area (safer)
15m Risk & Targets
STOP = the STOP line
PT1 = first scale / partial
PT2 = runner target
Suggested execution
Take 50–70% off at PT1
Move stop to breakeven after PT1 (optional)
Hold remainder to PT2 or trail
When to IGNORE a 15m signal
Skip it if:
Signal prints into a major level (prior day high/low, VWAP bands, overnight high/low)
You’re in the middle of chop and ATR is collapsing hard
The signal prints right before major news (CPI/FOMC)
How to Trade It on 1-Minute
1m is your execution / microstructure timeframe: more signals, faster decisions.
Recommended Indicator Settings (1m /NQ)
CLEAN version (to avoid spam)
Sensitivity: STRICT or BALANCED
VWAP: ON
EMA slope: ON
Targets: ON
PRO (Looser) (if you WANT frequent scalps)
Defaults are fine, but do:
useRetestHold: ON (recommended for 1m to avoid fake-outs)
Keep VWAP ON
1m Entry Rules (must be disciplined)
Best entry method (highest probability)
Wait for signal
Enter on the first retest/hold (if using retest hold)
If not using retest hold: enter only if next bar does not immediately reverse
1m Risk & Targets
PTs are ATR-based. On 1m, ATR is smaller, so targets are naturally tighter.
Use PT1 as a fast scalp, PT2 as stretch.
Suggested execution
Take 70–80% off at PT1
Very small runner to PT2
When to ignore 1m signals
Skip if:
It’s printing against the 15m direction
Price is whipping above/below VWAP repeatedly (chop)
ATR is extremely low (fake signals)
5) “Permission Layer” (15m → 1m workflow)
This is the cleanest way to combine both:
Step 1 (15m)
Use 15m signals as permission:
If 15m prints BULL, then you ONLY take 1m BULL signals for the next 30–90 minutes
If 15m prints BEAR, then you ONLY take 1m BEAR signals
Step 2 (1m)
Use 1m signals for entries and re-entries, with tighter targets.
This matches your framework:
15m = “structure gives permission”
1m = “execution extracts”
6) Ready-to-paste TradingView Descriptions
A) Description for SA 4-Candle Cycle — CLEAN (ATR Auto Targets)
Paste this into your TradingView script description:
SA 4-Candle Cycle (CLEAN) identifies a repeatable market mechanic: impulse → stall/absorption → trap → ignition.
Orange BULL signals print when a 4-candle bullish reversal/continuation cycle completes and price confirms by breaking above the micro-range. Yellow BEAR signals print on the inverse breakdown cycle.
This tool includes ATR-adaptive targets:
STOP = volatility-scaled invalidation level (optionally uses the swing reference candle)
PT1 / PT2 = first and second profit objectives scaled by ATR
Best use
15m: primary signal timeframe (higher quality, fewer signals). Enable VWAP and EMA slope filters for best results.
1m: execution timeframe for scalps and re-entries. Use STRICT/BALANCED sensitivity to reduce noise.
Risk note: This is not financial advice. Always manage risk and confirm with your larger structure levels.
B) Description for SA 4-Candle ATR-Adaptive Cycle — PRO (Looser) + Auto Targets
Paste this into your TradingView script description:
SA 4-Candle Cycle (PRO/Looser) is a higher-frequency variant of the 4-candle cycle model designed to print more signals while still respecting ATR-based structure. It detects impulse → absorption → trap → ignition sequences and plots ATR-scaled STOP, PT1, and PT2 levels automatically.
Best use
15m: use VWAP + EMA slope filters ON for higher probability.
1m: enable retest/hold if you want A+ entries only and fewer false breaks.
This version is ideal when you want earlier detection and more opportunities, while still keeping the risk framework systematic through ATR-adaptive targets.
Risk note: This is not financial advice. Use strict risk management.
Quick Recommendations (so you don’t get flooded)
If you want very high probability:
15m: CLEAN + BALANCED + VWAP ON + EMA slope ON
1m: PRO + VWAP ON + RetestHold ON + (optionally EMA slope ON)

EvansThis is a simple math problem:
If your risk-reward ratio is 1:3.
Even if you lose 3 out of 4 trades (a win rate of only 25%), as long as you hit one big win, you'll still break even.
That extra bit of win rate is your pure profit.
📊 How to use it with LuxAlgo?
This script is your "skeleton," and LuxAlgo is your "muscle."
Hearing the green/red alarm: This means your system has detected a DEMA 9/20 crossover.
Confirm with the chart:
If LuxAlgo also shows a dark blue right-pointing arrow at this time, it represents a strong momentum 1:3 opportunity.
If the price is currently in the 0.618 Discount Zone, you must hold this trade.
Hearing the yellow alarm:
This is a reminder that the trend has changed. If you are already in profit but haven't reached a 1:3 ratio, you can consider manually reducing your position by half and then moving your stop loss to the entry point (Break Even), allowing the remaining profits to run without risk.

KASTE indicator 2 (for 10s Entries)This script is a **1-minute MACD-based trend filter** designed to define clear **bullish or bearish market bias**.
It uses a fast MACD configuration combined with a 50-period EMA to identify short-term trend direction and momentum strength.
A bullish state is shown when price is above the EMA and MACD momentum is rising above zero, while a bearish state is shown when price is below the EMA and momentum is falling below zero.
The background color highlights the current trend, making it easy to align **10-second entry timing** with the higher-timeframe bias and avoid trading in choppy conditions.

AMT Orderflow Profile + Imbalance Highlight + DashboardAMT Orderflow Profile + Imbalance Highlight + Dashboard
This indicator is a price-bin-based orderflow profile designed to expose where aggressive participation is concentrated and sustained, not just where volume traded.
Unlike traditional volume profiles that show where activity occurred, this script focuses on how volume behaved inside price, separating buying and selling pressure and highlighting only statistically dominant imbalance.
🔹 Why This Script Is Original
Most volume profiles and orderflow tools suffer from one or more of the following:
Single-bin imbalance noise
Repeating alerts from already-accepted imbalance
Visual imbalance that does not align with alerts
No distinction between fresh initiative vs historical volume
This script solves those issues by combining price-bin profiling, directional volume classification, and strict imbalance persistence rules into one unified model.
The result is a contextual orderflow tool, not a signal spammer.
🔹 How It Works (Concepts)
Price-Based Binning
The script divides the price range of the lookback window into fixed bins.
Directional Volume Separation
Buy volume: candles closing above open
Sell volume: candles closing below open
Bin-Level Imbalance Calculation
A bin is imbalanced only when one side controls a configurable percentage of total volume:
Side Volume ÷ (Buy + Sell Volume) ≥ Threshold
Persistence Requirement (Noise Filter)
Imbalance is only considered valid when it appears across 3 or more consecutive bins, filtering out isolated prints.
Fresh Print Enforcement
Alerts trigger only when imbalance first appears, never while it persists or after it has already been accepted by price.
🔹 Visual Output
Each bin is drawn as a horizontal box
Imbalanced bins display:
Bold borders
Highlighted background
Text label: BUY IMB or SELL IMB
Box width represents relative volume intensity
Alerts are mathematically locked to these visual labels, ensuring perfect alignment between what you see and what you’re alerted on.
🔹 How Traders Use It
This tool is best used for:
Identifying initiative buying or selling
Spotting absorption vs acceptance
Confirming auction direction within a larger framework
Providing orderflow context alongside VWAP, IB, CVD, or market structure
It is not intended as a standalone entry signal, but as a confirmation and context engine.
🔹 Alerts (Non-Repainting)
BUY alert → fresh 3+ bin buy-side imbalance
SELL alert → fresh 3+ bin sell-side imbalance
Alerts do not repeat unless imbalance fully disappears and reappears
⚠️ Notes
Candle-based volume (not tick footprint)
Non-repainting
Designed for futures and liquid markets
Best used with clean charts for clarity

Big Candle Identifier with RSI Divergence and Advanced Stops1. Strategy Objective
The main goal of this strategy is to:
Identify significant price momentum (big candles).
Enter trades at opportune moments based on market signals (candlestick patterns and RSI divergence).
Limit initial risk through a fixed stop loss.
Maximize profits by using a trailing stop that activates only after the trade moves a specified distance in the profitable direction.
2. Components of the Strategy
A. Big Candle Identification
The strategy identifies big candles as indicators of strong momentum.
A big candle is defined as:
The body (absolute difference between close and open) of the current candle (body0) is larger than the bodies of the last five candles.
The candle is:
Bullish Big Candle: If close > open.
Bearish Big Candle: If open > close.
Purpose: Big candles signal potential continuation or reversal of trends, serving as the primary entry trigger.
B. RSI Divergence
Relative Strength Index (RSI): A momentum oscillator used to detect overbought/oversold conditions and divergence.
Fast RSI: A 5-period RSI, which is more sensitive to short-term price movements.
Slow RSI: A 14-period RSI, which smoothens fluctuations over a longer timeframe.
Divergence: The difference between the fast and slow RSIs.
Positive divergence (divergence > 0): Bullish momentum.
Negative divergence (divergence < 0): Bearish momentum.
Visualization: The divergence is plotted on the chart, helping traders confirm momentum shifts.
C. Stop Loss
Initial Stop Loss:
When entering a trade, an immediate stop loss of 200 points is applied.
This stop loss ensures the maximum risk is capped at a predefined level.
Implementation:
Long Trades: Stop loss is set below the entry price at low - 200 points.
Short Trades: Stop loss is set above the entry price at high + 200 points.
Purpose:
Prevents significant losses if the price moves against the trade immediately after entry.
D. Trailing Stop
The trailing stop is a dynamic risk management tool that adjusts with price movements to lock in profits. Here’s how it works:
Activation Condition:
The trailing stop only starts trailing when the trade moves 200 ticks (profit) in the right direction:
Long Position: close - entry_price >= 200 ticks.
Short Position: entry_price - close >= 200 ticks.
Trailing Logic:
Once activated, the trailing stop:
For Long Positions: Trails behind the price by 150 ticks (trail_stop = close - 150 ticks).
For Short Positions: Trails above the price by 150 ticks (trail_stop = close + 150 ticks).
Exit Condition:
The trade exits automatically if the price touches the trailing stop level.
Purpose:
Ensures profits are locked in as the trade progresses while still allowing room for price fluctuations.
E. Trade Entry Logic
Long Entry:
Triggered when a bullish big candle is identified.
Stop loss is set at low - 200 points.
Short Entry:
Triggered when a bearish big candle is identified.
Stop loss is set at high + 200 points.
F. Trade Exit Logic
Trailing Stop: Automatically exits the trade if the price touches the trailing stop level.
Fixed Stop Loss: Exits the trade if the price hits the predefined stop loss level.
G. 21 EMA
The strategy includes a 21-period Exponential Moving Average (EMA), which acts as a trend filter.
EMA helps visualize the overall market direction:
Price above EMA: Indicates an uptrend.
Price below EMA: Indicates a downtrend.
H. Visualization
Big Candle Identification:
The open and close prices of big candles are plotted for easy reference.
Trailing Stop:
Plotted on the chart to visualize its progression during the trade.
Green Line: Indicates the trailing stop for long positions.
Red Line: Indicates the trailing stop for short positions.
RSI Divergence:
Positive divergence is shown in green.
Negative divergence is shown in red.
3. Key Parameters
trail_start_ticks: The number of ticks required before the trailing stop activates (default: 200 ticks).
trail_distance_ticks: The distance between the trailing stop and price once the trailing stop starts (default: 150 ticks).
initial_stop_loss_points: The fixed stop loss in points applied at entry (default: 200 points).
tick_size: Automatically calculates the minimum tick size for the trading instrument.
4. Workflow of the Strategy
Step 1: Entry Signal
The strategy identifies a big candle (bullish or bearish).
If conditions are met, a trade is entered with a fixed stop loss.
Step 2: Initial Risk Management
The trade starts with an initial stop loss of 200 points.
Step 3: Trailing Stop Activation
If the trade moves 200 ticks in the profitable direction:
The trailing stop is activated and follows the price at a distance of 150 ticks.
Step 4: Exit the Trade
The trade is exited if:
The price hits the trailing stop.
The price hits the initial stop loss.
5. Advantages of the Strategy
Risk Management:
The fixed stop loss ensures that losses are capped.
The trailing stop locks in profits after the trade becomes profitable.
Momentum-Based Entries:
The strategy uses big candles as entry triggers, which often indicate strong price momentum.
Divergence Confirmation:
RSI divergence helps validate momentum and avoid false signals.
Dynamic Profit Protection:
The trailing stop adjusts dynamically, allowing the trade to capture larger moves while protecting gains.
6. Ideal Market Conditions
This strategy performs best in:
Trending Markets:
Big candles and momentum signals are more effective in capturing directional moves.
High Volatility:
Larger price swings improve the probability of reaching the trailing stop activation level (200 ticks).

Nef33 Forex & Crypto Trading Signals PRO
1. Understanding the Indicator's Context
The indicator generates signals based on confluence (trend, volume, key zones, etc.), but it does not include predefined SL or TP levels. To establish them, we must:
Use dynamic or static support/resistance levels already present in the script.
Incorporate volatility (such as ATR) to adjust the levels based on market conditions.
Define a risk/reward ratio (e.g., 1:2).
2. Options for Determining SL and TP
Below, I provide several ideas based on the tools available in the script:
Stop Loss (SL)
The SL should protect you from adverse movements. You can base it on:
ATR (Volatility): Use the smoothed ATR (atr_smooth) multiplied by a factor (e.g., 1.5 or 2) to set a dynamic SL.
Buy: SL = Entry Price - (atr_smooth * atr_mult).
Sell: SL = Entry Price + (atr_smooth * atr_mult).
Key Zones: Place the SL below a support (for buys) or above a resistance (for sells), using Order Blocks, Fair Value Gaps, or Liquidity Zones.
Buy: SL below the nearest ob_lows or fvg_lows.
Sell: SL above the nearest ob_highs or fvg_highs.
VWAP: Use the daily VWAP (vwap_day) as a critical level.
Buy: SL below vwap_day.
Sell: SL above vwap_day.
Take Profit (TP)
The TP should maximize profits. You can base it on:
Risk/Reward Ratio: Multiply the SL distance by a factor (e.g., 2 or 3).
Buy: TP = Entry Price + (SL Distance * 2).
Sell: TP = Entry Price - (SL Distance * 2).
Key Zones: Target the next resistance (for buys) or support (for sells).
Buy: TP at the next ob_highs, fvg_highs, or liq_zone_high.
Sell: TP at the next ob_lows, fvg_lows, or liq_zone_low.
Ichimoku: Use the cloud levels (Senkou Span A/B) as targets.
Buy: TP at senkou_span_a or senkou_span_b (whichever is higher).
Sell: TP at senkou_span_a or senkou_span_b (whichever is lower).
3. Practical Implementation
Since the script does not automatically draw SL/TP, you can:
Calculate them manually: Observe the chart and use the levels mentioned.
Modify the code: Add SL/TP as labels (label.new) at the moment of the signal.
Here’s an example of how to modify the code to display SL and TP based on ATR with a 1:2 risk/reward ratio:
Modified Code (Signals Section)
Find the lines where the signals (trade_buy and trade_sell) are generated and add the following:
pinescript
// Calculate SL and TP based on ATR
atr_sl_mult = 1.5 // Multiplier for SL
atr_tp_mult = 3.0 // Multiplier for TP (1:2 ratio)
sl_distance = atr_smooth * atr_sl_mult
tp_distance = atr_smooth * atr_tp_mult
if trade_buy
entry_price = close
sl_price = entry_price - sl_distance
tp_price = entry_price + tp_distance
label.new(bar_index, low, "Buy: " + str.tostring(math.round(bull_conditions, 1)), color=color.green, textcolor=color.white, style=label.style_label_up, size=size.tiny)
label.new(bar_index, sl_price, "SL: " + str.tostring(math.round(sl_price, 2)), color=color.red, textcolor=color.white, style=label.style_label_down, size=size.tiny)
label.new(bar_index, tp_price, "TP: " + str.tostring(math.round(tp_price, 2)), color=color.blue, textcolor=color.white, style=label.style_label_up, size=size.tiny)
if trade_sell
entry_price = close
sl_price = entry_price + sl_distance
tp_price = entry_price - tp_distance
label.new(bar_index, high, "Sell: " + str.tostring(math.round(bear_conditions, 1)), color=color.red, textcolor=color.white, style=label.style_label_down, size=size.tiny)
label.new(bar_index, sl_price, "SL: " + str.tostring(math.round(sl_price, 2)), color=color.red, textcolor=color.white, style=label.style_label_up, size=size.tiny)
label.new(bar_index, tp_price, "TP: " + str.tostring(math.round(tp_price, 2)), color=color.blue, textcolor=color.white, style=label.style_label_down, size=size.tiny)
Code Explanation
SL: Calculated by subtracting/adding sl_distance to the entry price (close) depending on whether it’s a buy or sell.
TP: Calculated with a double distance (tp_distance) for a 1:2 risk/reward ratio.
Visualization: Labels are added to the chart to display SL (red) and TP (blue).
4. Practical Strategy Without Modifying the Code
If you don’t want to modify the script, follow these steps manually:
Entry: Take the trade_buy or trade_sell signal.
SL: Check the smoothed ATR (atr_smooth) on the chart or calculate a fixed level (e.g., 1.5 times the ATR). Also, review nearby key zones (OB, FVG, VWAP).
TP: Define a target based on the next key zone or multiply the SL distance by 2 or 3.
Example:
Buy at 100, ATR = 2.
SL = 100 - (2 * 1.5) = 97.
TP = 100 + (2 * 3) = 106.
5. Recommendations
Test in Demo: Apply this logic in a demo account to adjust the multipliers (atr_sl_mult, atr_tp_mult) based on the market (forex or crypto).
Combine with Zones: If the ATR-based SL is too wide, use the nearest OB or FVG as a reference.
Risk/Reward Ratio: Adjust the TP based on your tolerance (1:1, 1:2, 1:3)

Risk & Position DashboardRisk & Position Dashboard
Overview
The Risk & Position Dashboard is a comprehensive trading tool designed to help traders calculate optimal position sizes, manage risk, and visualize potential profit/loss scenarios before entering trades. This indicator provides real-time calculations for position sizing based on account size, risk percentage, and stop-loss levels, while displaying multiple take-profit targets with customizable risk-reward ratios.
Key Features
Position Sizing & Risk Management:
Automatic position size calculation based on account size and risk percentage
Support for leveraged trading with maximum leverage limits
Fractional shares support for brokers that allow partial share trading
Real-time fee calculation including entry, stop-loss, and take-profit fees
Break-even price calculation including trading fees
Multi-Target Profit Management:
Support for up to 3 take-profit levels with individual portion allocations
Customizable risk-reward ratios for each take-profit target
Visual profit/loss zones displayed as colored boxes on the chart
Individual profit calculations for each take-profit level
Visual Dashboard:
Clean, customizable table display showing all key metrics
Configurable label positioning and styling options
Real-time tracking of whether stop-loss or take-profit levels have been reached
Color-coded visual zones for easy identification of risk and reward areas
Advanced Configuration:
Comprehensive input validation and error handling
Support for different chart timeframes and symbols
Customizable colors, fonts, and display options
Hide/show individual data fields for personalized dashboard views
How to Use
Set Account Parameters: Configure your account size, maximum risk percentage per trade, and trading fees in the "Account Settings" section.
Define Trade Setup: Use the "Entry" time picker to select your entry point on the chart, then input your entry price and stop-loss level.
Configure Take Profits: Set your desired risk-reward ratios and portion allocations for each take-profit level. The script supports 1-3 take-profit targets.
Analyze Results: The dashboard will automatically calculate and display position size, number of shares, potential profits/losses, fees, and break-even levels.
Visual Confirmation: Colored boxes on the chart show profit zones (green) and loss zones (red), with lines extending to current price levels.
Reset Entry and SL:
You can easily reset the entry and stop-loss by clicking the "Reset points..." button from the script's "More" menu.
This is useful if you want to quickly clear your current trade setup and start fresh without manually adjusting the points on the chart.
Calculations
The script performs sophisticated calculations including:
Position size based on risk amount and price difference between entry and stop-loss
Leverage requirements and position amount calculations
Fee-adjusted risk-reward ratios for realistic profit expectations
Break-even price including all trading costs
Individual profit calculations for partial position closures
Detailed Take-Profit Calculation Formula:
The take-profit prices are calculated using the following mathematical formula:
// Core variables:
// risk_amount = account_size * (risk_percentage / 100)
// total_risk_per_share = |entry_price - sl_price| + (entry_price * fee%) + (sl_price * fee%)
// shares = risk_amount / total_risk_per_share
// direction_factor = 1 for long positions, -1 for short positions
// Take-profit calculation:
net_win = total_risk_per_share * shares * RR_ratio
tp_price = (net_win + (direction_factor * entry_price * shares) + (entry_price * fee% * shares)) / (direction_factor * shares - fee% * shares)
Step-by-step example for a long position (based on screenshot):
Account Size: 2,000 USDT, Risk: 2% = 40 USDT
Entry: 102,062.9 USDT, Stop Loss: 102,178.4 USDT, Fee: 0.06%
Risk per share: |102,062.9 - 102,178.4| + (102,062.9 × 0.0006) + (102,178.4 × 0.0006) = 115.5 + 61.24 + 61.31 = 238.05 USDT
Shares: 40 ÷ 238.05 = 0.168 shares (rounded to 0.17 in display)
Position Size: 0.17 × 102,062.9 = 17,350.69 USDT
Position Amount (with 9x leverage): 17,350.69 ÷ 9 = 1,927.85 USDT
For 2:1 RR: Net win = 238.05 × 0.17 × 2 = 80.94 USDT
TP1 price = (80.94 + (1 × 102,062.9 × 0.17) + (102,062.9 × 0.0006 × 0.17)) ÷ (1 × 0.17 - 0.0006 × 0.17) = 101,464.7 USDT
For 3:1 RR: TP2 price = 101,226.7 USDT (following same formula with RR=3)
This ensures that after accounting for all fees, the actual risk-reward ratio matches the specified target ratio.
Risk Management Features
Maximum Trade Amount: Optional setting to limit position size regardless of account size
Leverage Limits: Built-in maximum leverage protection
Fee Integration: All calculations include realistic trading fees for accurate expectations
Validation: Automatic checking that take-profit portions sum to 100%
Historical Tracking: Visual indication when stop-loss or take-profit levels are reached (within last 5000 bars)
Understanding Max Trade Amount - Multiple Simultaneous Trades:
The "Max Trade Amount" feature is designed for traders who want to open multiple positions simultaneously while maintaining proper risk management. Here's how it works:
Key Concept:
- Risk percentage (2%) always applies to your full Account Size
- Max Trade Amount limits the capital allocated per individual trade
- This allows multiple trades with full risk on each trade
Example from Screenshot:
Account Size: 2,000 USDT
Max Trade Amount: 500 USDT
Risk per Trade: 2% × 2,000 = 40 USDT per trade
Stop Loss Distance: 0.11% from entry
Result: Position Size = 17,350.69 USDT with 35x leverage
Total Risk (including fees): 40.46 USDT
Multiple Trades Strategy:
With this setup, you can open:
Trade 1: 40 USDT risk, 495.73 USDT position amount (35x leverage)
Trade 2: 40 USDT risk, 495.73 USDT position amount (35x leverage)
Trade 3: 40 USDT risk, 495.73 USDT position amount (35x leverage)
Trade 4: 40 USDT risk, 495.73 USDT position amount (35x leverage)
Total Portfolio Exposure:
- 4 simultaneous trades = 4 × 495.73 = 1,982.92 USDT position amount
- Total risk exposure = 4 × 40 = 160 USDT (8% of account)

TJR asia session sweep//@version=5
strategy("TJR asia session sweep", "TJR Asia Sweep", overlay=true, max_lines_count=500, max_labels_count=500)
// Input settings
show_asian = input.bool(true, "Show Asian Session", group="Visual Settings")
show_london = input.bool(true, "Show London Session", group="Visual Settings")
show_swing_points = input.bool(true, "Show Asian Swing Points", group="Visual Settings")
show_market_structure = input.bool(true, "Show Market Structure", group="Visual Settings")
show_bos = input.bool(true, "Show Break of Structure", group="Visual Settings")
// Session Time Settings
asian_start_hour_input = input.int(22, "Asian Session Start Hour", minval=0, maxval=23, group="Session Times")
asian_end_hour_input = input.int(3, "Asian Session End Hour", minval=0, maxval=23, group="Session Times")
london_start_hour_input = input.int(3, "London Session Start Hour", minval=0, maxval=23, group="Session Times")
london_end_hour_input = input.int(8, "London Session End Hour", minval=0, maxval=23, group="Session Times")
session_timezone = input.string("America/New_York", "Session Timezone", options= , group="Session Times")
// Risk Management Settings
use_atr_sl = input.bool(false, "Use ATR Multiplier for Stop Loss", group="Risk Management")
atr_length = input.int(14, "ATR Length", minval=1, maxval=50, group="Risk Management")
atr_multiplier = input.float(2.0, "ATR Multiplier for Stop Loss", minval=0.5, maxval=10.0, group="Risk Management")
force_london_close = input.bool(true, "Force Close at London Session End", group="Risk Management")
cutoff_minutes = input.int(60, "Minutes Before Session End to Stop New Trades", minval=0, maxval=300, group="Risk Management")
// Position Sizing Settings
position_sizing_method = input.string("USD Risk", "Position Sizing Method", options= , group="Position Sizing")
usd_risk_per_trade = input.float(100.0, "USD Risk Per Trade", minval=1.0, maxval=10000.0, group="Position Sizing")
fixed_contracts = input.float(1.0, "Fixed Number of Contracts", minval=0.01, maxval=1000.0, step=0.01, group="Position Sizing")
// Color settings
asian_color = input.color(color.red, "Asian Session Color")
london_color = input.color(color.blue, "London Session Color")
swing_high_color = input.color(color.orange, "Swing High Color")
swing_low_color = input.color(color.lime, "Swing Low Color")
bullish_structure_color = input.color(color.green, "Bullish Structure Color")
bearish_structure_color = input.color(color.red, "Bearish Structure Color")
bos_color = input.color(color.orange, "Break of Structure Color")
// Line settings
line_width = input.int(2, "Line Width", minval=1, maxval=5)
// ATR calculation for stop loss
atr = ta.atr(atr_length)
// Position size calculation function
calculate_position_size(entry_price, stop_loss_price) =>
var float position_size = na
if position_sizing_method == "Fixed Contracts"
position_size := fixed_contracts
else // USD Risk method
stop_distance = math.abs(entry_price - stop_loss_price)
if stop_distance > 0
// Calculate position size based on USD risk per trade
// For forex: position_size = risk_amount / (stop_distance * point_value)
// For most forex pairs, point value = 1 (since we're dealing with price differences directly)
position_size := usd_risk_per_trade / stop_distance
else
position_size := fixed_contracts // Fallback to fixed contracts if stop distance is 0
position_size
// Session time definitions (using input variables)
asian_start_hour = asian_start_hour_input
asian_end_hour = asian_end_hour_input
london_start_hour = london_start_hour_input
london_end_hour = london_end_hour_input
// Get current hour using selected timezone
current_hour = hour(time, session_timezone)
// Previous hour for transition detection
prev_hour = hour(time , session_timezone)
// Session transition detection
asian_start = current_hour == asian_start_hour and prev_hour != asian_start_hour
asian_end = current_hour == asian_end_hour and prev_hour != asian_end_hour
london_start = current_hour == london_start_hour and prev_hour != london_start_hour
london_end = current_hour == london_end_hour and prev_hour != london_end_hour
// Session activity detection
asian_active = (current_hour >= asian_start_hour) or (current_hour < asian_end_hour)
london_active = (current_hour >= london_start_hour) and (current_hour < london_end_hour)
// Session boxes - keep previous sessions visible
var box asian_session_box = na
var box london_session_box = na
// Create Asian session box
if show_asian and asian_start
// Create new box at session start (previous box remains visible)
asian_session_box := box.new(bar_index, high, bar_index + 1, low,
border_color=asian_color, bgcolor=color.new(asian_color, 90),
border_width=2, border_style=line.style_solid)
// Pre-calculate session highs and lows for consistency
asian_session_length = asian_active and not na(asian_session_box) ? bar_index - box.get_left(asian_session_box) + 1 : 1
current_asian_high = ta.highest(high, asian_session_length)
current_asian_low = ta.lowest(low, asian_session_length)
// Update Asian session box continuously during session
if show_asian and asian_active and not na(asian_session_box)
box.set_right(asian_session_box, bar_index)
// Update box to contain session highs and lows
box.set_top(asian_session_box, current_asian_high)
box.set_bottom(asian_session_box, current_asian_low)
// Create London session box
if show_london and london_start
// Create new box at session start (previous box remains visible)
london_session_box := box.new(bar_index, high, bar_index + 1, low,
border_color=london_color, bgcolor=color.new(london_color, 90),
border_width=2, border_style=line.style_solid)
// Pre-calculate London session highs and lows for consistency
london_session_length = london_active and not na(london_session_box) ? bar_index - box.get_left(london_session_box) + 1 : 1
current_london_high = ta.highest(high, london_session_length)
current_london_low = ta.lowest(low, london_session_length)
// Update London session box continuously during session
if show_london and london_active and not na(london_session_box)
box.set_right(london_session_box, bar_index)
// Update box to contain session highs and lows
box.set_top(london_session_box, current_london_high)
box.set_bottom(london_session_box, current_london_low)
// Asian Session Swing Points Detection
var float asian_session_high = na
var float asian_session_low = na
var int asian_high_bar = na
var int asian_low_bar = na
// Asian Session Absolute High/Low for TP levels
var float asian_absolute_high = na
var float asian_absolute_low = na
var line asian_high_line = na
var line asian_low_line = na
var label asian_high_label = na
var label asian_low_label = na
var bool high_broken = false
var bool low_broken = false
// London Session High/Low tracking for stop loss
var float london_session_high = na
var float london_session_low = na
// Market structure tracking variables
var string breakout_direction = na // "bullish" or "bearish"
var float last_hh_level = na // Last Higher High level
var float last_hl_level = na // Last Higher Low level
var float last_ll_level = na // Last Lower Low level
var float last_lh_level = na // Last Lower High level
var int structure_count = 0
var string last_structure_type = na // "HH", "HL", "LL", "LH"
// Legacy variables for compatibility
var float last_swing_high = na
var float last_swing_low = na
var int last_high_bar = na
var int last_low_bar = na
// Market structure state tracking
var float pending_high = na
var float pending_low = na
var int pending_high_bar = na
var int pending_low_bar = na
var bool waiting_for_confirmation = false
// Break of Structure tracking variables
var float most_recent_hl = na
var float most_recent_lh = na
var int most_recent_hl_bar = na
var int most_recent_lh_bar = na
var bool bos_detected = false
// Trading variables
var bool trade_taken = false
// Trade visualization boxes (based on Casper strategy approach)
var box current_profit_box = na
var box current_sl_box = na
// Update swing points during Asian session
if asian_active and show_swing_points
// Always track absolute high/low for both TP levels and breakout detection
if na(asian_absolute_high) or high > asian_absolute_high
asian_absolute_high := high
if na(asian_absolute_low) or low < asian_absolute_low
asian_absolute_low := low
// Use absolute high/low for breakout levels (simplified logic)
if na(asian_session_high) or high > asian_session_high
asian_session_high := high
asian_high_bar := bar_index
if na(asian_session_low) or low < asian_session_low
asian_session_low := low
asian_low_bar := bar_index
// Track London session high/low for stop loss levels
if london_active
if na(london_session_high) or high > london_session_high
london_session_high := high
if na(london_session_low) or low < london_session_low
london_session_low := low
// Draw initial lines when Asian session ends
if asian_end and show_swing_points
if not na(asian_session_high) and not na(asian_high_bar)
// Draw extending line for high
asian_high_line := line.new(asian_high_bar, asian_session_high, bar_index + 200, asian_session_high,
color=swing_high_color, width=2, style=line.style_dashed, extend=extend.right)
asian_high_label := label.new(bar_index + 5, asian_session_high, "Asian High: " + str.tostring(asian_session_high, "#.####"), style=label.style_label_left, color=swing_high_color, textcolor=color.white, size=size.small)
if not na(asian_session_low) and not na(asian_low_bar)
// Draw extending line for low
asian_low_line := line.new(asian_low_bar, asian_session_low, bar_index + 200, asian_session_low,
color=swing_low_color, width=2, style=line.style_dashed, extend=extend.right)
asian_low_label := label.new(bar_index + 5, asian_session_low, "Asian Low: " + str.tostring(asian_session_low, "#.####"), style=label.style_label_left, color=swing_low_color, textcolor=color.white, size=size.small)
// Reset break flags for new session
high_broken := false
low_broken := false
// Check for breakouts during London session
if london_active and show_swing_points and not na(asian_session_high) and not na(asian_session_low)
// Check if Asian high is broken
if not high_broken and not low_broken and high > asian_session_high
high_broken := true
// Update high line to end at break point
if not na(asian_high_line)
line.set_x2(asian_high_line, bar_index)
line.set_extend(asian_high_line, extend.none)
// Remove the low line (first break wins)
if not na(asian_low_line)
line.delete(asian_low_line)
if not na(asian_low_label)
label.delete(asian_low_label)
// Add break marker
label.new(bar_index, asian_session_high * 1.001, "HIGH BREAK!",
style=label.style_label_down, color=color.red, textcolor=color.white, size=size.normal)
// Set breakout direction and initialize structure tracking
breakout_direction := "bullish"
last_swing_high := asian_session_high
last_swing_low := asian_session_low
last_high_bar := bar_index
structure_count := 0
// Check if Asian low is broken
if not low_broken and not high_broken and low < asian_session_low
low_broken := true
// Update low line to end at break point
if not na(asian_low_line)
line.set_x2(asian_low_line, bar_index)
line.set_extend(asian_low_line, extend.none)
// Remove the high line (first break wins)
if not na(asian_high_line)
line.delete(asian_high_line)
if not na(asian_high_label)
label.delete(asian_high_label)
// Add break marker
label.new(bar_index, asian_session_low * 0.999, "LOW BREAK!",
style=label.style_label_up, color=color.red, textcolor=color.white, size=size.normal)
// Set breakout direction and initialize structure tracking
breakout_direction := "bearish"
last_swing_high := asian_session_high
last_swing_low := asian_session_low
last_low_bar := bar_index
structure_count := 0
// Stop extending lines when London session ends (if not already broken)
if london_end and show_swing_points
if not high_broken and not na(asian_high_line)
line.set_x2(asian_high_line, bar_index)
line.set_extend(asian_high_line, extend.none)
if not low_broken and not na(asian_low_line)
line.set_x2(asian_low_line, bar_index)
line.set_extend(asian_low_line, extend.none)
// Force close all trades at London session end (if enabled)
if london_end and force_london_close
if strategy.position_size != 0
// Extend boxes immediately before session close to prevent timing issues
if not na(current_profit_box)
// Ensure minimum 8 bars width or extend to current bar, whichever is longer
box_left = box.get_left(current_profit_box)
min_right = box_left + 8
final_right = math.max(min_right, bar_index)
box.set_right(current_profit_box, final_right)
current_profit_box := na // Clear reference after extending
if not na(current_sl_box)
// Ensure minimum 8 bars width or extend to current bar, whichever is longer
box_left = box.get_left(current_sl_box)
min_right = box_left + 8
final_right = math.max(min_right, bar_index)
box.set_right(current_sl_box, final_right)
current_sl_box := na // Clear reference after extending
strategy.close_all(comment="London Close")
trade_taken := false // Reset trade flag for next session
// Market structure detection after breakout (only during London session and before first BoS)
if show_market_structure and not na(breakout_direction) and london_active and not bos_detected
// Bullish structure tracking (HH, HL alternating)
if breakout_direction == "bullish"
// Check for Higher High pattern: Bullish candle followed by bearish candle
pattern_high = math.max(high , high)
prev_hh = na(last_hh_level) ? last_swing_high : last_hh_level
// HH Detection: Only if we expect HH next (no last structure or last was HL)
if (na(last_structure_type) or last_structure_type == "HL") and close > open and close < open and pattern_high > prev_hh and close > prev_hh
// Check consolidation
is_too_close = not na(last_high_bar) and (bar_index - last_high_bar) <= 4
should_create_hh = true
if is_too_close and structure_count > 0 and pattern_high <= last_hh_level
should_create_hh := false
if should_create_hh
structure_count := structure_count + 1
label.new(bar_index - 1, high + (high * 0.0003), "HH" + str.tostring(structure_count),
style=label.style_none, color=color.new(color.white, 100),
textcolor=color.white, size=size.small)
last_hh_level := pattern_high
last_swing_high := pattern_high
last_high_bar := bar_index
last_structure_type := "HH"
// HL Detection: Only if we expect HL next (last was HH)
pattern_low = math.min(low , low)
prev_hl = na(last_hl_level) ? last_swing_low : last_hl_level
if last_structure_type == "HH" and close < open and close > open and pattern_low > prev_hl and close > prev_hl
// Check consolidation
is_too_close = not na(last_low_bar) and (bar_index - last_low_bar) <= 4
should_create_hl = true
if is_too_close and pattern_low <= last_hl_level
should_create_hl := false
if should_create_hl
structure_count := structure_count + 1
label.new(bar_index - 1, low - (low * 0.0003), "HL" + str.tostring(structure_count),
style=label.style_none, color=color.new(color.white, 100),
textcolor=color.white, size=size.small)
last_hl_level := pattern_low
most_recent_hl := pattern_low // Update most recent HL for BoS detection
most_recent_hl_bar := bar_index - 1 // Store HL bar position
last_low_bar := bar_index
last_structure_type := "HL"
// Bearish structure tracking (LL, LH alternating)
if breakout_direction == "bearish"
// Check for Lower Low pattern: Bearish candle followed by bullish candle
pattern_low = math.min(low , low)
prev_ll = na(last_ll_level) ? last_swing_low : last_ll_level
// LL Detection: Only if we expect LL next (no last structure or last was LH)
if (na(last_structure_type) or last_structure_type == "LH") and close < open and close > open and pattern_low < prev_ll and close < prev_ll
// Check consolidation
is_too_close = not na(last_low_bar) and (bar_index - last_low_bar) <= 4
should_create_ll = true
if is_too_close and structure_count > 0 and pattern_low >= last_ll_level
should_create_ll := false
if should_create_ll
structure_count := structure_count + 1
label.new(bar_index - 1, low - (low * 0.0003), "LL" + str.tostring(structure_count),
style=label.style_none, color=color.new(color.white, 100),
textcolor=color.white, size=size.small)
last_ll_level := pattern_low
last_swing_low := pattern_low
last_low_bar := bar_index
last_structure_type := "LL"
// LH Detection: Only if we expect LH next (last was LL)
pattern_high = math.max(high , high)
prev_lh = na(last_lh_level) ? last_swing_high : last_lh_level
if last_structure_type == "LL" and close > open and close < open and pattern_high < prev_lh and close < prev_lh
// Check consolidation
is_too_close = not na(last_high_bar) and (bar_index - last_high_bar) <= 4
should_create_lh = true
if is_too_close and pattern_high >= last_lh_level
should_create_lh := false
if should_create_lh
structure_count := structure_count + 1
label.new(bar_index - 1, high + (high * 0.0003), "LH" + str.tostring(structure_count),
style=label.style_none, color=color.new(color.white, 100),
textcolor=color.white, size=size.small)
last_lh_level := pattern_high
most_recent_lh := pattern_high // Update most recent LH for BoS detection
most_recent_lh_bar := bar_index - 1 // Store LH bar position
last_high_bar := bar_index
last_structure_type := "LH"
// Check if we're within the cutoff period before London session end
current_minute = minute(time, session_timezone)
london_end_time_minutes = london_end_hour * 60 // Convert London end hour to minutes
current_time_minutes = current_hour * 60 + current_minute // Current time in minutes
// Calculate minutes remaining in London session
london_session_minutes_remaining = london_end_time_minutes - current_time_minutes
// Handle day rollover case (e.g., if london_end is 8:00 (480 min) and current is 23:30 (1410 min))
if london_session_minutes_remaining < 0
london_session_minutes_remaining := london_session_minutes_remaining + (24 * 60) // Add 24 hours in minutes
// Only allow trades if more than cutoff_minutes remaining in London session
allow_new_trades = london_session_minutes_remaining > cutoff_minutes
// Break of Structure (BoS) Detection and Trading Logic - Only first BoS per London session and outside cutoff period
if show_bos and london_active and show_market_structure and not bos_detected and not trade_taken and allow_new_trades
// Bullish BoS: Price closes below the most recent HL (after bullish breakout) - SELL SIGNAL
if breakout_direction == "bullish" and not na(most_recent_hl) and not na(most_recent_hl_bar)
// Check minimum distance requirement (at least 4 candles between BoS and HL)
if close < most_recent_hl and (bar_index - most_recent_hl_bar) >= 4
// Draw dotted line from HL position to BoS point
line.new(most_recent_hl_bar, most_recent_hl, bar_index, most_recent_hl,
color=bos_color, width=2, style=line.style_dotted, extend=extend.none)
// Calculate center position for BoS label
center_bar = math.round((most_recent_hl_bar + bar_index) / 2)
// Draw BoS label below the line for HL break
label.new(center_bar, most_recent_hl - (most_recent_hl * 0.0005), "BoS",
style=label.style_none, color=color.new(color.white, 100),
textcolor=bos_color, size=size.normal)
// SELL ENTRY
if not na(london_session_high) and not na(asian_absolute_low)
// Calculate stop loss based on settings
stop_loss_level = use_atr_sl ? close + (atr * atr_multiplier) : london_session_high
take_profit_level = asian_absolute_low
entry_price = close
// Calculate position size based on user settings
position_size = calculate_position_size(entry_price, stop_loss_level)
strategy.entry("SELL", strategy.short, qty=position_size, comment="BoS Sell")
strategy.exit("SELL EXIT", "SELL", stop=stop_loss_level, limit=take_profit_level, comment="SL/TP")
// Create trade visualization boxes (TradingView style) - minimum 8 bars width
// Blue profit zone box (from entry to take profit)
current_profit_box := box.new(left=bar_index, top=take_profit_level, right=bar_index + 8, bottom=entry_price,
bgcolor=color.new(color.blue, 70), border_width=0)
// Red stop loss zone box (from entry to stop loss)
current_sl_box := box.new(left=bar_index, top=entry_price, right=bar_index + 8, bottom=stop_loss_level,
bgcolor=color.new(color.red, 70), border_width=0)
trade_taken := true
bos_detected := true // Mark BoS as detected for this session
// Bearish BoS: Price closes above the most recent LH (after bearish breakout) - BUY SIGNAL
if breakout_direction == "bearish" and not na(most_recent_lh) and not na(most_recent_lh_bar)
// Check minimum distance requirement (at least 4 candles between BoS and LH)
if close > most_recent_lh and (bar_index - most_recent_lh_bar) >= 4
// Draw dotted line from LH position to BoS point
line.new(most_recent_lh_bar, most_recent_lh, bar_index, most_recent_lh,
color=bos_color, width=1, style=line.style_dotted, extend=extend.none)
// Calculate center position for BoS label
center_bar = math.round((most_recent_lh_bar + bar_index) / 2)
// Draw BoS label above the line for LH break
label.new(center_bar, most_recent_lh + (most_recent_lh * 0.0005), "BoS",
style=label.style_none, color=color.new(color.white, 100),
textcolor=bos_color, size=size.normal)
// BUY ENTRY
if not na(london_session_low) and not na(asian_absolute_high)
// Calculate stop loss based on settings
stop_loss_level = use_atr_sl ? close - (atr * atr_multiplier) : london_session_low
take_profit_level = asian_absolute_high
entry_price = close
// Calculate position size based on user settings
position_size = calculate_position_size(entry_price, stop_loss_level)
strategy.entry("BUY", strategy.long, qty=position_size, comment="BoS Buy")
strategy.exit("BUY EXIT", "BUY", stop=stop_loss_level, limit=take_profit_level, comment="SL/TP")
// Create trade visualization boxes (TradingView style) - minimum 8 bars width
// Blue profit zone box (from entry to take profit)
current_profit_box := box.new(left=bar_index, top=entry_price, right=bar_index + 8, bottom=take_profit_level,
bgcolor=color.new(color.blue, 70), border_width=0)
// Red stop loss zone box (from entry to stop loss)
current_sl_box := box.new(left=bar_index, top=stop_loss_level, right=bar_index + 8, bottom=entry_price,
bgcolor=color.new(color.red, 70), border_width=0)
trade_taken := true
bos_detected := true // Mark BoS as detected for this session
// Position close detection for extending boxes (based on Casper strategy)
if barstate.isconfirmed and strategy.position_size == 0 and strategy.position_size != 0
// Extend trade visualization boxes to exact exit point when position closes
if not na(current_profit_box)
// Ensure minimum 8 bars width or extend to current bar, whichever is longer
box_left = box.get_left(current_profit_box)
min_right = box_left + 8
final_right = math.max(min_right, bar_index)
box.set_right(current_profit_box, final_right)
current_profit_box := na // Clear reference after extending
if not na(current_sl_box)
// Ensure minimum 8 bars width or extend to current bar, whichever is longer
box_left = box.get_left(current_sl_box)
min_right = box_left + 8
final_right = math.max(min_right, bar_index)
box.set_right(current_sl_box, final_right)
current_sl_box := na // Clear reference after extending
// Backup safety check - extend boxes if position is closed but boxes still active
if not na(current_profit_box) and strategy.position_size == 0
box_left = box.get_left(current_profit_box)
min_right = box_left + 8
final_right = math.max(min_right, bar_index)
box.set_right(current_profit_box, final_right)
current_profit_box := na
if not na(current_sl_box) and strategy.position_size == 0
box_left = box.get_left(current_sl_box)
min_right = box_left + 8
final_right = math.max(min_right, bar_index)
box.set_right(current_sl_box, final_right)
current_sl_box := na
// Reset everything when new Asian session starts
if asian_start and show_swing_points
asian_session_high := na
asian_session_low := na
asian_high_bar := na
asian_low_bar := na
// Reset absolute levels
asian_absolute_high := na
asian_absolute_low := na
asian_high_line := na
asian_low_line := na
asian_high_label := na
asian_low_label := na
high_broken := false
low_broken := false
// Reset London session levels
london_session_high := na
london_session_low := na
// Reset market structure tracking
breakout_direction := na
last_hh_level := na
last_hl_level := na
last_ll_level := na
last_lh_level := na
last_swing_high := na
last_swing_low := na
last_high_bar := na
last_low_bar := na
structure_count := 0
last_structure_type := na
pending_high := na
pending_low := na
pending_high_bar := na
pending_low_bar := na
waiting_for_confirmation := false
// Reset BoS tracking
most_recent_hl := na
most_recent_lh := na
most_recent_hl_bar := na
most_recent_lh_bar := na
bos_detected := false
// Reset trading
trade_taken := false
// Reset current trade boxes
current_profit_box := na
current_sl_box := na
// Debug info (optional)
show_debug = input.bool(false, "Show Debug Info")
if show_debug
var table debug_table = table.new(position.top_right, 2, 3, bgcolor=color.white, border_width=1)
if barstate.islast
table.cell(debug_table, 0, 0, "Current Hour:", text_color=color.black)
table.cell(debug_table, 1, 0, str.tostring(current_hour), text_color=color.black)
table.cell(debug_table, 0, 1, "Asian Active:", text_color=color.black)
table.cell(debug_table, 1, 1, str.tostring((current_hour >= asian_start_hour) or (current_hour < asian_end_hour)), text_color=color.black)
table.cell(debug_table, 0, 2, "London Active:", text_color=color.black)
table.cell(debug_table, 1, 2, str.tostring((current_hour >= london_start_hour) and (current_hour < london_end_hour)), text_color=color.black)

LO1_TradersPostLibrary "LO1_TradersPost"
Enhanced TradersPost integration library with comprehensive order management
_buildJSONField(key, value, required)
Build a JSON field with proper handling of required vs optional fields
Parameters:
key (string) : The JSON key name
value (string) : The value to include (any type, will be converted to string)
required (bool) : If true, field is always included even if value is na/empty
Returns: String containing JSON field or empty string if optional and na/empty
_buildConditionalField(key, value)
Build a conditional JSON field that's only included if value is valid
Parameters:
key (string) : The JSON key name
value (string) : The value to include
Returns: String containing JSON field or empty string if value is na/empty
_buildConditionalNumericField(key, value)
Build a conditional JSON field for numeric values
Parameters:
key (string) : The JSON key name
value (float) : The numeric value
Returns: String containing JSON field or empty string if value is na
_buildNestedObject(objectType, price, amount, percent, stopType, limitPrice, trailAmount, trailPercent)
Build nested JSON objects for takeProfit/stopLoss
Parameters:
objectType (string) : The type of object being built ("takeProfit" or "stopLoss")
price (float) : The limit price for TP or stop price for SL
amount (float) : The dollar amount (optional)
percent (float) : The percentage (optional)
stopType (series StopLossType) : The stop loss type - only for stopLoss
limitPrice (float) : The limit price for stop_limit orders - only for stopLoss
trailAmount (float) : Trailing amount for trailing stops - only for stopLoss
trailPercent (float) : Trailing percent for trailing stops - only for stopLoss
Returns: String containing nested JSON object or empty string if no valid data
_validateAndBuildJSON(ticker, action, quantity, quantityType, orderType, sentiment, cancel, timeInForce, limitPrice, stopPrice, trailAmount, trailPercent, takeProfitPrice, takeProfitAmount, takeProfitPercent, stopLossPrice, stopLossAmount, stopLossPercent, stopLossType, stopLossLimitPrice, extendedHours, optionType, intrinsicValue, expiration, strikePrice, signalPrice, comment)
Master JSON builder that validates parameters and constructs JSON
Parameters:
ticker (string) : The trading symbol
action (series Action) : The order action (buy, sell, exit, etc.)
quantity (float) : The order quantity
quantityType (series QuantityType) : The type of quantity (fixed, dollar, percent)
orderType (series OrderType) : The order type (market, limit, stop, etc.)
sentiment (series Sentiment) : The position sentiment (long, short, flat) - optional
cancel (bool) : Controls order cancellation (true = cancel existing orders, false = don't cancel)
timeInForce (series TimeInForce) : Time in force for the order (DAY, GTC, IOC, FOK)
limitPrice (float) : Price for limit orders
stopPrice (float) : Price for stop orders
trailAmount (float) : Trailing amount for trailing stops
trailPercent (float) : Trailing percent for trailing stops
takeProfitPrice (float) : Take profit limit price (absolute)
takeProfitAmount (float) : Take profit dollar amount (relative)
takeProfitPercent (float) : Take profit percentage (relative)
stopLossPrice (float) : Stop loss price (absolute)
stopLossAmount (float) : Stop loss dollar amount (relative)
stopLossPercent (float) : Stop loss percentage (relative)
stopLossType (series StopLossType) : Stop loss order type
stopLossLimitPrice (float) : Limit price for stop_limit orders
extendedHours (bool) : Enable extended hours trading (boolean)
optionType (series OptionType) : Option type for options trading (both/call/put)
intrinsicValue (series IntrinsicValue) : Intrinsic value filter for options (itm/otm)
expiration (string) : Option expiration (date string)
strikePrice (float) : Option strike price
signalPrice (float) : The market price at alert time (for slippage tracking)
comment (string) : Optional comment for the order (shows in TradersPost UI for debugging)
Returns: ErrorResponse with success status and JSON string or error details
ValidateOrder(ticker, action, orderType, limitPrice, stopPrice)
Validate order parameters before JSON construction
Parameters:
ticker (string) : Trading symbol
action (series Action) : Order action
orderType (series OrderType) : Order type (market, limit, stop, etc.)
limitPrice (float) : Limit price for limit orders
stopPrice (float) : Stop price for stop orders
Returns: ErrorResponse with validation results
ValidateQuantity(quantity, quantityType)
Validate quantity based on type and constraints
Parameters:
quantity (float) : The quantity value
quantityType (series QuantityType) : The type of quantity
Returns: ErrorResponse with validation results
ValidatePrices(entryPrice, stopPrice, takeProfitPrice, action)
Validate price relationships and values
Parameters:
entryPrice (float) : Entry price for the order
stopPrice (float) : Stop loss price
takeProfitPrice (float) : Take profit price
action (series Action) : Order action (buy/sell)
Returns: ErrorResponse with validation results
ValidateSymbol(ticker)
Validate trading symbol format
Parameters:
ticker (string) : The symbol to validate
Returns: ErrorResponse with validation results
CombineValidationResults(validationResults)
Create validation error collection and reporting system
Parameters:
validationResults (array) : Array of ErrorResponse objects from multiple validations
Returns: Combined ErrorResponse with all validation results
ValidateCompleteOrder(ticker, action, quantity, quantityType, orderType, limitPrice, stopPrice, takeProfitPrice)
Comprehensive validation for all order parameters
Parameters:
ticker (string) : Trading symbol
action (series Action) : Order action
quantity (float) : Order quantity
quantityType (series QuantityType) : Type of quantity
orderType (series OrderType) : Order type
limitPrice (float) : Limit price (optional)
stopPrice (float) : Stop price (optional)
takeProfitPrice (float) : Take profit price (optional)
Returns: ErrorResponse with complete validation results
CreateErrorResponse(success, errorMessages, message, severity, context, functionName)
Create standardized error response
Parameters:
success (bool) : Whether the operation succeeded
errorMessages (array) : Array of error messages
message (string) : Summary message
severity (series ErrorSeverity) : Error severity level
context (string) : Context where error occurred
functionName (string) : Name of function that generated error
Returns: EnhancedErrorResponse with all error details
HandleValidationError(validationResult, context, functionName)
Handle validation errors with context
Parameters:
validationResult (ErrorResponse) : The validation result to handle
context (string) : Description of what was being validated
functionName (string) : Name of calling function
Returns: Processed error response with enhanced context
LogError(errorResponse, displayOnChart)
Log error with appropriate level
Parameters:
errorResponse (EnhancedErrorResponse) : The error response to log
displayOnChart (bool) : Whether to show error on chart
CreateSuccessResponse(message, context, functionName)
Create success response
Parameters:
message (string) : Success message
context (string) : Context of successful operation
functionName (string) : Name of function
Returns: Success response
_validateJSONConstruction(jsonString)
Validate JSON construction and handle malformed data
Parameters:
jsonString (string) : The constructed JSON string
Returns: ErrorResponse indicating if JSON is valid
CreateDetailedError(success, errors, warnings, severity, context)
Create detailed error response with context
Parameters:
success (bool) : Operation success status
errors (array) : Array of error messages
warnings (array) : Array of warning messages
severity (series ErrorSeverity) : Error severity level
context (string) : Context where error occurred
Returns: DetailedErrorResponse object
LogDetailedError(response)
Log detailed error response with appropriate severity
Parameters:
response (DetailedErrorResponse) : DetailedErrorResponse to log
Returns: Nothing - logs to Pine Script console
CombineIntoDetailedResponse(responses, context)
Combine multiple error responses into detailed response
Parameters:
responses (array) : Array of ErrorResponse objects to combine
context (string) : Context for the combined operation
Returns: DetailedErrorResponse with combined results
SendAdvancedOrder(ticker, action, quantity, quantityType, orderType, sentiment, cancel, limitPrice, stopPrice, trailAmount, trailPercent, takeProfitPrice, takeProfitAmount, takeProfitPercent, stopLossPrice, stopLossAmount, stopLossPercent, stopLossType, stopLossLimitPrice, extendedHours, optionType, intrinsicValue, expiration, strikePrice, signalPrice, comment)
Send advanced order with comprehensive parameter validation and JSON construction
Parameters:
ticker (string) : Symbol to trade (defaults to syminfo.ticker)
action (series Action) : Order action (buy/sell/exit/cancel/add)
quantity (float) : Order quantity
quantityType (series QuantityType) : Type of quantity (fixed/dollar/percent)
orderType (series OrderType) : Type of order (market/limit/stop/stop_limit/trailing_stop)
sentiment (series Sentiment) : Position sentiment (long/short/flat, optional)
cancel (bool) : Controls order cancellation (true = cancel existing, false = don't cancel, na = use defaults)
limitPrice (float) : Limit price for limit orders
stopPrice (float) : Stop price for stop orders
trailAmount (float) : Trailing amount for trailing stops
trailPercent (float) : Trailing percent for trailing stops
takeProfitPrice (float) : Take profit limit price (absolute)
takeProfitAmount (float) : Take profit dollar amount (relative)
takeProfitPercent (float) : Take profit percentage (relative)
stopLossPrice (float) : Stop loss price (absolute)
stopLossAmount (float) : Stop loss dollar amount (relative)
stopLossPercent (float) : Stop loss percentage (relative)
stopLossType (series StopLossType) : Stop loss order type
stopLossLimitPrice (float) : Limit price for stop_limit orders
extendedHours (bool) : Enable extended hours trading (boolean)
optionType (series OptionType) : Option type for options trading (both/call/put)
intrinsicValue (series IntrinsicValue) : Intrinsic value filter for options (itm/otm)
expiration (string) : Option expiration (date string)
strikePrice (float) : Option strike price
signalPrice (float) : The market price at alert time (for slippage tracking)
comment (string) : Optional comment for the order (shows in TradersPost UI for debugging)
Returns: ErrorResponse with success status and JSON or error details
SendSentiment(ticker, sentiment, quantity, quantityType, signalPrice, comment)
Send sentiment-based position management order
Parameters:
ticker (string) : Symbol to manage (defaults to syminfo.ticker)
sentiment (series Sentiment) : Target position sentiment (long/short/flat)
quantity (float) : Position size (optional, uses account default if not specified)
quantityType (series QuantityType) : Type of quantity specification
signalPrice (float) : The market price at alert time (for slippage tracking)
comment (string) : Optional comment
Returns: ErrorResponse with success status
SendCancelAll(ticker, comment)
Cancel all open orders for the specified symbol
Parameters:
ticker (string) : Symbol to cancel orders for (defaults to syminfo.ticker)
comment (string) : Optional comment for the cancellation
Returns: ErrorResponse with success status
SendOrderNoCancelExisting(ticker, action, quantity, quantityType, orderType, sentiment, limitPrice, stopPrice, takeProfitPrice, takeProfitAmount, takeProfitPercent, stopLossPrice, stopLossAmount, stopLossPercent, stopLossType, stopLossLimitPrice, signalPrice, comment)
Send order without canceling existing orders
Parameters:
ticker (string) : Symbol to trade (defaults to syminfo.ticker)
action (series Action) : Order action (buy/sell/exit)
quantity (float) : Order quantity
quantityType (series QuantityType) : Type of quantity (fixed/dollar/percent)
orderType (series OrderType) : Type of order (market/limit/stop/stop_limit)
sentiment (series Sentiment) : Position sentiment (long/short/flat, optional)
limitPrice (float) : Limit price for limit orders
stopPrice (float) : Stop price for stop orders
takeProfitPrice (float) : Take profit price
takeProfitAmount (float) : Take profit amount (optional)
takeProfitPercent (float)
stopLossPrice (float) : Stop loss price
stopLossAmount (float) : Stop loss amount (optional)
stopLossPercent (float) : Stop loss percentage (optional)
stopLossType (series StopLossType) : Stop loss order type
stopLossLimitPrice (float) : Limit price for stop_limit orders
signalPrice (float) : The market price at alert time (for slippage tracking)
comment (string) : Optional comment
Returns: ErrorResponse with success status
_buildBracketOrderParams(orderType, entryPrice, entryLimitPrice)
Build bracket order parameters by routing entryPrice to correct parameter based on orderType
This helper function maps the conceptual "entryPrice" to the technical parameters needed
Parameters:
orderType (series OrderType) : The order type for the entry order
entryPrice (float) : The desired entry price (trigger for stops, limit for limits)
entryLimitPrice (float) : The limit price for stop_limit orders (optional)
Returns: array with correct routing
SendBracketOrder(ticker, action, quantity, quantityType, orderType, entryPrice, entryLimitPrice, takeProfitPrice, stopLossPrice, takeProfitAmount, takeProfitPercent, stopLossAmount, stopLossPercent, stopLossType, stopLossLimitPrice, signalPrice, comment)
Send bracket order (entry + take profit + stop loss)
Parameters:
ticker (string) : Symbol to trade
action (series Action) : Entry action (buy/sell)
quantity (float) : Order quantity
quantityType (series QuantityType) : Type of quantity specification
orderType (series OrderType) : Type of entry order
entryPrice (float) : Entry price (trigger price for stop orders, limit price for limit orders)
entryLimitPrice (float) : Entry limit price (only for stop_limit orders, defaults to entryPrice if na)
takeProfitPrice (float) : Take profit price
stopLossPrice (float) : Stop loss price
takeProfitAmount (float) : Take profit dollar amount (alternative to price)
takeProfitPercent (float) : Take profit percentage (alternative to price)
stopLossAmount (float) : Stop loss dollar amount (alternative to price)
stopLossPercent (float) : Stop loss percentage (alternative to price)
stopLossType (series StopLossType) : Stop loss order type
stopLossLimitPrice (float) : Limit price for stop_limit orders
signalPrice (float) : The market price at alert time (for slippage tracking)
comment (string) : Optional comment
Returns: ErrorResponse with success status
SendOTOOrder(primaryTicker, primaryAction, primaryQuantity, primaryOrderType, primaryPrice, secondaryTicker, secondaryAction, secondaryQuantity, secondaryOrderType, secondaryPrice, signalPrice, comment)
Send One-Triggers-Other (OTO) order sequence
Note: OTO linking must be configured in TradersPost strategy settings
This sends two separate orders - TradersPost handles the OTO logic
Parameters:
primaryTicker (string) : Primary order ticker
primaryAction (series Action) : Primary order action
primaryQuantity (float) : Primary order quantity
primaryOrderType (series OrderType) : Primary entry type
primaryPrice (float) : Primary order price
secondaryTicker (string) : Secondary order ticker (defaults to primary ticker)
secondaryAction (series Action) : Secondary order action
secondaryQuantity (float) : Secondary order quantity
secondaryOrderType (series OrderType) : Secondary entry type
secondaryPrice (float) : Secondary order price
signalPrice (float) : The market price at alert time (for slippage tracking)
comment (string) : Optional comment for both orders
Returns: ErrorResponse with success status
SendOCOOrder(ticker, firstAction, firstQuantity, firstOrderType, firstPrice, secondAction, secondQuantity, secondOrderType, secondPrice, signalPrice, comment)
Send One-Cancels-Other (OCO) order pair
Note: OCO linking must be configured in TradersPost strategy settings
This sends two separate orders - TradersPost handles the OCO logic
Parameters:
ticker (string) : Symbol for both orders
firstAction (series Action) : Action for first order
firstQuantity (float) : Quantity for first order
firstOrderType (series OrderType) : Order type for first order
firstPrice (float) : Price for first order
secondAction (series Action) : Action for second order
secondQuantity (float) : Quantity for second order
secondOrderType (series OrderType) : Order type for second order
secondPrice (float) : Price for second order
signalPrice (float) : The market price at alert time (for slippage tracking)
comment (string) : Optional comment
Returns: ErrorResponse with success status
ErrorResponse
Fields:
success (series bool)
errors (array)
message (series string)
EnhancedErrorResponse
Fields:
success (series bool)
errors (array)
message (series string)
severity (series ErrorSeverity)
context (series string)
timestamp (series int)
functionName (series string)
DetailedErrorResponse
Fields:
success (series bool)
errors (array)
warnings (array)
severity (series ErrorSeverity)
context (series string)
message (series string)

Liquidity Retest Strategy (Apicode) - TP/SL Lines FixedTechnical Documentation:
1. Purpose and underlying concept
This strategy targets a common behavior in liquid markets: liquidity sweeps around meaningful support/resistance levels, followed by a retest and rejection (reversal) with confirmation.
The core thesis is that many initial “breaks” are not continuation moves, but rather stop-runs and order harvesting. After the sweep, price reclaims the level and closes back on the opposite side, offering a structured entry with defined risk.
The strategy includes:
Support/Resistance detection via pivots
Dynamic selection of the “working” level using an ATR-based proximity window
Rejection validation via candle structure (wick + close)
Optional filters: volume, VWAP-like bias, and EMA trend
Risk management with static TP/SL (ATR-based or %), plus trailing stop (ATR-based or %), with per-trade lines plotted
2. Main components
2.1. Volatility metric: ATR
atr = ta.atr(atrLength) is used in two essential places:
Level selection (proximity to S/R): prevents trading levels that are too far from current price.
Sweep validation (minimum wick size): requires the wick to extend beyond the level by a volatility-relative amount.
Optionally, ATR can also be used for:
Static TP/SL (when usePercent = false)
Trailing stop (when useTrailPercent = false)
2.2. Building S/R levels with pivots
Pivots are detected using:
pivotHigh = ta.pivothigh(pivotLookback, rightBars)
pivotLow = ta.pivotlow(pivotLookback, rightBars)
Each confirmed pivot is stored in arrays:
resistanceLevels for resistance
supportLevels for support
The array size is capped by maxLevels, which reduces noise and manages chart resource usage (lines).
2.3. Selecting the “best” level each bar
On each bar, a single support S and/or resistance R candidate is chosen:
Support: nearest level below price (L < price)
Resistance: nearest level above price (L > price)
Only levels within atr * maxDistATR are considered
This produces dynamic “working levels” that adapt to price location and volatility.
2.4. Rejection pattern (retest + sweep)
After selecting the working level:
Support rejection (long setup)
Conditions:
Low touches/crosses support: low <= S
Close reclaims above: close > S
Bullish candle: close > open
Sufficient wick below the level (liquidity sweep): (S - low) >= atr * minWickATR
This aims to capture a stop sweep below support followed by immediate recovery.
Resistance rejection (short setup)
Symmetric conditions:
High touches/crosses resistance: high >= R
Close rejects back below: close < R
Bearish candle: close < open
Sufficient wick above the level: (high - R) >= atr * minWickATR
2.5. Optional filters
Final signals are the rejection pattern AND enabled filters:
1.- Volume filter
High volume is defined as: volume > SMA(volume, 20) * volMult
When useVolFilter = true, setups require relatively elevated participation
2.- VWAP-like bias filter
A VWAP-like series is computed over vwapLength (typical price weighted by volume)
When useVWAPFilter = true:
- Longs only if close > vwap
- Shorts only if close < vwap
3.- EMA trend filter
Uptrend if EMA(fast) > EMA(slow)
When useTrendFilter = true:
- Longs only in uptrend
- Shorts only in downtrend
2.6. Backtest time window (time filter)
To keep testing focused and reduce long-history noise:
useMaxLookbackDays enables the filter
maxLookbackDays defines how many days back from timenow entries are allowed
Entries are permitted only when time >= startTime.
3. Entry rules and position control
3.1. Entries
strategy.entry('Long', strategy.long) when longSetup and no long position is open
strategy.entry('Short', strategy.short) when shortSetup and no short position is open
No pyramiding is allowed (pyramiding = 0). Position gating is handled by:
Long allowed if strategy.position_size <= 0
Short allowed if strategy.position_size >= 0
4. Risk management: TP/SL and trailing (with plotted lines)
4.1. Detecting entry/exit events
Events are identified via changes in strategy.position_size:
LongEntry: transition into a long
shortEntry: transition into a short
flatExit: transition back to flat
This drives per-trade line creation, updates, and cleanup of state variables.
4.2. Static TP/SL
On entry, entryPrice := strategy.position_avg_price is stored.
Percent mode (usePercent = true)
Long:
staticSL = entryPrice*(1 - slPerc/100)
staticTP = entryPrice*(1 + tpPerc/100)
Short:
staticSL = entryPrice*(1 + slPerc/100)
staticTP = entryPrice*(1 - tpPerc/100)
ATR mode (usePercent = false)
Long:
staticSL = entryPrice - atrAtEntry*slATR
staticTP = entryPrice + atrAtEntry*tpATR
Short:
staticSL = entryPrice + atrAtEntry*slATR
staticTP = entryPrice - atrAtEntry*tpATR
4.3. Trailing stop (custom)
While a position is open, the script tracks the most favorable excursion:
Long: hhSinceEntry = highest high since entry
Short: llSinceEntry = lowest low since entry
A trailing candidate is computed:
Percent trailing (useTrailPercent = true)
Long: trailCandidate = hhSinceEntry*(1 - trailPerc/100)
Short: trailCandidate = llSinceEntry*(1 + trailPerc/100)
ATR trailing (useTrailPercent = false)
Long: trailCandidate = hhSinceEntry - atr*trailATR
Short: trailCandidate = llSinceEntry + atr*trailATR
Then the effective stop is selected:
Long: slUsed = max(staticSL, trailCandidate) when useTrail is enabled
Short: slUsed = min(staticSL, trailCandidate) when useTrail is enabled
If useTrail is disabled, slUsed remains the static stop.
Take profit remains static:
tpUsed = staticTP
Exit orders are issued via:
strategy.exit(..., stop=slUsed, limit=tpUsed)
4.4. Per-trade TP/SL lines
On each entry, two lines are created (SL and TP) via f_createLines().
During the trade, the SL line updates when trailing moves the stop; TP remains fixed.
On exit (flatExit), both lines are finalized on the exit bar and left on the chart as historical references.
This makes it straightforward to visually audit each trade: entry context, intended TP, and trailing evolution until exit.
5. Visualization and debugging
BUY/SELL labels with configurable size (xsize)
Debug mode (showDebug) plots the chosen working support/resistance level each bar
Stored pivot levels are drawn using reusable line slots, projected a fixed 20 bars to the right to keep the chart readable and efficient
6. Parameter guidance and practical notes
pivotLookback / rightBars: controls pivot significance vs responsiveness. Lower rightBars confirms pivots earlier but can increase noise.
maxDistATR: too low may reject valid levels; too high may select distant, less relevant levels.
minWickATR: key quality gate for “real” sweeps. Higher values reduce frequency but often improve signal quality.
Filters:
Volume filter tends to help in ranges and active sessions.
VWAP bias is useful intraday to align trades with session positioning.
EMA trend filter is helpful in directional markets but may remove good mean-reversion setups.
Percent TP/SL: provides consistent behavior across assets with variable volatility, but is less adaptive to sudden regime shifts.
Percent trailing: can capture extensions well; calibrate trailPerc per asset/timeframe (too tight = premature exits).
7. Known limitations
Pivot-derived levels are a heuristic; in strong trends, valid retests may be limited.
The time filter uses timenow; behavior may vary depending on historical context and how the platform evaluates “current time.”
TP/SL and trailing are computed from bar OHLC; in live trading, intrabar sequencing and fills may differ from bar-close simulation.
