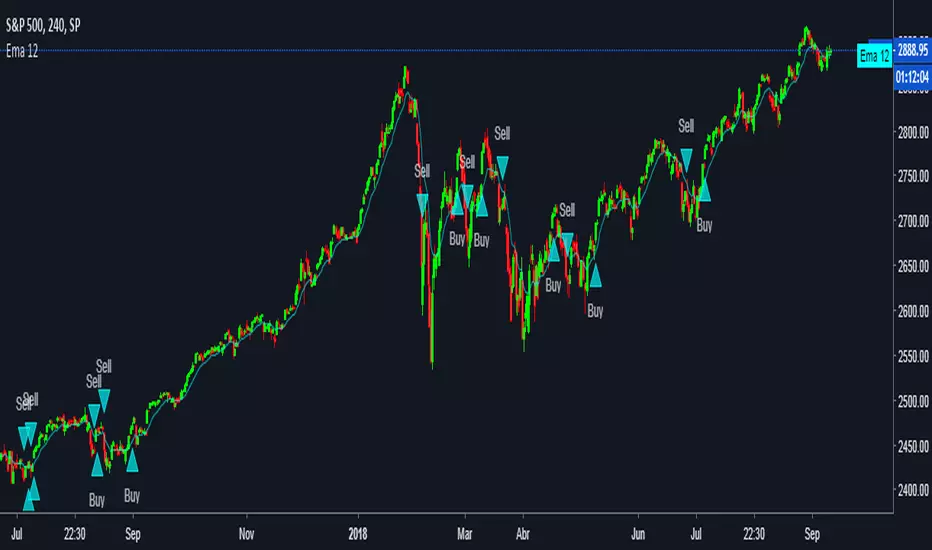
EMA's 5/20/50/200For those who want to use multiple EMA's in a single indicator.
You can also change ema by just editing in pine editor.
For example:
open pine editor and then just alter => "short = ema(close, 5)" to "short = ema(close, 6)"
By doing this your short ema will be changed at your desire.
Just like this you can increase more ema in your script.
For any help you can pm me :)
스크립트에서 "ema"에 대해 찾기
EMA 8 48 System v1Short Description:
A trend-following indicator using EMA crossovers, ATR-based volatility filter, and a cooldown period to reduce false signals. Designed for clear buy/sell signals in trending markets.
Full Description:
What is this indicator?
This script implements a dual EMA crossover system (8-period and 48-period EMAs) with a trend filter (EMA200), ATR-based volatility filter, and a cooldown period to avoid overtrading.
It visually plots EMAs, buy/sell signals, and ATR-based stop loss/target levels.
Why is it useful?
Helps traders identify high-probability trend entries and avoid choppy, low-volatility conditions.
Reduces false signals by requiring trend confirmation, sufficient volatility, and spacing out trades.
Suitable for intraday and swing trading on most liquid assets.
When to use:
Best used in markets showing clear trends (not sideways).
Works on most timeframes, but higher timeframes (15m, 1h, 4h, daily) tend to give more reliable signals.
How to spot buy and sell:
Buy: Green “BUY” label appears when EMA8 crosses above EMA48, price is above EMA200, and ATR is above the minimum threshold.
Sell: Red “SELL” label appears when EMA8 crosses below EMA48, price is below EMA200, and ATR is above the minimum threshold.
ATR-based stop loss and target levels are plotted for each signal.
Additional tips:
Adjust the minimum ATR and cooldown settings to match your asset’s volatility and your trading style.
Use in conjunction with price action or higher timeframe analysis for best results.
Avoid trading during low volatility or sideways markets, as signals may be less reliable.
Always backtest and forward-test before using live.
How to add signals and update settings:
Use the script’s input panel to adjust EMA lengths, ATR settings, minimum ATR, and cooldown period.
To add alerts, use TradingView’s “Add Alert” feature and select the buy or sell conditions from the script’s alert options.
For further customization, you can edit the script to add additional filters or notification logic.
This indicator is for educational purposes only. Always use proper risk management and do your own research before trading.
Disclaimer:
This script is for informational and educational purposes only and does not constitute financial advice or a recommendation to buy or sell any financial instrument.
Trading involves risk. Past performance is not indicative of future results. Always do your own research and use proper risk management.
The author is not responsible for any losses incurred from the use of this script. By using this script, you agree to take full responsibility for your trading decisions.
EMA & BarCountNothing. EMA & Bar Count
Nothing. EMA & Bar Count
Thanks .
EMA Angle Trend StrengthEATS is an innovative indicator that calculates the slope of the exponential moving average (EMA) over a defined number of candles, presenting this on a scale of 0 to 100.
Users can individually adjust the length of the EMA and the precision of slope calculation. For the EMA length, users can specify the number of candles used for the EMA calculation. In terms of precision, the user can define the number of candles over which the slope calculation takes place.
The EATS indicator uses a mathematical function to calculate the angle of slope of the EMA. The resulting slope is converted into degrees and then portrayed on a scale of 0 to 100 using the "eats" function.
This indicator can be a useful tool for traders looking to evaluate a market's momentum and identify potential trend shifts. It allows you to visualize the strength a trend based on the angle of the EMA slope, offering a complementary perspective to traditional price and volume indicators.
Please note that as with all indicators, the EATS indicator should not be used as a standalone trading tool. It should always be used in combination with other technical analyses and/or fundamental analyses to make the most informed trading decisions.
EMAs Daily ResetThis indicator displays 3 EMAs that recalculate every day.
This is useful for intraday trading by removing the bias of the previous day's ema price. This ensures your EMAs stay near the most current price action.
Note: If your length is larger than the number of bars in the day, your EMAs will not have time to properly catch up in the day.
EMA Cloud Intraday Strategy********NOT TRADING ADVICE - USE AT YOUR OWN RISK - TRADING IS RISKY - DO NOT BLINDLY FOLLOW THE SIGNALS FROM THIS STRATEGY********
This strategy utilizes the 9 and 20 period exponential moving averages to create a colored cloud between similar to what is seen on the Ichimoku Cloud. The strategy closes all trades by the end of the trading day. Entry is when the price closes above a Green (9 EMA above 20 EMA) cloud or below a Red (9 EMA below 20 EMA) cloud. Exit is when price closes against the 9 EMA or at the end of the trading day. Running the strategy tester on different intraday time frames will show the best time frame for a given Symbol. For example, I have found that the best results are returned by this strategy for SPY on the 30 minute time frame.
********NOT TRADING ADVICE - USE AT YOUR OWN RISK - TRADING IS RISKY - DO NOT BLINDLY FOLLOW THE SIGNALS FROM THIS STRATEGY********
EMA vs TMA Regime FilterEMA vs TMA Regime Filter
This indicator is built as a visual study tool to compare the behavior of the Exponential Moving Average (EMA) and the Triangular Moving Average (TMA).
The EMA applies an exponential weighting to price data, giving stronger importance to the most recent values. This makes it a faster, more responsive line that reflects short-term momentum. The TMA, by contrast, applies a double-smoothing process (or in the “True TMA” option, a split SMA sequence), which produces a much slower curve. The TMA emphasizes balance over reactivity, often used for filtering noise and observing longer-term structure.
When both are plotted on the same chart, their differences become clear. The shaded region between them highlights times when short-term price dynamics diverge from longer-term smoothing. This is where the idea of “regime” comes in — not as a trading signal, but as a descriptive way of seeing whether market action is currently dominated by speed or by stability.
Users can customize:
Line styles, widths, and colors.
Cloud transparency for visual clarity.
Whether to color bars based on relative position (optional, purely visual).
The goal is not to create a system, but to help traders experiment, observe, and learn how different smoothing techniques can emphasize different aspects of price. By switching between the legacy and true TMA, or adjusting lengths, users can study how each approach interprets the same data differently.
EMA ProHi Traders!
This Improved EMA Cross Pro Indicator does a few things that Ease Up Our Charting.
Personally it Saved me Tons of Time searching for structure highs / lows, measuring ranges and distances from my entry to stop or take profit.
It's like having most of your trade in front of you, charted for you.
Works Across Assets & Time Frames.
The Functions
1. Signals EMA Crosses - green for Bull Cross & Red for Bear Cross
2. Signals Touches to the 55 EMA
a. In a Bull Cross it will only signal touches and closes Above the 55
b. In a Bear Cross it will only signal touches and closes Under the 55
3. Plots Current Horizontals:
a. The current position of the 55
b. The last High & Low
4. Calculation:
a. % from the 55 to the High & Low
b. Risk / Reward Ratio ("Bad Risk Management" message appears if ratio is not favorable)
c. Over Range between the Low and the High
5. Labels - Current prices for all horizontals marked as Entry, Exit & Stop
Notes:
* This Indicator is Interchanging between bull and bear crosses, it recognizes the trend and adapts its high and low output.
* You Can and Should make your personal changes. everything can be changed in the settings inputs.
* You can Turn On & Off most functions in the settings inputs.
BYBIT:BTCUSDT.P
EMA Mean Reversion StrategyThis strategy is built on the simple idea that when the price gets far enough away from an EMA, it's bound to reverse. This strategy uses the percent distance the price is from the EMA to trigger ladder orders and sells when the price crosses a trailing stop. This strategy uses the EMA Price Distance Tracker indicator .
EMAs Vertical & Horizontal Offset
This script allows you to set Horizontal and Vertical offset to EMA lines.
Default settings is to have one set of EMAs to show bearish wave (red line and circles)and the second set to show bullish wave (green line and circles).
It also includes supporting EMAs & SMA for direction and confirmation
Timeframe option allows you to overlay Higher TF EMAs onto the current TF.
EMA fasterDraw EMA(12) and put a signal when EMA(12) cross with EMA(50).
EMA(50) is not rendered on the canvas.
EMA & Camarilla StrategyChat GPT based , 20, 200 EMA Strategy
This script calculates EMAs (5, 20, and 200), Camarilla Pivot Points, and checks for your specified candlestick pattern conditions. It then generates buy and sell signals based on the EMA crossover and the candlestick pattern. Stop loss is calculated as the lowest low of the last 5 bars, and the target is set at the Camarilla pivot point (you can customize these values).
Ema ScalpThis is another simple strategy based on ema
Entry Buy - 1) when close crossover ema then buy and only open one trade till it not close
2) if previous buy trade is profitable open another trade and check again trade is profitable or not
3)if trade is not profitable reset and wait for sell condition...
Entry Sell -1) when close crossunder ema then sell and only open one trade till it not close
2) if previous sell trade is profitable open another trade and check again trade is profitable or not
3) if trade is not profitable reset and wait for buy condition.....
stop loss and take profit is percentage based ...
EMA ON MA SETSOORY FOR MY EINGLISH
ITS NOT MY NATIVE AND IM NOT GOING TO GOOGLE TRANSLATE THIS
this is a beuaitful indicator that plot EMA that gat is calc from another ma and length for your choise so you will get an = 'ema on ma '
it can plot you more beautiful results and more smoothing results
i added golden/death cross for all ma
enjoy !
היי חברים זה בעצם אינדיקטור של ממוצע נע על ממוצע נע לנוחיכותכם
הפלט הראשי הוא EMA
הוא לוקח את החישוב שלו ממוצע אחר והאורך שתגדירו
נותן תוצאה יותר חלקה של ממוצעים נעים
הוספתי חתיוכים בין ההמוצעים
תהנו.
Ema Crosses nklassEs un simple indicador de cruces con EMAs, de 11, 22, 50 y 200 periodos.
En un intervalo de velas diarias se obtienen las mejores señales, pero funciona bien para 4h y 15min tambien, recomiendo operar con los cruces de mayor probabilidad por encima y por debajo de la ema200, por debajo solo entradas en CORTO, y por encima solo entradas en Largo, luego de una señal se puede obtener un mejor Riesgo Beneficio si se espera a un posible test del ema 50, y se entra luego de un cierre de vela por por fuera de la ema 11, dandote un buen punto para el stop loss. Recomiendo utilizarlo basandose en zonas de soporte y resistencia de marcos temporales mas altos y teniendo en cuenta posibles divergencias en RSI al igual que su posicion en el momento de entrar al mercado.
EMA clouds (5/12 and 34/50)This is a custom ema cloud script with a 5/12 cloud and a 34/50 cloud.
Personally, I used to trade with the 20 ema and 50 ema, but wanted something with a little more robust. These clouds are especially great for the first hour of market open since strong bullish stocks that have gapped up overnight tend to follow these trends.
For example, Tesla opened above the clouds and used them as support before running all day.
NIO happened to do a similar move.
EMA Bot Trigger - 14,26,55Work In Progress - Currently will send Long/Short triggers when EMA 14 Crosses EMA 26 - whether the cross is above the EMA 55 determines whether to Long or Short.
Ema cross strat / Turtle Trading This is just a simple EMA cross strategy which is meant to be similar to Turtle Trading Strategy.
It uses in default 4 Hour 21 / 10 EMA to long or short. This is not perfect but in the long run it will profit. Works best in bull market.
LINK TO ALERT :
EMA 50, 100 and 200Draw a set of 3 EMA: 50, 100 and 200. It highlight with a circle the crossing of EMA(50) with other EMAs
EMAs Crypto InvestidorExponential Moving Averages - EMAs Crypto Investor
Indicator developed to facilitate the use of 5 EMAs in a single indicator.
EMAs: 17, 34, 72, 100 and 200 Periods
Developed by Diego do Youtube Channel Crypto Investor
EMA Spread Exhaustion DetectorEMA Spread Exhaustion – Reversal Scalper's Tool
Identifies trend exhaustion for high-probability counter-trend entries. Triggers when EMA(4/9/20) stack is fully aligned and spread stretches beyond ±ATR threshold. Ideal confluence for TDI hooks + strong rejection candles on 15s charts. Visual markers, fills, and alerts for quick scalps.
EMA 10,20 SMA 50, 200This indicator is very helpful for swing traders who plan their trades using EMAs and SMAs. It is used on the daily chart and displays the 10- and 20-EMA, as well as the 50- and 200-SMA.
EMA Distance Scanner with Multi-TimeframesThis indicator was created for personal use because I wanted to see, within the five-minute time frame, what is happening with the 15-minute, 1 hour, and 4 hour EMA9 and EMA200.
When the number is green, we are above the EMA value, and when it is red, we are below it. This also helps to get a clearer picture of the short- and long-term trends. When the number is close, within 0.00-0.01%, it turns blue, indicating a potential support level. You can also change the EMA values to your preference in the settings.
Hopefully, this will be helpful for you as well.


