Pine Script® 인디케이터
스크립트에서 "ema"에 대해 찾기
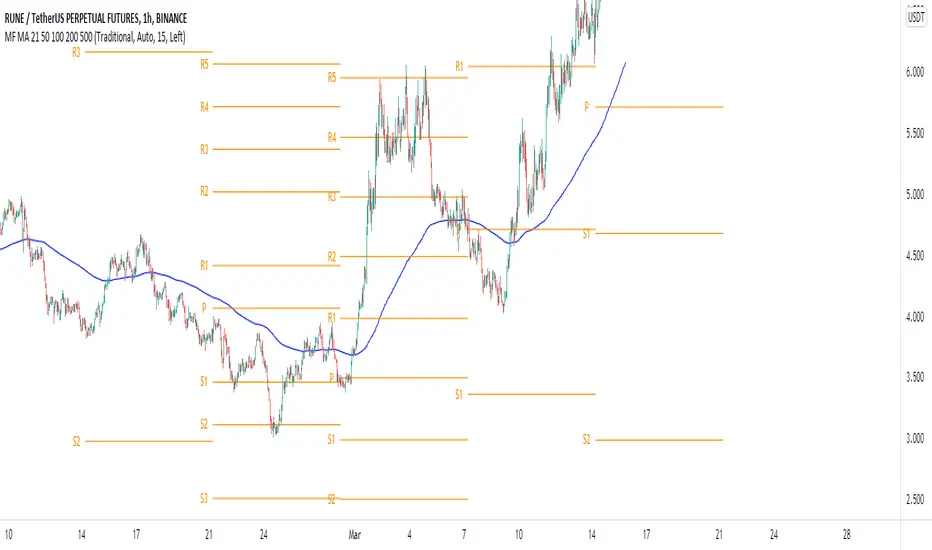
MF 200 EMA PivotPointWe will be using the 200 EMA for identifying the trend of the market & possible cross overs for Swing trades. Pivot points will be really useful for defining the Supports & resistance. By combining with these two strategies we can understand the markets simple & clear. No need to fill your chart with Graphical designs.
Pine Script® 인디케이터
Pine Script® 인디케이터

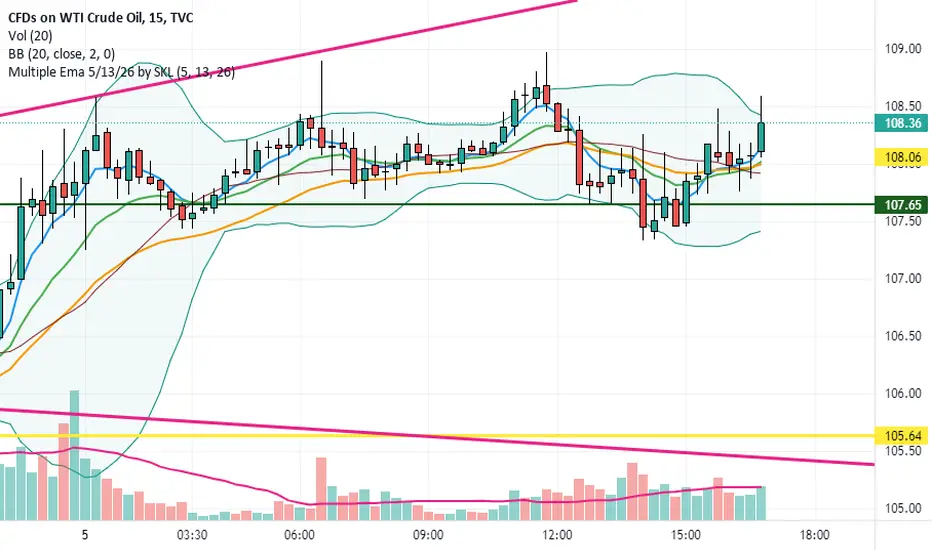
Combine & Merge Candlesticks + EMACombine & Merge Candlesticks with EMA
You can do the following:-
1 min - look back 5 (5 min) up to 15 (15 min)
5 min - look back 3 (15 min) up to 12 (1 hour)
15 min - look back 4 (1 hour) up to 16 ( 4 hours)
1 hour - look back 4 (4 hours) up to 8 (8 hours - 1 trading session)
4 hour - look back 2 (8 hours - 1 trading session) up to 6 ( 1 Day)
1 day - look back 5 ( 1 week)
Pine Script® 인디케이터

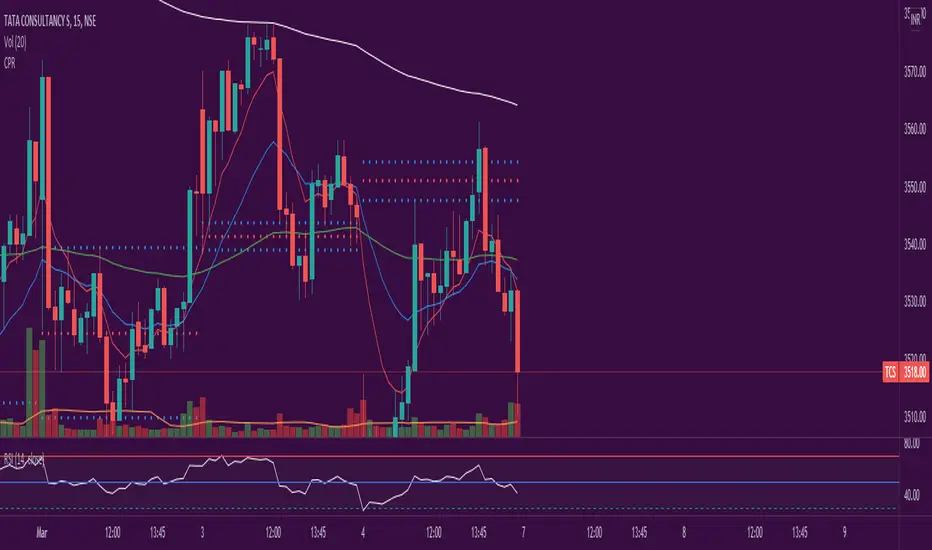
CPR-EMA(8,20,200)The intention behind this Indicator is to combine 2 (EMA & CPR) together so that users having limits on the number of indicators can be benifited
Pine Script® 인디케이터
Pine Script® 인디케이터

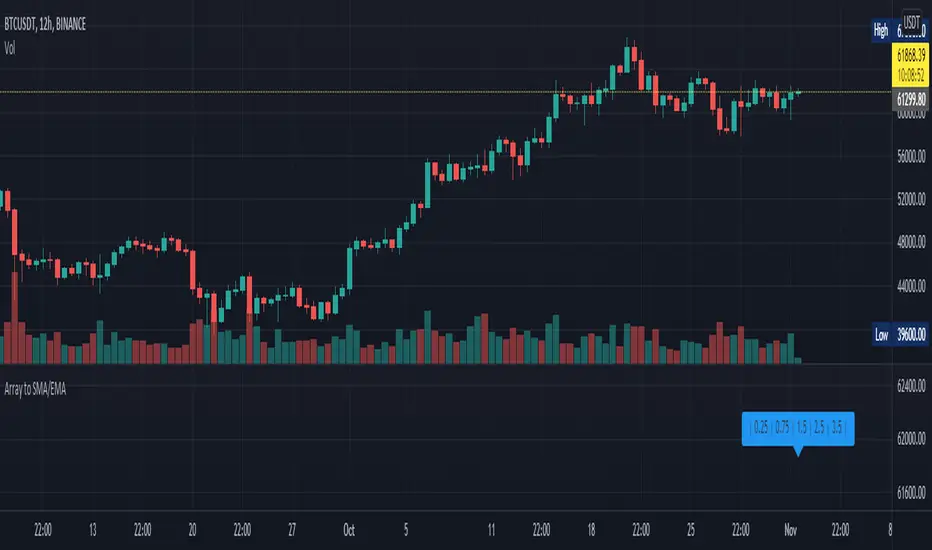
Array to SMA/EMAThis script is to help people with converting arrays to Simple Moving Average and Exponential Moving Average arrays. It is the same as using ta.sma() or ta.ema() in v5 with series but it takes an array as input instead. Both functions have inbuilt bad-input checking logic to ensure that the period length is not too high or too low - which could give unwanted results. If such values are used, the functions will output an array of the same length with NaN values. The EMA function also has an optional argument called sma_seed , which determines whether the first value in the output array will be the SMA of the first value from the input array (true) or the first value itself (false). Both functions work independently of one another, all you have to do is copy the entire function into your code and off you go! I can add more functions such as RMA or VWMA if there is demand, let me know and leave a like! ~ if you want.
Pine Script® 인디케이터
Indicator: SMA/EMA (Multi timeframes)This moving average indicator will plot the SMA or EMA sourced from a different timeframe on the current chart.
Applications:
Say you are viewing an hourly chart but you also want to know the ema20 sourced from a higher timeframe (i.e daily) of the same security. The problem with using most built-in indicators is that the MA values are usually calculated from the current chart, so to do that, you will have to toggle between 1h/1D. This script will eliminate this hassle by plotting out the desired alternative timeframe on the same chart.
Dynamic settings
By default the alternative timeframe is 1D, but this can be customized further:
- 1 week chart -> plots out 1 month MA
- 1 day chart -> plots out 1 week MA
- 1 hour chart -> plots out 1 day MA
Pine Script® 인디케이터

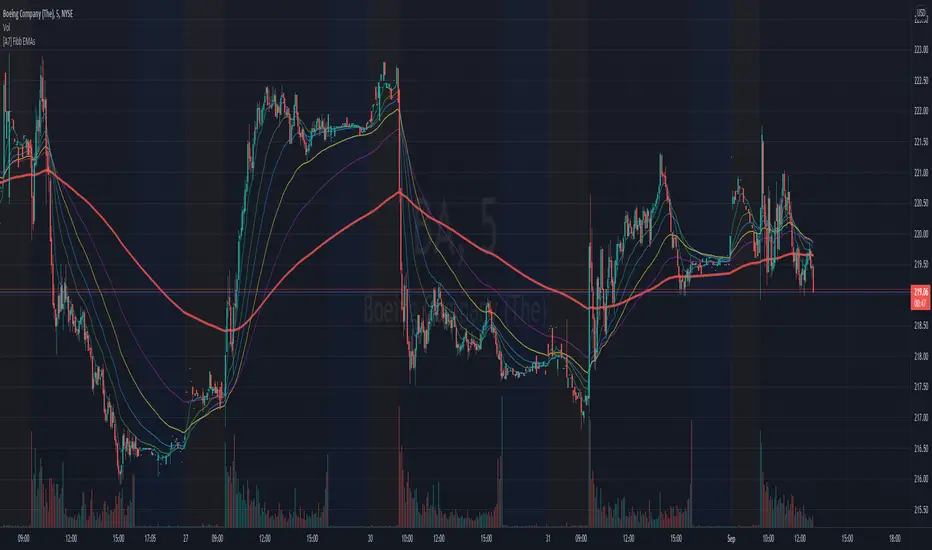
[A7] Fibonacci EMAs (8,21,34,55,89,233) Fibonacci EMAs (8,21,34,55,89,233)
Fibonacci Exponential Moving Averages
8 - aqua
21 - green
34 - blue
55 - yellow
89 - purple
233 - red
Pine Script® 인디케이터
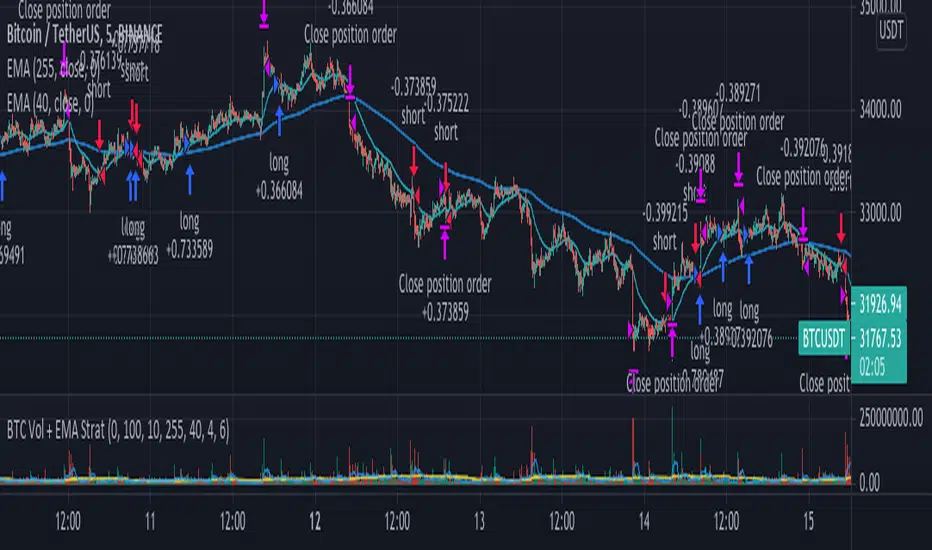
Aggregate BTC Volume + EMA Strat// This strategy buys when the price crosses the Fast EMA. It can go long only
// when the price is above the slow EMA and short when is below. The exit
// is determined by volume spikes, when the volume is greater than the Volume
// MA multiplied by the assigned input multiplier. Thanks to MartinShkreli
// for the Aggregated BTC volume. There is also a Maximum Loss filter which
// should be modified depending on the traded market.
Pine Script™ 전략
PSAR + EMA + TEMACombined PSAR with EMA and/or TEMA lines, including fast/slow plots, for entry/exit signals. Includes signals for all plots.
Credit to TEMA With Alert by BerkSay and Parabolic SAR by Alex Orekhov (everget).
Pine Script® 인디케이터

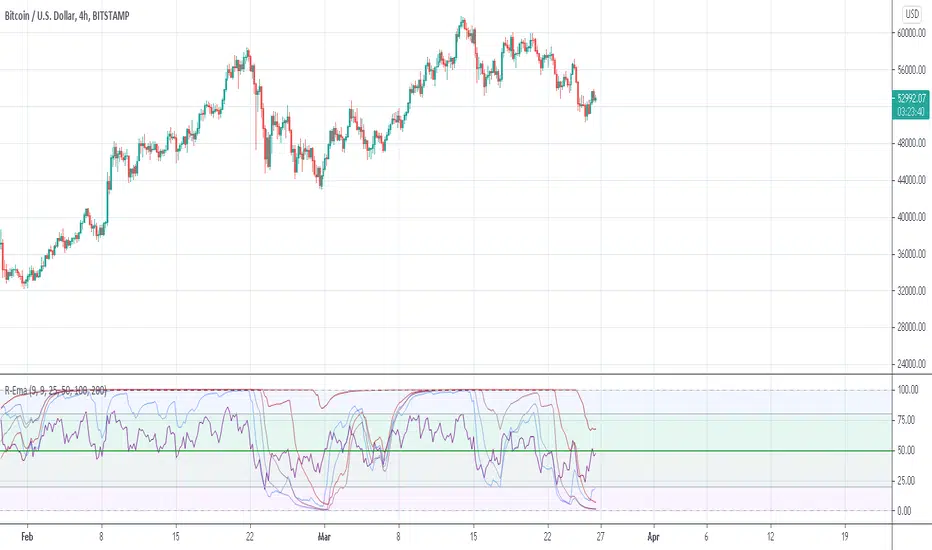
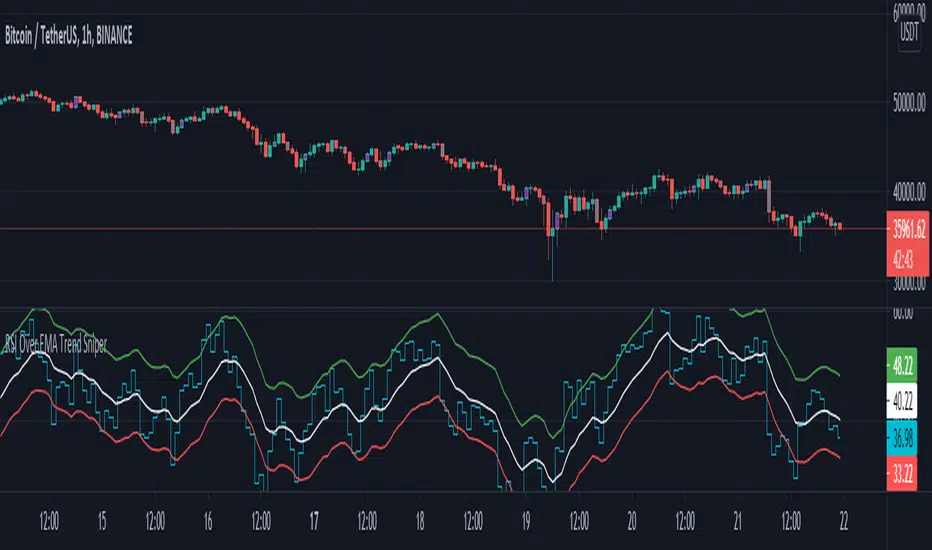
RSI Over EMA Trend SniperThis is an indicator that uses horizontal EMA lines with a RSI line on top of it to provide optimal entry and exit positions for trading crypto.
How to use:
If the Aqua(RSI) line passes upwards on the red heading to the white - it's heading towards a good BUY signal. To be safe you wait until it passes above the white line, then BUY LONG. Another signal to buy long is when the Aqua line passes above the white and green lines.
Selling is essentially the opposite, if the Aqua line is passing down from the green or white lines, then it's time to sell and exit your trade.
This indicator works well as a confirmation, and it's nice to have multiple confirmations, so it's suggested you use this with other indicators that can provide entry and exit confirmations.
Pine Script® 인디케이터
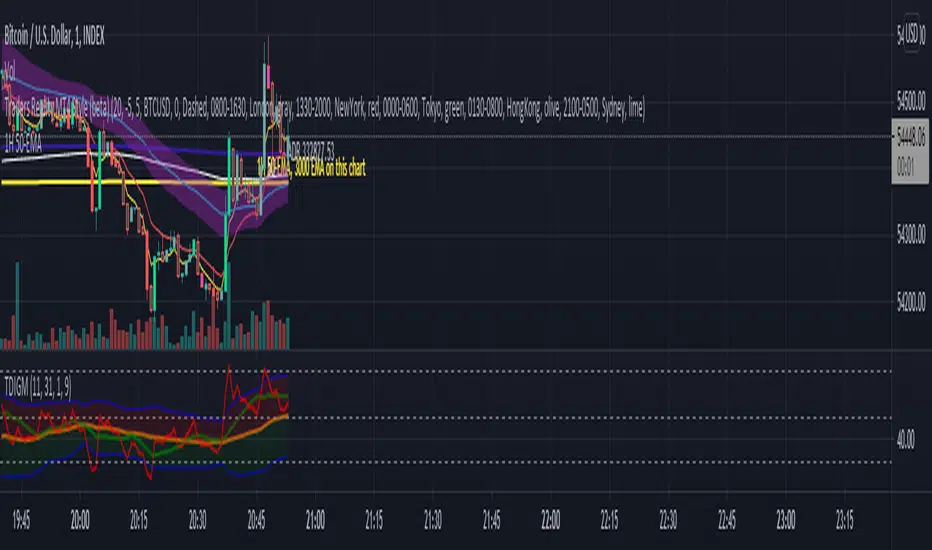
1H 50-EMAFor anyone using a smaller timeframe who still wants to see the 1-hr 50-ema without having to change its settings every time
Pine Script® 인디케이터
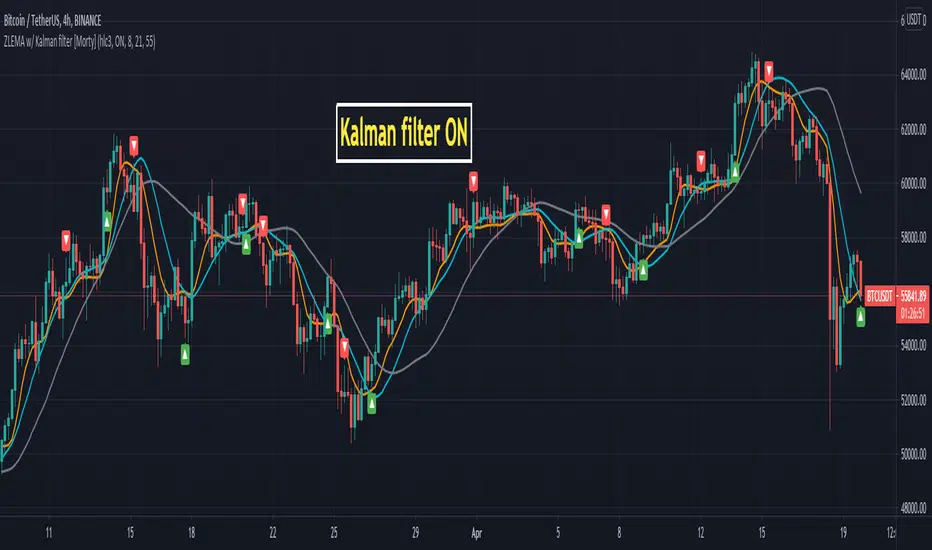
ZLEMA Zero lag EMA with Kalman filter [Morty]This indicator plot 3 Kalman filter zero lag EMA lines. It has less lag and is also smoother than the original EMA.
It also has an option to show the crossover of two EMAs.
Pine Script® 인디케이터
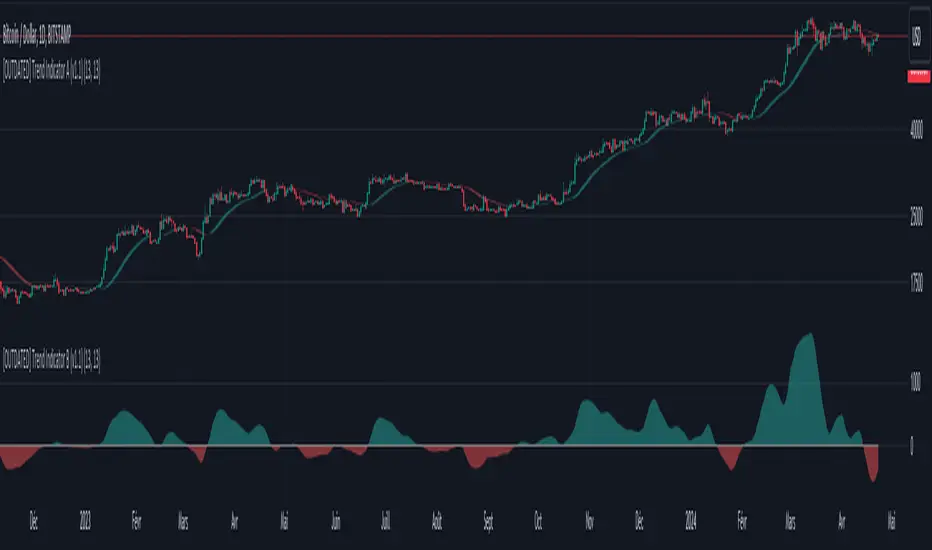
Dziwne Trend Indicator B (EMA + Heikin Ashi) V1Based on my own "Dziwne Trend Indicator A (EMA + Heikin Ashi cloud)" , I tweaked the original script to display and "measure" the overall trend.
Pine Script® 인디케이터
Pine Script® 인디케이터