Daily Moving Average to Intraday Chart BradleyRUses Robertob's Script with Mike's colors for Warrior Pro Students.
스크립트에서 "daily"에 대해 찾기


MY_CME eod OI vs CFTC eow OIDaily e-o-d Open Interest as published by CME.
As CFTC COT Open Interest relates to last Tuesday, here you can have an idea how things evolved day-by-day since then.
As CME total OI is not accessibl as data, here I sum OI of the next 9 outstanding contracts, which gives a fair idea of the trend in OI


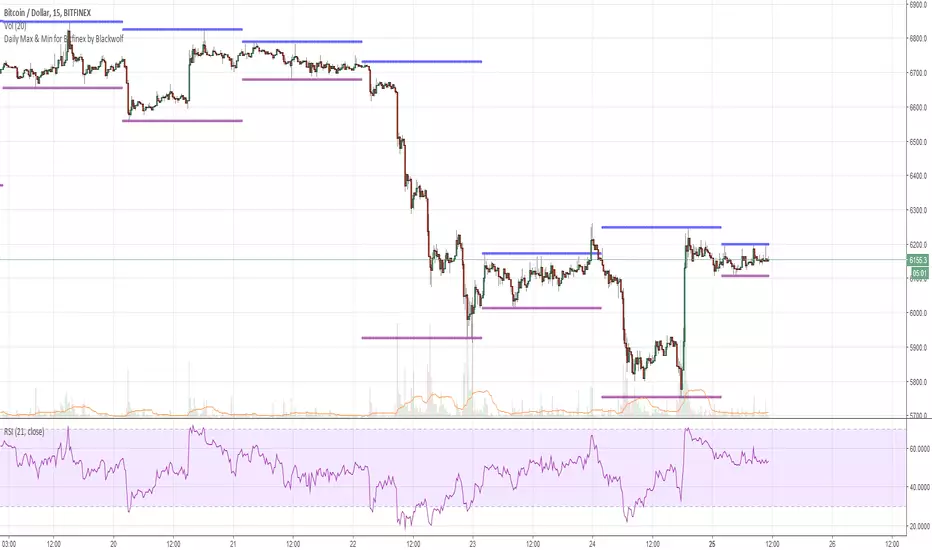
Daily Max & Min for Bitfinex by BlackwolfThis script shows the min and max price level of each day. It can be used also for support and resistance level.
Lo script mostra il prezzo massimo e minimo raggiunto nelle 24 ore. può essere utilizzato come idea per supporti e resistenze
MTF EMA Combo with Background ColorDaily/Weekly EMA combo for longer term trend direction, with combo background color for varying trend direction.

CMGB Pivot PointsDaily and weekly pivots.
Setting: specify how many candles are in a day (in the time frame you are using)
For example for 15m TF there are 91 (not 96) candles. When you get the number right, the lines will align nicely.


Daily SARThe image describes how to use the indicator fairly well, and I used 1 minute candles here, but it's best used on 1H candles.
There's a little bit of noise as the SAR updates, you can expect two movements before it settles. Ignore the first one, it is largely irrelevant except as a signal that the real movement is about to occur (and a hint at which direction).


Daily Average True Range OverlayPlots the upper and lower average true range away from the previous days close on all time frames.

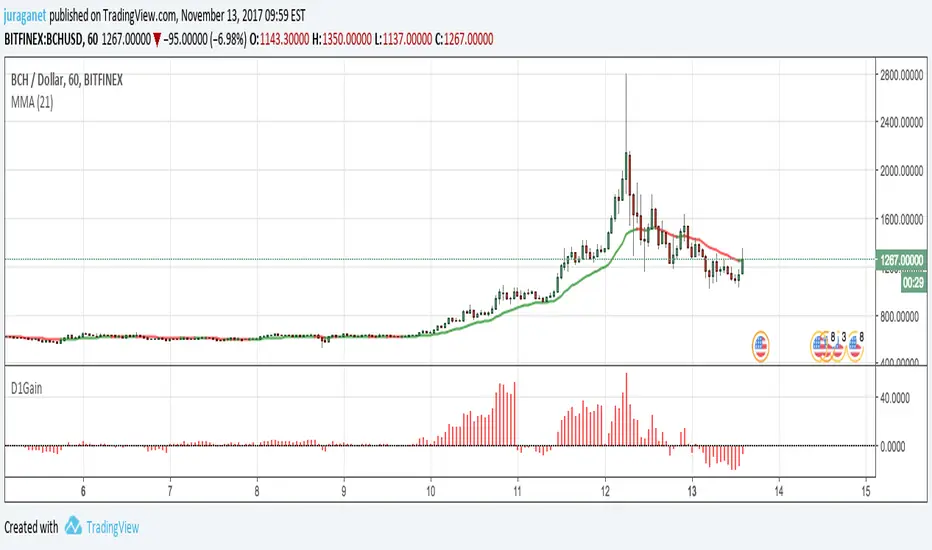
Daily GainPlot today's gain (%) of current security. It's a value of increase/decrease of current price compared to today's 00:00:00 candle open price.
I'm open for idea to improve this script. Drop me message or email to juraganet@gmail.com.
Daily one take and put toolthis script have two line
Each line acts as a line of support and resistance
판매용이 아닙니다. 댓글 남기시고 사용하세요~
사용법은 blog.naver.com

Daily Deviations (Lazy Edition)
Plots the standard deviation resistance/support lines.
Uses Previous days close and the VIX as the volatility factor.
credit to u/UberBotMan and u/Living_Granger for the idea and formulas

Daily Deviations (Self Input Version)
Plots the standard deviation resistance/support levels.
Input the previous settlement price and the implied volatility.
credit to u/UberBotMan and u/Living_Granger for the idea and formulas
(preview example is using settlement of 2420 and IV of 11)


Daily Returns & STDWhat happened last time when xx increased by xx%? - Start collecting some stats!
You can choose the ticker and the timeframe you're interested in

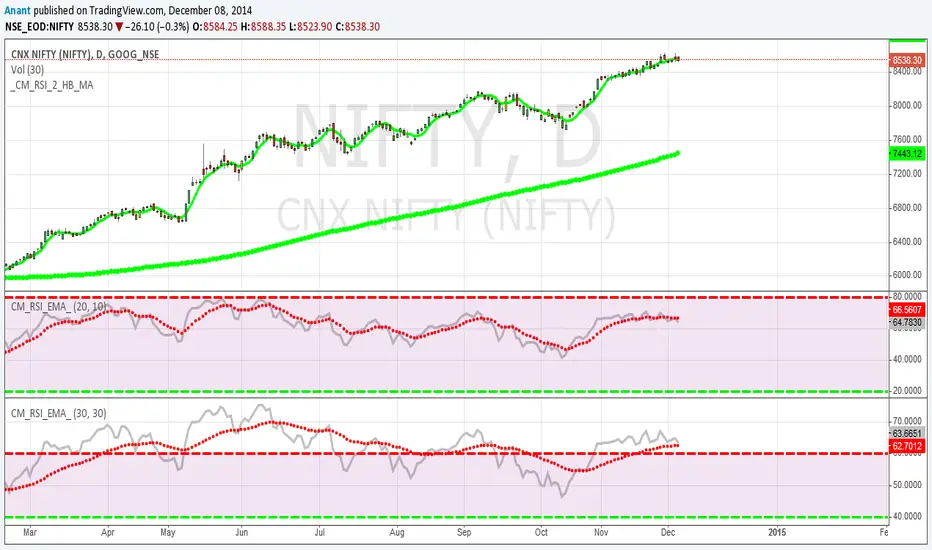
RSI Oversold/UndersoldThe study script will place GREEN BUY arrows BELOW oversold conditions and RED SHORT arrows ABOVE overbought conditions. You can configure the period
Most RSI(14) indicators use a 14-period, I prefer a 5-period. The period, overbought and oversold periods are settings that can easily be changed by adding this study to your chart and clicking the "gear" icon next to the study inside your chart.


Daily SMAThis pine script on intraday chart is exactly the same SMA as built-in MovingAverage on a 1Day chart (with the same lengths)


RS Rating Multi-Timeframe v2RS Rating Multi-Timeframe
A relative strength rating indicator modeled after IBD's proprietary RS Rating system. This indicator measures a stock's price performance relative to the S&P 500 (or any benchmark you choose) and converts it to a 1-99 rating scale.
How It Works
The indicator calculates weighted performance ratios across four timeframes:
40% weight: 63-day (3-month) performance
20% weight: 126-day (6-month) performance
20% weight: 189-day (9-month) performance
20% weight: 252-day (12-month) performance
This weighting emphasizes recent performance while still accounting for longer-term strength—the same methodology used by leading growth stock research services.
Rating Scale
90-99: Elite relative strength (top 10% of stocks)
80-89: Strong relative strength (top 20%)
50-79: Average performance
30-49: Below average
1-29: Weak relative strength (bottom 30%)
Features
Customizable benchmark index (default: S&P 500)
Optional moving average overlay (EMA or SMA)
Visual zones with color-coded backgrounds
Signal markers when RS crosses key thresholds (80 and 30)
Info table showing current rating, daily change, MA value, and raw score
Built-in alerts for threshold crossovers
Pine Screener Compatible
This indicator includes state-based plots specifically designed for TradingView's Pine Screener. You can screen watchlists for:
RS Above 90, 80, 70, or 50
RS Below 50 or 30
RS Above/Below its moving average
Custom thresholds using the raw RS Rating value
In the Pine Screener, select the "Screener RS Above 80" output and set it to "True" (or equals 1) to find all stocks currently above 80—not just those crossing on that bar.
Usage Tips
Growth investors typically look for stocks with RS Ratings above 80, indicating the stock is outperforming 80% of the market. Combining high RS Rating with other technical signals (breakouts, volume, moving averages) can help identify leading stocks.
