daily high low close Levelsits different its day high and low indicator idgcaiucvai fUEFIFBIUE FWEFHEFBSD FSFHUFSIISDJHS DSDHSDINSDVJSD9 SDHSDVJNSDVSJDVH8S9DY SEFGSU BSIDVJBSDVIU S8DOHSDIVNSDVPine Script® 인디케이터syashshinde242의87
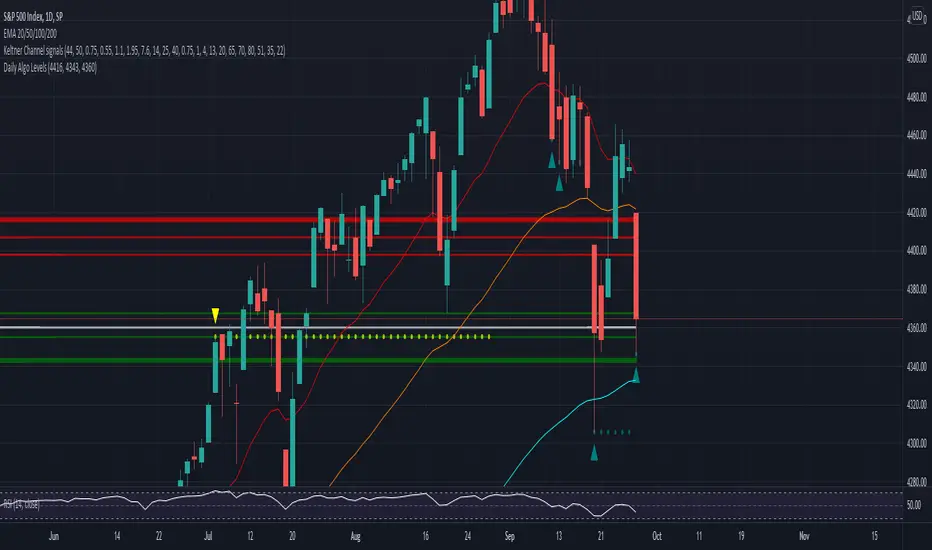
Daily Algo LevelsQuickly plot stoo's algo levels. Gives option to expand range based on algo error formula. Gives option to display suggested entry points. Pine Script® 인디케이터pcoates627의3378
Short Volume [Nic]Daily Short Volume shows short volume (red) and total volume (green). This can be helpful in determining a build up of short interest before a crash (or squeeze), or if the mark up of a stock is from short covering or legitimate buyers.Pine Script® 인디케이터NicTheMajestic의업데이트됨 44237
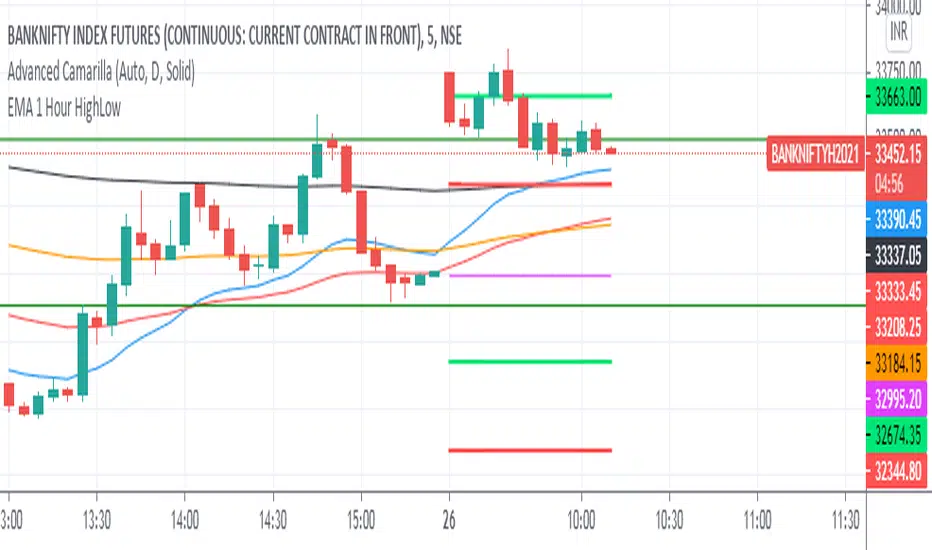
1st Hour High and Low ISRDaily Range : 1st Hour High and Low From Market Start Time ISR = Initial Support ResistancePine Script® 인디케이터vivekdpm의업데이트됨 11109
Daily Ranges Dividers 1-5-15MinThis Range Indicator divides days based on New York Time. It works properly on the 1-5-15Min Chart. You can also use it on the 1h Chart, but you have to tick the apposite option in the Indicator Settings to do so. Enabling it on the 1h Chart, won't show it properly on the other timeframes, but you can always switch it back to the default and use it on the 1-5-15Min chart without any problemsPine Script® 인디케이터Santi_S의업데이트됨 2020865
Daily Average True RangeIf you want to get an idea if the current range (low to high) is extended or not? This script should help you to get an idea relative to the ATR. Further comments you find in the script. Feel free to modify upon your needs. Jonas NB: Due to issues around the "security" function, the recommended patch of Trading View was implemented.Pine Script® 인디케이터jopre0502의업데이트됨 29
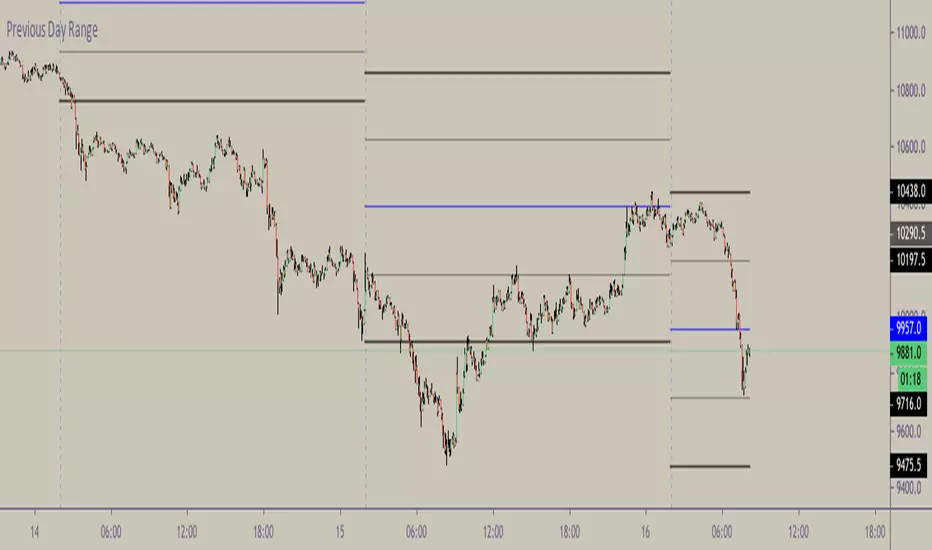
Daily Reference Points for Intra-hour ChartsI worked with pivot script which I believe was created by @HPotter but somehow, I can't look it up. This script fixes one issue I have with several pivot points script I had honour to see. When the new day starts, sometimes, there is a line connecting old pivot points and new ones. I managed to remove it. Compared to the script I worked with, I converted the code from v.1 to v.4, added middle pivots and added previous day's close, high and low which are superior levels compared to any pivot calculation. This script will show only on the 1m, 5m, 15m and 30m charts, so you don't need to turn it off when you check higher timeframe for macroanalysis.Pine Script® 인디케이터OrcChieftain의업데이트됨 196
Daily Pivot PointsThis pivot takes in the previous day's pivots and projects them to today.Pine Script® 인디케이터tista의22259
Bank Math LevelsDaily and weekly Bank Math levels for Oil.Thanks to @randy.brown228 for sharing the calculations Pine Script® 인디케이터UnknownUnicorn3925296의22133
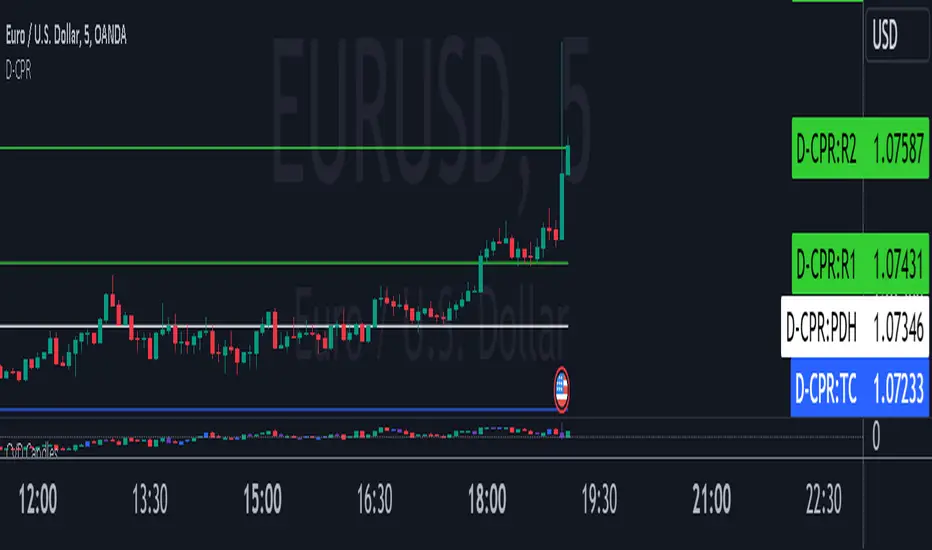
Daily CPRThis script will plot the CPR and support/resistance lines on your chart for smaller time frame so that you use them for Intraday trading. This script also plots the previous day's high (PDH) and the previous day's low (PDL).Pine Script® 인디케이터pbghosh의업데이트됨 1010489
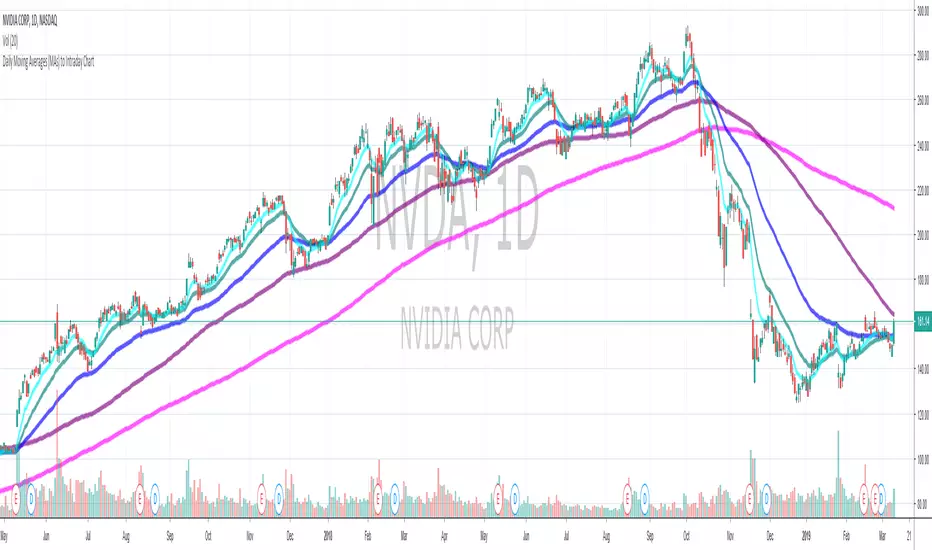
Daily Moving Averages (EMAs + SMAs) to Intraday Chart9 EMA, 20 EMA, 50 EMA, 100 SMA and 200 SMAPine Script® 인디케이터PeterZoller의108
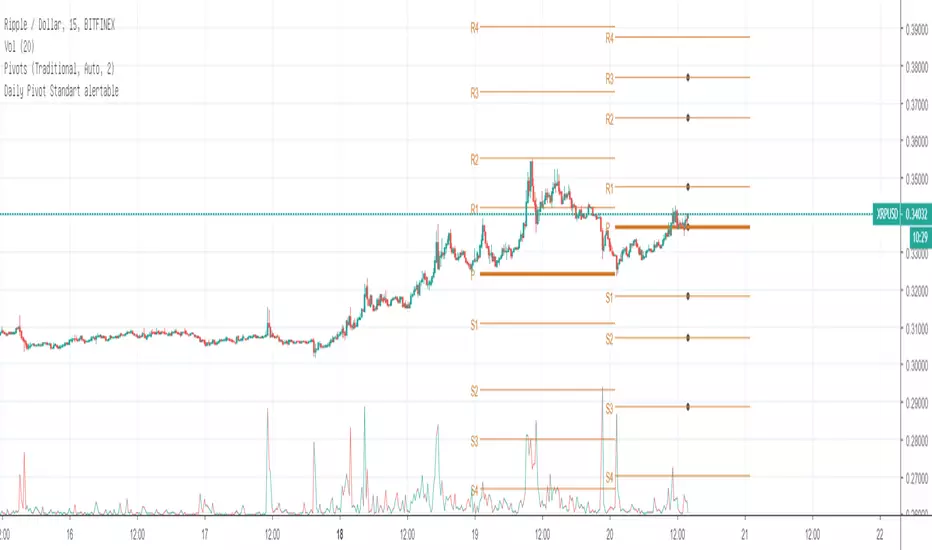
Daily Pivot Standart alertableWith this Indicator u can set allert between the Pivot points s15.directupload.net So it is useful for scalpingPine Script® 인디케이터James_Bl의11214
Daily Moving Average to Intraday Chart BradleyRUses Robertob's Script with Mike's colors for Warrior Pro Students.Pine Script® 인디케이터rushing39667의23
BTC Swinger v1Daily interval swing trading algorithm based on momentum techniques using ATR Stops. Made by Kory Hoang from Stably. Shout out to the Advanced Crypto Asset Trading crew! ;)Pine Script™ 전략Stable_Camel의185
MY_CME eod OI vs CFTC eow OIDaily e-o-d Open Interest as published by CME. As CFTC COT Open Interest relates to last Tuesday, here you can have an idea how things evolved day-by-day since then. As CME total OI is not accessibl as data, here I sum OI of the next 9 outstanding contracts, which gives a fair idea of the trend in OIPine Script® 인디케이터giancapino의업데이트됨 140
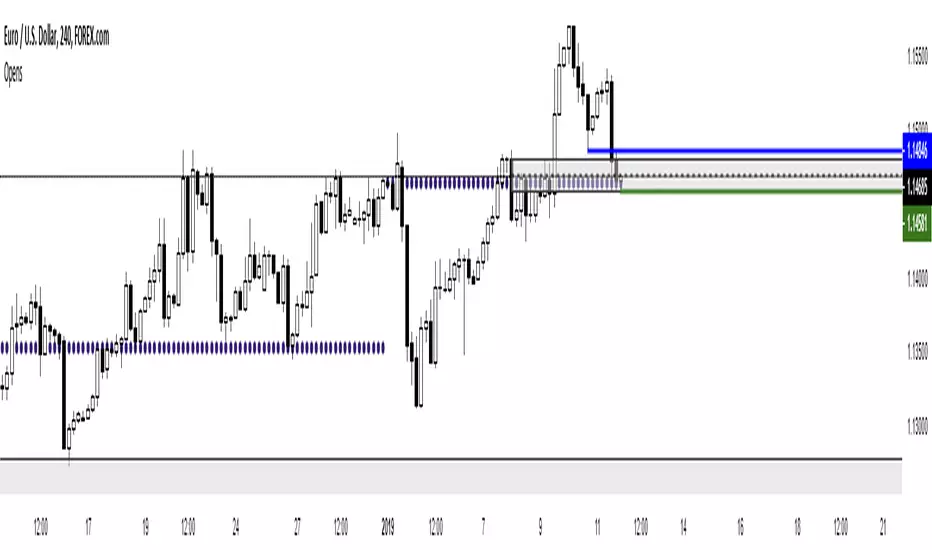
Daily OHLCPlots the previous day's Open, High, Low, Close for the current day's price action. Pine Script® 인디케이터realbartbtc의11630
MTF EMA Combo with Background ColorDaily/Weekly EMA combo for longer term trend direction, with combo background color for varying trend direction. Pine Script® 인디케이터LocoTito의44188