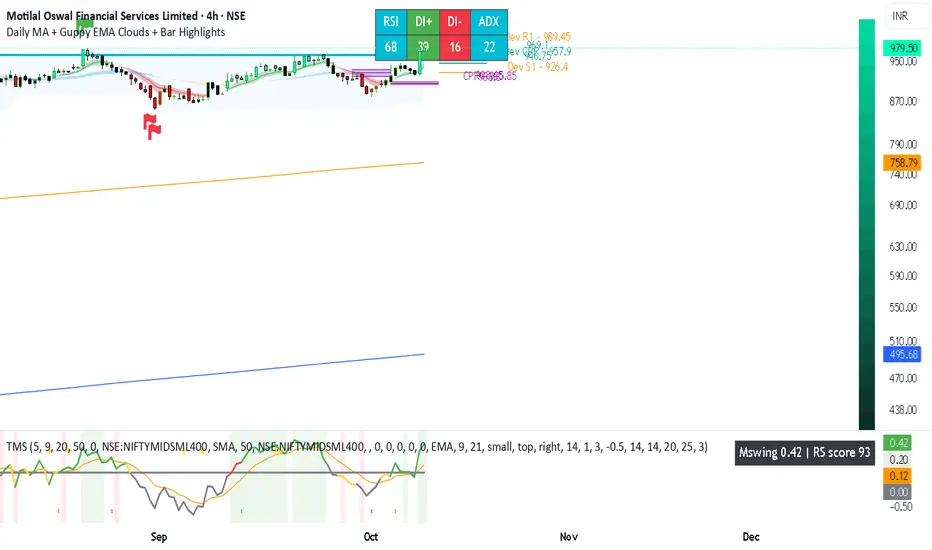
스크립트에서 "daily"에 대해 찾기
MTF EMA Combo with Background ColorDaily/Weekly EMA combo for longer term trend direction, with combo background color for varying trend direction.
Daily Average True Range OverlayPlots the upper and lower average true range away from the previous days close on all time frames.
Daily Deviations (Lazy Edition)
Plots the standard deviation resistance/support lines.
Uses Previous days close and the VIX as the volatility factor.
credit to u/UberBotMan and u/Living_Granger for the idea and formulas
Daily Deviations (Self Input Version)
Plots the standard deviation resistance/support levels.
Input the previous settlement price and the implied volatility.
credit to u/UberBotMan and u/Living_Granger for the idea and formulas
(preview example is using settlement of 2420 and IV of 11)
Daily Returns & STDWhat happened last time when xx increased by xx%? - Start collecting some stats!
You can choose the ticker and the timeframe you're interested in
RSI Oversold/UndersoldThe study script will place GREEN BUY arrows BELOW oversold conditions and RED SHORT arrows ABOVE overbought conditions. You can configure the period
Most RSI(14) indicators use a 14-period, I prefer a 5-period. The period, overbought and oversold periods are settings that can easily be changed by adding this study to your chart and clicking the "gear" icon next to the study inside your chart.
Daily SMAThis pine script on intraday chart is exactly the same SMA as built-in MovingAverage on a 1Day chart (with the same lengths)
Koko's Capital Flow Channel Koko’s Capital Flow Channel is a structured EMA channel system designed to reduce over-trading and eliminate chase entries. It separates Early Direction signals (clearing bars) from Smart Entries (inside-channel confirmations), helping traders execute with patience and clarity.
Koko’s Capital Flow Channel™ provides a clean, psychology-friendly framework for traders transitioning from fast scalping to higher timeframes.
What it does
This indicator uses an EMA-based channel to define structure and trend flow, then delivers two tiers of signals:
Early Direction Signals (Early BUY / Early SELL)
Trigger on a clearing bar (break/close condition depending on your setting)
Used for directional awareness and early positioning
Smart Entry Signals (BUY-S / SELL-S)
Trigger only when price returns inside the channel and prints a qualifying candle
Designed to reduce impulsive entries and improve execution quality
Why it’s different
Many tools fire signals everywhere. This channel is built to create clarity and restraint:
Less noise
Fewer, higher-quality signals
Built-in structure + intent filters
Optional ATR filtering to avoid low-quality breaks
Best use cases
Daily / swing trading
Trend continuation and pullback entries
Traders learning discipline and consistency
Burned-out scalpers who want calmer, higher-quality setups
Recommended settings
Timeframe: Daily (works on others but Daily is the intended home)
Start with:
Clearing Bar Mode: Cross (or Over/Under “event” logic if enabled)
Candle Body: Body Only
Intent: Bullish/Bearish Candle
ATR Filter: Clearing Bar Strength, ATR(14), Multiplier 1.0
Signal Key
BUY-E / SELL-E = Early Direction signal (clearing bar)
BUY-S / SELL-S = Smart Entry signal (inside-channel confirmation)
5) How to Use It (simple instructions section)
Workflow
Wait for Early BUY-E / SELL-E to confirm flow direction
Only take Smart Entries (BUY-S / SELL-S) when price returns inside the channel
Use the channel boundaries for structure (helps avoid chasing)
Alerts
You can create alerts for:
Early BUY / Early SELL
Smart BUY / Smart SELL
Risk Disclaimer (safe + standard)
Disclaimer: This indicator is for educational and informational purposes only and is not financial advice. Markets involve risk. Always manage risk appropriately and test settings before live use.
ZLT - Date and Time MarkerPine Script v5 indicator called “DateTime Marker” that overlays on the chart and marks bars whose timestamp matches a user-defined schedule. When a bar “matches,” it can draw:
a vertical line through the bar,
a label with a time/date string, and
a triangle marker below the bar (always plotted on matches).
What you can configure
Marker Type (the matching rule)
You choose one of five modes:
Every Minute
Inputs: everyNMinutes (default 15), minuteOffset (default 0)
Match condition: minute % everyNMinutes == minuteOffset
Example with defaults: marks bars at :00, :15, :30, :45 each hour.
Hourly
Inputs: everyNHours (default 4), hourlyMinute (default 0)
Match condition: hour % everyNHours == 0 AND minute == hourlyMinute
Example with defaults: marks bars at 00:00, 04:00, 08:00, 12:00, 16:00, 20:00 (at minute 00).
Daily Time
Inputs: dailyHour (default 10), dailyMinute (default 0)
Match condition: hour == dailyHour AND minute == dailyMinute
Example with defaults: marks 10:00 every day.
Weekly Day & Time
Inputs: weekDay (default Tuesday), weeklyHour (default 16), weeklyMinute (default 0)
It converts the weekday name to Pine’s dayofweek number via getDayNumber().
Match condition: dayofweek == targetDay AND hour == weeklyHour AND minute == weeklyMinute
Example with defaults: marks Tuesday 16:00.
Monthly Date & Time
Inputs: monthlyDay (default 2), monthlyHour (default 23), monthlyMinute (default 0)
Match condition: dayofmonth == monthlyDay AND hour == monthlyHour AND minute == monthlyMinute
Example with defaults: marks the 2nd day of each month at 23:00.
Visual settings
showLine: whether to draw the vertical line.
lineStyle: Solid/Dashed/Dotted (mapped to Pine line styles by getLineStyle()).
lineColor, lineWidth: styling for the line (width is rounded to an integer because Pine line width is integer).
showLabel: whether to draw a label.
labelColor: background color of the label (text is forced white).
What happens when a bar matches
When isMatch becomes true on a bar:
Vertical line: line.new() at that bar’s bar_index, from low to high, extended extend.both (so it spans the full chart vertically).
Label: label.new() at the bar’s high, with mode-specific text:
Minute/Hourly/Daily: "HH:mm"
Weekly: "Tuesday HH:mm" (or whatever day selected)
Monthly: "Day 2 - HH:mm" (or chosen day)
Triangle marker: plotshape() draws a triangle up below the bar on every match (this happens regardless of showLine / showLabel).
Important practical implications
This uses the bar’s exchange/chart time (TradingView’s time, hour, minute, etc.), so results depend on the symbol/session and chart timezone settings.
On timeframes coarser than 1 minute, “Every Minute” still checks only the bar’s timestamp minute value; it won’t mark intra-bar minutes that don’t exist as separate bars.
Because it can create many objects (lines/labels), it sets max_labels_count=500. Lines are not capped here, so very dense marking can still clutter the chart.
If you tell me your intended use (e.g., “mark NY open,” “mark every 15m candle close,” “mark macro events weekly”), I can point out whether the current matching logic fits that precisely or needs adjustments (sessions, timezones, avoiding duplicates, limiting lines, etc.).
ADR % RangesThis indicator is designed to visually represent percentage lines from the open of the day. The % amount is determined by X amount of the last days to create an average...or Average Daily Range (ADR).
1. ADR Percentage Lines: The core function of the script is to apply lines to the chart that represent specific percentage changes from the daily open. It first calculates the average over X amount of days and then displays two lines that are 1/3rd of that average. One line goes above the other line goes below. The other two lines are the full "range" of the average. These lines can act as boundaries or targets to know how an asset has moved recently. *Past performance is not indicative of current or future results.
The calculation for ADR is:
Step 1. Calculate Today's Range = DailyHigh - DailyLow
Step 2. Store this average after the day has completed
Step 3. Sum all day's ranges
Step 4. Divide by total number of days
Step 5. Draw on chart
2. Customizable Inputs: Users have the flexibility to customize the script through various inputs. This includes the option to display lines only for the current trading day (`todayonly`), and to select which lines are displayed. The user can also opt to show a table the displays the total range of previous days and the average range of those previous days.
3. No Secondary Timeframe: The ADR is computed based on whatever timeframe the chart is and does not reference secondary periods. Therefore the script cannot be used on charts greater than daily.
This script is can be used by all traders for any market. The trader might have to adjust the "X" number of days back to compute a historical average. Maybe they only want to know the average over the past week (5 days) or maybe the past month (20 days).
Humble Student OB/OS Trifecta indicatorAfter reading Cam Hui's blog post about his "Trifecta" bottom spotting model I thought I'd try my hand at scripting it as an indicator. The results are pretty close to what he describes. Though the data TradingView feeds me doesn't seem to be identical to what he's using on StockCharts.com the results are close enough that I will call the effort a success worth publishing.
MTF 20 SMA Table - DXY**MTF 20 SMA Table - Multi-Timeframe Trend Analysis Dashboard**
**Overview:**
This indicator provides a comprehensive multi-timeframe analysis dashboard that displays the relationship between price and the 20-period Simple Moving Average (SMA) across four key timeframes: 15-minute, 1-hour, 4-hour, and Daily. It's designed to help traders quickly identify trend alignment and potential trading opportunities across multiple timeframes at a glance. It's definitely not perfect but has helped me speed up my backtesting efforts as it's worked well for me eliminating flipping back and forth between timeframes excpet when I have confluence on the table, then I check the HTF.
**How It Works:**
The indicator creates a table overlay on your chart showing three critical metrics for each timeframe:
1. **Price vs SMA (Row 1):** Shows whether price is currently above (bullish) or below (bearish) the 20 SMA
- Green = Price Above SMA
- Red = Price Below SMA
2. **SMA Direction (Row 2):** Indicates the trend direction of the SMA itself over a lookback period
- Green (↗ Rising) = Uptrend
- Red (↘ Falling) = Downtrend
- Gray (→ Flat) = Ranging/Consolidation
3. **Strength (Row 3):** Displays the distance between current price and the SMA in pips
- Purple background = Strong move (>50 pips away)
- Orange background = Moderate move (20-50 pips)
- Gray background = Weak/consolidating (<20 pips)
- Text color: Green for positive distance, Red for negative
**Key Features:**
- **Customizable Table Position:** Place the table anywhere on your chart (9 position options)
- **Adjustable SMA Lengths:** Modify the SMA period for each timeframe independently (default: 20)
- **Direction Lookback Settings:** Fine-tune how far back the indicator looks to determine SMA direction for each timeframe
- **Flat Threshold:** Set the pip threshold for determining when an SMA is "flat" vs trending (default: 5 pips)
- **DXY Optimized:** Calculations are calibrated for the US Dollar Index (1 pip = 0.01)
**Best Use Cases:**
1. **Trend Alignment:** Identify when multiple timeframes align in the same direction for higher probability trades
2. **Divergence Spotting:** Detect when lower timeframes diverge from higher timeframes (potential reversals)
3. **Entry Timing:** Use lower timeframe signals while higher timeframes confirm overall trend
4. **Strength Assessment:** Gauge how extended price is from the mean (SMA) to avoid overextended entries
**Settings Guide:**
- **SMA Settings Group:** Adjust the SMA period for each timeframe (15M, 1H, 4H, Daily)
- **SMA Direction Group:** Control lookback periods to determine trend direction
- 15M: Default 5 candles
- 1H: Default 10 candles
- 4H: Default 15 candles
- Daily: Default 20 candles
- **Flat Threshold:** Set sensitivity for "flat" detection (lower = more sensitive to ranging markets)
**Trading Strategy Examples:**
1. **Trend Following:** Look for all timeframes showing the same direction (all green or all red)
2. **Pullback Trading:** When Daily/4H are green but 15M/1H show red, wait for lower timeframes to flip green for entry
3. **Ranging Markets:** When multiple SMAs show "flat", consider range-bound strategies
**Important Notes:**
- This is a reference tool only, not a standalone trading system
- Always use proper risk management and combine with other analysis methods
- Best suited for trending instruments like indices and major forex pairs
- Calculations are optimized for DXY but can be used on other instruments (pip calculations may need adjustment)
**Credits:**
Feel free to modify and improve this code! Suggestions for enhancements are welcome in the comments.
---
**Installation Instructions:**
1. Add the indicator to your TradingView chart
2. Adjust the table position via settings to avoid overlap with price action
3. Customize SMA lengths and lookback periods to match your trading style
4. Monitor the table for timeframe alignment and trend confirmation
---
This indicator is published as open source for the community to learn from and improve upon. Happy trading! 📈
BTC Backwardation SearcherThis Pine Script code is a custom indicator named "BTC Backwardation Searcher" designed for the TradingView platform. The indicator aims to identify and visualize the price difference between two Bitcoin futures contracts: CME:BTC1! and CME:BTC2!.
Here's a breakdown of the code:
1. The script fetches the daily close prices of CME:BTC1! and CME:BTC2! using the security() function.
2. It calculates the percentage price difference between the two contracts using the formula: (btc1Price - btc2Price) / btc2Price * 100.
3. The script also calculates the price difference for the previous two days (2 days ago and 3 days ago) using the same formula.
4. Two conditions are defined:
(1) dailyGreenCondition: If the price difference is greater than or equal to 0.3% for three
consecutive days, including the current day and the previous two days.
(2) dailyRedCondition(commented): If the price difference is less than or equal to -1% for three consecutive days, including the current day and the previous two days.
(I commented it out because I don't think it's useful.)
5. The plotshape() function is used to display green triangles on the chart when the dailyGreenCondition is met, and red triangles when the dailyRedCondition is met. These triangles are displayed on the daily, weekly, and monthly timeframes.
The purpose of this indicator is to help traders identify potential trading opportunities based on the price difference between the two Bitcoin futures contracts. The green triangles suggest a bullish scenario where CME:BTC1! is significantly higher than CME:BTC2!, while the red triangles indicate a bearish scenario where CME:BTC2! is significantly lower than CME:BTC1!.
However, it's important to note that this indicator should be used in conjunction with other technical analysis tools and fundamental analysis. Traders should also consider their risk tolerance, investment goals, and market conditions before making any trading decisions based on this indicator.
ES Multi-Timeframe SMC Entry SystemOverviewThis is a comprehensive Smart Money Concepts (SMC) trading strategy for ES1! (E-mini S&P 500) futures that provides simultaneous buy and sell signals across three timeframes: Daily, Weekly, and Monthly. It incorporates your complete entry checklists, confluence scoring system, and automated risk management.Core Features1. Multi-Timeframe Signal Generation
Daily Signals (D) - For intraday/swing trades (1-3 day holds)
Weekly Signals (W) - For swing trades (3-10 day holds)
Monthly Signals (M) - For position trades (weeks to months)
All three timeframes can trigger simultaneously (pyramiding enabled)
2. Smart Money Concepts ImplementationOrder Blocks (OB)
Automatically detects bullish and bearish order blocks
Bullish OB = Down candle before strong impulse up
Bearish OB = Up candle before strong impulse down
Validates freshness (< 10 bars = higher quality)
Visual boxes displayed on chart
Fair Value Gaps (FVG)
Identifies 3-candle imbalance patterns
Bullish FVG = Gap between high and current low
Bearish FVG = Gap between low and current high
Tracks unfilled gaps as targets/entry zones
Auto-removes when filled
Premium/Discount Zones
Calculates 50-period swing range
Premium = Upper 50% (short from here)
Discount = Lower 50% (long from here)
Deep zones (<30% or >70%) for higher quality setups
Visual shading: Red = Premium, Green = Discount
Liquidity Sweeps
Sell-Side Sweep (SSL) = False break below lows → reversal up
Buy-Side Sweep (BSL) = False break above highs → reversal down
Marked with yellow labels on chart
Valid for 10 bars after occurrence
Break of Structure (BOS)
Identifies when price breaks recent swing high/low
Confirms trend continuation
Marked with small circles on chart
3. Confluence Scoring SystemEach timeframe has a 10-point scoring system based on your checklist requirements:Daily Score (10 points max)
HTF Trend Alignment (2 pts) - 4H and Daily EMAs aligned
SMC Structure (2 pts) - OB in correct zone with HTF bias
Liquidity Sweep (1 pt) - Recent SSL/BSL occurred
Volume Confirmation (1 pt) - Volume > 1.2x 20-period average
Optimal Time (1 pt) - 9:30-12 PM or 2-4 PM ET (avoids lunch)
Risk-Reward >2:1 (1 pt) - Built into exit strategy
Clean Price Action (1 pt) - BOS occurred
FVG Present (1 pt) - Near unfilled fair value gap
Minimum Required: 6/10 (adjustable)Weekly Score (10 points max)
Weekly/Monthly Alignment (2 pts) - W and M EMAs aligned
Daily/Weekly Alignment (2 pts) - D and W trends match
Premium/Discount Correct (2 pts) - Deep zone + trend alignment
Major Liquidity Event (1 pt) - SSL/BSL sweep
Order Block Present (1 pt) - Valid OB detected
Risk-Reward >3:1 (1 pt) - Built into exit
Fresh Order Block (1 pt) - OB < 10 bars old
Minimum Required: 7/10 (adjustable)Monthly Score (10 points max)
Monthly/Weekly Alignment (2 pts) - M and W trends match
Weekly OB in Monthly Zone (2 pts) - OB in deep discount/premium
Major Liquidity Sweep (2 pts) - Significant SSL/BSL
Strong Trend Alignment (2 pts) - D, W, M all aligned
Risk-Reward >4:1 (1 pt) - Built into exit
Extreme Zone (1 pt) - Price <20% or >80% of range
Minimum Required: 8/10 (adjustable)4. Entry ConditionsDaily Long Entry
✅ Daily score ≥ 6/10
✅ 4H trend bullish (price > EMAs)
✅ Price in discount zone
✅ Bullish OB OR SSL sweep OR near bullish FVG
✅ NOT during avoid times (lunch/first 5 min)Daily Short Entry
✅ Daily score ≥ 6/10
✅ 4H trend bearish
✅ Price in premium zone
✅ Bearish OB OR BSL sweep OR near bearish FVG
✅ NOT during avoid timesWeekly Long Entry
✅ Weekly score ≥ 7/10
✅ Weekly trend bullish
✅ Daily trend bullish
✅ Price in discount
✅ Bullish OB OR SSL sweepWeekly Short Entry
✅ Weekly score ≥ 7/10
✅ Weekly trend bearish
✅ Daily trend bearish
✅ Price in premium
✅ Bearish OB OR BSL sweepMonthly Long Entry
✅ Monthly score ≥ 8/10
✅ Monthly trend bullish
✅ Weekly trend bullish
✅ Price in DEEP discount (<30%)
✅ Bullish order block presentMonthly Short Entry
✅ Monthly score ≥ 8/10
✅ Monthly trend bearish
✅ Weekly trend bearish
✅ Price in DEEP premium (>70%)
✅ Bearish order block present5. Automated Risk ManagementPosition Sizing (Per Entry)
Daily: 1.0% account risk per trade
Weekly: 0.75% account risk per trade
Monthly: 0.5% account risk per trade
Formula:
Contracts = (Account Equity × Risk%) ÷ (Stop Points × $50)
Minimum = 1 contractStop Losses
Daily: 12 points ($600 per contract)
Weekly: 40 points ($2,000 per contract)
Monthly: 100 points ($5,000 per contract)
Profit Targets (Risk:Reward)
Daily: 2:1 = 24 points ($1,200 profit)
Weekly: 3:1 = 120 points ($6,000 profit)
Monthly: 4:1 = 400 points ($20,000 profit)
Example with $50,000 AccountDaily Trade:
Risk = $500 (1% of $50k)
Stop = 12 points × $50 = $600
Contracts = $500 ÷ $600 = 0.83 → 1 contract
Target = 24 points = $1,200 profit
Weekly Trade:
Risk = $375 (0.75% of $50k)
Stop = 40 points × $50 = $2,000
Contracts = $375 ÷ $2,000 = 0.18 → 1 contract
Target = 120 points = $6,000 profit
Monthly Trade:
Risk = $250 (0.5% of $50k)
Stop = 100 points × $50 = $5,000
Contracts = $250 ÷ $5,000 = 0.05 → 1 contract
Target = 400 points = $20,000 profit
6. Visual Elements on ChartKey Levels
Previous Daily High/Low - Red/Green solid lines
Previous Weekly High/Low - Red/Green circles
Previous Monthly High/Low - Red/Green crosses
Equilibrium Line - White dotted line (50% of range)
Zones
Premium Zone - Light red shading (upper 50%)
Discount Zone - Light green shading (lower 50%)
SMC Markings
Bullish Order Blocks - Green boxes with "Bull OB" label
Bearish Order Blocks - Red boxes with "Bear OB" label
Bullish FVGs - Green boxes with "FVG↑"
Bearish FVGs - Red boxes with "FVG↓"
Liquidity Sweeps - Yellow "SSL" (down) or "BSL" (up) labels
Break of Structure - Small lime/red circles
Entry Signals
Daily Long - Small lime triangle ▲ with "D" below price
Daily Short - Small red triangle ▼ with "D" above price
Weekly Long - Medium green triangle ▲ with "W" below price
Weekly Short - Medium maroon triangle ▼ with "W" above price
Monthly Long - Large aqua triangle ▲ with "M" below price
Monthly Short - Large fuchsia triangle ▼ with "M" above price
7. Information TablesConfluence Score Table (Top Right)
┌──────────┬────────┬────────┬────────┐
│ TF │ SCORE │ STATUS │ SIGNAL │
├──────────┼────────┼────────┼────────┤
│ 📊 DAILY │ 7/10 │ ✓ PASS │ 🔼 │
│ 📈 WEEKLY│ 6/10 │ ✗ WAIT │ ━ │
│ 🌙 MONTH │ 9/10 │ ✓ PASS │ 🔽 │
├──────────┴────────┴────────┴────────┤
│ P&L: $2,450 │
└─────────────────────────────────────┘
Green scores = Pass (meets minimum threshold)
Orange/Red scores = Fail (wait for better setup)
🔼 = Long signal active
🔽 = Short signal active
━ = No signal
Entry Checklist Table (Bottom Right)
┌──────────────┬───┐
│ CHECKLIST │ ✓ │
├──────────────┼───┤
│ ━ DAILY ━ │ │
│ HTF Trend │ ✓ │
│ Zone │ ✓ │
│ OB │ ✗ │
│ Liq Sweep │ ✓ │
│ Volume │ ✓ │
│ ━ WEEKLY ━ │ │
│ W/M Align │ ✓ │
│ Deep Zone │ ✗ │
│ ━ MONTHLY ━ │ │
│ M/W/D Align │ ✓ │
│ Zone: Discount│ │
└──────────────┴───┘
Green ✓ = Condition met
Red ✗ = Condition not met
Real-time updates as market conditions change
8. Alert SystemIndividual Alerts:
"Daily Long" - Triggers when daily long setup appears
"Daily Short" - Triggers when daily short setup appears
"Weekly Long" - Triggers when weekly long setup appears
"Weekly Short" - Triggers when weekly short setup appears
"Monthly Long" - Triggers when monthly long setup appears
"Monthly Short" - Triggers when monthly short setup appears
Combined Alerts:
"Any Long Signal" - Catches any bullish opportunity (D/W/M)
"Any Short Signal" - Catches any bearish opportunity (D/W/M)
Alert Messages Include:
🔼/🔽 Direction indicator
Timeframe (DAILY/WEEKLY/MONTHLY)
Current confluence score
HTF Current/Average RangeThe "HTF(Higher Timeframe) Current/Average Range" indicator calculates and displays the current and average price ranges across multiple timeframes, including daily, weekly, monthly, 4 hour, and user-defined custom timeframes.
Users can customize the lookback period, table size, timeframe, and font color; with the indicator efficiently updating on the final bar to optimize performance.
When the current range surpasses the average range for a given timeframe, the corresponding table cell is highlighted in green, indicating potential maximum price expansion and signaling the possibility of an impending retracement or consolidation.
For day trading strategies, the daily average range can serve as a guide, allowing traders to hold positions until the current daily range approaches or meets the average range, at which point exiting the trade may be considered.
For scalping strategies, the 15min and 5min average range can be utilized to determine optimal holding periods for fast trades.
Other strategies:
Intraday Trading - 1h and 4h Average Range
Swing Trading - Monthly Average Range
Short-term Trading - Weekly Average Range
Also using these statistics in accordance with Power 3 ICT concepts, will assist in holding trades to their statistical average range of the chosen HTF candle.
CODE
The core functionality lies in the data retrieval and table population sections.
The request.security function (e.g., = request.security(syminfo.tickerid, "D", , lookahead = barmerge.lookahead_off)) retrieves high and low prices from specified timeframes without lookahead bias, ensuring accurate historical data.
These values are used to compute current ranges and average ranges (ta.sma(high - low, avgLength)), which are then displayed in a dynamically generated table starting at (if barstate.islast) using table.new, with conditional green highlighting when the current range is greater than average range, providing a clear visual cue for volatility analysis.
HMA & D1 crossover FX (Study)Can work on other Forex pairs if change settings: Period
This example tuned for AUDUSD (FX Version)
Enter new order on HMA ( Hull Moving Average ) and D1 ( Daily Candle) crossovers, Exit orders as basket when profit = Your Target Profit
This study version built for users of Alerts. Crossover of HMA and DailyCandle1 (and/or DailyCandle1 cross DailyCandle2) (also possible Price cross HMA)


