Pine Script® 인디케이터
스크립트에서 "daily"에 대해 찾기

Average Daily RangeBlack Line - 10 day average daily range
Red Line - 1.5 black line
Green Line - 0.5 black line
White Line - Current day's range
Pine Script® 인디케이터
ICT Killzone For Crypto Markets.Adjusted for Crypto 24/7 markets
Adjusted for UTC
i have hidden the asian open range and daily bars on my charts , you can choose to have them on
Less screen clutter
London Open 8:00 - 4:30 - Killzone 7:00 - 9:00
NewYork Open 9:30 - 4:00 Killzone 8:00 - 10:00
Shanghai open 9:15 Killzone 8:00 - 10:00
NOT MY ORIGINAL SCRIPT. JUST MODIFIED VERSION
Pine Script® 인디케이터

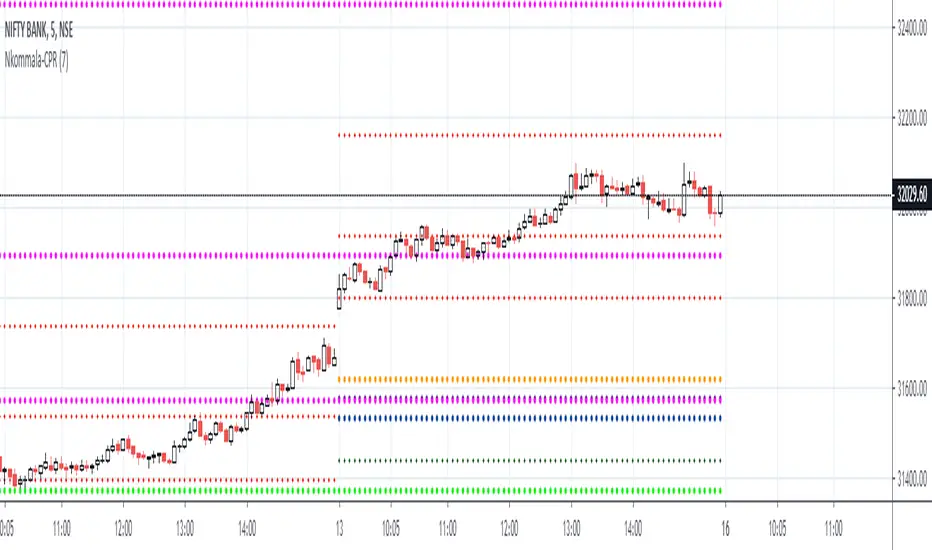
Monthly Weekly Daily Pivot Points StandardShow the monthly weekly and daily pivot points all at once , suitable for daytrading
Pine Script® 인디케이터
Pine Script® 인디케이터

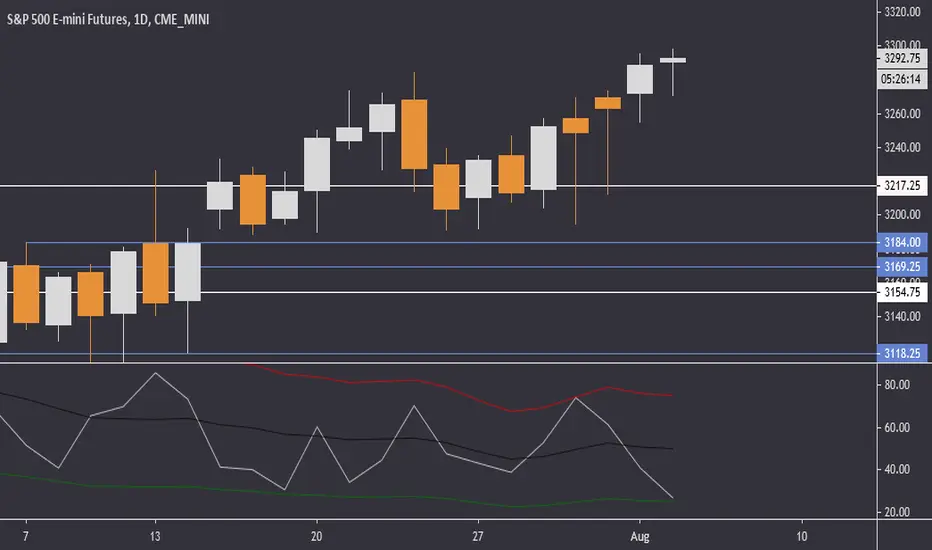
Short in Bollinger Band Down trend (Weekly and Daily) // © PlanTradePlanMM
// 6/14/2020
// ---------------------------------------------------
// Name: Short in Bollinger Band Down trend (Weekly and Daily)
// ---------------------------------------------------
// Key Points in this study:
// 1. Short in BB Lower band, probability of price going down is more than 50%
// 2. Short at the top 1/4 of Lower band (EMA - Lower line), Stop is EMA, tartget is Lower line; it matches risk:/reward=1:3 naturally
//
// Draw Lines:
// BB Lower : is the Target (Black line)
// BB EMA : is the initial Stop (Black line)
// ShortLine : EMA - 1/4 of (Stop-target), which matches risk:/reward=1:3
// Prepare Zone : between EMA and ShortLine
// shortPrice : Blue dot line only showing when has Short position, Which shows entry price.
// StopPrice : Black dot line only showing when has Short position, Which shows updated stop price.
//
// Add SMA50 to filter the trend. Price <= SMA, allow to short
//
// What (Condition): in BB down trend band
// When (Price action): Price cross below ShortLine;
// How (Trading Plan): Short at ShortLine;
// Initial Stop is EMA;
// Initial Target is BB Lower Line;
// FollowUp: if price moves down first, and EMA is below Short Price. Move stop to EMA, At least "make even" in this trade;
// if Price touched Short Line again and goes down, new EMA will be the updated stop
//
// Exit: 1. Initial stop -- "Stop" when down first, Close above stop
// 2. Target reached -- "TR" when down quickly, Target reached
// 3. make even -- "ME" when small down and up, Exit at Entry Price
// 4. Small Winner -- "SM" when EMA below Entry price, Exit when Close above EMA
//
// --------------
// Because there are too many flags in up trend study already, I created this down trend script separately.
// Uptrend study is good for SPY, QQQ, and strong stocks.
// Downtrend Study is good for weak ETF, stock, and (-2x, -3x) ETFs, such as FAZ, UVXY, USO, XOP, AAL, CCL
// -----------------------------------------------------------------------------------------------------------------
// Back test Weekly and daily chart for SPY, QQQ, XOP, AAL, BA, MMM, FAZ, UVXY
// The best sample is FAZ Weekly chart.
// When SPY and QQQ are good in long term up trend, these (-2x, -3x) ETFs are always going down in long term.
// Some of them are not allowed to short. I used option Put/Put spread for the short entry.
//
Pine Script® 인디케이터

Buy in Bollinger Band uptrend (Weekly and Daily) // © PlanTradePlanMM 6/14/2020
// ---------------------------------------------------
// Name: Buy in Bollinger Band uptrend (Weekly and Daily)
// ---------------------------------------------------
// Key Points in this study:
// 1. Long in BB Upper band, probability of price going up is more than 50%
// 2. Buy at the bottom 1/4 of upper band (Upper line - EMA), Stop is EMA, tartget is Upper line; it matches risk:reward=1:3;
//
// Draw Lines:
// BB Upper : is the Target (Black line)
// BB EMA : is the initial Stop (Black line)
// BuyLine : EMA20 + 1/4 of (Target-Stop), which matches risk:/reward=1:3 naturally
// Prepare Zone : between EMA and BuyLine
// buyPrice : Blue dot line only showing when has long position, Which shows entry price.
// StopPrice : Black dot line only showing when has long position, Which shows updated stop price.
//
// Add SMA(50) to filter the trend. Price >= SMA, allow to long
//
// What (Condition): in BB uptrend band
// When (Price action): Price cross over BuyLine;
// How (Trading Plan): Buy at BuyLine;
// Initial Stop is EMA;
// Initial Target is BB Upper Line;
//
// FollowUp: if price moves up first, and the EMA is higher than Entry point, Use EMA as new stop. At least "make even" in this trade;
//
// Exit: 1. Initial stop -- "Stop" when down first, close below stop price.
// 2. Target reached -- "TR" when up quickly, Target reached
// 3. make even -- "ME" when small up and down, Exit at entry Price
// 4. Small Winner -- "SM" when EMA above Entry price, Exit when close below EMA, and higher than entry Price
//
// --------------
// Because there are too many flags in up trend study already, I will create a down trend script separately.
// Uptrend study is good for SPY, QQQ, and strong stocks.
// Downtrend Study is good for weak ETF, stock, and (-2x, -3x) ETFs, such as FAZ, UVXY, USO, XOP, AAL, CCL
// -----------------------------------------------------------------------------------------------------------------
// Back test Weekly and daily chart for SPY, QQQ
// If it will be a big Gap down or a big down move, stop at close price could be a big loss; But this way could avoid may noise, to stay in a trending position longer.
// When buy in trending move, the position could be hold for a big range.
// The best samples are SPY and QQQ daily chart.
//
// Better to use another way to verify the long term up trend first.
// For single stock, it is better shows more relative strength than SPY.
Pine Script® 인디케이터

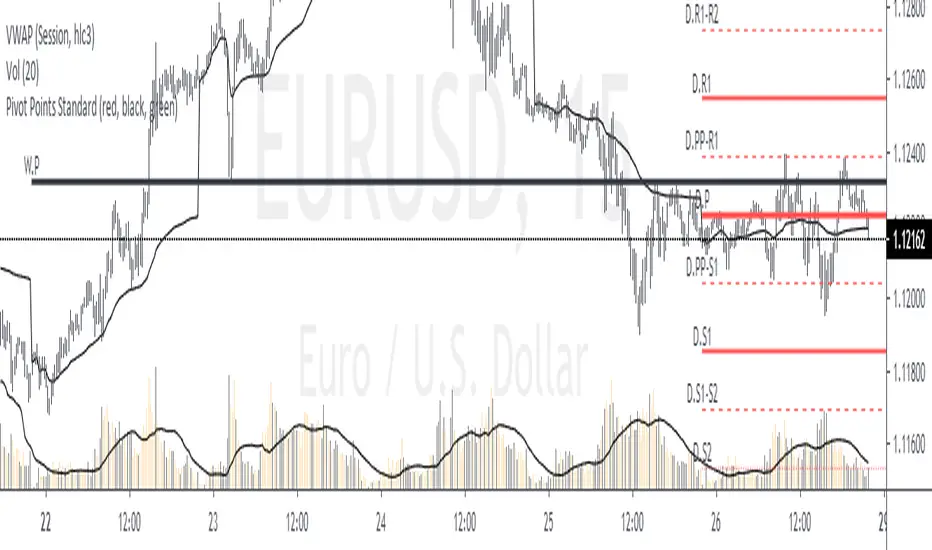
Trendanalysis with Monthly/Weekly/Daily Opens and TrendindicatorThis script is based on price action Trendanalysis.
It has 7 indicators.
Also Monthly/Weekly/Daily Opens for better visuals.
Pine Script® 인디케이터
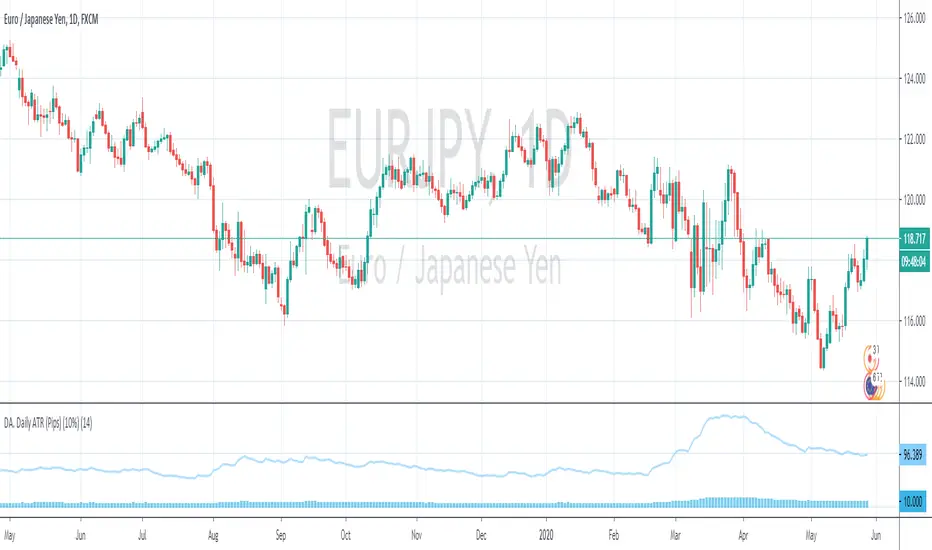
DA. Daily ATR (Pips) (10%)This is the Daily ATR Indicator that convert the ATR value into pips.
This script support the pair that contain JPY.
And show the 10% value of ATR in pips.
Pine Script® 인디케이터
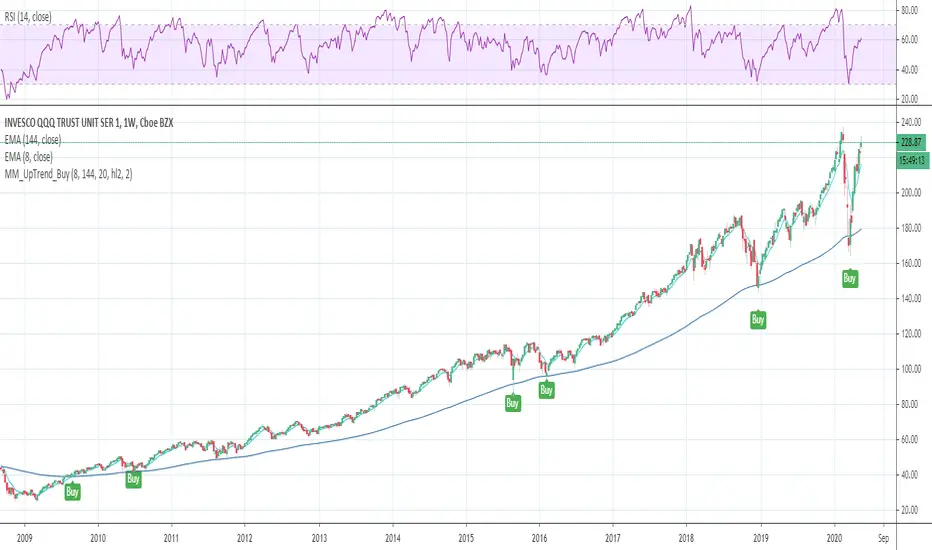
Buy in long term uptrend (Weekly and Daily)Condition: in uptrend, EMA8 > EMA144 (User can change the EMA# from input);
Price Action: (Price crossover EMA144) or (price touched EMA144 and close above it);
Trading Plan: Buy at close or next open; Initial Stop below EMA144;
No Exit strategy in this study, trader needs to move stop by other rules; such as, uptrend line break;
Back test Weekly and daily chart for SPY, QQQ, TLT, GLD, IWM, XLF, XLK, XOP, GS, IBM, APPL, CAT, LVS
1. When side way move or price From uptrend to Down trend, Entry could be stopped quickly with small loss;
2. When buy in trending move, the position could be hold for few years.
The best sample is QQQ weekly chart.
This is my first tradingview script. I created this script file and tested in one week.
Maybe, this script is too simple, other people published similar code already; Sorry, I didn't Check that yet.
Pine Script® 인디케이터
ATR Timeframe RangeThis indicator shows the ATR range on the daily or any other timeframe on your current chart. All settings are fully customize-able.
Pine Script® 인디케이터

EMA 20/100/200 alwaysThis script will always show the EMA 20/100/200 daily values across any time frame chart (e.g. showing daily 20 EMA while viewing the 5 minute chart)
Pine Script® 인디케이터

msoro daily DCATool to estimate PnL of your investment if you put in a fixed $ amount daily into btc for past year. It takes input as 365 days which can be changed as per need.
Pine Script® 인디케이터

MTF Ichimoku CloudIchimoku Cloud , Multiple Time Frames, based on the script : MTF Selection Framework functions (PineCoders)
Possible display:
- four differents Ichimoku
- Tenkan, Kijun, Chikou and Kumo (monochrome or not)
- labels : offset from line, color if you change style and with/without abbreviation
Time Frames :
- 1m
- 3m
- 5m
- 15m
- 30m
- 45m
- 1h
- 2h
- 3h
- 4h
- Daily
- Weekly
- Monthly
Pine Script® 인디케이터

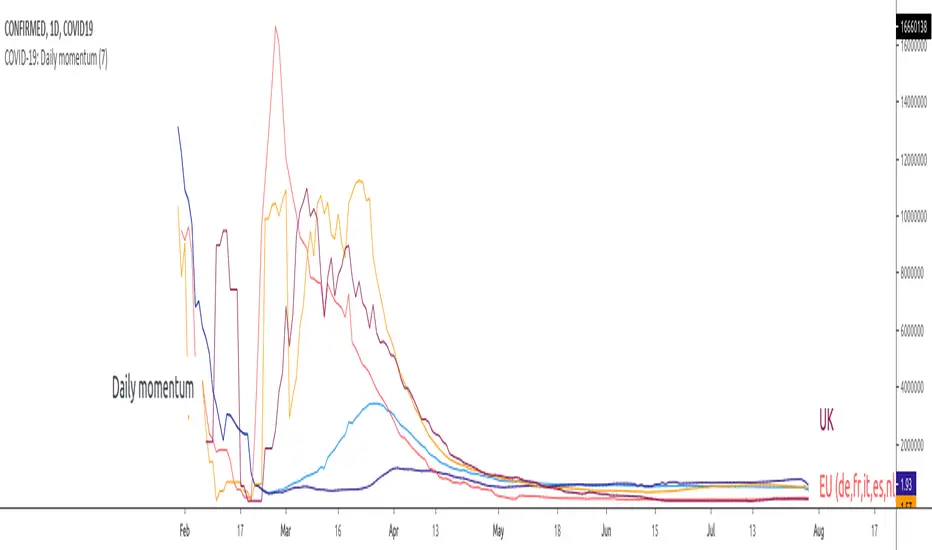
COVID-19: Daily momentumThis indicator shows 14-days moving average of daily rate of change (momentum, acceleration), in other words:
- up trends means that virus accelerates at the rate displayed on the right scale
- consolidation/horizontal movement - virus spreads at constant rate
- down trend - virus looses momentum IMPORTANT: the virus STILL accelerates but at a lower rate
By default the graphic displays World vs. EU vs. US vs. Asia while individual countries are available in Settings.
- EU includes the following countries (DE, FR, IT, ES, CH), all with more than 10k confirmed cases and more than 1k new daily infections.
- Asia includes CH and KR
To use the indicator it is important to disconnect main chart from the right scale, on main chart click on More (the 3 dots) -> Pin to scale -> Select "No Scale".
Pine Script® 인디케이터
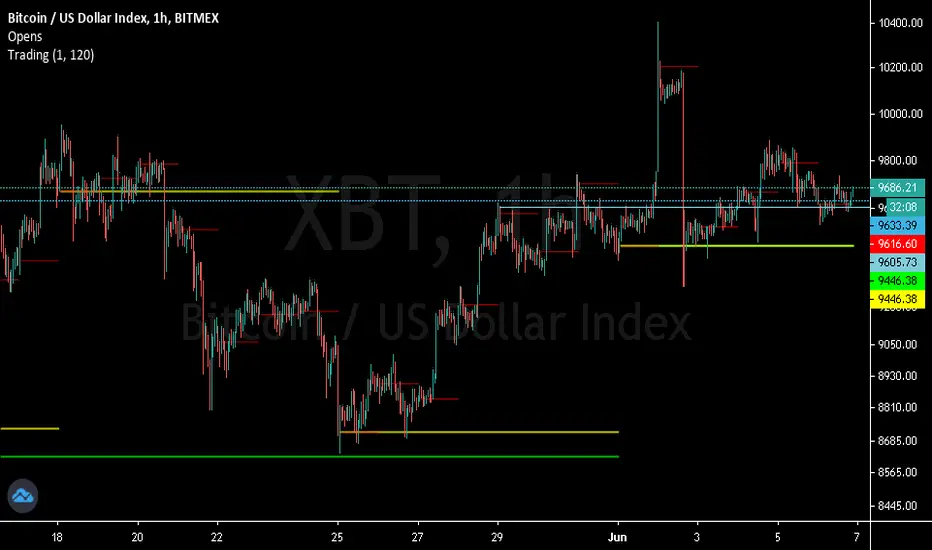
Previous Quarterly, Monthly, Weekly, Daily Candle Open, Close.This script marks the Previous Quarterly, Monthly, Weekly, and Daily Candle Open and Closes. Colors can be changed as needed.
Pine Script® 인디케이터
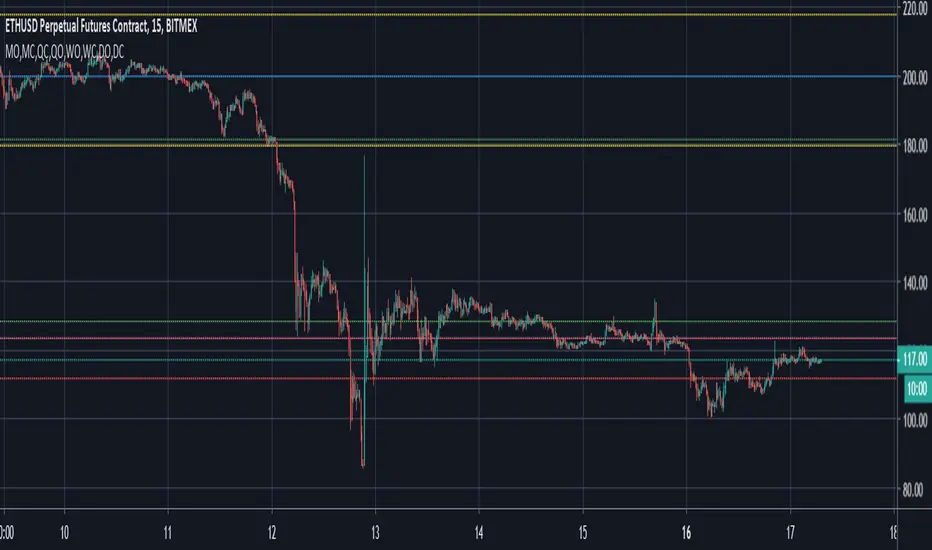
$0 Monthly Weekly & Daily OHLC Viewer
Visualizer of current or previous month(s), week(s) & days ranges
Purpose: View last Monthly, Weekly, Daily, and/or a custom time interval OHLC, i.e. previously closed/confirmed or the ongoing higher time interval ranges
Main configurations available:
- 2 main reporting modes: View the current/ongoing M/W/D candles' OHLC (live, repaints) or report OHLC of last closed ones, i.e. previous Montly, Weekly and/or Daily
- View only latest Monthly, Weekly and/or Daily OHLC (lines) or all past ones (~channel)
- Set your own time interval for its price range(s) to be reported, e.g. last quarter '3M', 12H '720', or hide it
- View one specific day of the week OHLC reported all over the week
Graphic/visual configuration:
- Show the High & Low levels or not
- Show the Open & close levels or not
- Display a background color between top & down or lines only
- Change the background color depending if is/was rising or falling price
- Highlight the top & down breaches of higher timeframe resolution candles: Daily breaching last Weekly range, and/or the Weekly the Monthly one
- Colors & styling can be edited from the indicator's styling configuration panel
Depending on its expected usage, those configurations enable to:
- Consider previously closed candles OLHC as reference top & down ranges (support & resistance, breaches)
- Review chart's current candles evolution within their higher time interval / candle (M/W/D)
- Consider specific week days' range as a reference for the week trend
- Have a general overview of the market evolution trends
Default config is to view current candles evolving within their higher time interval / candle, while reporting last previously closed M+W is a preferred usage. Play with the config settings to find your setup.
View ongoing M+W+D OHLC with dynamic background color:
View previously closed M+W+D OHLC:
View closed H&L for M+W+D, latest only:
View Mondays' OHLC:
Feedback & support welcome.
Pine Script® 인디케이터

Current vs. Average price performance (daily and weekly)This indicator is to be used only by the values it gives back, don't use the lines .
In "current week days" choose number of days that already BEGAN this week (ex. on Wednesday type 3)
Green1 - Current Daily Range
Orange1 - Average Daily Range
Green2 - Current Weekly Range
Red1 - Average Weekly Range
Orange2 - Today's price movement compared to the average daily price movement (in percentage)
Red2 - This week price movement compared to the average weekly price movement (in percentage)
By these values you can check how price performed today and this week in comparison to the average daily and weekly values - you can check with some probability if the movement is already exhausted or price can do some more action.
Pine Script® 인디케이터

MultiTimeFrame Fractals D W M [xdecow]This indicator shows fractals in different timeframes. With the possibility of coloring the bars with any combination of current, daily, weekly and monthly timeframes.
The return points are calculated as follows:
high > last 3 highs and close above highest low
low < last 3 lows and closes below lowest high
The direction of higher timeframes fractals tend to be more durable and reliable. This indicator helps to find the fractal alignment of different timeframes, so that you can look for trade opportunities in the same direction as the higher timeframes and improve your chances.
Pine Script® 인디케이터

High, Low and MidpointThis indicator plots the daily high and low from the previous day. (BLACK)
It then calculates the midpoint of the high and low and plots this. (RED)
This indicator can be used to identify daily ranges and to identify possible support and resistance levels.
Pine Script® 인디케이터

Pine Script® 인디케이터

camarilla - Daily,Weekly,Monthly by Ganeshcamarilla - Daily,Weekly,Monthly levels in one chart for support and resitance
Pine Script® 인디케이터

Pine Script® 인디케이터