Crypto Fear & Greed Score [Underblock]Crypto Fear & Greed Score - Methodology & Functioning
Introduction
The Crypto Fear & Greed Score is a comprehensive indicator designed to assess market sentiment by detecting extreme conditions of panic (fear) and euphoria (greed). By combining multiple technical factors, it helps traders identify potential buying and selling opportunities based on the emotional state of the market.
This indicator is highly customizable, allowing users to adjust weight parameters for RSI, volatility, Bitcoin dominance, and trading volume, making it adaptable to different market conditions.
Key Components
The indicator consists of two primary sub-scores:
Fear Score (Panic) - Measures the intensity of fear in the market.
Greed Score (Euphoria) - Measures the level of overconfidence and excessive optimism.
The difference between these two values results in the Net Score, which indicates the dominant market sentiment at any given time.
1. Relative Strength Index (RSI)
The indicator utilizes multiple RSI timeframes to measure momentum and overbought/oversold conditions:
RSI 1D (Daily) - Captures medium-term sentiment shifts.
RSI 4H (4-hour) - Identifies short-term market movements.
RSI 1W (Weekly) - Helps detect long-term overbought/oversold conditions.
2. Volatility Analysis
High volatility is often associated with fear and panic-driven selling.
Low volatility in bullish markets may indicate complacency and overconfidence.
3. Bitcoin Dominance (BTC.D)
Bitcoin dominance provides insights into capital flow between Bitcoin and altcoins:
Rising BTC dominance suggests fear as investors move into BTC for safety.
Declining BTC dominance indicates increased risk appetite and potential market euphoria.
4. Buying and Selling Volume
The indicator analyzes both buying and selling volume, ensuring a clearer confirmation of market sentiment.
High buying volume in uptrends reinforces bullish momentum.
Spikes in selling volume indicate panic and possible market bottoms.
Calculation Methodology
The indicator allows users to adjust weight parameters for each component, making it adaptable to different trading strategies. The formulas are structured as follows:
Fear Score (Panic Calculation)
Fear Score = (1 - RSI_1D) * W_RSI1D + (1 - RSI_4H) * W_RSI4H + (1 - Dominance) * W_Dominance + Volatility * W_Volatility + Sell Volume * W_SellVolume
Greed Score (Euphoria Calculation)
Greed Score = RSI_1D * W_RSI1D + RSI_4H * W_RSI4H + Dominance * W_Dominance + (1 - Volatility) * W_Volatility + Buy Volume * W_BuyVolume
Net Fear & Greed Score
Net Score = (Greed Score - Fear Score) * 100
Interpretation:
Above 70: Extreme greed -> possible overbought conditions.
Below -70: Extreme fear -> potential buying opportunity.
Near 0: Neutral market sentiment.
Trend Reversal Detection
The indicator includes two moving averages for enhanced trend detection:
Short-term SMA (50-periods) - Reacts quicklier to changes in sentiment.
Long-term SMA (200-periods) - Captures broader trend reversals.
How Crossovers Work:
Short SMA crossing above Long SMA -> Potential bullish reversal.
Short SMA crossing below Long SMA -> Possible bearish trend shift.
Alerts for SMA crossovers help traders act on momentum shifts in real-time.
Customization and Visualization
The Net Score dynamically changes color: green for greed, red for fear.
Users can adjust weightings directly from settings, avoiding manual script modifications.
Reference levels at 70 and -70 provide clarity on extreme market conditions.
Conclusion
The Crypto Fear & Greed Score provides a powerful and objective measure of market sentiment, helping traders navigate extreme conditions effectively.
🟢 If the Net Score is below -70, panic may present a buying opportunity.
🔴 If the Net Score is above 70, excessive euphoria may indicate a selling opportunity.
⚖️ Neutral values suggest a balanced market sentiment.
By customizing weight parameters and utilizing trend reversal alerts, traders can gain a deeper insight into market psychology and make more informed trading decisions. 🚀
스크립트에서 "crypto fear"에 대해 찾기

Rich Robin Index, The Crypto Fear & Greed Index with RSI Trend The Relative Strength Index (RSI) is a technical indicator based on price movements that is used to determine whether a particular asset is overbought or oversold. It measures the ratio of rising to falling prices over a certain period of time.
The Fear & Greed Index, on the other hand, is a composite index that tracks the sentiment of the crypto market. It is based on seven indicators, each of which measures a different aspect of market behavior. These indicators are: Safe Haven Demand, Stock Price Breadth, Market Momentum, Stock Price Strength, Put and Call Options, Junk Bond Demand, and Market Volatility.
The combination of the RSI and the Fear & Greed Index can provide valuable insights for crypto traders. The RSI can help identify overbought and oversold conditions, while the Fear & Greed Index can give an overall sense of the sentiment in the market. Together, they can provide a more complete picture of the market conditions. For example, if the RSI is indicating that an asset is overbought, but the Fear & Greed Index is showing that the market is still in a state of fear, it may be a good time to sell. On the other hand, if the RSI is indicating that an asset is oversold, but the Fear & Greed Index is showing that the market is in a state of greed, it may be a good time to buy.
Overall, the combination of the RSI and the Fear & Greed Index can provide useful information for traders to make more informed decisions, by giving a sense of the market conditions, and providing a way to identify overbought and oversold conditions.

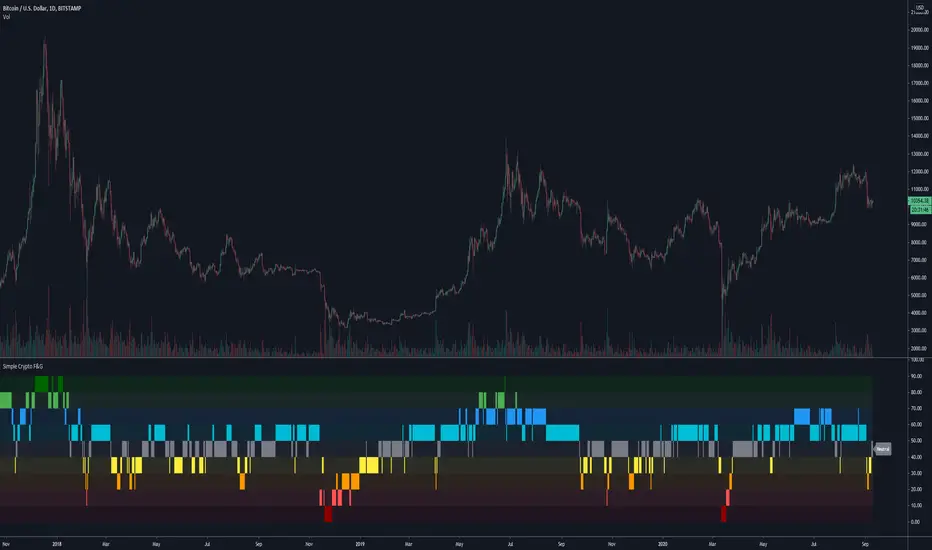
Simplified Crypto Fear & Greed DisplayA more simplified view of a Fear & Greed index.
This script has been made public because it uses Trading Psychology - Fear & Greed Index by DGT as the basis/inspiration for it.
I've re-imagined the visuals in order to display F&G data differently to the more traditional versions of the indicator floating around, as well as adapting it's calculations and reference assets for use with Crypto markets.
It's aim is to show the current status / mindset of market participants at a quick glance.
When there is a lot of fear in the market it is usually a good time to look for buying opportunities.
On the flip side you can use it to spot selling opportunities when there is too much greed / FOMO in the markets.
This indicator has the option for Traditional and Crypto markets.
The Traditional option uses the tickers VIX and GOLD as part of it's calculations, where as Crypto uses BVOL24H and BTC.D in order to base it's decisions off of more relevant data.
There are also 10 levels of smoothing so play around with that to get the desired result. Depending on the asset you are looking at, smoothing of 1 or 2 may work much better than 5+
Have a play around, customize it, use it and let me know what you think.
BTC Fear & Greed Incremental StrategyIMPORTANT: READ SETUP GUIDE BELOW OR IT WON'T WORK
# BTC Fear & Greed Incremental Strategy — TradeMaster AI (Pure BTC Stack)
## Strategy Overview
This advanced Bitcoin accumulation strategy is designed for long-term hodlers who want to systematically take profits during greed cycles and accumulate during fear periods, while preserving their core BTC position. Unlike traditional strategies that start with cash, this approach begins with a specified BTC allocation, making it perfect for existing Bitcoin holders who want to optimize their stack management.
## Key Features
### 🎯 **Pure BTC Stack Mode**
- Start with any amount of BTC (configurable)
- Strategy manages your existing stack, not new purchases
- Perfect for hodlers who want to optimize without timing markets
### 📊 **Fear & Greed Integration**
- Uses market sentiment data to drive buy/sell decisions
- Configurable thresholds for greed (selling) and fear (buying) triggers
- Automatic validation to ensure proper 0-100 scale data source
### 🐂 **Bull Year Optimization**
- Smart quarterly selling during bull market years (2017, 2021, 2025)
- Q1: 1% sells, Q2: 2% sells, Q3/Q4: 5% sells (configurable)
- **NO SELLING** during non-bull years - pure accumulation mode
- Preserves BTC during early bull phases, maximizes profits at peaks
### 🐻 **Bear Market Intelligence**
- Multi-regime detection: Bull, Early Bear, Deep Bear, Early Bull
- Different buying strategies based on market conditions
- Enhanced buying during deep bear markets with configurable multipliers
- Visual regime backgrounds for easy market condition identification
### 🛡️ **Risk Management**
- Minimum BTC allocation floor (prevents selling entire stack)
- Configurable position sizing for all trades
- Multiple safety checks and validation
### 📈 **Advanced Visualization**
- Clean 0-100 scale with 2 decimal precision
- Three main indicators: BTC Allocation %, Fear & Greed Index, BTC Holdings
- Real-time portfolio tracking with cash position display
- Enhanced info table showing all key metrics
## How to Use
### **Step 1: Setup**
1. Add the strategy to your BTC/USD chart (daily timeframe recommended)
2. **CRITICAL**: In settings, change the "Fear & Greed Source" from "close" to a proper 0-100 Fear & Greed indicator
---------------
I recommend Crypto Fear & Greed Index by TIA_Technology indicator
When selecting source with this indicator, look for "Crypto Fear and Greed Index:Index"
---------------
3. Set your "Starting BTC Quantity" to match your actual holdings
4. Configure your preferred "Start Date" (when you want the strategy to begin)
### **Step 2: Configure Bull Year Logic**
- Enable "Bull Year Logic" (default: enabled)
- Adjust quarterly sell percentages:
- Q1 (Jan-Mar): 1% (conservative early bull)
- Q2 (Apr-Jun): 2% (moderate mid bull)
- Q3/Q4 (Jul-Dec): 5% (aggressive peak targeting)
- Add future bull years to the list as needed
### **Step 3: Fine-tune Thresholds**
- **Greed Threshold**: 80 (sell when F&G > 80)
- **Fear Threshold**: 20 (buy when F&G < 20 in bull markets)
- **Deep Bear Fear Threshold**: 25 (enhanced buying in bear markets)
- Adjust based on your risk tolerance
### **Step 4: Risk Management**
- Set "Minimum BTC Allocation %" (default 20%) - prevents selling entire stack
- Configure sell/buy percentages based on your position size
- Enable bear market filters for enhanced timing
### **Step 5: Monitor Performance**
- **Orange Line**: Your BTC allocation percentage (target: fluctuate between 20-100%)
- **Blue Line**: Actual BTC holdings (should preserve core position)
- **Pink Line**: Fear & Greed Index (drives all decisions)
- **Table**: Real-time portfolio metrics including cash position
## Reading the Indicators
### **BTC Allocation Percentage (Orange Line)**
- **100%**: All portfolio in BTC, no cash available for buying
- **80%**: 80% BTC, 20% cash ready for fear buying
- **20%**: Minimum allocation, maximum cash position
### **Trading Signals**
- **Green Buy Signals**: Appear during fear periods with available cash
- **Red Sell Signals**: Appear during greed periods in bull years only
- **No Signals**: Either allocation limits reached or non-bull year
## Strategy Logic
### **Bull Years (2017, 2021, 2025)**
- Q1: Conservative 1% sells (preserve stack for later)
- Q2: Moderate 2% sells (gradual profit taking)
- Q3/Q4: Aggressive 5% sells (peak targeting)
- Fear buying active (accumulate on dips)
### **Non-Bull Years**
- **Zero selling** - pure accumulation mode
- Enhanced fear buying during bear markets
- Focus on rebuilding stack for next bull cycle
## Important Notes
- **This is not financial advice** - backtest thoroughly before use
- Designed for **long-term holders** (4+ year cycles)
- **Requires proper Fear & Greed data source** - validate in settings
- Best used on **daily timeframe** for major trend following
- **Cash calculations**: Use allocation % and BTC holdings to calculate available cash: `Cash = (Total Portfolio × (1 - Allocation%/100))`
## Risk Disclaimer
This strategy involves active trading and position management. Past performance does not guarantee future results. Always do your own research and never invest more than you can afford to lose. The strategy is designed for educational purposes and long-term Bitcoin accumulation thesis.
---
*Developed by Sol_Crypto for the Bitcoin community. Happy stacking! 🚀*

Rotation SentinelROTATION SENTINEL v1.1 — OVERVIEW
Rotation Sentinel is a macro rotation engine that tracks 10 institutional-grade dominance, liquidity, and trend signals to identify when capital is flowing into altcoins.
Each row outputs Green / Yellow / Red, and the system produces a 0–10 Rotation Score plus a final regime:
🔴 NO ROTATION (0–4)
🟡 ROTATION STARTING (5–6)
🟢 ALTSEASON (7–10)
Use on Daily timeframe for best accuracy.
KEY SIGNALS
1️⃣ BTC.D ex-stables
Shows true BTC vs alt strength.
🟢 Falling = capital rotating into alts.
🔴 Rising = alts bleeding. (Master switch.)
2️⃣ OTHERS.D
Broad altcoin dominance.
🟢 Rising = early alt strength.
🔴 Falling = weak participation.
3️⃣ ETH/BTC
Rotation ignition.
🟢 ETH outperforming = rotation can start.
🔴 ETH lagging = altseason impossible.
4️⃣ STABLE.C.D
Crypto “fear index.”
🟢 Falling = risk-on environment.
🔴 Rising = capital hiding in stables.
5️⃣ USDT.D
Real-time risk positioning.
🟢 Falling = capital deploying.
🔴 Rising = defensive.
6️⃣ TOTAL3 (HTF Trend)
Structural alt market health.
🟢 Above SMA + rising = bullish structure.
🔴 Below SMA + falling = systematic weakness.
7️⃣ TOTAL3 / TOTAL2
Depth of rotation.
🟢 Mid/small caps outperforming = deep rotation.
🔴 Only large caps moving = shallow cycle.
8️⃣ Risk Ratio (OTHERS.D / STABLE.C.D)
Pure risk appetite.
🟢 Alts gaining on stables = risk-on.
9️⃣ OTHERS/BTC
Alt value vs BTC.
🟢 Rising = alts outperforming BTC.
🔟 Liquidation Heatmap (Manual)
Update from Hyblock/Coinalyze.
🟢 Liquidity above = upside easier.
ALTSEASON TRIGGER
Fires only when all 6 core conditions turn GREEN:
BTC.D ex-stables
OTHERS.D
ETH/BTC
STABLE.C.D
TOTAL3 structure
Rotation Score ≥ threshold (default 7)
BEST PRACTICES
Use Daily timeframe (macro rotation, not intraday noise)
Score < 5 → defensive / selective trades
Score 5–6 → early rotation window
Score ≥ 7 → confirmed altseason regime
Let alerts notify you; no need to manually monitor
INCLUDED ALERTS
🚨 ALTSEASON TRIGGERED
⚠️ Rotation Score Crossed Threshold
📈 ETH/BTC Rotation Clock Activated
🔥 OTHERS.D Breaking Higher
