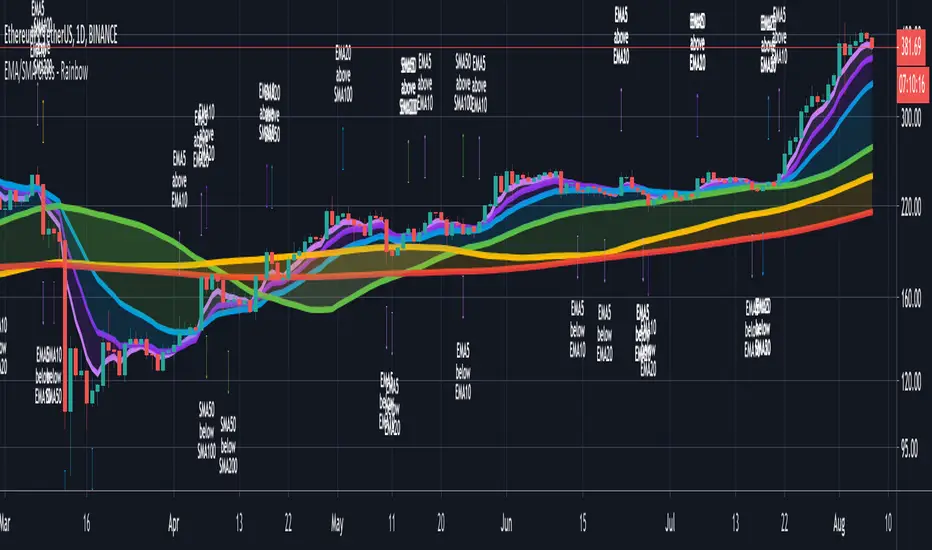
CryptoSignalScanner - Advanced Moving Averages - Cross & RainbowDESCRIPTION:
With this script you can plot 6 moving averages.
You can decide which Moving Average you want to show or hide.
For every plot you can decide to display the Simple Moving Average ( SMA ) or Exponential Moving Average ( EMA ).
It provides CrossOver and CrossUnder labels when loading the script. Those labels you can show or hide.
You have the possibility to show or hide the rainbow colors. This rainbow function gives you a clear view of the current trend.
HOW TO USE:
• When one Moving Average crosses above another Moving Average it signals an uptrend.
• When one Moving Average crosses below another Moving Average it signals a downtrend.
• The higher to length of the Moving Average the stronger the trend.
FEATURES:
• You can show/hide the preferred Moving Averages.
• You can set the length, type and source for every Moving Average.
• You can show/hide the rainbow colors.
• You can show/hide the CrossUp labels.
• You can show/hide the CrossDown labels.
• You can set alerts for every Moving Average.
• Etc...
DEFAULT SETTINGS:
• MA1 => EMA5
• MA2 => EMA10
• MA3 => EMA20
• MA4 => SMA50
• MA5 => SMA100
• MA6 => SMA200
Simple Moving Average vs. Exponential Moving Average:
SMA and EMA are calculated differently. The exponential moving average ( EMA ) focuses more on recent prices than on a long series of data points, as the simple moving average required.
The calculation makes the EMA quicker to react to price changes and the SMA react slower. That is the main difference between the two.
One is not necessarily better than another. It comes down to personal preference. Plot an EMA and SMA of the same length on a chart and see which one helps you make better trading decisions.
Moving Average Trading Strategies:
The first strategy is a price crossover, when the price crosses above or below a moving average, it signals a potential change in trend.
The second strategy applies when one moving averages crosses another moving average.
• When the short-term MA crosses above the long-term MA, it signals a buy signal.
• When the short-term MA crosses below the long-term MA, it signals a sell signal.
REMARKS:
• This advice is NOT financial advice.
• We do not provide personal investment advice and we are not a qualified licensed investment advisor.
• All information found here, including any ideas, opinions, views, predictions, forecasts, commentaries, suggestions, or stock picks, expressed or implied herein, are for informational, entertainment or educational purposes only and should not be construed as personal investment advice.
• We will not and cannot be held liable for any actions you take as a result of anything you read here.
• We only provide this information to help you make a better decision.
• While the information provided is believed to be accurate, it may include errors or inaccuracies.
If you like this script please donate some coins to share your appreciation.
Good Luck,
SEOCO
스크립트에서 "crossover债券是什么"에 대해 찾기
Combo Strategy 123 Reversal & EMA & MA Crossover This is combo strategies for get a cumulative signal.
First strategy
This System was created from the Book "How I Tripled My Money In The
Futures Market" by Ulf Jensen, Page 183. This is reverse type of strategies.
The strategy buys at market, if close price is higher than the previous close
during 2 days and the meaning of 9-days Stochastic Slow Oscillator is lower than 50.
The strategy sells at market, if close price is lower than the previous close price
during 2 days and the meaning of 9-days Stochastic Fast Oscillator is higher than 50.
Second strategy
The Moving Average Crossover trading strategy is possibly the most popular
trading strategy in the world of trading. First of them were written in the
middle of XX century, when commodities trading strategies became popular.
This strategy is a good example of so-called traditional strategies.
Traditional strategies are always long or short. That means they are never
out of the market. The concept of having a strategy that is always long or
short may be scary, particularly in today’s market where you don’t know what
is going to happen as far as risk on any one market. But a lot of traders
believe that the concept is still valid, especially for those of traders who
do their own research or their own discretionary trading.
This version uses crossover of moving average and its exponential moving average.
WARNING:
- For purpose educate only
- This script to change bars colors.

SSL Crossover + MA choiceThis indicator builds on the SSL channel code by ErwinBeckers @
I have added options for diff MA's to be used in the SSL channel and crossover indicators for buy/sell signals
default MA is set to Arnaud Legaux, but you can set it to whatever you like - original was a Simple Moving Average by ErwinBeckers
The indicator will not repaint as the signals are drawn after close of crossover candles
Let me know if you have any suggestions - happy to add more functionality

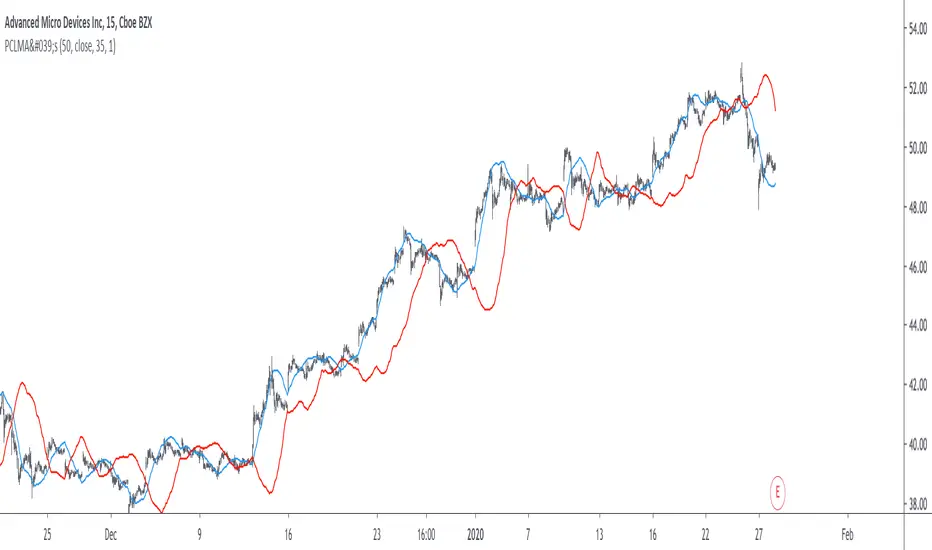
Parametric Corrective Linear Moving AveragesImpulse responses can fully describe their associated systems, for example a linearly weighted moving average (WMA) has a linearly decaying impulse response, therefore we can deduce that lag is reduced since recent values are the ones with the most weights, the Blackman moving average (or Blackman filter) has a bell shaped impulse response, that is mid term values are the ones with the most weights, we can deduce that such moving average is pretty smooth, the least squares moving average has negative weights, we can therefore deduce that it aim to heavily reduce lag, and so on. We could even estimate the lag of a moving average by looking at its impulse response (calculating the lag of a moving average is the aim of my next article with Pinescripters) .
Today a new moving average is presented, such moving average use a parametric rectified linear unit function as weighting function, we will see that such moving average can be used as a low lag moving average as well as a signal moving average, thus creating a moving average crossover system. Finally we will estimate the LSMA using the proposed moving average.
Correctivity And The Parametric Rectified Linear Unit Function
Lot of terms are used, each representing one thing, lets start with the easiest one,"corrective". In some of my posts i may have used the term "underweighting", which refer to the process of attributing negative weights to the input of a moving average, a corrective moving average is simply a moving average underweighting oldest values of the input, simply put most of the low lag moving averages you'll find are corrective. This term was used by Aistis Raudys in its paper "Optimal Negative Weight Moving Average for Stock Price Series Smoothing" and i felt like it was a more elegant term to use instead of "low-lag".
Now we will describe the parametric rectified linear unit function (PReLU), this function is the one used as weighting function and is not that complex. This function has two inputs, alpha , and x , in short if x is greater than 0, x remain unchanged, however if x is lower than 0, then the function output is alpha × x , if alpha is equal to 1 then the function is equivalent to an identity function, if alpha is equal to 0 then the function is equivalent to a rectified unit function.
PReLU is mostly used in neural network design as an activation function, i wont explain to you how neural networks works but remember that neural networks aim to mimic the neural networks in the brain, and the activation function mimic the process of neuron firing. Its a super interesting topic because activation functions regroup many functions that can be used for technical indicators, one example being the inverse fisher RSI who make use of the hyperbolic tangent function.
Finally the term parametric used here refer to the ability of the user to change the aspect of the weighting function thanks to certain settings, thinking about it, it isn't a common things for moving averages indicators to let the user modify the characteristics of the weighting function, an exception being the Arnaud Legoux moving average (ALMA) which weighting function is a gaussian function, the user can control the peak and width of the function.
The Indicator
The indicator has two moving averages displayed on the chart, a trigger moving average (in blue) and a signal moving average (in red), their crosses can generate signals. The length parameter control the filter length, with higher values of length filtering longer term price fluctuations.
The percentage of negative weights parameter aim to determine the percentage of negative weights in the weighting function, note that the signal moving average won't use the same amount and will use instead : 100 - Percentage , this allow to reverse the weighting function thus creating a more lagging output for signal. Note that this parameter is caped at 50, this is because values higher than 50 would make the trigger moving average become the signal moving average, in short it inverse the role of the moving averages, that is a percentage of 25 would be the same than 75.
In red the moving average using 25% of negative weights, in blue the same moving average using 14% percent of negative weights. In theory, more negative weights = less lag = more overshoots.
Here the trigger MA in blue has 0% of negative weights, the trigger MA in green has however 35% of negative weights, the difference in lag can be clearly seen. In the case where there is 0% of negative weights the trigger become a simple WMA while the signal one become a moving average with linearly increasing weights.
The corrective factor is the same as alpha in PReLU, and determine the steepness of the negative weights line, this parameter is constrained in a range of (0,1), lower values will create a less steep negative weights line, this parameter is extremely useful when we want to reduce overshoots, an example :
here the corrective factor is equal to 1 (so the weighting function is an identity function) and we use 45% of negative weights, this create lot of overshoots, however a corrective factor of 0.5 reduce them drastically :
Center Of Linearity
The impulse response of the signal moving average is inverse to the impulse response of the trigger moving average, if we where to show them together we would see that they would crosses at a point, denoted center of linearity, therefore the crosses of each moving averages correspond to the cross of the center of linearity oscillator and 0 of same period.
This is also true with the center of gravity oscillator, linear covariance oscillator and linear correlation oscillator. Of course the center of linearity oscillator is way more efficient than the proposed indicator, and if a moving average crossover system is required, then the wma/sma pair is equivalent and way more efficient, who would know that i would propose something with more efficient alternatives ? xD
Estimating A Least Squares Moving Average
I guess...yeah...but its not my fault you know !!! Its a linear weighting function ! What can i do about it ?
The least squares moving average is corrective, its weighting function is linearly decreasing and posses negative weights with an amount of negative weights inferior to 50%, now we only need to find the exact percentage amount of negative weights. How to do it ? Well its not complicated if we recall the estimation with the WMA/SMA combination.
So, an LSMA of period p is equal to : 3WMA(p) - 2SMA(p) , each coefficient of the combination can give us this percentage, that is 2/3*100 = 33.333 , so there are 33.33% percent of negative weights in the weighting function of the least squares moving average.
In blue the trigger moving average with percentage of negative values et to 33.33, and in green the lsma of both period 50.
Conclusion
Altho inefficient, the proposed moving averages remain extremely interesting. They make use of the PReLU function as weighting function and allow the user to have a more accurate control over the characteristics of the moving averages output such as lag and overshoot amount, such parameters could even be made adaptive.
We have also seen how to estimate the least squares moving average, we have seen that the lsma posses 33.333...% of negative weights in its weighting function, another useful information.
The lsma is always behind me, not letting me focus on cryptobot super profit indicators using massive amount of labels, its like each time i make an indicator, the lsma come back, like a jealous creature, she want the center of attention, but you know well that the proposed indicator is inefficient ! Inefficient elegance (effect of the meds) .
Thanks for reading !
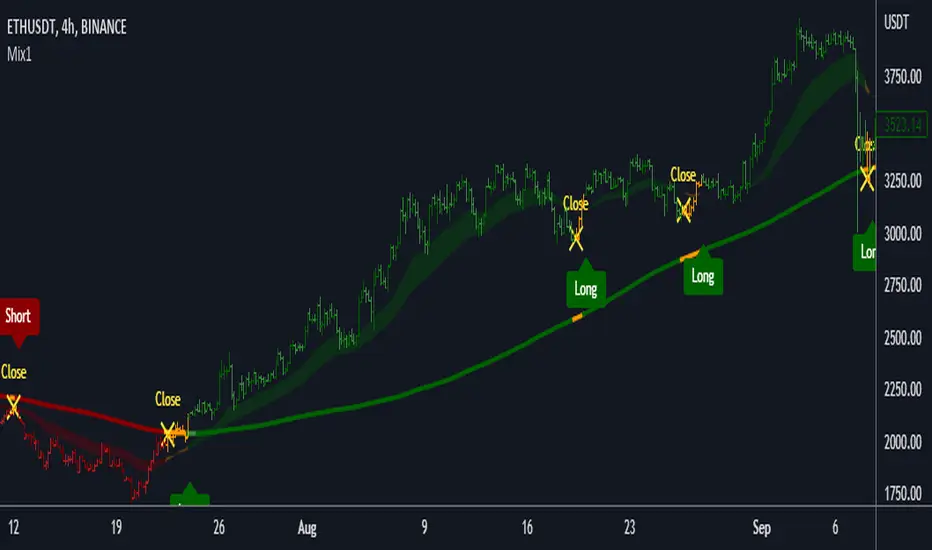
Mix1 : Ema Cross + Trend Channel [Gu5]Based on Trend Channel
Ema-crossover is added
Crossing alerts, only on trend
Basado en mi anterior indicador, Trend Channel
Se agrega Cruce de Medias Moviles (Ema-crossover)
Las alertas solo son en favor a la tendencia
El valor de SMA Range es arbitrario (No Backtesting). Cambia la amplitud de canal que determina cuando es rango (barras amarillas por estar muy cerca del SMA200, sin tendencia definida)
Range Multiplier adapta el indicador a distintos mercados
//Setting recommended for SMA Range
//BTCUSD = 100
//EURUSD = 1000
//SPX = 100
//ETHUSD = 10
Si te fue útil este indicador, puedes comprarme una cerveza ;)
RSI EMA CrossOver RameshThe RSI is one of the most popular technical indicators. The RSI measures the internal strength of the security. The RSI indicator oscillates between oversold and over bought levels, where a trader is advised to look for buying opportunities when the stock is in over sold region and selling opportunities when the stock is in over bought region.
The RSI with EMA strategy signals a trade when EMA of 7 period RSI crosses over the EMA of a 14 period RSI.
Buy: when 10 EMA of 7 period RSI crossing up 10 EMA of a 14 period RSI
Sell: when 10 EMA of 7 period RSI crossing down 10 EMA of a 14 period RSI
EMA = Exponential Moving Average
Crossover = Simple crossover between current RSI values and its 10 day EMA

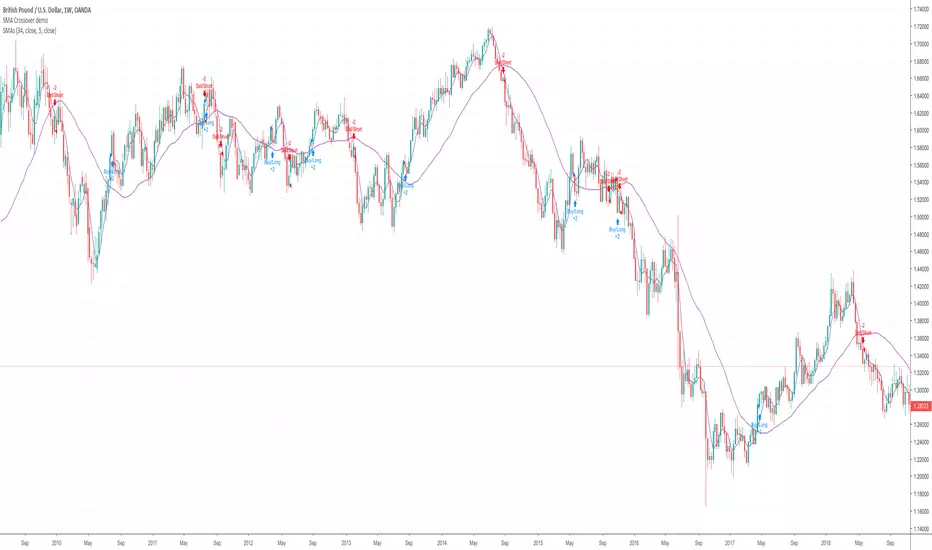
Help with SMA Crossover Demo scriptHi I'm currently in the process of learning to write a script. Here's a very basic SMA 34/4 crossover script. Is somebody able to help me with adding the following functions to the script.
1. Add an alert and indicator to close a short or long trade whenever any candle touches the SMA 34 line?
2. When a SMA 34/4 Crossover has been executed (a Short Trade condition) add an alert/indicator (Titled “Add”) every time a Green bullish candle has closed.
3. When a SMA 34/4 Crossunder has been executed (a Long Trade condition) add an alert/indicator (Titled “Add) every time a Red bearish candle has closed.
4. To used on 15m/30m/1hr/2hr/4hr/1D/1W timeframe charts?
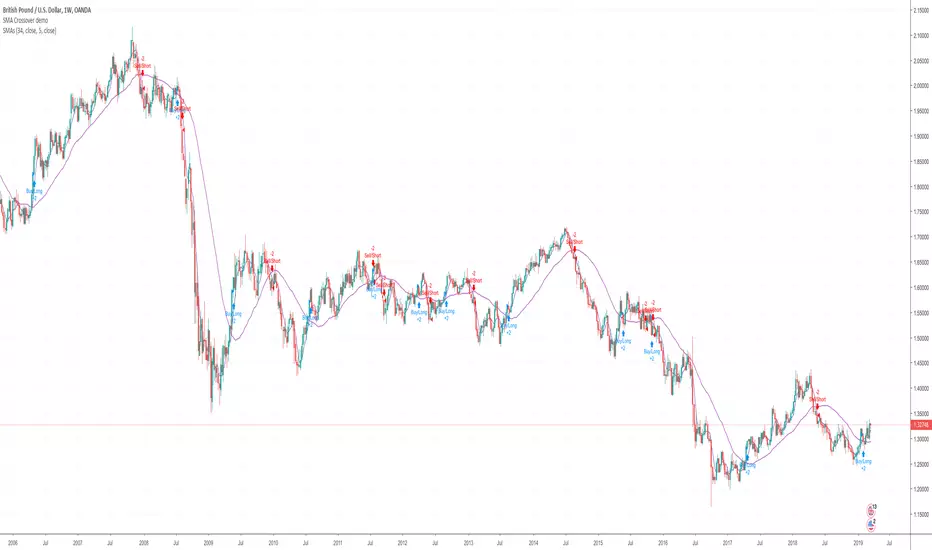
SMA Crossover demoHi I'm currently in the process of learning to write a script. Here's a very basic SMA 34/5 crossover script. Is somebody able to help me with adding the following functions to the script.
1. Add an alert and indicator to close a short or long trade whenever any candle touches the SMA 34 line?
2. When a SMA 34/5 Crossover has been executed (a Short Trade condition) add an alert/indicator (Titled “Add”) every time a Green bullish candle has closed.
3. When a SMA 34/5 Crossunder has been executed (a Long Trade condition) add an alert/indicator (Titled “Add) every time a Red bearish candle has closed.
4. To used on 15m/30m/1hr/2hr/4hr/1D/1W timeframe charts?
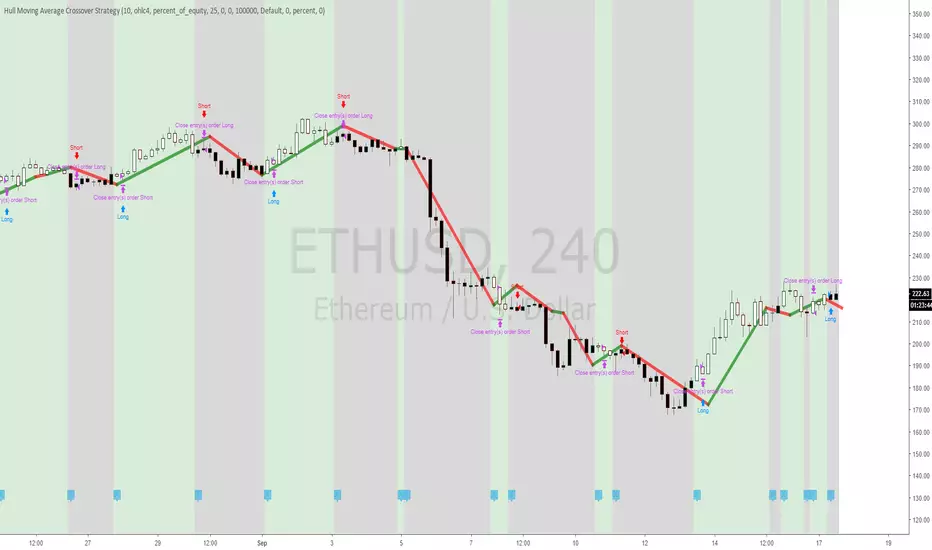
Hull Moving Average Crossover StrategyHull Moving Average Crossover, the Strategy version, so people can easily test the profitability of it.
Use Indicator version for use with Alerts
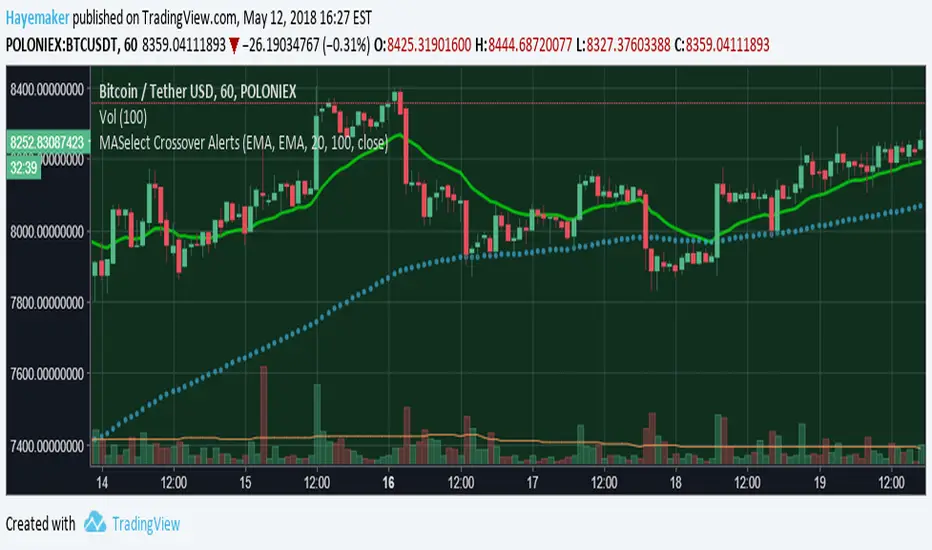
MASelect Crossover AlertsStudy for alerts, to be used with the MASelect Crossover Strat.
A simple crossover/crossunder strategy for beginners with options for 5 types of Moving Average. Use the strategy script to backtest and find your preferred Moving Average combinations and lengths.
Stochastic RSI with Crossover AlertsThis draws your Stochastic RSI just like normal except it adds red or green squares everytime there is a crossover at the bottom or the top of the oscillator. Green crossover is bullish, red is bearish.

Indicator420double hull moving average crossover
hull moving average / volume weighted moving average crossover
Red dot = SELL
Green dot = BUY
or
Longest MA color change to green = BUY
Longest MA color change to red = SELL
by SeaSide420

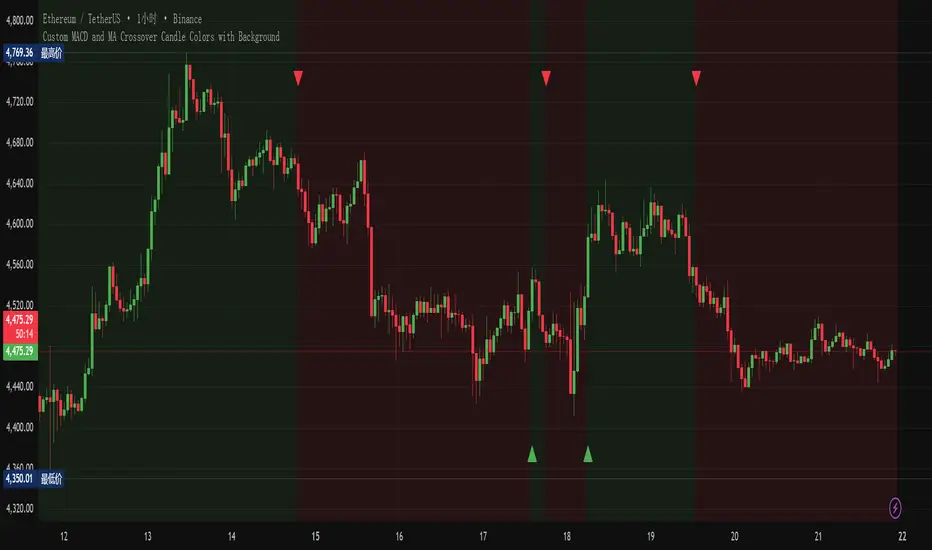
Custom MACD and MA Crossover with Background(ZWYZJNWHJ)Custom MACD and MA Crossover with Background indicator is applied to the main chart. Color blocks are marked according to when MACD crosses the 0 axis. The color of the K-line changes according to the changes in the MACD volume column. The color of the K-line will also change when it crosses multiple moving averages at the same time.
My Crossover AlertCross over of EMA - Krish
This is the big crossover of two Long EMAs . When it comes to Day indicator. Most probably the price might shoot up.
9 EMA / 20 EMA Crossover with alert for DUKE9 EMA / 20 EMA Crossover with alert for DUKE
has built in alerts to make your life easier

15-Min EMA CrossoverVery useful swing setup indicator that can be used in different styles of trading
Works on any timeframe but calculates EMA and cross signals based on 15-minute candles.
Plots the EMA line.
Shows green triangle for bullish crossover and red triangle for bearish crossunder.

MA Median Crossover | MisinkoMasterThe MA Median Crossover is a new trend analysis tool designed to help traders catch trends with less noisy, more accuracy and speed.
While simple, this effective indicator can improve your strategy more than you might think.
How does it work?
1. Get user defined input
=> set up your indicator to your likings, and make it capture what you want it to
2. Calculate the Moving Average and Median Base
=> this is the foundation of the indicator
3. Smooth the median
=> less noise, more accuracy, just like that!
4. Compare the MA to the smoothed Median
=> If the MA > smoothed Median, it signals an uptrend, if the MA < smoothed Median,
it signals a downtrend.
Yep, that is how simple it is.
Final note:
Changing the MA type is very influencial, so watch out when changing them.
Enjoy G´s!


Triple EMA with Alert | 21, 50, 200 EMA Strategy + Crossover🚀 Boost your trading edge with the Triple EMA with Alert — a professional-grade indicator designed for traders who want precise, real-time trend confirmation across short, medium, and long-term market movements.
🔹 What Makes This Indicator Powerful?
Three Adjustable EMAs — Default: 21, 50, 200 periods (fully customizable 1–200).
Toggle Visibility — Show only the EMAs you need for your strategy.
Real-Time Alerts — Get notified instantly when:
EMA 1 crosses EMA 2 → short-term trend change.
EMA 2 crosses EMA 3 → medium-term trend alignment.
Works on All Markets & Timeframes — Forex, crypto, stocks, indices, and commodities.
🔹 Why Traders Love It
📊 Multi-Timeframe Trend Confirmation — Filter out noise and trade with market momentum.
🎯 Accurate Crossover Signals — Identify bullish and bearish momentum shifts.
🔔 Hands-Free Monitoring — Alerts keep you informed even when you’re away from the chart.
💡 Versatile for Any Strategy — Perfect for scalping, swing trading, or long-term investing.
🔹 How to Use It
Bullish Signal — EMA 1 crossing above EMA 2 or EMA 2 crossing above EMA 3.
Bearish Signal — EMA 1 crossing below EMA 2 or EMA 2 crossing below EMA 3.
Combine with support/resistance zones, RSI, or volume for higher probability trades.
📌 Pro Tip:
Use EMA 21 & EMA 50 for momentum confirmation.
Use EMA 200 to spot the overall market direction.
If you’re serious about trend trading with precision, the Triple EMA with Alert will keep you one step ahead of market moves — no more missed entries or exits.

Cnagda Trading ToolCnagda Trading Tools - complete set of intraday trading
1. Trendline breakout based On ATR.
2. Live RSI, volume/candle average 20 Periods, trend direction last 34 periods, and some useful dashboard features.
3. Ma Scalp Line provide trend support and resistance + Where Line More Flat Previous Time You Also Use That Range As Support And Resistance
4. RSI based POC ( Point Of Control) indicate high Volume Area like fixed Range Volume profile
5. London session breakout with buy/sell Signal and NewYork session opening half hour range breakout with Buy/sell signal
Ma Scalp Buy And Sell Signal For Short term Scalping ( 5 Min Timeframe) Based on Ema And Wma Crossover
I hope these tools will improve your trading, but you should trade only after proper research, this indicator is not responsible for any loss.

EMA Crossover ConfirmationFast ema crossover script to identify trend changes.
There is also supertrend for all time frames.
Modified from the script
BS | Buy&Sell Signals With EMA
MA Crossover Strategy with TP/SL (5 EMA Filter)How the Strategy Works on a 5-Minute Chart:
Data Input (5-Minute Candles):
Every single data point (candle) on your chart will represent 5 minutes of price action (Open, High, Low, Close for that 5-minute period).
All calculations (MAs, EMA, signals) will be based on these 5-minute price data points.
Moving Average Calculations:
Fast MA (10-period SMA): This will be the Simple Moving Average of the closing prices of the last 10 five-minute candles. It reacts relatively quickly to recent price changes.
Slow MA (30-period SMA): This will be the Simple Moving Average of the closing prices of the last 30 five-minute candles. It represents a slightly longer-term trend compared to the Fast MA.
5 EMA (5-period EMA): This is the Exponential Moving Average of the closing prices of the last 5 five-minute candles. Being an EMA, it gives more weight to the most recent 5-minute prices, making it very responsive to immediate price action.
Signal Generation (Entry Conditions):
Long Entry Signal:
The 10-period SMA crosses above the 30-period SMA (indicating a potential bullish shift in the short-to-medium term trend).
AND the current 5-minute candle's closing price is above the 5-period EMA (confirming that the immediate price momentum is also bullish and supporting the crossover).
If both conditions are met at the close of a 5-minute candle, a "Buy" signal is generated.
Short Entry Signal:
The 10-period SMA crosses below the 30-period SMA (indicating a potential bearish shift).
AND the current 5-minute candle's closing price is below the 5-period EMA (confirming immediate bearish momentum).
If both conditions are met at the close of a 5-minute candle, a "Sell" signal is generated.
Trade Execution:
When a signal is triggered, the strategy enters a trade (long or short) at the closing price of that 5-minute candle.
Immediately upon entry, it places two contingent orders:
Take Profit (Target): Set at 2% (by default) away from your entry price. For a long trade, it's 2% above; for a short trade, 2% below.
Stop Loss: Set at 1% (by default) away from your entry price. For a long trade, it's 1% below; for a short trade, 1% above.
The trade will remain open until either the Take Profit or Stop Loss price is hit by subsequent 5-minute candles.
Implications for Trading on a 5-Minute Chart:
Increased Trade Frequency: You will likely see many more signals and trades compared to higher timeframes (like 1-hour or daily charts). This means more potential opportunities but also more transaction costs (commissions, slippage).
Sensitivity to Noise: Lower timeframes are more prone to "market noise" – small, random price fluctuations that don't indicate a true trend. While the 5 EMA filter helps, some false signals might still occur.
Faster Price Action: Price movements can be very rapid on a 5-minute chart. Your take profit or stop loss levels might be hit very quickly, sometimes within the same or next few candles.
Parameter Optimization is Crucial: The default MA lengths (10, 30) and EMA (5) might not be optimal for every asset or market condition on a 5-minute chart. You'll need to backtest extensively and potentially adjust these lengths, as well as the targetPerc and stopPerc, to find what works best for the specific instrument you're trading.
Risk Management: The fixed percentage stop loss is vital on a 5-minute chart due to its volatility. Without it, a few unfavorable moves could lead to significant losses.
