Cuathro EMA StrategyIt's a long term script based on multiples EMA, crossover and crossunder.
Based on two good scripts CM Sling and OCC.
Always adjust resolution at least twice than chart.
Enjoy it! BTCUSD
스크립트에서 "cm"에 대해 찾기

Price ActionThis script is an alternative version of ChrisMoody's Price Action indicator, which is quite useful.
However, I found it a little intrusive with all the colors. I wanted something more subtle, so I made this.
The only difference is that this one uses shapes to highlight the candlestick patterns, and I dropped the Inside Bar indicator for simplicity.

CM_Guppy_EMA Revised by JustUncleLThis is an updated version of script created By ChrisMoody to use Daryl Guppy EMA's.
30-Aug-2017 Revisions by JustUncleL
Added Optional Alert Arrows
Added Alertcondition to generate signals for Alarm Subsystem.
Changed some default colours.
CMs Original script and details can be found here:


Candlestick Trend Indicator v0.5 by JustUncleLRequested Update to this Indicator alert project. In this update I have added the option to be able select which Price Action candles you want included in the display and the generated alarm Alert. Other changes also included in this update:
Also added a Price Action candle for "Last Fractal S/R Break", this also a good continuation indication.
Added option to select a different moving average types for directional MA line.
Modified some default settings, using HullMA instead of Zero Lag EMA and standard MACD settings(12,26,9).
Description:
This is a trend following indicator and alert for Binary Options based on Candlestick patterns and trend line -
NOTE: original system was a forex trading system.
This code combines a number of indicators to create an overall trading strategy.
The indicator recognises and displays some useful candle named defined patterns that are used to support trend continuation:
Bearish + Bullish PinBars
Dark Cloud Cover
Piecing Line
Bullish + Bearish Harami
Bullish + Bearish Engulfing Candle
Bullish + Bearish Last Fractal S/R break
Also recognises main Price Action candles from ChrisMoody (CM), the four(4) price action patterns are colored coded bars:
Yellow = Inside Bar - breakout/continuance
Orange = Outside Bar - breakout/continuance
Aqua/Fuschia = Up/Down Shaved Bars - Buying/Selling pressure
Red/Green = Possible reversal PinBars - Reverse Down / reverse Up
The highlighted candles (maroon and darker green) represent the defined PA patterns that have been confirmed following the current trend direction that is indicated by the Hull MA(20) line (can select a different type of MA, or even disable) and confirmed by MACD direction (can be disabled). The confirmed Alerts are indication by green (buy) and red (sell) dots at the bottom of the chart. An alert is generated from this selection for the alert condition of the alarming system.
The fractal upper/lower break lines are also draw, if the (optional) last fractal break line is broken by a highlighted bar then this indicates a stronger trend conformation.
The MACD indicator MACD DEUTER 2 colour(12,26,9) you can visually see the MACD histogram colours with MACD direction - needs "MACD DEUTER 2 colour" indicator.
This multi-indicator set up is suitable for 1hr, 4hr and daily charts with 1-4 candle expiry.
References and Inspiration from:
Fractal Levels by RicardoSantos
Almost Zero Lag EMA
Candlestick Patterns With EMA by rmwaddelljr
CM_Price-Action-Bars by ChrisMoody
www.forexstrategiesresources.com
"Scalp Jockey - MTF MA Cross Visual Strategizer by JayRogers"

Vix FIX / StochRSI StrategyThis strategy is based off of Chris Moody's Vix Fix Indicator . I simply used his indicator and added some rules around it, specifically on entry and exits.
Rules :
Enter upon a filtered or aggressive entry
If there are multiple entry signals, allow pyramiding
Exit when there is Stochastic RSI crossover above 80
This works great on a number of stocks. I am keeping a list of stocks with decent Profit Factors and clean equity curves here .
Possible ways to use this:
Modify this script and setup alerts around the various entries
Use as is with different stocks or currency pairs
Modify entry / exit points to make it more profitable for even more symbols and currencies

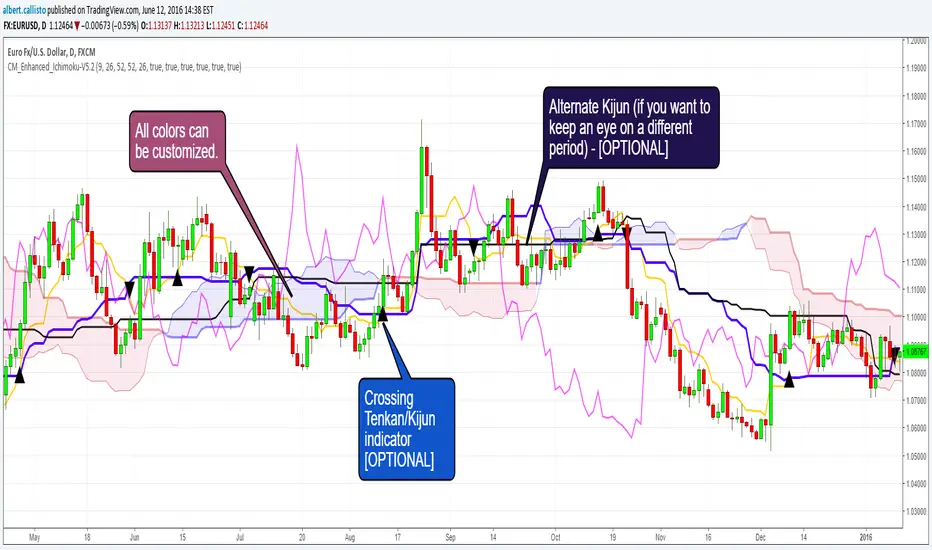
CM_Enhanced_Ichimoku Cloud-V5.2New version of the improved Ichimoku cloud
Original by Chris Moody, great work.
This indicator is a colorized Ichimoku with colors that you can change for any component. Not many changes between 5.1 and 5.2, I fixed some labels and the crossing detection, as well as the default colors.
There's not much more left we can do without radically changing the original Ichimoku. We could implement full-multiframe but you can already do that by adding several times this indicator and changing the periods.
Displayed components:
Kijun-Sen: middle of the highest/lowest prices during the last 26 periods
Tenkan-Sen: middle of the highest/lowest prices during the last 9 periods
Senkou Span A (SSA) : average of Kijun and Tenkan, projected 26 periods ahead
Senkou Span B (SSB): middle of the highest/lowest prices during the last 52 periods, and projected 26 periods ahead
Chikou Span: the closing price projected 26 periods behind.
Kumo: the cloud itself, the area between SSA/SSB.
The script also provides indication of the crossings between Tenkan and Kijun, some trading strategies are based upon that. There is also a separate Kijun with its own period for those you'd like to have this information at another timeframe. I removed the third Kijun that was in version 5.1, I don't think it was widely used and made the configuration screen too crowded. If you really need this, take a look at Donchian indicators, the Kijun is basically a Donchian on 26 periods.
Chris Moody Version (v5):
Forex Trading Sessions with Daylight Savings TimeV1 - Max WarrenDifferent version of the CM one but everything is configurable and easy to manage.
Daylight savings may also be toggled, I cannot automatically toggle it yet but hopefully with a pine update I will be able to.
It had the four main sessions but version two could possibly have all of them as optional toggles
Hope it is useful

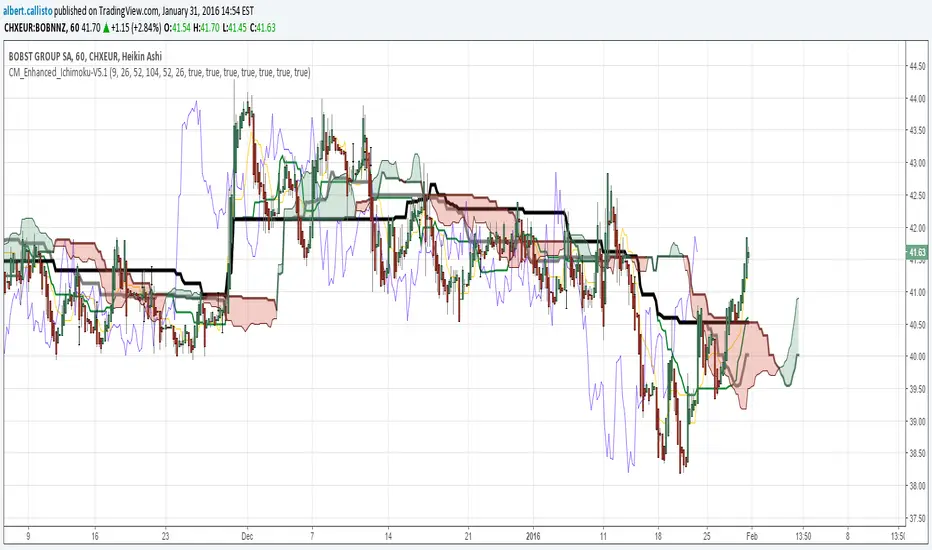
CM_Enhanced_Ichimoku Cloud-V5.1Based upon
Thanks Chris Moody !
Here are my changes, I looked at comments on the original page.
Thinner default lines, changed colors
Added options to add two extra Kijun with their own periods, useful to check resistance/support lines on different scales
Decreased height of arrows
MA_FibBand_MTFMoving average of High, Low & Close with Fibonacci bands calculated from the average high and low. Four upper levels are to the power of 1.618, 2.618, 3.618 & 4.618. Four lower levels are to the power of 0.618, 1.618, 2.618 & 3.618. Included are a choice of time frames either current, semi-custom or fully custom allowing freedom to set any period you like which makes it great for historical averages. Adapted and expanded from Clarke Moody's MA_MTF i have tidied the script and included all CM's formulas although should be used in SMA or EMA i kept the other MA formulas for curiosity.
My preferred usage is to stick with 20ma and adjust the legnth of the period. Shown here is 20ema of 10day period.
More information can be learnt from 'endlessmountain' on youtube but only the very top and bottom levels are used with the High, Low & Close. Also i am not aware if this originates from any other source.
Thankyou to Clarke Moody and endlessmountain. Hope you like this tool.

CM_Laguerre PPO PercentileRank Mkt Tops & BottomsCustom Code that Finds Market Tops & Bottoms!!!
CM_Laguerre PPO PercentileRank V2 Mkt Tops & Bottoms
Original Laguerre PPO code was Created by TheLark.
Special Thanks to coondawg71 and ChartArt for Great Insights
This Is Version 2 Of This Indicator that now Finds Market Tops and Bottoms.
Coming Next…Upper Indicator Pinpointing Entries Based on Price Action!!!
See Original Post Below For Detailed Information.
Other Indicators That Show Market Bottoms Well.
CM ATR PERCENTILERANK - GREAT FOR SHOWING MARKET BOTTOMS!
GREAT CONFIRMING INDICATOR FOR THE WILLIAMS VIX FIX
TWO TRADING SYSTEMS - BASED ON EXTREME MOVES!!!

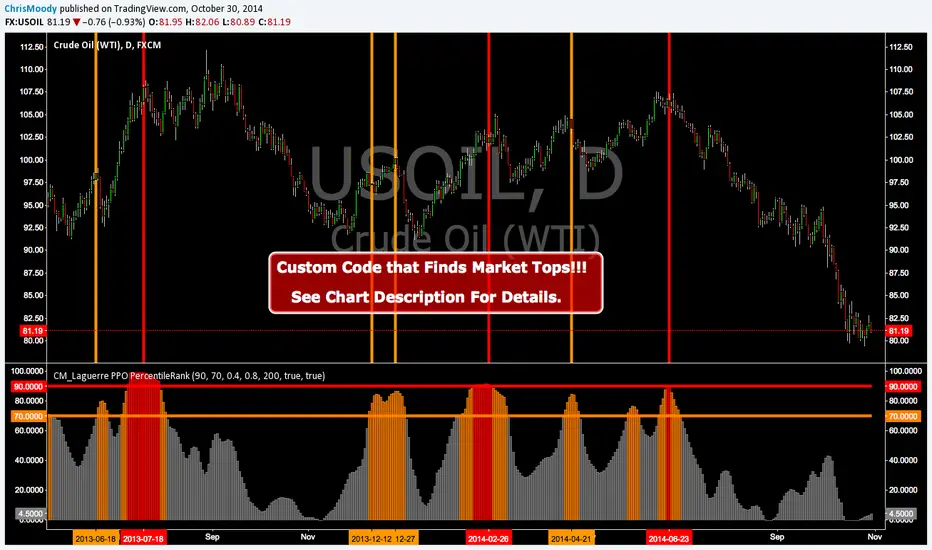
CM_Laguerre PPO PercentileRank - Markets ToppingCustom Code that Finds Market Tops!!!
CM_Laguerre PPO PercentileRank - Markets Topping
Original Laguerre PPO code was Created by TheLark.
I found if I applied a Percent Rank of the PPO to view Extreme Moves in the PPO it was great at showing Market Tops.
Features via Inputs Tab:
Ability to set all PPO Indicator Values.
Ability to set Warning Threshold Line Value and Extreme Percentile Threshold Line Values.
Ability to turn On/Off Warning and Extreme Percentile Rank Lines.
***I’ve found this Indicator to be Valid…However, I have NOT Extensively tested the Settings. Initially setting the LookBack Period to 200 on A Daily chart with a 90 Extreme Percentile Rank Value works Good. Some charts changing the Lookback period to 50 an draisisng the Extreme Percentile Rank Line to 95 Works Great.
***To Be Blunt…When I look at the underlying Indicator…I don’t know why this Shows Us What It Does When the Percentile Rank Function is applied to it…But For Whatever Reason…It Just Works.
***If you Find Very Useful Settings Please Post Below
Other Indicators That Show Market Bottoms Well.
CM ATR PERCENTILERANK - GREAT FOR SHOWING MARKET BOTTOMS!
GREAT CONFIRMING INDICATOR FOR THE WILLIAMS VIX FIX
TWO TRADING SYSTEMS - BASED ON EXTREME MOVES!!!