Candle Range Detector by TradeTech AnalysisCandle Range Detector by TradeTech Analysis
This advanced indicator identifies and visualizes price compression zones based on inside bar formations, then tracks how price behaves around those zones — offering valuable insights into liquidity sweeps, range expansions, and trap/mitigation behavior.
The script builds upon the foundational concept of range-based price action, commonly used by institutional traders, and adds automation, mitigation tracking, and sweep detection to map how price reacts around these critical ranges.
🔍 How It Works:
• Range Formation: A new range is detected when the current candle forms entirely within the high and low of the previous candle (i.e., an inside bar). This behavior often indicates price compression and potential breakout zones.
• Range Extension: Once a range is confirmed, the script projects upper and lower boundaries (using either a percentage-based multiplier or Fibonacci log extension), providing context for expected breakout zones.
• Mitigation Tracking: The script continuously monitors whether price breaks above or below the projected extensions, marking that range as mitigated — useful for confirming whether liquidity was absorbed.
• Sweep Detection: If price re-visits a mitigated zone and shows signs of a liquidity sweep (via wick + close behavior), the indicator triggers visual sweep labels and optional alerts.
🧠 Optional Visual Enhancements:
• Highlight range-forming candles with light blue background (toggle on/off)
• Midpoint dotted line for symmetry analysis
• Labels for “Range High” and “Range Low” for visual clarity
• Dynamic box drawing that adapts upon mitigation or continuation
⚙️ Customizable Features:
• Choose between Normal and Fibonacci-based detection modes
• Toggle visibility of range boxes, extension lines, and sweep markers
• Configure sweep alerts, mitigation window size, and visual transparency
⸻
🧪 Use Cases
• Identify consolidation zones before major price moves
• Confirm liquidity sweeps for entry/exit traps
• Visualize and test mitigation behavior of past zones
• Combine with Order Flow or Volume Profile tools to enhance context
⸻
⚠️ This is a fully original implementation that goes beyond classical inside-bar scanners by incorporating mitigation, extension projection, and liquidity sweeps — making it a powerful tool for intraday, swing, and even Smart Money-based trading setups.
스크립트에서 "candle"에 대해 찾기

Candle Count RSI📈 Candle Count RSI — A Dual-Perspective Momentum Engine
The Candle Count RSI is a custom-built momentum oscillator that expands on the classic Relative Strength Index (RSI) by introducing a directional-only variant that tracks the frequency of bullish or bearish closes, rather than price magnitude. It gives traders a second lens through which to evaluate momentum, trend conviction, and subtle divergences—often invisible to traditional price-based RSI.
💡 What Makes It Unique?
While the standard RSI is sensitive to the size of price changes, the Candle Count RSI is magnitude-blind. It counts candle closes above/below open over a lookback period, generating a purer signal of directional consistency. To enhance signal fidelity, it includes a streak amplifier, dynamically weighting extended runs of green or red candles to reflect intensity of market bias—without introducing artificial price sensitivity.
This dual-RSI approach allows for:
- Divergence detection between directional bias and price magnitude.
- Smoother trend confirmation in choppy markets.
- Cleaner visual cues using dynamic glow and background logic.
📐 How Standard RSI Actually Works (Not What You Think)
RSI doesn’t just check if price went up or down over a span—it checks each individual candle and tracks whether it closed higher or lower than the one before. Here's how it works under the hood:
1.) For each bar, it calculates the change from the previous close.
2.) It separates those changes into gains (upward moves) and losses (downward moves).
3.) Then it computes a smoothed average of those gains and losses (usually using an RMA).
4.) It calculates the Relative Strength (RS) as:
RS = AvgGain / AvgLoss
5.) Finally, it plugs that into the RSI formula:
RSI = 100 - (100 / (1 + RS))
⚖️ What Does the 50 Line Mean?
- The RSI scale runs from 0 to 100, but 50 is the true neutral zone:
- RSI > 50 means average gains outweigh average losses over the period.
- RSI < 50 means losses dominate.
- RSI ≈ 50? The market is balanced—momentum is indecisive, no clear trend bias.
- This makes 50 a powerful midline for trend filters, directional bias tools, and divergence detection—especially when paired with alternative RSI logic like Candle Count RSI.
🔧 Inputs and Customization
- Everything is fully modular and customizable:
🧠 Core Settings
- RSI Length: Used for both the standard RSI and Candle Count RSI.
📉 Standard RSI
- Classic RSI calculation based on price changes.
- Optional WMA smoothing to reduce noise.
- Glow effect toggle with custom intensity.
🕯 Candle Count RSI
- Computes RSI using only the count of up/down candles.
- Optional smoothing for stability.
- Amplifies streaks (e.g., multiple consecutive bullish candles increase strength).
- Glow effect toggle with adjustable strength.
🎇 Glow Visuals
- Background glow (subpane and/or main chart).
- Fades based on RSI distance from the 50 midpoint.
- Independent color settings for bull and bear bias.
🧬 Divergence Zones
- Detects when Candle RSI and Standard RSI diverge.
- Highlights:
- Bullish Divergence: Candle RSI > 50, Standard RSI < threshold.
- Bearish Divergence: Candle RSI < 50, Standard RSI > threshold.
- Background fill optionally shown in subpane and/or main chart.
📊 Directional Histogram
- MACD-style histogram showing the difference between the two RSI lines.
- Color-coded based on directional agreement:
- Both rising → green.
- Both falling → red.
- Conflict → yellow.
🧠 Under the Hood — How It Works
🔹 Standard RSI
- Classic ta.rsi() applied to close prices, optionally WMA-smoothed.
🔹 Candle Count RSI (CCR)
- Counts how many candles closed up/down over the period.
- Computes a magnitude-free RSI from these counts.
- Applies a streak-based multiplier to exaggerate trend strength during consecutive green/red runs.
- Optionally smoothed with WMA to create a clean signal line.
- This makes CCR ideal for detecting true directional bias without being faked out by volatile price spikes.
🔹 Divergence Logic
- When Candle RSI and Standard RSI disagree strongly across defined thresholds, background fills highlight early signs of momentum decay or hidden accumulation/distribution.
🔹 Glow Logic
- Glow zones are controlled by a master toggle and drawn with dynamic transparency:
- Further from 50 = stronger conviction = darker glow.
- Shows up in subpane and/or main chart depending on user preference.
📷 Suggested Use Case / Visual Setup
- Use in conjunction with your primary price action system.
- Watch for divergences between the Candle Count RSI and Standard RSI for early trend reversals.
- Use glow bias zones on the main chart to get subconscious directional cues during fast scalping.
- Histogram helps you confirm when both RSI variants agree—useful during strong trending conditions.
🛠️ Tip for Traders
- This tool isn’t trying to “predict” price. It’s designed to visualize hidden market psychology—when buyers are showing up with consistent pressure, or when momentum has a disconnect between conviction and magnitude. Use this to filter entries, spot weak rallies, or sense when a trend is about to break down.
⚠️ WARNING
- Not for use with Heikin Ashi, Renko, etc.).
🧠 Summary
Candle Count RSI is not just another mashup—it's a precision-built, dual-perspective oscillator that captures directional conviction using real candle behavior. Whether you're scalping intraday or swing trading momentum, this script helps clarify trend integrity and exposes hidden weaknesses with elegance and clarity.
—
🛠️ Built by: Sherlock_MacGyver
Feel free to share feedback or reach out if you'd like to collaborate on custom features.

Candle/Keltner Channels BUY SELLWhy Use Candlesticks?
They help traders visualize price action
Used in technical analysis and price pattern recognition (e.g., Doji, Engulfing, Hammer)
Assist in determining entry and exit points
Why Traders Use Keltner Channels?
Keltner Channels are widely used by traders for identifying trends, detecting volatility, and spotting trade opportunities.
1. Trend Identification
The middle line (EMA) shows the general trend.
If price consistently stays above the middle line, it indicates a strong uptrend.
If price stays below, it signals a downtrend.
Use: Traders follow the trend direction to enter trades in line with momentum.
2. Volatility Measurement
The width of the channel expands and contracts based on Average True Range (ATR).
Wider channels = high volatility, tighter channels = low volatility.
Use: Helps traders decide when to expect breakouts or calm periods.
3. Breakout Signals
A break above the upper band can signal a bullish breakout.
A break below the lower band can signal a bearish breakout.
Use: Traders use this for momentum trading and breakout entries.
4. Overbought/Oversold Conditions
Price touching or crossing the upper band may suggest it's overbought.
Price touching or crossing the lower band may suggest it's oversold.
Use: Traders combine this with RSI or MACD to confirm reversal setups.
5. Trade Entry and Exit
When price pulls back to the middle EMA during a trend, it may present a buy/sell opportunity.
Exits can also be planned if price returns inside the bands after a breakout.
Use: Helps with precise entry and exit timing.
6. Combines Well With Other Indicators
Commonly used with:
RSI (for confirmation)
MACD (for momentum)
Candlestick patterns (for price action signals)
Combining Candlestick Patterns with Keltner Channels gives traders a powerful method to confirm entries, spot reversals, and improve accuracy. Here’s why this combination works so well:
1. Context for Candlestick Signals
Candlestick patterns (like doji, engulfing, or pin bars) show potential price reversals, but they need context to be reliable. Keltner Channels provide that context:
A bullish candlestick near the lower band suggests a stronger buy signal.
A bearish candlestick near the upper band strengthens a sell signal.
2. Filtering False Signals
Candlestick patterns occur frequently, and not all are meaningful.
The location within the Keltner Channel helps filter out weak or false patterns.
Example: A bullish engulfing candle outside the lower band = high-probability reversal.
3. Improved Entry Timing
Traders wait for a candlestick pattern confirmation when price touches or crosses a Keltner band.
This avoids premature entries and allows tighter stop-losses.
4. Better Risk-Reward Setup
Candlestick entry near channel extremes (upper/lower band) lets traders place stop-losses just beyond recent highs/lows.
The target can be the opposite side of the channel or the middle EMA.
5. Visual Simplicity
Keltner Channels + Candles are visually intuitive.
Even beginner traders can easily recognize:
Overextended candles near channel edges.
Confirmed breakouts or reversals.
This Timeframe 5 min : XAUUSD

Candle % High/Low Bar + HL Order + MA by Barty&PitPapcioWhat does the indicator show?
The "Candle % High/Low Bar + HL Order + MA by Barty&PitPapcio" indicator displays the percentage deviation of each candle’s high and low relative to its open price. The zero line represents the candle’s open — bars above zero show upward movement from the open (to high), bars below zero show downward movement (to low).
Additionally, the indicator plots a dot above or below each bar indicating which came first during the candle — the high or the low — based on data from a lower timeframe two steps below the current chart (for example, on a 1-hour chart it uses 15-minute data).
Finally, the indicator calculates and plots a user-selectable moving average (EMA, SMA, or WMA) of these "first high or low" signals, helping identify trends whether the first move is more often upwards or downwards.
Where do the data come from?
Percentage values are calculated directly from the current chart’s candles:
highPerc=(High−Open)/Open×100%,
lowPerc=(Low−Open)/Open×100%
The timing of the first high or low for each candle is retrieved from a lower timeframe, stepping down two levels from the current timeframe (e.g. from 1H to 15 min), providing better precision in detecting the order of highs and lows that may be blurred on higher timeframes.
Additional features:
Full customization of colors for bars, dots, zero line, grid, and thicknesses.
Background grid with adjustable scale and style.
Safety checks for missing lower timeframe data.
A moving average smoothing the sequence of first high/low signals to reveal directional tendencies.
Suggested strategy for technical analysis support
Identify dominant candle direction: If the dot often appears above the bar (first high), it indicates buying pressure; if below (first low), selling pressure dominates.
Use percentage deviations: Large percent bars indicate heightened volatility and potential reversal points.
Moving average on order signals: The EMA of high/low first signals smooths the noise, showing the dominant trend in the sequence of price moves, useful for filtering other signals.
Combine with other tools: This indicator can act as a directional filter on multiple timeframes, synergizing well with momentum indicators, RSI, or support/resistance levels to confirm move strength.
Lots of love, Bartosz

Candlestick Pattern Detector - Vijay PrasadOverview:
This Pine Script v6 indicator is designed to detect and label key candlestick patterns on TradingView charts. It provides real-time visual markers for major bullish and bearish reversal signals, aiding traders in decision-making.
Usefulness:
✅ Saves time by automating candlestick pattern detection.
✅ Reduces manual chart analysis errors.
✅ Works across all markets & timeframes.
✅ Enhances trading strategies with accurate signals.
Candlestick Patterns Recognises:
Bullish Engulfing – A strong bullish reversal pattern.
Bearish Engulfing – Indicates a potential downtrend.
Hammer – Suggests a market bottom or reversal.
Shooting Star – A bearish reversal signal at the top of an uptrend.
Doji – Signals market indecision and possible trend change.
Key Functions:
Automated Pattern Visible
Identifies candlestick patterns dynamically and plots them on the chart.
Visual Labels for Patterns
Labels to indicate specific candlestick formations.
Labels appear only when a valid pattern is detected, avoiding unnecessary clutter.
Buy/Sell Signal
Plots buy signals at bullish patterns and sell signals at bearish patterns.
Helps traders recognize trend reversals and entry/exit points.
Bullish Engulfing Pattern (Green Label)
What it means: A bullish engulfing pattern typically signals a potential reversal from a downtrend to an uptrend. The current candle fully engulfs the previous candle, signaling strong buying interest.
Identifying Candlestick Patterns on the Chart
How to use it:
Entry: Look for a green label (bullish engulfing) at the bottom of the chart. When it appears, consider entering a long position (buy).
Confirmation: To increase reliability, wait for confirmation by observing if price moves above the high of the bullish engulfing candle.
Exit: Exit when the trend shows signs of reversing or take profit at predefined levels (e.g., resistance or a risk-to-reward ratio).
Bearish Engulfing Pattern (Red Label)
What it means: A bearish engulfing pattern is a signal of a potential reversal from an uptrend to a downtrend. The current candle fully engulfs the previous candle, signaling strong selling pressure.
How to use it:
Entry: Look for a red label (bearish engulfing) at the top of the chart. When it appears, consider entering a short position (sell).
Confirmation: Wait for the price to move below the low of the bearish engulfing candle to confirm the bearish trend.
Exit: Close the trade when the price reaches support levels or the trend shows signs of reversing.
Doji Pattern (Blue Circle)
What it means: A Doji candle signals market indecision. It represents a balance between buyers and sellers, often marking a potential reversal or consolidation point.
How to use it:
Entry: If the Doji appears after a strong trend (bullish or bearish), wait for the next candle to break above or below the Doji's high or low. This can signal a continuation or reversal.
Confirmation: You can look for additional indicators like moving averages, RSI, or MACD for confirmation before taking any action.
Exit: Exit when the price shows clear momentum in your entry direction.
Hammer Pattern (Orange Triangle)
What it means: The hammer pattern is a bullish reversal pattern that appears after a downtrend. It suggests that sellers pushed the price down during the session, but buyers managed to push the price back up.
How to use it:
Entry: When a hammer appears, consider entering a long position (buy). The price should move above the hammer's high for confirmation.
Confirmation: Look for strong volume and a follow-up bullish candle to confirm the reversal.
Exit: Set a target based on the next resistance level, or use a trailing stop to lock in profits.
Using Candlestick Patterns with Other Indicators
To increase your chances of success, combine candlestick patterns with other technical indicators.
Here are some ideas:
RSI (Relative Strength Index): Use RSI to check whether the market is overbought or oversold. A bullish engulfing in an oversold market could indicate a stronger buy signal, and a bearish engulfing in an overbought market could indicate a stronger sell signal.
Moving Averages (e.g., 50 EMA, 200 EMA): Confirm trend direction. If the candlestick pattern aligns with the direction of the moving averages, it can give a stronger signal.
MACD (Moving Average Convergence Divergence): Use MACD to confirm momentum and potential trend changes. If a candlestick pattern aligns with a MACD crossover, it strengthens the signal.
Volume: Look for higher-than-average volume when a pattern appears. This can give you additional confirmation that the market is reacting strongly.
Practice and Refine
It's important to practice using the candlestick patterns in a demo account or backtest them to see how they perform under different market conditions. Over time, you can adjust the settings and patterns to fit your trading style and preferences.

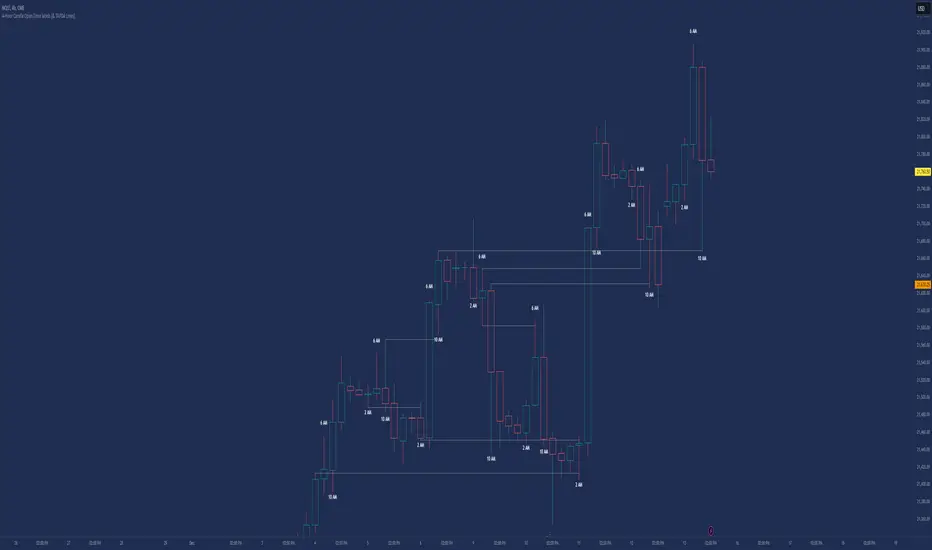
Candle Open Time labels (& TAPDA Lines)Description of the "4-Hour Candle Opening Times (TAPDA Lines)" Indicator
The "4-Hour Candle Opening Times (TAPDA Lines)" indicator integrates key principles of the Time and Price Action Trading Algorithm (TAPTA) with practical tools for analyzing market behavior. This script is designed for traders who leverage the interaction between time and price to identify opportunities in the market. The indicator supports the identification of significant price levels and potential areas of interest based on historical data and recurring patterns tied to specific timeframes.
Core Concepts
Time and Price Interaction (TAPTA Logic):
The script implements TAPTA principles by focusing on time intervals (4-hour candles) and the price action associated with those intervals.
Traders use this logic to recognize how prices behave at specific times, identifying patterns, levels of support or resistance, and potential reversals.
Highs and Lows Recognition (TAPDA):
The indicator includes logic for identifying and marking "Tapped Highs and Lows," which occur when price action retraces to previously significant levels within a specified tolerance. These taps are visually represented with horizontal lines, enabling traders to spot recurring price behaviors and levels of interest.
Dynamic Levels for Decision-Making:
By combining time and price, the script visualizes key price levels and their relevance over time, equipping traders with actionable insights for entry, exit, and risk management.
Indicator Features
1. Visual Representation of Candle Opening Times
The indicator marks the opening times of 4-hour candles on the chart.
A customizable label system displays the time in either a 12-hour or 24-hour format, with options to toggle the visibility of AM/PM suffixes.
2. TAPDA Logic
Identifies and highlights price levels that have been tapped within a specified tolerance.
Horizontal lines are drawn to mark these levels, allowing traders to see historical price levels acting as support or resistance.
The "Tapped Highs and Lows" are updated dynamically based on the most recent price action.
3. Timeframe-Specific Filtering
Users can limit the display to specific times of interest, such as 2 AM, 6 AM, and 10 AM, by toggling the "GCT (General Candle Times)" option.
Additional options allow filtering TAPDA logic by AM or PM timeframes, catering to traders who focus on specific market sessions.
4. Adjustable Plotting Limits
The script incorporates settings for controlling the maximum number of labels and lines displayed on the chart:
Max Labels: Limits the number of labels plotted for 4-hour candle opening times.
Max TAPDA Lines: Limits the number of TAPDA horizontal lines displayed.
A "Sync Lines and Labels" option ensures the same number of labels and lines are plotted when enabled, providing a consistent and clutter-free visualization.
5. Plot Maximum Capability
A "Plot Max" feature allows users to override the default behavior and force the plotting of the maximum allowed labels and lines, providing a comprehensive view of historical data.
6. User-Friendly Customization
Fully customizable label styles, including options for position, size, color, and background opacity.
Adjustable tolerance levels for TAPDA lines ensure compatibility with different market conditions and trading strategies.
Settings for flipping or aligning label positions above or below candles, or locking them to the opening price.
Script Logic
The script is built to prioritize efficiency and clarity, adhering to TradingView's Pine Script best practices and community standards:
Initialization:
Arrays are used to store historical price data, including highs, lows, and timestamps, ensuring only the necessary amount of data is processed.
A flexible and efficient data management system maintains a rolling window of data for both labels and TAPDA lines, ensuring smooth performance.
Label and Line Plotting:
Labels are plotted dynamically at user-defined positions and styles to mark the opening times of 4-hour candles.
TAPDA lines are drawn between historical high or low points and the current price action when the tolerance condition is met.
Limit Management:
The script enforces limits on the number of labels and lines plotted on the chart to maintain visual clarity.
Users can enable synchronization between the maximum labels and lines to ensure consistent visualization.
Customization Options:
Extensive customization settings allow traders to tailor the indicator to their strategies and preferences, including:
Label and line styles.
Session filtering (AM, PM, or specific times).
Display limits and synchronization options.
Capabilities
1. Enhance Time-Based Analysis
By marking significant times (4-hour candle openings), traders can identify key market phases and recurring behaviors tied to specific hours.
2. Leverage Historical Price Action
TAPDA logic highlights areas where price action interacts with historical highs and lows, providing actionable insights into potential support or resistance zones.
3. Improve Decision-Making
The indicator supports informed decision-making by blending visual data with time and price action principles, helping traders spot opportunities and mitigate risks.
4. Flexible Application Across Strategies
Suitable for day traders, swing traders, and position traders who utilize time and price action for trend analysis, reversals, or breakout strategies.
Best Practices for Use
Key Levels Analysis:
Focus on labels and TAPDA lines near critical price zones to gauge potential market reactions.
Session-Based Trading:
Use AM/PM filters or GCT settings to isolate specific trading sessions relevant to your strategy.
Combine with Other Indicators:
Enhance the effectiveness of this indicator by combining it with moving averages, RSI, or other tools for confirmation.
Risk Management:
Use the identified levels for stop-loss placement or target setting to align with your risk tolerance.
Candle Movement MarkerThe Candle Movement Marker is a powerful Pine Script indicator designed to help traders quickly identify significant price movements within candles. Whether you're looking for large swings or want to analyze volatile periods, this tool gives you the visual cues you need to make better trading decisions.
Features:
Customizable Movement Detection: Specify whether to measure movement based on the full candle range (High-Low) or the candle body (Open-Close).
Movement Threshold Setting: Set a percentage threshold, and the indicator will mark all candles with movement greater than this value.
Visual Arrows: Bullish and bearish arrows (green and red) mark the significant candles, with the arrows moving dynamically along with the chart.
Average Movement Calculation: Displays the average movement of the last 'N' candles (fully customizable) in a convenient informational box on the chart.
Informative Placement: Choose whether to show the average movement in the top right or bottom right of the chart to avoid cluttering your analysis.
This indicator is ideal for traders who want to analyze price action, identify volatile candles, and study significant price behavior in a visually intuitive manner. Whether you’re a breakout trader or interested in understanding market momentum, Candle Movement Marker helps make the analysis easy and clear.
Use Case: This script helps traders study historical market movements by marking the most significant candles and providing an average movement over a customizable range. This makes it easy to spot when the market is making significant moves and identify trends or reversals, supporting informed decision-making.

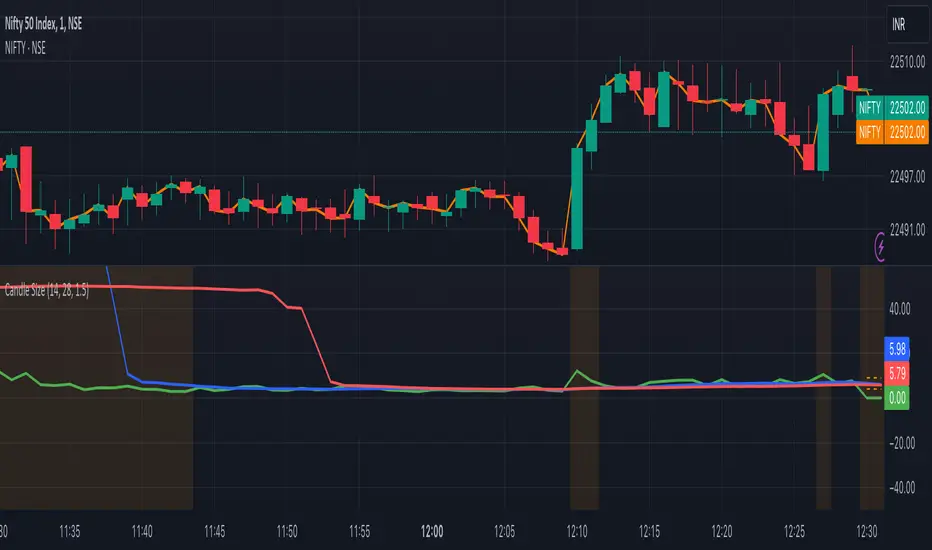
Candle Size with Moving Averages and AlertsOverview
The "Candle Size with Moving Averages and Alerts" indicator is designed to provide traders with a visual representation of the size of each candle. This is useful for identifying periods of high volatility or significant price movements. The indicator also offers moving averages of the candle sizes and customizable alert thresholds to notify traders of unusually large or small candles.
Key Features
Candle Size Plot: Displays the size of each candle on a separate panel.
Moving Averages: Optionally plot moving averages of the candle sizes with customizable lengths and colors.
Alert Thresholds: Define thresholds to get alerted when candle sizes are unusually large or small.
Customizable Colors: Choose colors for different elements of the indicator.
Alerts: Visual and background color alerts for significant candle sizes.
How to Use the Indicator
Adding the Indicator to Your Chart
Open TradingView and navigate to your chart.
Click on the "Indicators" button at the top of the chart.
Search for "Candle Size with Moving Averages and Alerts."
Click on the indicator to add it to your chart.
Customizing the Indicator
Once the indicator is added to your chart, click on the settings icon (gear icon) next to the indicator's name in the chart legend.
This will open the settings panel where you can customize various parameters of the indicator.
Settings and Parameters
Show Moving Averages
Checkbox: Enable or disable the display of moving averages on the candle size plot.
MA Length 1
Input: Set the length of the first moving average (default is 14).
MA Length 2
Input: Set the length of the second moving average (default is 28).
Alert Threshold
Input: Define the threshold for alerts as a multiple of the average candle size (default is 1.5).
MA Color 1
Color Picker: Choose the color for the first moving average (default is blue).
MA Color 2
Color Picker: Choose the color for the second moving average (default is red).
Candle Size Color
Color Picker: Choose the color for the candle size plot (default is green).
Alert Threshold Color
Color Picker: Choose the color for the alert thresholds (default is orange).
Understanding the Plots
Candle Size Plot
The main plot shows the size of each candle (high minus low) in green by default.
This helps you visualize the volatility and identify significant price movements.
Moving Averages
If enabled, two moving averages are plotted on the candle size chart to help you understand the average candle size over different periods.
MA 1 (blue by default) and MA 2 (red by default) provide a smoothed view of the candle sizes.
Alert Thresholds
The upper and lower thresholds are plotted as dashed lines (orange by default).
The upper threshold indicates an unusually large candle size, while the lower threshold indicates an unusually small candle size.
Alerts and Background Colors
When the candle size exceeds the upper threshold, an alert is triggered, and the background color changes to a semi-transparent orange.
When the candle size falls below the lower threshold, an alert is triggered, and the background color changes to a semi-transparent orange.
These visual cues help you quickly identify significant candle sizes.
Example Settings
MA Length 1: 14
MA Length 2: 28
Alert Threshold: 1.5
MA Color 1: Blue
MA Color 2: Red
Candle Size Color: Green
Alert Threshold Color: Orange
Candle Color By OHLC ComparisonThis indicator is designed to help you recognize the price movements within a candle/bar more quickly and easily. Typically, candle coloring is based on the opening and closing prices, but in this indicator, I followed the OHLC values in reverse order: starting with closing, low, high, and then opening. Each of these is compared with the value in the previous candle. I assigned the least importance to the opening, hence did not include it in the color determination. To make the colors memorable, I used a rainbow-like color scale; with purple representing the highest value and maroon the lowest. You can also change the colors if you wish. Additionally, if you want to set alarms, I assigned values to the candles; the highest being 16 and the lowest 1. A thicker barchart provides a better visual representation.
For instance, consider the monthly chart of the NASDAQ 100. After a prolonged positive trend, when our indicator shows a negative maroon bar (representing a low value) for the first time, it could signal a change in the trend direction. In this scenario, the appearance of the maroon bar serves as a crucial alert for investors to review their current positions or prepare for a potential downtrend. This indicator provides users with a significant advantage in identifying such critical turning points and assists them in quickly adapting to market dynamics.

Candle Colored by Volume Z-score [Morty]This indicator colors the candles according to the z-score of the trading volume. You can easily see the imbalance on the chart. You can use it at any timeframe.
In statistics, the standard score (Z-score) is the number of standard deviations by which the value of a raw score (i.e., an observed value or data point) is above or below the mean value of what is being observed or measured. Raw scores above the mean have positive standard scores, while those below the mean have negative standard scores.
This script uses trading volume as source of z-score by default.
Due to the lack of volume data for some index tickers, you can also choose candle body size as source of z-score.
features:
- custom source of z-score
- volume
- candle body size
- any of above two
- all of above two
- custom threshold of z-score
- custom color chemes
- custom chart type
- alerts
default color schemes:
- green -> excheme bullish imbalance
- blue -> large bullish imbalance
- red -> excheme bearish imbalance
- purple -> large bearish imbalance
- yellow -> low volume bars, indicates "balance", after which volatility usually increases and tends to continue the previous trend
Examples:
* Personally, I use dark theme and changed the candle colors to black/white for down/up.
Volume as Z-score source
Any as Z-score source, more imbalances are showed

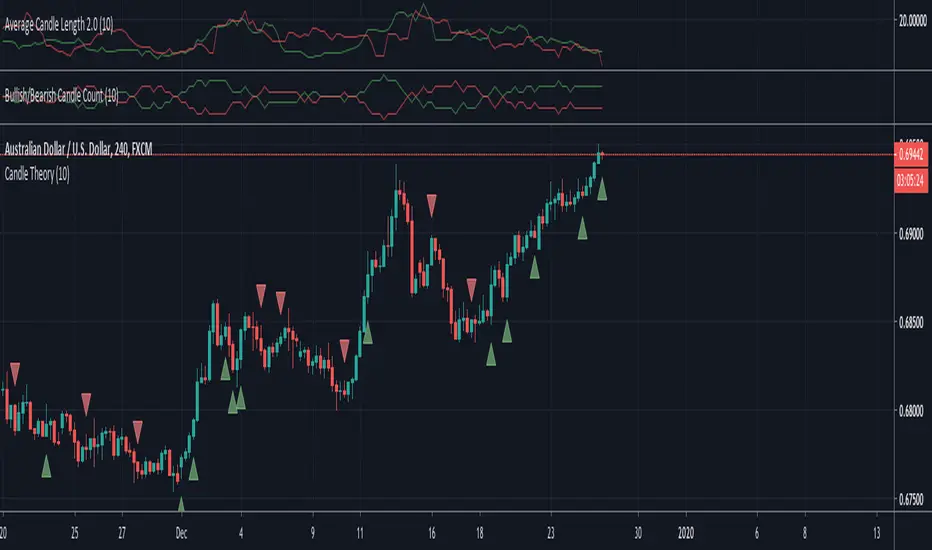
Candle TheoryDescription: The theory behind this script is that if within the last 10 candles, if the majority of them are green and the average length (wick to wick) of those majority green candles is greater than the average length of the minority red candles then it will signal that this is a bullish move within the market and signal you to buy. The opposite is true for bearish moves.
Inputs:
Length - this allows you to decide how many candles to look back, default/recommended is 10
Show First Signal In Series Only - using this indicator without this checked will show many more signals in a row. This allows you to just get a signal for the first candle that is the predicted bullish or bearish move
Candlestick Pattern Indicator – Doji, Harami, More [algo_aakash]This Candlestick Pattern Indicator is designed to help traders identify key price action patterns like Bullish Engulfing, Bearish Engulfing, Doji, Hammer, Morning Star, Evening Star, and many more directly on your TradingView chart. With customizable options to display both bullish and bearish patterns , this indicator provides real-time visual markers and labels, helping you make informed trading decisions.
Key features of the indicator include:
Detects popular candlestick patterns such as Bullish Engulfing, Bearish Engulfing, Hammer, Morning Star, Tweezer Tops, and more.
Customizable settings for displaying pattern shapes, labels, and opacity, tailored to your trading preferences.
Option to plot signals only after a candle closes, ensuring accuracy.
Alerts for immediate notification of detected patterns.
Visual markers on the chart, including arrows and labels, for quick recognition of potential trade setups.
This indicator is ideal for traders who rely on candlestick patterns for technical analysis and want an automated tool to highlight these setups for easier decision-making.
Whether you're a beginner or an experienced trader, this tool will help you spot important patterns in real-time without cluttering your chart.

Candle Range-BarsThe Candle Range Bars indicator visually represents the range of each candlestick in either pips or ticks, depending on your preference. It plots vertical bars to show the size of each candle, making it easy to identify periods of high or low volatility. The indicator also displays the exact range value (in pips or ticks) above each bar, with customizable text size and color for better readability.
Key Features
Pips or Ticks Mode:
Choose to display the candle range in pips (for forex traders) or ticks (for other instruments).
Customizable Text:
Adjust the text color and text size (Tiny, Small, Normal, Large) to suit your chart style.
Clear Visuals:
Bars are colored green for bullish candles and red for bearish candles, making it easy to distinguish between up and down moves.
Flexible Use:
Ideal for analyzing volatility, identifying consolidation zones, and comparing candle ranges across different timeframes.
How to Use:
Add the indicator to your chart.
Customize the settings:
Choose between pips or ticks.
Adjust the text color and text size for the range values.
Observe the bars and their corresponding range values to analyze market volatility.
Why Use This Indicator?:
Simplify Range Analysis: Quickly see the size of each candlestick without manual calculations.
Customizable: Tailor the appearance to match your trading style.
Versatile: Works on any instrument and timeframe.
Settings:
Show Pips (Otherwise Ticks): Toggle between pips and ticks mode.
Text Color: Choose the color of the range value text.
Text Size: Select the size of the range value text (Tiny, Small, Normal, Large).
Ideal For:
Forex, stocks, commodities, and crypto traders.
Traders who focus on volatility and range analysis.
Anyone looking for a clear and customizable way to visualize candle ranges.
This description highlights the key features, benefits, and usability of your indicator, making it appealing to other TradingView members. Let me know if you'd like to tweak it further! 😊

Candle 1 2 3 on XAUUSD (by Veronica)Description
Discover the Candle 1 2 3 Strategy, a simple yet effective trading method tailored exclusively for XAUUSD on the 15-minute timeframe. Designed by Veronica, this strategy focuses on identifying key reversal and continuation patterns during the London and New York sessions, making it ideal for traders who prioritise high-probability entries during these active market hours.
Key Features:
1. Session-Specific Trading:
The strategy operates strictly during London (03:00–06:00 UTC) and New York (08:30–12:30 UTC) sessions, where XAUUSD tends to show higher volatility and clearer price movements.
Pattern Criteria:
- Works best if the first candle is NOT a pin bar or a doji.
- Third candle should either:
a. Be a marubozu (large body with minimal wicks).
a. Have a significant body with wicks, ensuring the close of the third candle is above Candle 2 (for Buy) or below Candle 2 (for Sell).
Callout Labels and Alerts:
Automatic Buy and Sell labels are displayed on the chart during qualifying sessions, ensuring clarity for decision-making.
Integrated alerts notify you of trading opportunities in real-time.
Risk Management:
Built-in Risk Calculator to estimate lot sizes based on your account size, risk percentage, and stop-loss levels.
Customizable Table:
Displays your calculated lot size for various stop-loss pip values, making risk management seamless and efficient.
How to Use:
1. Apply the indicator to XAUUSD (M15).
2. Focus on setups appearing within the London and New York sessions only.
3. Ensure the first candle is neither a pin bar nor a doji.
4. Validate the third candle's body placement:
For a Buy, the third candle’s close must be above the second candle.
For a Sell, the third candle’s close must be below the second candle.
5. Use the generated alerts to streamline your entry process.
Notes:
This strategy is meant to complement your existing knowledge of market structure and price action.
Always backtest thoroughly and adjust parameters to fit your personal trading style and risk tolerance.
Credit:
This strategy is the intellectual property of Veronica, developed specifically for XAUUSD (M15) traders seeking precision entries during high-volume sessions.

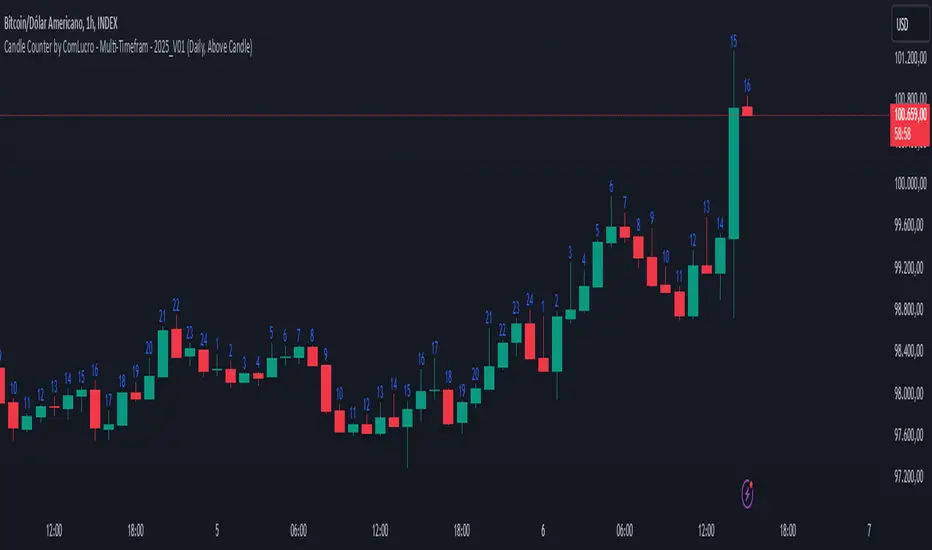
Candle Counter by ComLucro - Multi-Timefram - 2025_V01Candle Counter by ComLucro - Multi-Timeframe - 2025_V01
The Candle Counter by ComLucro - Multi-Timeframe is a highly customizable tool designed to help traders monitor the number of candles across various timeframes directly on their charts. Whether you're analyzing trends or tracking specific market behaviors, this indicator provides a seamless and efficient way to enhance your technical analysis.
Key Features:
Flexible Timeframe Selection: Track candle counts on yearly, monthly, weekly, daily, or hourly intervals to suit your trading style.
Dynamic Label Positioning: Choose to display labels above or below candles, offering greater control over your chart layout.
Customizable Colors: Adjust label text colors to match your chart's aesthetics and improve visibility.
Clean and Organized Visualization: Automatically generates labels for each candle without overcrowding your chart.
How It Works:
Select a Timeframe: Choose from yearly, monthly, weekly, daily, or hourly intervals based on your analysis needs.
Automatic Counting: The indicator calculates and displays the number of candles for the selected period directly on your chart.
Label Customization: Adjust the position (above or below the candles) and color of the labels to align with your preferences.
Why Use This Indicator?
This script is perfect for traders who need a clear and visual representation of candle counts in specific timeframes. Whether you're monitoring trends, evaluating price action, or developing strategies, the Candle Counter by ComLucro adapts to your needs and helps you make informed decisions.
Disclaimer:
This script is intended for educational and informational purposes only. It does not constitute financial advice. Always practice responsible trading and ensure this tool aligns with your strategies and risk management practices.
About ComLucro:
ComLucro is dedicated to providing traders with practical tools and educational resources to improve decision-making in the financial markets. Discover other scripts and strategies developed to enhance your trading experience.
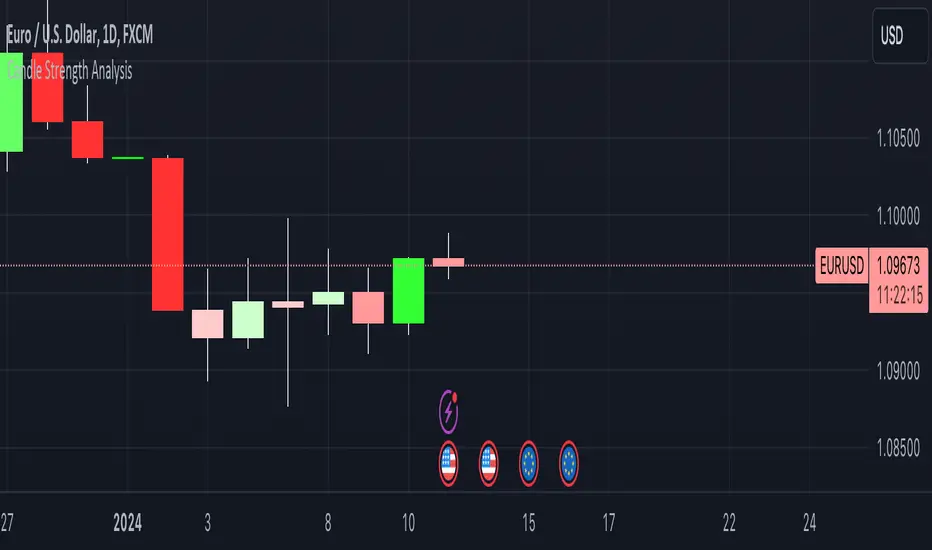
Candle Strength AnalysisView candles differently with this new indicator designed to simply visualise and analyse price movements on your chart!
The more vibrant the colour, the stronger the conviction of its respective candle.
This simple script calculates the closing price as a percentage within the candles high/low range. A colour/strength rating is then assigned to the candle based on where this close price sits within the range.
Strong coloured candles occur when the close is very close to a high or low.
User defined percentage and colour inputs allow for quick personalisation and flexibility.
An additional wick imbalance feature identifies when a candle has a larger wick than its body, which may be used to identify a ranging market or shift in trader sentiment.
For any questions, concerns, or requests, please reach out to me in the comments below.
- The Pine Guru
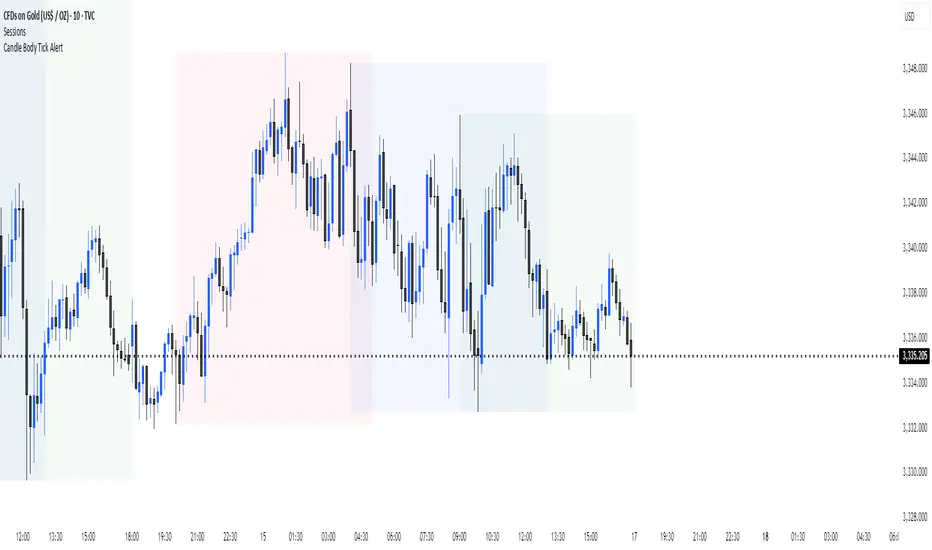
Candle Body Size AlertThis indicator monitors the body size of each candle (close minus open, ignoring wicks) and compares it to a user-defined threshold measured in ticks. If the candle body exceeds the threshold, the indicator triggers an alert condition at the close of the candle.
Features:
1. Adjustable threshold in ticks (default: 4000)
2. Adjustable timeframe (or use chart timeframe)
3. Alerts only at candle close (no intrabar signals)
Use Case:
Designed for traders who want to be notified when unusually large candles form, helping to identify strong momentum moves or volatility spikes.
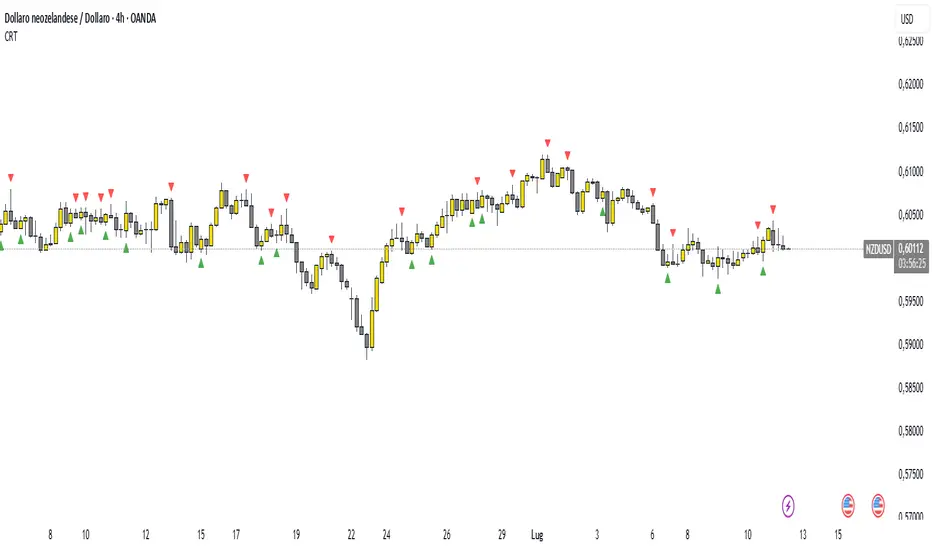
Candle Range Theory (CRT) indicator📌 Indicator Name: Candle Range Theory (CRT) indicator
This indicator detects potential bullish and bearish reversal setups based on specific candlestick price action behavior. It is designed to highlight moments when the market may be rejecting extremes and preparing to reverse direction — but only after confirmation with the closing price.
🔍 How It Works:
Bullish Setup (Long Signal):
The previous candle is bearish (closes lower than it opens).
The current candle makes a lower low than the previous one.
The current candle closes above the previous candle’s close.
Bearish Setup (Short Signal):
The previous candle is bullish (closes higher than it opens).
The current candle makes a higher high than the previous one.
The current candle closes below the previous candle’s close.
Signals are only triggered after the bar is fully closed, to avoid premature entries.
🔔 The script includes alert conditions for both long and short setups so you can receive notifications instantly.
🎥 Inspiration:
The idea for this indicator came from the excellent educational content presented in this video:
"How to Read Candlesticks Like a Pro"
We highly recommend watching it to better understand the price action principles behind this signal.
Candle Height & Trend Probability DashboardDescription and Guide
Description:
This Pine Script for TradingView displays a dashboard that calculates the probability of price increases or decreases based on past price movements. It analyzes the last 30 candles (by default) and shows the probabilities for different timeframes (from 1 minute to 1 week). Additionally, it checks volatility using the ATR indicator.
Script Features:
Calculates probabilities of an upward (Up %) or downward (Down %) price move based on past candles.
Displays a dashboard showing probabilities for multiple timeframes.
Color-coded probability display:
Green if the upward probability exceeds a set threshold.
Red if the downward probability exceeds the threshold.
Yellow if neither threshold is exceeded.
Considers volatility using the ATR indicator.
Triggers alerts when probabilities exceed specific values.
How to Use:
Insert the script into TradingView: Copy and paste the script into the Pine Script editor.
Adjust parameters:
lookback: Number of past candles used for calculation (default: 30).
alertThresholdUp & alertThresholdDown: Thresholds for probabilities (default: 51%).
volatilityLength & volatilityThreshold: ATR volatility settings.
dashboardPosition: Choose where the dashboard appears on the chart.
Enable visualization: The dashboard will be displayed over the chart.
Set alerts: The script triggers notifications when probabilities exceed set thresholds.

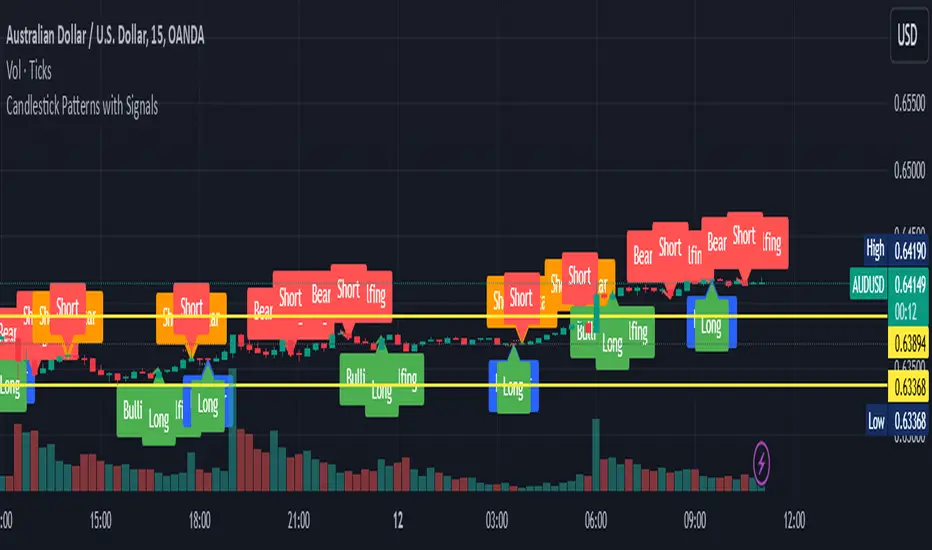
Candlestick Patterns with SignalsIdentified Patterns:
Bullish Engulfing: Indicates potential upward price movement, marked with green labels and lines.
Bearish Engulfing: Suggests potential downward price movement, marked with red labels and lines.
Hammer: A bullish reversal pattern, marked with blue labels.
Shooting Star: A bearish reversal pattern, marked with orange labels.
Signal Generation:
Long Signal: Triggered when a Bullish Engulfing or Hammer pattern is detected. A dotted green line marks the entry level.
Short Signal: Triggered when a Bearish Engulfing or Shooting Star pattern is detected. A dotted red line marks the entry level.
Visual Elements:
Labels indicating the candlestick pattern names appear at the relevant candles.
Lines connect the previous and current candles for engulfing patterns to highlight their range.
Dotted lines indicate potential entry levels for long or short trades.
Candle Patterns with Volume ValidationHey Guys !
█ This indicator shows validated Hammer and Shooting Star candle patterns based on volume.
This indicator identifies Hammer and Shooting Star patterns and validates them using volume analysis.
Hammer and Shooting Star patterns are candlestick patterns that signal potential reversals in the market.
█ Usages:
A hammer is formed when in a session, the price has fallen, only to reverse and recover to close back near the opening price. This is a sign of strength with the selling having been absorbed in sufficient strength for the buyers to overwhelm the sellers, allowing the market to recover. The hammer is so called as it is ‘hammering out a bottom’, and just like the shooting star, is immensely powerful when combined with Volume Price Analysis (VPA).
The shooting star is a bearish reversal pattern that appears at the top of uptrends. It signifies that prices have peaked and a downward reversal is likely. The presence of high volume strengthens this signal, indicating that the insiders are offloading their positions.
When combined with volume analysis, these patterns become powerful signals. The volume provides context to the price action, helping traders confirm the validity of the pattern. For example, a hammer with high volume suggests strong buying interest, whereas a shooting star with high volume indicates strong selling pressure.
█ Features:
• Detects Hammer and Shooting Star patterns.
• Validates patterns with volume thresholds.
• Color codes patterns based on volume validation.
• Allows customization of volume thresholds and pattern criteria.
• Option to show or hide signals.
█ Parameters:
• Volume Average Period: The period used to calculate the average volume.
• Higher Volume Multiplier: Multiplier to define higher volume threshold.
• Much Higher Volume Multiplier: Multiplier to define much higher volume threshold.
• Enormous Volume Multiplier: Multiplier to define enormous volume threshold.
• Body/Shadow Ratio for Hammer and Shooting Star: Ratio of body to shadow for pattern validation.
• Upper Shadow Limit for Hammer: Upper shadow limit for Hammer pattern.
• Lower Shadow Limit for Shooting Star: Lower shadow limit for Shooting Star pattern.
• Show Hammer Signals: Display signals for Hammer patterns.
• Show Shooting Star Signals: Display signals for Shooting Star patterns.
Enjoy !
Candle Combo ScreenerThe Candle Combo Screener allows you to see candlestick combinations for up to 5 different tickers at the same time . If one of the candle combination is detected the corresponding cell will be highlighted to alert you.
Candle Combinations Detected
Bullish Kicker
Bullish & Bearish Oops Reversals
Open Equals High / Low
Inside Day
Select any 5 tickers. Colors and table settings are fully customizable to fit your style.
Bullish Kicker
The opening price of the current candle gaps up above the body of the prior day's candle AND the prior day's candle close was less than the open.
Oops Reversals
Bullish: Price opens below the prior day’s low and closes above.
Bearish: Price opens above the prior day's high and closes below.
Open Equals High / Low
The current candles opening price is equal to either the high or low of the day.
Inside Day
The current candles high and low are contained within the prior day's high and low.

Candle Strength IndicatorThe candle strength indicator depicts the average strength of the price action by evaluating bullish vs bearish candles.
The scale is relative to price fluctuation and the size of the candles for the particular ticker / market, so there are no significant levels.
A cross on the zero line would generally indicate a change in trend / sentiment.
This indicator may be useful as a filter for entries and use in confluence with other indicators.
