BOCS Channel Scalper Strategy - Automated Mean Reversion System# BOCS Channel Scalper Strategy - Automated Mean Reversion System
## WHAT THIS STRATEGY DOES:
This is an automated mean reversion trading strategy that identifies consolidation channels through volatility analysis and executes scalp trades when price enters entry zones near channel boundaries. Unlike breakout strategies, this system assumes price will revert to the channel mean, taking profits as price bounces back from extremes. Position sizing is fully customizable with three methods: fixed contracts, percentage of equity, or fixed dollar amount. Stop losses are placed just outside channel boundaries with take profits calculated either as fixed points or as a percentage of channel range.
## KEY DIFFERENCE FROM ORIGINAL BOCS:
**This strategy is designed for traders seeking higher trade frequency.** The original BOCS indicator trades breakouts OUTSIDE channels, waiting for price to escape consolidation before entering. This scalper version trades mean reversion INSIDE channels, entering when price reaches channel extremes and betting on a bounce back to center. The result is significantly more trading opportunities:
- **Original BOCS**: 1-3 signals per channel (only on breakout)
- **Scalper Version**: 5-15+ signals per channel (every touch of entry zones)
- **Trade Style**: Mean reversion vs trend following
- **Hold Time**: Seconds to minutes vs minutes to hours
- **Best Markets**: Ranging/choppy conditions vs trending breakouts
This makes the scalper ideal for active day traders who want continuous opportunities within consolidation zones rather than waiting for breakout confirmation. However, increased trade frequency also means higher commission costs and requires tighter risk management.
## TECHNICAL METHODOLOGY:
### Price Normalization Process:
The strategy normalizes price data to create consistent volatility measurements across different instruments and price levels. It calculates the highest high and lowest low over a user-defined lookback period (default 100 bars). Current close price is normalized using: (close - lowest_low) / (highest_high - lowest_low), producing values between 0 and 1 for standardized volatility analysis.
### Volatility Detection:
A 14-period standard deviation is applied to the normalized price series to measure price deviation from the mean. Higher standard deviation values indicate volatility expansion; lower values indicate consolidation. The strategy uses ta.highestbars() and ta.lowestbars() to identify when volatility peaks and troughs occur over the detection period (default 14 bars).
### Channel Formation Logic:
When volatility crosses from a high level to a low level (ta.crossover(upper, lower)), a consolidation phase begins. The strategy tracks the highest and lowest prices during this period, which become the channel boundaries. Minimum duration of 10+ bars is required to filter out brief volatility spikes. Channels are rendered as box objects with defined upper and lower boundaries, with colored zones indicating entry areas.
### Entry Signal Generation:
The strategy uses immediate touch-based entry logic. Entry zones are defined as a percentage from channel edges (default 20%):
- **Long Entry Zone**: Bottom 20% of channel (bottomBound + channelRange × 0.2)
- **Short Entry Zone**: Top 20% of channel (topBound - channelRange × 0.2)
Long signals trigger when candle low touches or enters the long entry zone. Short signals trigger when candle high touches or enters the short entry zone. This captures mean reversion opportunities as price reaches channel extremes.
### Cooldown Filter:
An optional cooldown period (measured in bars) prevents signal spam by enforcing minimum spacing between consecutive signals. If cooldown is set to 3 bars, no new long signal will fire until 3 bars after the previous long signal. Long and short cooldowns are tracked independently, allowing both directions to signal within the same period.
### ATR Volatility Filter:
The strategy includes a multi-timeframe ATR filter to avoid trading during low-volatility conditions. Using request.security(), it fetches ATR values from a specified timeframe (e.g., 1-minute ATR while trading on 5-minute charts). The filter compares current ATR to a user-defined minimum threshold:
- If ATR ≥ threshold: Trading enabled
- If ATR < threshold: No signals fire
This prevents entries during dead zones where mean reversion is unreliable due to insufficient price movement.
### Take Profit Calculation:
Two TP methods are available:
**Fixed Points Mode**:
- Long TP = Entry + (TP_Ticks × syminfo.mintick)
- Short TP = Entry - (TP_Ticks × syminfo.mintick)
**Channel Percentage Mode**:
- Long TP = Entry + (ChannelRange × TP_Percent)
- Short TP = Entry - (ChannelRange × TP_Percent)
Default 50% targets the channel midline, a natural mean reversion target. Larger percentages aim for opposite channel edge.
### Stop Loss Placement:
Stop losses are placed just outside the channel boundary by a user-defined tick offset:
- Long SL = ChannelBottom - (SL_Offset_Ticks × syminfo.mintick)
- Short SL = ChannelTop + (SL_Offset_Ticks × syminfo.mintick)
This logic assumes channel breaks invalidate the mean reversion thesis. If price breaks through, the range is no longer valid and position exits.
### Trade Execution Logic:
When entry conditions are met (price in zone, cooldown satisfied, ATR filter passed, no existing position):
1. Calculate entry price at zone boundary
2. Calculate TP and SL based on selected method
3. Execute strategy.entry() with calculated position size
4. Place strategy.exit() with TP limit and SL stop orders
5. Update info table with active trade details
The strategy enforces one position at a time by checking strategy.position_size == 0 before entry.
### Channel Breakout Management:
Channels are removed when price closes more than 10 ticks outside boundaries. This tolerance prevents premature channel deletion from minor breaks or wicks, allowing the mean reversion setup to persist through small boundary violations.
### Position Sizing System:
Three methods calculate position size:
**Fixed Contracts**:
- Uses exact contract quantity specified in settings
- Best for futures traders (e.g., "trade 2 NQ contracts")
**Percentage of Equity**:
- position_size = (strategy.equity × equity_pct / 100) / close
- Dynamically scales with account growth
**Cash Amount**:
- position_size = cash_amount / close
- Maintains consistent dollar exposure regardless of price
## INPUT PARAMETERS:
### Position Sizing:
- **Position Size Type**: Choose Fixed Contracts, % of Equity, or Cash Amount
- **Number of Contracts**: Fixed quantity per trade (1-1000)
- **% of Equity**: Percentage of account to allocate (1-100%)
- **Cash Amount**: Dollar value per position ($100+)
### Channel Settings:
- **Nested Channels**: Allow multiple overlapping channels vs single channel
- **Normalization Length**: Lookback for high/low calculation (1-500, default 100)
- **Box Detection Length**: Period for volatility detection (1-100, default 14)
### Scalping Settings:
- **Enable Long Scalps**: Toggle long entries on/off
- **Enable Short Scalps**: Toggle short entries on/off
- **Entry Zone % from Edge**: Size of entry zone (5-50%, default 20%)
- **SL Offset (Ticks)**: Distance beyond channel for stop (1+, default 5)
- **Cooldown Period (Bars)**: Minimum spacing between signals (0 = no cooldown)
### ATR Filter:
- **Enable ATR Filter**: Toggle volatility filter on/off
- **ATR Timeframe**: Source timeframe for ATR (1, 5, 15, 60 min, etc.)
- **ATR Length**: Smoothing period (1-100, default 14)
- **Min ATR Value**: Threshold for trade enablement (0.1+, default 10.0)
### Take Profit Settings:
- **TP Method**: Choose Fixed Points or % of Channel
- **TP Fixed (Ticks)**: Static distance in ticks (1+, default 30)
- **TP % of Channel**: Dynamic target as channel percentage (10-100%, default 50%)
### Appearance:
- **Show Entry Zones**: Toggle zone labels on channels
- **Show Info Table**: Display real-time strategy status
- **Table Position**: Corner placement (Top Left/Right, Bottom Left/Right)
- **Color Settings**: Customize long/short/TP/SL colors
## VISUAL INDICATORS:
- **Channel boxes** with semi-transparent fill showing consolidation zones
- **Colored entry zones** labeled "LONG ZONE ▲" and "SHORT ZONE ▼"
- **Entry signal arrows** below/above bars marking long/short entries
- **Active TP/SL lines** with emoji labels (⊕ Entry, 🎯 TP, 🛑 SL)
- **Info table** showing position status, channel state, last signal, entry/TP/SL prices, and ATR status
## HOW TO USE:
### For 1-3 Minute Scalping (NQ/ES):
- ATR Timeframe: "1" (1-minute)
- ATR Min Value: 10.0 (for NQ), adjust per instrument
- Entry Zone %: 20-25%
- TP Method: Fixed Points, 20-40 ticks
- SL Offset: 5-10 ticks
- Cooldown: 2-3 bars
- Position Size: 1-2 contracts
### For 5-15 Minute Day Trading:
- ATR Timeframe: "5" or match chart
- ATR Min Value: Adjust to instrument (test 8-15 for NQ)
- Entry Zone %: 20-30%
- TP Method: % of Channel, 40-60%
- SL Offset: 5-10 ticks
- Cooldown: 3-5 bars
- Position Size: Fixed contracts or 5-10% equity
### For 30-60 Minute Swing Scalping:
- ATR Timeframe: "15" or "30"
- ATR Min Value: Lower threshold for broader market
- Entry Zone %: 25-35%
- TP Method: % of Channel, 50-70%
- SL Offset: 10-15 ticks
- Cooldown: 5+ bars or disable
- Position Size: % of equity recommended
## BACKTEST CONSIDERATIONS:
- Strategy performs best in ranging, mean-reverting markets
- Strong trending markets produce more stop losses as price breaks channels
- ATR filter significantly reduces trade count but improves quality during low volatility
- Cooldown period trades signal quantity for signal quality
- Commission and slippage materially impact sub-5-minute timeframe performance
- Shorter timeframes require tighter entry zones (15-20%) to catch quick reversions
- % of Channel TP adapts better to varying channel sizes than fixed points
- Fixed contract sizing recommended for consistent risk per trade in futures
**Backtesting Parameters Used**: This strategy was developed and tested using realistic commission and slippage values to provide accurate performance expectations. Recommended settings: Commission of $1.40 per side (typical for NQ futures through discount brokers), slippage of 2 ticks to account for execution delays on fast-moving scalp entries. These values reflect real-world trading costs that active scalpers will encounter. Backtest results without proper cost simulation will significantly overstate profitability.
## COMPATIBLE MARKETS:
Works on any instrument with price data including stock indices (NQ, ES, YM, RTY), individual stocks, forex pairs (EUR/USD, GBP/USD), cryptocurrency (BTC, ETH), and commodities. Volume-based features require data feed with volume information but are optional for core functionality.
## KNOWN LIMITATIONS:
- Immediate touch entry can fire multiple times in choppy zones without adequate cooldown
- Channel deletion at 10-tick breaks may be too aggressive or lenient depending on instrument tick size
- ATR filter from lower timeframes requires higher-tier TradingView subscription (request.security limitation)
- Mean reversion logic fails in strong breakout scenarios leading to stop loss hits
- Position sizing via % of equity or cash amount calculates based on close price, may differ from actual fill price
- No partial closing capability - full position exits at TP or SL only
- Strategy does not account for gap openings or overnight holds
## RISK DISCLOSURE:
Trading involves substantial risk of loss. Past performance does not guarantee future results. This strategy is for educational purposes and backtesting only. Mean reversion strategies can experience extended drawdowns during trending markets. Stop losses may not fill at intended levels during extreme volatility or gaps. Thoroughly test on historical data and paper trade before risking real capital. Use appropriate position sizing and never risk more than you can afford to lose. Consider consulting a licensed financial advisor before making trading decisions. Automated trading systems can malfunction - monitor all live positions actively.
## ACKNOWLEDGMENT & CREDITS:
This strategy is built upon the channel detection methodology created by **AlgoAlpha** in the "Smart Money Breakout Channels" indicator. Full credit and appreciation to AlgoAlpha for pioneering the normalized volatility approach to identifying consolidation patterns. The core channel formation logic using normalized price standard deviation is AlgoAlpha's original contribution to the TradingView community.
Enhancements to the original concept include: mean reversion entry logic (vs breakout), immediate touch-based signals, multi-timeframe ATR volatility filtering, flexible position sizing (fixed/percentage/cash), cooldown period filtering, dual TP methods (fixed points vs channel percentage), automated strategy execution with exit management, and real-time position monitoring table.
스크립트에서 "btc期权交割时间"에 대해 찾기

DeMarkerWhat the DeMarker Indicator Is:
It’s a trend exhaustion and timing tool, not a trend-following one. The indicator looks for points where an uptrend or downtrend is likely to reverse because the market is “overextended.”
TD Setup:
1) A setup is formed when you get 9 consecutive candles where:
2) In an uptrend setup: each close is higher than the close 4 candles earlier.
3) In a downtrend setup: each close is lower than the close 4 candles earlier.
4) When the 9th candle prints, it signals potential trend exhaustion - not an immediate reversal, but a warning.
👉 Example: If BTC closes higher than the close 4 bars ago for 9 bars straight -> that’s a bullish setup.

Volume Aggregated (Lite)Volume Aggregated (Lite) is a lightweight yet powerful tool designed to provide traders with a consolidated view of trading volume across major perpetual futures markets. Instead of relying solely on the volume of a single exchange, this indicator aggregates and normalizes data from multiple venues, giving a broader and more representative measure of market activity.
Supported Exchanges:
Binance (USDT.P & USDC.P)
Bybit (USDT.P & USD.P)
OKX (USDT.P & USD.P)
Bitget (USDT.P & USD.P)
Coinbase (USDC.P)
Users can toggle each exchange individually, allowing flexible customization depending on which markets they consider most relevant.
Denomination Options:
COINS: Volume expressed in the base currency (e.g., BTC, ETH).
USD: Volume normalized to USD values by multiplying with price.
Why it’s useful:
Volume is a critical component of technical analysis, reflecting market participation and conviction behind price moves. However, relying on a single exchange can create blind spots, especially in crypto where liquidity is fragmented. By combining data from multiple large exchanges, this indicator offers:
A more comprehensive measure of market interest.
A normalized comparison between exchanges with different quote currencies (e.g., USDT, USD, USDC).
A volume stream that can be used as a custom source for other indicators, strategies, or overlays within TradingView.
Practical Applications:
Trend Confirmation: Check if aggregated volume supports price direction.
Breakout Validation: Identify whether breakouts are backed by broad participation across venues.
Divergence Detection: Spot situations where price moves without sufficient cross-exchange volume.
Custom Indicator Input: Since it outputs a clean series, it can be plugged into moving averages, oscillators, or custom-built scripts.
Technical Details:
The script uses request.security() to pull volume data across exchanges and normalizes values when required (e.g., USD-quoted pairs divided by the instrument’s price). It then aggregates all valid inputs into a single stream. The result is displayed as color-coded columns (green for bullish candles, red for bearish), making it easy to interpret at a glance.
This “Lite” version keeps the focus on core functionality: aggregation, normalization, and straightforward visualization—avoiding unnecessary complexity while remaining highly adaptable for custom analysis.

Short Monday , Long TuesdayKillaxbt create this concept. Often BTC create this pattern:
Monday Short ✔️
Tuesday Long ✔️
Wednesday... Lets give it a test during Asia. Just remember who shared this first. 😉
Thursday is pivot. Depending on the narrative leading into thursday... we determine direction. ⚡️
This concept is graphic, he show where you are and where we can go. He give you a plan for the week
Concept : @killaxbt
Code by @paulbri

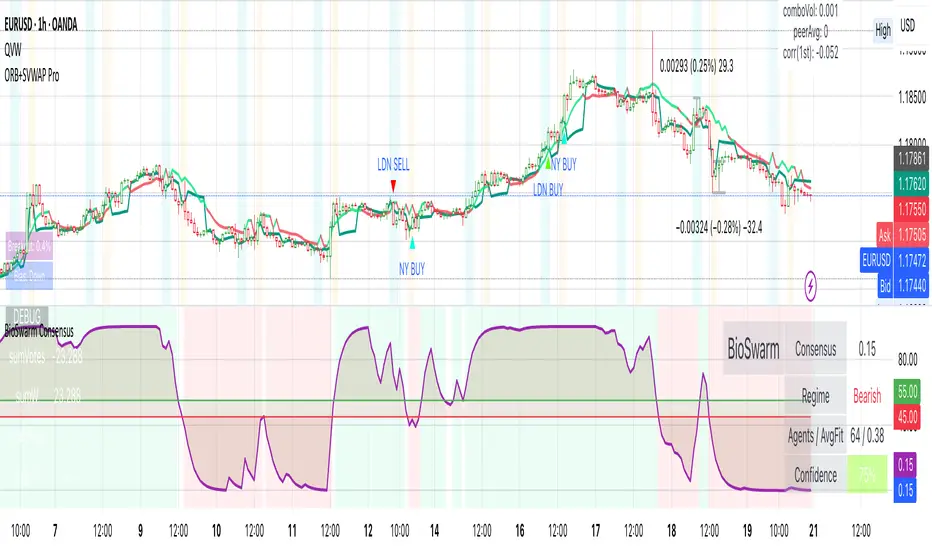
BioSwarm Imprinter™BioSwarm Imprinter™ — Agent-Based Consensus for Traders
What it is
BioSwarm Imprinter™ is a non-repainting, agent-based sentiment oscillator. It fuses many short-to-medium lookback “opinions” into one 0–100 consensus line that is easy to read at a glance (50 = neutral, >55 bullish bias, <45 bearish bias). The engine borrows from swarm intelligence: many simple voters (agents) adapt their influence over time based on how well they’ve been predicting price, so the crowd gets smarter as conditions change.
Use it to:
• Detect emerging trends sooner without overreacting to noise.
• Filter mean-reversion vs continuation opportunities.
• Gate entries with a confidence score that reflects both strength and persistence of the move.
• Combine with your execution tools (VWAP/ORB/levels) as a state filter rather than a trade signal by itself.
⸻
Why it’s different
• Swarm learning: Each agent improves or decays its “fitness” depending on whether its vote matched the next bar’s direction. High-fitness agents matter more; weak agents fade.
• Multi-horizon by design: The crowd is composed of fixed, simple lookbacks spread from lenMin to lenMax. You get a blended, robust view instead of a single fragile parameter.
• Two complementary lenses: Each agent evaluates RSI-style balance (via Wilder’s RMA) and momentum (EMA deviation). You decide the weight of each.
• No repaint, no MTF pitfalls: Everything runs on the chart’s timeframe with bar-close confirmation; no request.security() or forward references.
• Actionable UI: A clean consensus line, optional regime background, confidence heat, and triangle markers when thresholds are crossed.
⸻
What you see on the chart
• Consensus line (0–100): Smoothed to your preference; color/area makes bull/bear zones obvious.
• Regime coloring (optional): Light green in bull zone, light red in bear zone; neutral otherwise.
• Confidence heat: A small gauge/number (0–100) that combines distance from neutral and recent persistence.
• Markers (optional): Triangles when consensus crosses up through your bull threshold (e.g., 55) or down through your bear threshold (e.g., 45).
• Info panel (optional): Consensus value, regime, confidence, number of agents, and basic diagnostics.
⸻
How it works (under the hood)
1. Horizon bins: The range is divided into numBins. Each bin has a fixed, simple integer length (crucial for Pine’s safety rules).
2. Per-bin features (computed every bar):
• RSI-style balance using Wilder’s RMA (not ta.rsi()), then mapped to −1…+1.
• Momentum as (close − EMA(L)) / EMA(L) (dimensionless drift).
3. Agent vote: For its assigned bin, an agent forms a weighted score: score = wRSI*RSI_like + wMOM*Momentum. A small dead-band near zero suppresses chop; votes are +1/−1/0.
4. Fitness update (bar close): If the agent’s previous vote agreed with the next bar’s direction, multiply its fitness by learnGain; otherwise by learnPain. Fitness is clamped so it never explodes or dies.
5. Consensus: Weighted average of all votes using fitness as weights → map to 0–100 and smooth with EMA.
Why it doesn’t repaint:
• No future references, no MTF resampling, fitness updates only on confirmed bars.
• All TA primitives (RMA/EMA/deltas) are computed every bar unconditionally.
⸻
Signals & confidence
• Bullish bias: consensus ≥ bullThr (e.g., 55).
• Bearish bias: consensus ≤ bearThr (e.g., 45).
• Confidence (0–100):
• Distance score: how far consensus is from 50.
• Momentum score: how strong the recent change is versus its recent average.
• Combined into a single gate; start filtering entries at ≥60 for higher quality.
Tip: For range sessions, raise thresholds (60/40) and increase smoothing; for momentum sessions, lower smoothing and keep thresholds at 55/45.
⸻
Inputs you’ll actually tune
• Agents & horizons:
• N_agents (e.g., 64–128)
• lenMin / lenMax (e.g., 6–30 intraday, 10–60 swing)
• numBins (e.g., 12–24)
• Weights & smoothing:
• wRSI vs wMOM (e.g., 0.7/0.3 for FX & indices; 0.6/0.4 for crypto)
• deadBand (0.03–0.08)
• consSmooth (3–8)
• Thresholds & hygiene:
• bullThr/bearThr (55/45 default)
• cooldownBars to avoid signal spam
⸻
Playbooks (ready-to-use)
1) Breakout / Trend continuation
• Timeframe: 15m–1h for day/swing.
• Filter: Take longs only when consensus > 55 and confidence ≥ 60.
• Execution: Use your ORB/VWAP/pullback trigger for entry. Trail with swing lows or 1.5×ATR. Exit on a close back under 50 or when a bearish signal prints.
2) Mean reversion (fade)
• When: Sideways days or low-volatility clusters.
• Setup: Increase deadBand and consSmooth.
• Signal: Bearish fades when consensus rolls over below ≈55 but stays above 50; bullish fades when it rolls up above ≈45 but stays below 50.
• Targets: The neutral zone (~50) as the first take-profit.
3) Multi-TF alignment
• Keep BioSwarm on 1H for bias, execute on 5–15m:
• Only take entries in the direction of the 1H consensus.
• Skip counter-bias scalps unless confidence is very low (explicit mean-reversion plan).
⸻
Integrations that work
• DynamoSent Pro+ (macro bias): Only act when macro bias and swarm consensus agree.
• ORB + Session VWAP Pro: Trade London/NY ORB breakouts that retest while consensus >55 (long) or <45 (short).
• Levels/Orderflow: BioSwarm is your “go / no-go”; execution stays with your usual triggers.
⸻
Quick start
1. Drop the indicator on a 1H chart.
2. Start with: N_agents=64, lenMin=6, lenMax=30, numBins=16, deadBand=0.06, consSmooth=5, thresholds 55/45.
3. Trade only when confidence ≥ 60.
4. Add your favorite execution tool (VWAP/levels/OR) for entries & exits.
⸻
Non-repainting & safety notes
• No request.security(); no hidden lookahead.
• Bar-close confirmation for fitness and signals.
• All TA calls are unconditional (no “sometimes called” warnings).
• No series-length inputs to RSI/EMA — we use RMA/EMA formulas that accept fixed simple ints per bin.
⸻
Known limits & tips
• Too many signals? Raise deadBand, increase consSmooth, widen thresholds to 60/40.
• Too few signals? Lower deadBand, reduce consSmooth, narrow thresholds to 53/47.
• Over-fitting risk: Keep learnGain/learnPain modest (e.g., ×1.04 / ×0.96).
• Compute load: Large N_agents × numBins is heavier; scale to your device.
⸻
Example recipes
EURUSD 1H (swing):
lenMin=8, lenMax=34, numBins=16, wRSI=0.7, wMOM=0.3, deadBand=0.06, consSmooth=6, thr=55/45
Buy breakouts when consensus >55 and confidence ≥60; confirm with 5–15m pullback to VWAP or level.
SPY 15m (US session):
lenMin=6, lenMax=24, numBins=12, consSmooth=4, deadBand=0.05
On trend days, stay with longs as long as consensus >55; add on shallow pullbacks.
BTC 1H (24/7):
Increase momentum weight: wRSI=0.6, wMOM=0.4, extend lenMax to ~50. Use dynamic stops (ATR) and partials on strong verticals.
⸻
Final word
BioSwarm is a state engine: it tells you when the market is primed to continue or mean-revert. Pair it with your entries and risk framework to turn that state into trades. If you’d like, I can supply a companion strategy template that consumes the consensus and back-tests the three playbooks (Breakout/Fade/Flip) with standard risk management.
Weekend Hunter Ultimate v6.2 Weekend Hunter Ultimate v6.2 - Automated Crypto Weekend Trading System
OVERVIEW:
Specialized trading strategy designed for cryptocurrency weekend markets (Saturday-Sunday) when institutional traders are typically offline and market dynamics differ significantly from weekdays. Optimized for 15-minute timeframe execution with multi-timeframe confluence analysis.
KEY FEATURES:
- Weekend-Only Trading: Automatically activates during configurable weekend hours
- Dynamic Leverage: 5-20x leverage adjusted based on market safety and signal confidence
- Multi-Timeframe Analysis: Combines 4H trend, 1H momentum, and 15M execution
- 10 Pre-configured Crypto Pairs: BTC, ETH, LINK, XRP, DOGE, SOL, AVAX, PEPE, TON, POL
- Position & Risk Management: Max 4 concurrent positions, -30% account protection
- Smart Trailing Stops: Protects profits when approaching targets
RISK MANAGEMENT:
- Maximum daily loss: 5% (configurable)
- Maximum weekend loss: 15% (configurable)
- Per-position risk: Capped at 120-156 USDT
- Emergency stops for flash crashes (8% moves)
- Consecutive loss protection (4 losses = pause)
TECHNICAL INDICATORS:
- CVD (Cumulative Volume Delta) divergence detection
- ATR-based dynamic stop loss and take profit
- RSI, MACD, Bollinger Bands confluence
- Volume surge confirmation (1.5x average)
- Weekend liquidity adjustments
INTEGRATION:
- Designed for Bybit Futures (0.075% taker fee)
- WunderTrading webhook compatibility via JSON alerts
- Minimum position size: 120 USDT (Bybit requirement)
- Initial capital: $500 recommended
TARGET METRICS:
- Win rate target: 65%
- Average win: 5.5%
- Average loss: 1.8%
- Risk-reward ratio: ~3:1
IMPORTANT DISCLAIMERS:
- Past performance does not guarantee future results
- Leveraged trading carries substantial risk of loss
- Weekend crypto markets have 13% of normal liquidity
- Not suitable for traders who cannot afford to lose their entire investment
- Requires continuous monitoring and adjustment
USAGE:
1. Apply to 15-minute charts only
2. Configure weekend hours for your timezone
3. Set up webhook alerts for automation
4. Monitor performance table in top-right corner
5. Adjust parameters based on your risk tolerance
This is an experimental strategy for educational purposes. Always test with small amounts first and never invest more than you can afford to lose completely.

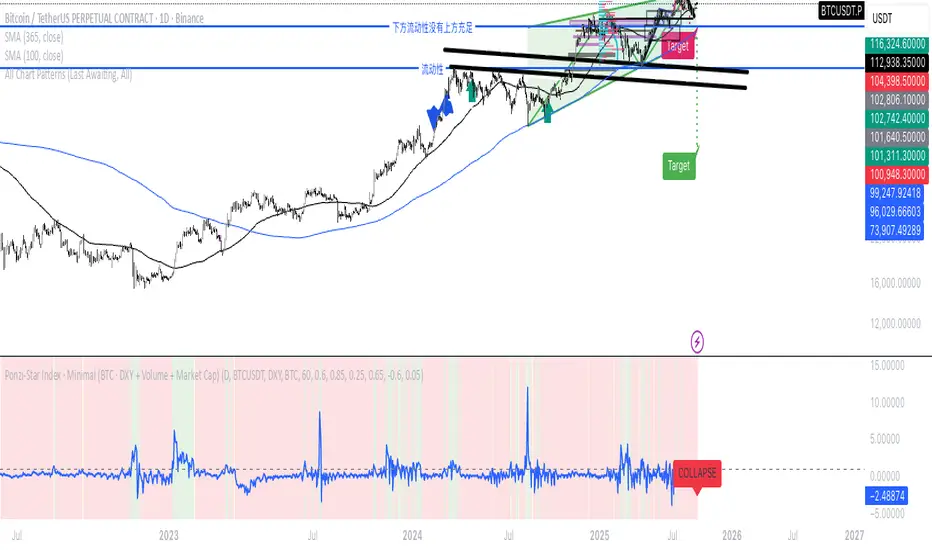
Ponzi-Star Index · Minimal (BTC · DXY + Volume + Market Cap)If we think of the U.S. Dollar Index as the speed of light,
market cap as the mass of a star,
and trading volume as the energy of cataclysmic change—
then can we imagine the market as a star:
entering during its expansion phase,
and exiting before its collapse?
cd_indiCATor_CxGeneral:
This indicator is the redesigned, simplified, and feature-enhanced version of the previously shared indicators:
cd_cisd_market_Cx, cd_HTF_Bias_Cx, cd_sweep&cisd_Cx, cd_SMT_Sweep_CISD_Cx, and cd_RSI_divergence_Cx.
Within the holistic setup, the indicator tracks:
• HTF bias
• Market structure (trend) in the current timeframe
• Divergence between selected pairs (SMT)
• Divergence between price and RSI values
• Whether the price is in an important area (FVG, iFVG, and Volume Imbalance)
• Whether the price is at a key level
• Whether the price is within a user-defined special timeframe
The main condition and trigger of the setup is an HTF sweep with CISD confirmation on the aligned timeframe.
When the main condition occurs, the indicator provides the user with a real-time market status summary, enriched with other data.
________________________________________
What’s new?
-In the SMT module:
• Triad SMT analysis (e.g.: NQ1!, ES1!, and YM1!)
• Dyad SMT analysis (e.g.: EURUSD, GBPUSD)
• Alternative pair definition and divergence analysis for non-correlated assets
o For crypto assets (xxxUSDT <--> xxxUSDT.P) (e.g.: SOLUSDT.P, SOLUSDT)
o For stocks, divergence analysis by comparing the asset with its value in another currency
(BIST:xxx <--> BIST:xxx / EURTRY), (BAT:xxx <--> BAT:xxx / EURUSD)
-Special timeframe definition
-Configurable multi-option alarm center
-Alternative summary presentation (check list / status table / stickers)
________________________________________
Details and usage:
The user needs to configure four main sections:
• Pair and correlated pairs
• Timeframes (Auto / Manual)
• Alarm center
• Visual arrangement and selections
Pair Selections:
The user should adjust trading pairs according to their trade preferences.
Examples:
• Triad: NQ1!-ES1!-YM1!, BTC-ETH-Total3
• Dyad: NAS100-US500, XAUUSD-XAGUSD, XRPUSDT-XLMUSDT
Single pairs:
-Crypto Assets:
If crypto assets are not in the triad or dyad list, they are automatically matched as:
Perpetual <--> Spot (e.g.: DOGEUSDT.P <--> DOGEUSDT)
If the asset is already defined in a dyad list (e.g., DOGE – SHIB), the dyad definition takes priority.
________________________________________
-Stocks:
If stocks are defined in the dyad list (e.g.: BIST:THYAO <--> BIST:PGSUS), the dyad definition takes priority.
If not defined, the stock is compared with its value in the selected currency.
For example, in the Turkish Stock Exchange:
BIST:FENER stock, if EUR is chosen from the menu, is compared as BIST:FENER / OANDA:EURTRY.
Here, “OANDA” and the stock market currency (TRY) are automatically applied for the exchange rate.
For NYSE:XOM, its pair will be NYSE:XOM / EURUSD.
________________________________________
Timeframes:
By default, the menu is set to “Auto.” In this mode, aligned timeframes are automatically selected.
Aligned timeframes (LTF-HTF):
1m-15m, 3m-30m, 5m-1h, 15m-4h, 1h-D, 4h-W, D-M
Example: if monitoring the chart on 5m:
• 1h sweep + 5m CISD confirmation
• D sweep + 1h CISD confirmation (bias)
• 5m market structure
• 1h SMT and 1h RSI divergence analysis
For manual selections, the user must define the timeframes for Sweep and HTF bias.
FVG, iFVG, and Volume Imbalance timeframes must be manually set in both modes.
________________________________________
Alarm Center:
The user can choose according to preferred criteria.
Each row has options.
“Yes” → included in alarm condition.
“No” → not included in alarm condition.
If special timeframe criteria are added to the alarm, the hour range must also be entered in the same row, and the “Special Zone” tab (default: -4) should be checked.
Key level timeframes and plot options must be set manually.
Example alarm setup:
Alongside the main Sweep + CISD condition, if we also want HTF bias + Trend alignment + key level (W, D) and special timeframe (09:00–11:00), we should set up the menu as follows:
________________________________________
Visual Arrangement and Selections:
Users can control visibility with checkboxes according to their preferences.
In the Table & Sticker tab, table options and labels can be controlled.
• Summary Table has two options: Check list and Status Table
• From the HTF bias section, real-time bias and HTF sweep zone (optional) are displayed
• The RSI divergence section only shows divergence analysis results
• The SMT 2 sub-section only functions when triad is selected
Labels are shown on the bar where the sweep + CISD condition occurs, displaying the current situation.
With the Check box option, all criteria’s real-time status is shown (True/False).
Status Table provides a real-time summary table.
Although the menu may look crowded, most settings only need to be adjusted once during initial use.
________________________________________
What’s next?
• Suggestions from users
• Standard deviation projection
• Mitigation/order blocks (cd special mtg)
• PSP /TPD
________________________________________
Final note:
Every additional criterion in the alarm settings will affect alarm frequency.
Multiple conditions occurring at the same time is not, by itself, sufficient to enter a trade—you should always apply your own judgment.
Looking forward to your feedback and suggestions.
Happy trading! 🎉

Hilly's Reversal Scalping Strategy - 5 Min CandlesHow to Use
Copy the Code: Copy the script above.
Paste in TradingView: Open TradingView, go to the Pine Editor (bottom of the chart), paste the code, and click “Add to Chart.”
Set Timeframe: Ensure the chart is set to 5-minute candles (TradingView: right-click chart > Timeframe > 5 Minutes).
Check for Errors: Verify no errors appear in the Pine Editor console.
Apply to Chart: Use a liquid crypto pair (e.g., BTC/USDT, ETH/USDT on Binance or Coinbase).
Verify Signals:
Green “BUY” labels and triangle-up arrows for bullish reversals (e.g., bullish engulfing, hammer, doji, morning star, three white soldiers, double bottom in a downtrend).
Red “SELL” labels and triangle-down arrows for bearish reversals (e.g., bearish engulfing, shooting star, doji, evening star, three black crows, double top in an uptrend).
Green/red background highlights for signal candles.
Backtest: Use TradingView’s Strategy Tester to evaluate performance over 1–3 months, checking Net Profit, Win Rate, and Drawdown.
Demo Test: Run on a demo account to confirm signal visibility and performance before trading with real funds.
Troubleshooting
If Errors Occur: If any errors appear in TradingView’s Pine Editor console (e.g., “Syntax error” or “Invalid argument”), please share the exact error messages to diagnose environment-specific issues.
Signal Overload: If too many signals appear, increase patternLookback to 15 or set volFilter = volume > volMa * 2.0.
Missed Signals: If signals are too rare, set useVolumeFilter=false or reduce patternLookback to 5.
Additional Features: If you need alerts, other indicators (e.g., EMA, RSI), or dynamic arrow sizing, please specify. Note that dynamic sizing caused errors previously, so I’ve kept size=size.normal.

Hilly 3.0 Advanced Crypto Scalping Strategy - 1 & 5 Min ChartsHow to Use
Copy the Code: Copy the script above.
Paste in TradingView: Open TradingView, go to the Pine Editor (bottom of the chart), paste the code, and click “Add to Chart.”
Check for Errors: Verify no errors appear in the Pine Editor console. The script uses Pine Script v5 (@version=5).
Select Timeframe:
1-Minute Chart: Use defaults (emaFastLen=7, emaSlowLen=14, rsiLen=10, rsiOverbought=80, rsiOversold=20, slPerc=0.5, tpPerc=1.0, useCandlePatterns=false, patternLookback=10).
5-Minute Chart: Adjust to emaFastLen=9, emaSlowLen=21, rsiLen=14, rsiOverbought=75, rsiOversold=25, slPerc=0.8, tpPerc=1.5, useCandlePatterns=true, patternLookback=10.
Apply to Chart: Use a liquid crypto pair (e.g., BTC/USDT, ETH/USDT on Binance or Coinbase).
Verify Signals:
Green “BUY” or “EMA BUY” labels and triangle-up arrows below candles for bullish signals (EMA crossovers, bullish engulfing, hammer, doji, morning star, three white soldiers, double bottom).
Red “SELL” or “EMA SELL” labels and triangle-down arrows above candles for bearish signals (EMA crossovers, bearish engulfing, shooting star, doji, evening star, three black crows, double top).
Green/red background highlights for signal candles.
Backtest: Use TradingView’s Strategy Tester to evaluate performance over 1–3 months, checking Net Profit, Win Rate, and Drawdown.
Demo Test: Run on a demo account to confirm signal visibility and performance before trading with real funds.

Key Levels: Daily, Weekly, Monthly [BackQuant]Key Levels: Daily, Weekly, Monthly
Map the market’s “memory” in one glance—yesterday’s range, this week’s chosen day high/low, and D/W/M opens—then auto-clean levels once they break.
What it does
This tool plots three families of high-signal reference lines and keeps them tidy as price evolves:
Chosen Day High/Low (per week) — Pick a weekday (e.g., Monday). For each past week, the script records that day’s session high and low and projects them forward for a configurable number of bars. These act like “memory levels” that price often revisits.
Daily / Weekly / Monthly Opens — Plots the opening price of each new day, week, and month with separate styling. These opens frequently behave like magnets/flip lines intraday and anchors for regime on higher timeframes.
Auto-pruning — When price breaks a stored level, the script can automatically remove it to reduce clutter and refocus you on still-active lines. See: (broken levels removed).
Why these levels matter
Liquidity pockets — Prior day’s high/low and the daily open concentrate stops and pending orders. Mapping them quickly reveals likely sweep or fade zones. Example: previous day highs + daily open highlighting liquidity:
Context & regime — Monthly opens frame macro bias; trading above a rising cluster of monthly opens vs. below gives a clean top-down read. Example: monthly-only “macro outlook” view:
Cleaner charts — Auto-remove broken lines so you focus on what still matters right now.
What it plots (at a glance)
Past Chosen Day High/Low for up to N prior weeks (your choice), extended right.
Current Daily Open , Weekly Open , and Monthly Open , each with its own color, label, and forward extension.
Optional short labels (e.g., “Mon High”) or full labels (with week/month info).
How breaks are detected & cleaned
You control both the evidence and the timing of a “break”:
Break uses — Choose Close (more conservative) or Wick (more sensitive).
Inclusive? — If enabled, equality counts (≥ high or ≤ low). If disabled, you need a strict cross.
Allow intraday breaks? — If on, a level can break during the tracked day; if off, the script only counts breaks after the session completes.
Remove Broken Levels — When a break is confirmed, the line/label is deleted automatically. (See the demo: )
Quick start
Pick a Day of Week to Track (e.g., Monday).
Set how many weeks back to show (e.g., 8–10).
Choose how far to extend each family (bars to the right for chosen-day H/L and D/W/M opens).
Decide if a break uses Close or Wick , and whether equality counts.
Toggle Remove Broken Levels to keep the chart clean automatically.
Tips by use-case
Intraday bias — Watch the Daily Open as a magnet/flip. If price gaps above and holds, pullbacks to the daily open often decide direction. Pair with last day’s high/low for sweep→reversal or true breakout cues. See:
Weekly structure — Track the week’s chosen day (e.g., Monday) high/low across prior weeks. If price stalls near a cluster of old “Monday Highs,” look for sweep/reject patterns or continuation on reclaim.
Macro regime — Hide daily/weekly lines and keep only Monthly Opens to read bigger cycles at a glance (BTC/crypto especially). Example:
Customization
Use wicks or bodies for highs/lows (wicks capture extremes; bodies are stricter).
Line style & thickness — solid/dashed/dotted, width 1–5, plus global transparency.
Labels — Abbreviated (“Mon High”, “D Open”) or full (month/week/day info).
Color scheme — Separate colors for highs, lows, and each of D/W/M opens.
Capacity controls — Set how many daily/weekly/monthly opens and how many weeks of chosen-day H/L to keep visible.
What’s under the hood
On your selected weekday, the script records that session’s true high and true low (using wicks or body-based extremes—your choice), then projects a horizontal line forward for the next bars.
At each new day/week/month , it records the opening price and projects that line forward as well.
Each bar, the script checks your “break” rules; once broken, lines/labels are removed if auto-cleaning is on.
Everything updates in real time; past levels don’t repaint after the session finishes.
Recommended presets
Day trading — Weeks back: 6–10; extend D/W opens: 50–100 bars; Break uses: Close ; Inclusive: off; Auto-remove: on.
Swing — Fewer daily opens, more weekly opens (2–6), and 8–12 weeks of chosen-day H/L.
Macro — Show only Monthly Opens (1–6 months), dashed style, thicker lines for clarity.
Reading the examples
Broken lines disappear — decluttering in action:
Macro outlook — monthly opens as cycle rails:
Liquidity map — previous day highs + daily open:
Final note
These are not “signals”—they’re reference points that many participants watch. By standardising how you draw them and automatically clearing the ones that no longer matter, you turn a noisy chart into a focused map: where liquidity likely sits, where price memory lives, and which lines are still in play.

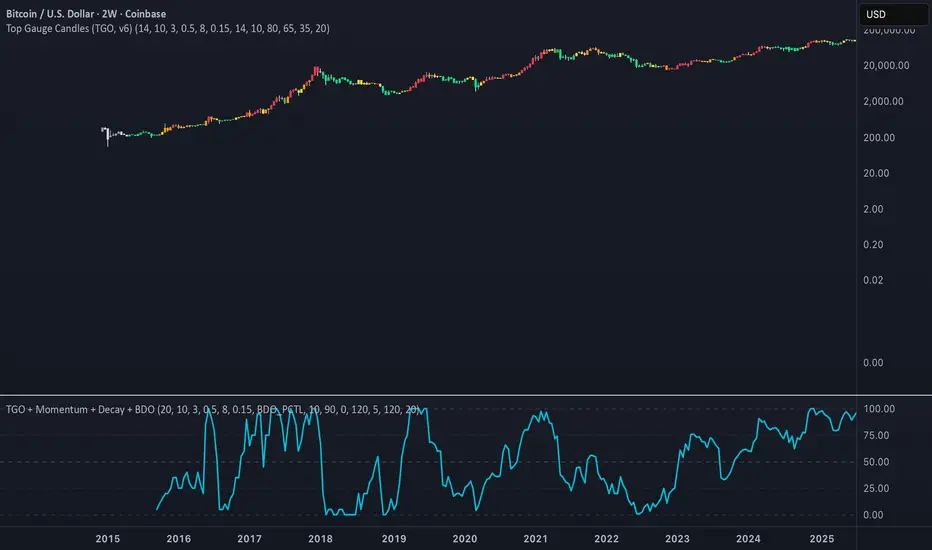
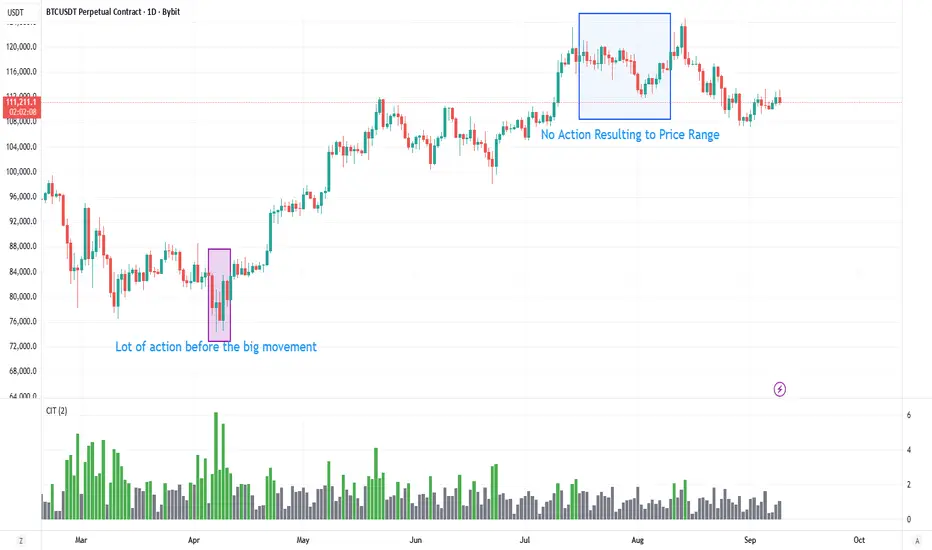
Contract Interest Turnover T3 [T69]Overview
--------
Contract Interest Turnover (CIT) estimates how “churny” a crypto derivatives market is by comparing the amount traded in a bar to the base stock of outstanding contracts (open interest). It normalizes both Volume and Open Interest (OI) by Price (Close), then plots a Turnover Rate = (Volume/Close) ÷ (OI/Close) as colored columns. Higher values = faster contract recycling (strong momentum / hype potential).
Features
--------
- Auto-fetch OI: Pulls OI via request.security(_OI, …) when the exchange/symbol exposes an OI stream on TradingView.
- Price-normalized comparison: Converts both Volume and OI into comparable notional terms by dividing each by Close.
- Turnover columns with threshold: Color the columns green once Turnover ≥ your set threshold; gray otherwise.
- Status-line readouts: Displays normalized Volume and OI values for quick sanity checks.
- Crypto-aware timeframe: Uses chart TF for crypto; forces daily OI when not crypto to avoid noisy intraday pulls.
How to Use
----------
1. Add the script on a perpetual/futures symbol that has OI on TradingView (e.g., BTC perps where an _OI feed exists).
2. Watch the Turnover Rate bars: spikes above your threshold flag sessions where contracts are actively flipping.
3. Interpret spikes as a signal of movement or activity — it does not specify price direction, only that the market is engaged and contracts are being traded more intensely than usual.
Configuration
-------------
- Interest Turnover Threshold (default 1.0): colors columns green when Turnover ≥ threshold. Tune per market’s typical churn profile.
Under the Hood (Formulas & Logic)
---------------------------------
- Fetch OI
oiClose ← request.security(ticker.standard(syminfo.tickerid) + "_OI", timeframe, close) with ignore_invalid_symbol = true.
If none is found, the script throws a clear runtime error.
- Normalize to price
vol_norm = volume / close
oi_norm = oiClose / close
This converts both to a common notional basis so their ratio is meaningful even as price changes.
- Turnover Rate
turnover = vol_norm / oi_norm
Interpretation: fraction/multiples of the outstanding contract base traded in the bar. Color = green if turnover ≥ threshold.
Why Open Interest ≈ “Float” Proxy
---------------------------------
In stocks, float ≈ shares the public can trade. In derivatives, there are no “shares,” so Open Interest acts as the live stock of active contracts. It’s the best proxy for “what’s available in play” because it counts open positions that persist across bars. Using Volume ÷ OI mirrors stock float-turnover logic: how fast the tradable base is being recycled each period.
Why Normalize by Price
----------------------
Derivatives volume and OI may be reported in contracts, not notional value. One contract’s economic weight changes with price (especially on inverse contracts). Dividing both Volume and OI by Close:
- Puts them on a comparable notional footing.
- Prevents false spikes purely from price moves.
- Makes Turnover comparable across time even as price trends.
Advanced Tips
-------------
- Calibrate threshold: Start from the 80th–90th percentile of the last 60–90 bars of Turnover; set the threshold a touch below that to surface early heat.
- Add OI-delta: Layer an OI change histogram (current − prior) to separate new positioning from pure churn.
- Linear vs inverse: For linear (USDT-margined) contracts, the normalization still works and keeps visuals consistent; for inverse, it’s essential.
Limitations
-----------
- Data availability: Works only if your symbol exposes an _OI feed on TradingView; otherwise it errors out.
- Exchange conventions: Volume units differ by venue (contracts, coin, notional). Normalization mitigates, but cross-symbol comparisons still need caution.
- Intrabar gaps: OI is typically end-of-bar; rapid intrabar shifts won’t appear until the bar closes.
Notes
-----
- Designed primarily for crypto derivatives. For non-crypto, the script blanks OI to avoid misleading plots and uses a daily TF when needed.
Credit
------
- Concept & data: Built for TradingView data feeds.
- Acknowledgment: Credit to TradingView default indicator as requested.
- Source: This write-up reflects the logic present in your uploaded script.
Disclaimer
----------
Markets move; indicators simplify. Use with position sizing, hard stops, and catalyst awareness. The Turnover Rate flags activity, not direction.
Confluence Engine Confluence Engine is a practical, non-repainting decision aid that scores market conditions from −100…+100 by combining six proven modules: Trend, Momentum, Volatility, Volume, Structure, and an HTF confirmation. It’s designed for crypto, forex, indices, and stocks, and it fires entries only on confirmed bar closes.
What’s inside
Trend: EMA 20/50/200 alignment plus a Supertrend/KAMA toggle (you choose the baseline).
Momentum: RSI + MACD with confirmed-pivot divergence detection.
Volatility: ATR% and Bollinger Band width vs its average to favor expansion over chop.
Volume: OBV-style cumulative flow slope + volume surge vs SMA×multiplier.
Market Structure: Confirmed pivots, BOS (break of structure) and CHOCH (change of character).
HTF Filter: Closed higher-timeframe context via request.security(..., barmerge.gaps_on, barmerge.lookahead_off).
Why it does not repaint
Signals are computed and plotted on closed bars only.
Pivots/divergences use confirmed pivot points (no forward look).
HTF series are fetched with lookahead_off and use the last closed HTF bar in realtime.
No future bar references are used for entries or alerts.
How to use (3 steps)
Pick a timeframe pair: use a 4–6× HTF multiplier (5m→30m, 15m→1h, 1h→4h, 4h→1D, 1D→1W).
Trade with the HTF: take longs only when the HTF filter is bullish; shorts only when bearish.
Prefer expansion: act when BB width > its average and ATR% is elevated; skip most signals in compression.
Suggested presets (start here)
Crypto (BTC/ETH): 15m→1h, 1h→4h. stLen=10, stMult=3.0, bbLen=20, surgeMul=1.8–2.2, thresholds +40 / −40 (intraday can try +35 / −35).
Forex majors: 15m→1h, 1h→4h. stLen=10–14, stMult=2.5–3.0, surgeMul=1.5–1.8, thresholds +35 / −35 (swing: +45 / −45).
US equities (liquid): 5m→30m/1h, 15m→1h/2h. stMult=3.0–3.5, surgeMul=1.6–2.0, thresholds +45 / −45 to reduce chop.
Indices (ES/NQ): 5m→30m, 15m→1h. Defaults are fine; start at +40 / −40.
Gold/Oil: 15m→1h, 1h→4h. Thresholds +35 / −35, surgeMul=1.6–1.9.
Inputs (plain English)
Use Supertrend (off = KAMA): choose the trend baseline.
EMA Fast/Mid/Slow: 20/50/200 by default for classic stack.
RSI/MACD + divergence pivots: momentum and exhaustion context.
ATR Length & BB Length: volatility regime detection.
Volume SMA & Surge Multiplier: defines “meaningful” volume spikes.
Pivot left/right & “Confirm BOS/CHOCH on Close”: structure strictness.
Enable HTF & Higher Timeframe: confirms the lower timeframe direction.
Thresholds (+long / −short): when the score crosses these, you get signals.
Signals & alerts (IDs preserved)
Entry shapes plot at bar close when the score crosses thresholds.
Alerts you can enable:
CONFLUENCE LONG — long entry signal
CONFLUENCE SHORT — short entry signal
BULLISH BIAS — score turned positive
BEARISH BIAS — score turned negative
Best practices
Focus on signals with HTF agreement and volatility expansion; require volume participation (surge or rising OBV slope) for higher quality.
Raise thresholds (+45/−45 or +50/−50) to reduce whipsaws in choppy sessions.
Lower thresholds (+35/−35) only if you also require volatility/volume filters.
Performance & scope
Works across crypto/FX/equities/indices; no broker data or special feeds required.
No repainting by design; signals/alerts are computed on closed bars.
As with any tool, results vary by regime; always combine with risk management.
Disclosure
This script is for educational purposes only and is not financial advice. Trading involves risk. Test on historical data and paper trade before using live.

Crypto OI AgregatedCrypto OI Aggregated — Open Interest Aggregator for Crypto Exchanges
General Description
The indicator is designed for comprehensive analysis of Open Interest (OI) across major cryptocurrency exchanges. It consolidates data from multiple platforms, visualizes it as candlestick charts or deltas, and builds tables with breakdowns by exchange and contract type. This allows traders to quickly understand where market interest is concentrated and how the market structure is shifting.
Unlike standard tools that only show data from a single exchange, this indicator provides a full market overview and makes it easy to compare dynamics across different platforms.
⸻
Key Features
• Aggregation of OI data from exchanges: Binance, Bybit, OKX, Bitget, Kraken, HTX, Deribit (feel free to leave a comment if you’d like me to add other exchanges that provide open interest data)
• Support for contract types: USDT.P, USD.P, USDC.P, USD.PM
• Automatic normalization of various OI data formats from different providers
• Display modes:
• OI candlestick chart (total aggregated OI)
• OI Delta (change in OI per bar)
• Full table with detailed data by exchange and contract type
• Short summary table with totals in USD and base assets
• Support for USD or COIN denomination
• Convenient formatting for large numbers
• Customizable colors
⸻
How to Use the Indicator
1. Select Exchanges
In the settings, enable or disable specific exchanges. It is recommended to activate only the ones you need for analysis — this will make the indicator faster.
2. Choose Data Type
• OI — aggregated open interest from selected exchanges.
• OI delta — delta (change in OI compared to the previous bar).
3. Denomination
• USD — values are converted into USD equivalents.
• COIN — values are shown in the base asset (BTC, ETH, etc.).
4. Reading the Chart
• OI candlesticks show the overall OI dynamics.
• Delta histogram highlights how much OI has grown or decreased per bar.
• Colors are fully customizable.
5. Tables
• Enabled via the Show table option.
• Full Table → Rows = exchanges, Columns = contract types. Cells contain OI values in either USD or the base asset, depending on settings. Quickly shows where the main interest is concentrated.
• Short Table → Displays only the total OI values in USD and the base asset.
⸻
Important Notes
• For better readability of large values, two custom formatting functions were implemented. They work similarly to format.volume, but with improved digit grouping and adjustable decimal precision. In the tables, the top row is formatted using format.volume, while the bottom row uses the improved formatting functions for clearer representation.
str(d, n, s) =>
str.substring(d, 0, str.length(d) - n) + '.' + str.substring(d, str.length(d) - n, str.length(d) - (n - 2)) + s
format(_r) =>
d = str.tostring(math.round(_r))
str.length(d) > 9 ? str(d, 9, " B") : str.length(d) > 6 ? str(d, 6, " M") : str.length(d) > 3 ? str(d, 3, " K") : d
⸻
Conclusion: Crypto OI Aggregated is a convenient and powerful tool for cryptocurrency derivatives traders. It enables tracking of OI dynamics across multiple exchanges simultaneously, detecting imbalances between contracts, and identifying signals that are not visible when analyzing a single exchange.

Global Liquidity Proxy (Fed + ECB + BoJ + PBoC)Global Liquidity Proxy (Fed + ECB + BoJ + PBoC) Vs BTC

Hilly 2.0 Advanced Crypto Scalping Strategy - 1 & 5 Min ChartsHow to Use
Copy the Code: Copy the script above.
Paste in TradingView: Open TradingView, go to the Pine Editor (bottom of the chart), paste the code, and click “Add to Chart.”
Check for Errors: Verify no errors appear in the Pine Editor console. The script uses Pine Script v5 (@version=5).
Select Timeframe:
1-Minute Chart: Use defaults (emaFastLen=7, emaSlowLen=14, rsiLen=10, rsiOverbought=80, rsiOversold=20, slPerc=0.5, tpPerc=1.0, useCandlePatterns=false).
5-Minute Chart: Adjust to emaFastLen=9, emaSlowLen=21, rsiLen=14, rsiOverbought=75, rsiOversold=25, slPerc=0.8, tpPerc=1.5, useCandlePatterns=true.
Apply to Chart: Use a liquid crypto pair (e.g., BTC/USDT, ETH/USDT on Binance or Coinbase).
Verify Signals:
Green “BUY” or “EMA BUY” labels and triangle-up arrows below candles.
Red “SELL” or “EMA SELL” labels and triangle-down arrows above candles.
Green/red background highlights for signal candles.
Arrows use size.normal for consistent visibility.
Backtest: Use TradingView’s Strategy Tester to evaluate performance over 1–3 months, checking Net Profit, Win Rate, and Drawdown.
Demo Test: Run on a demo account to confirm signal visibility and performance before trading with real funds.

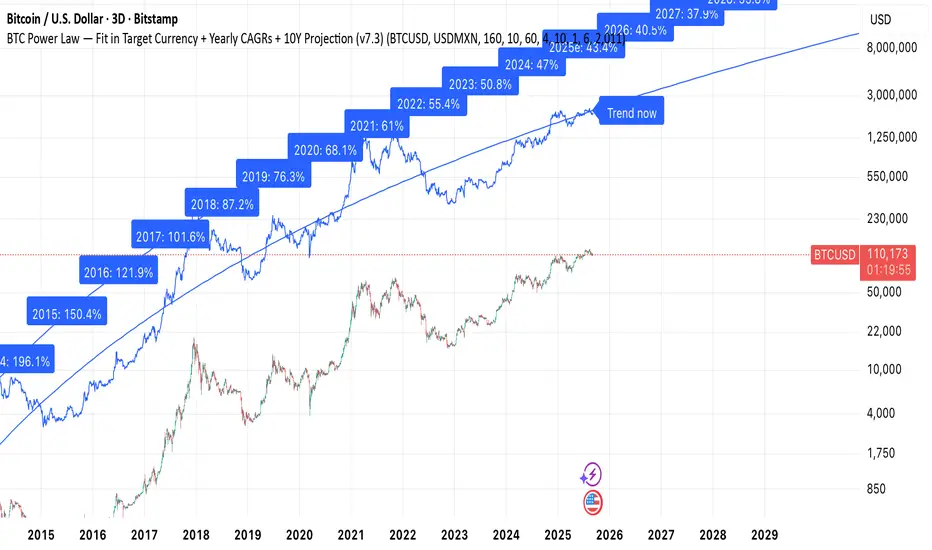
Preston Pysh - BTC Power Law in Any Fiat CurrencyThis tool helps a user understand what the power law suggests the expected annual CAGR is for any currency (can be adjusted in the settings). It also shows the project price (in said fiat currency) for the next ten years.
Supertrend [TradingConToto]Supertrend — ADX/DI + EMA Gap + Breakout (with Mobile UI)
What makes it original
Supertrend combines trend strength (ADX/DI), multi-timeframe bias (EMA63 and EMA 200D equivalent), a structural filter based on the distance between EMA2400 and EMA4800 expressed in ATR units, and a momentum confirmation through a previous high breakout.
This is not a random mashup — it’s a sequence of filters designed to reduce trades in ranging markets and prioritize mature trends:
Direction: +DI > -DI (trend led by buyers).
Strength: ADX > mean(ADX) (avoids weak, choppy phases).
Short-term bias: Close > EMA63.
Long-term bias: Close > EMA4800 ≈ EMA200 daily on H1.
Momentum: Close > High (immediate breakout).
Structure: (EMA2400 − EMA4800) > k·ATR (ensures separation in ATR units, filters out flat phases).
Entries & exits
Entry: when all six conditions are met and no open position exists.
Exit: if +DI < -DI or Close < EMA63.
Visuals: EMA63 is painted green while in position and red otherwise, with a supertrend-style band; “BUY” labels appear below the green band and “SELL” labels above the red band.
UI: includes a compact table (mobile-friendly) showing the state of each condition.
Default parameters used in this publication
Initial capital: 10,000
Position size: 10% of equity (≤10% per trade is considered sustainable).
Commission: 0.01% per side (adjust to your broker/market).
Slippage: 1 tick
Pyramiding: 0 (only one position at a time)
Adjust commission/slippage to match your market. For US equities, commissions are often per share; for spot crypto, 0.10–0.20% total is common. I publish with 0.01% per side as a conservative example to avoid overestimating results.
Recommended backtest dataset
Timeframe: H1
Multi-cycle window (e.g. 2015–today)
Symbols with high liquidity (e.g. NASDAQ-100 large caps, or BTC/ETH spot) to generate 100+ trades. Avoid cherry-picked short windows.
Why each filter matters
+DI > -DI + ADX > mean: reduce counter-trend trades and weak signals.
Close > EMA63 + Close > EMA4800: enforce trend alignment in short and long horizons.
Breakout High : requires immediate momentum, avoids early entries.
EMA gap in ATR units: blocks flat or compressed structures where EMA200D aligns with price.
Limitations
The breakout filter may skip healthy pullbacks; the design prioritizes continuation over perfect entry price.
No fixed trailing stop/TP; exits depend on trend degradation via DI/EMA63.
Results vary with real costs (commissions, slippage, funding). Adjust defaults to your broker.
How to use
Apply it on a clean chart (no other indicators when publishing).
Keep in mind the default parameters above; if you change them, mention it in your notes and use the same values in the Strategy Tester.
Ensure your dataset produces 100+ trades for statistical validity.

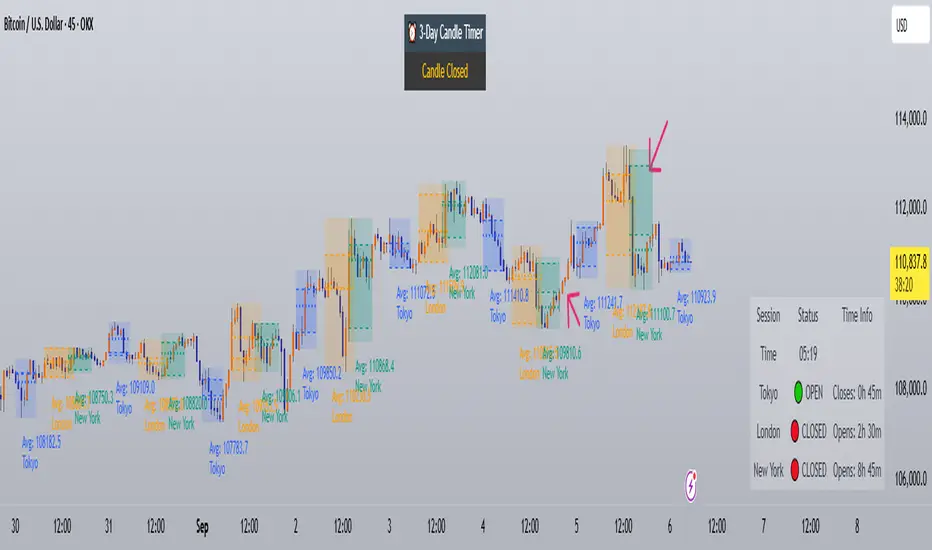
Trading Sessions with Holidays & Timer🌍 Trading Sessions Matter
Markets breathe in cycles. When Tokyo, London, or New York steps in, liquidity shifts and price often reacts fast.
Example: New York closed BTC at $110K, and when traders woke up, the price was already $113K. That gap says everything about overnight pressure and the next move.
⚡ Indicator Features
✅ Session boxes (Tokyo, London, NY) with custom colors & time zones
✅ Open/close lines → spot gaps & momentum
✅ Average price per session → see where pressure builds
✅ Tick range → quick volatility check
✅ 🏖 Holiday markers → avoid false quiet markets
✅ Live status table → session OPEN / CLOSED + countdown timer
🚀 How to Use
Works on intraday timeframes (1m–4h)
Watch session opens/closes → liquidity shift points
Compare ranges & averages between Tokyo, London, NY
Use the timer to prep before the next wave
This tool helps you visualize the heartbeat of global markets session by session.
🔖 #BTCUSDT #Forex #TradingSessions #Crypto #DayTrading
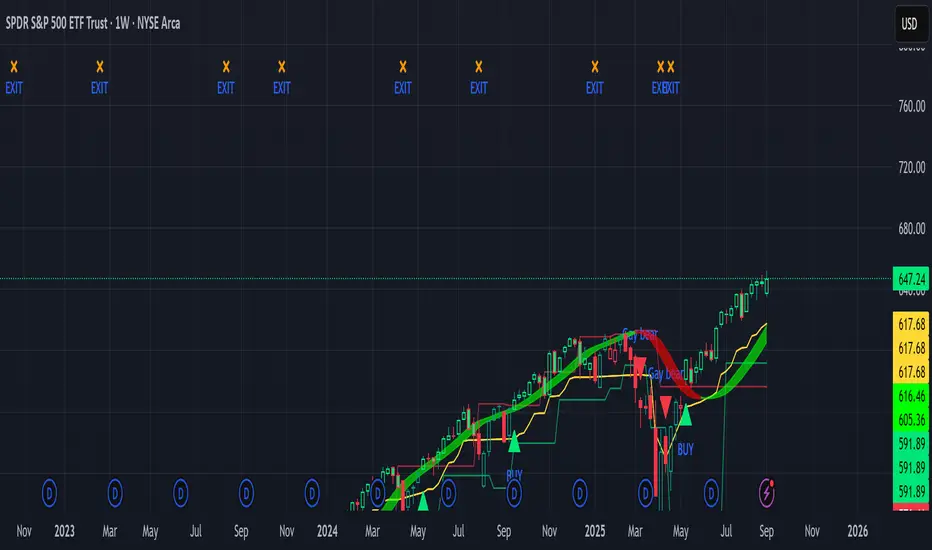
Sniper Swing — Short TF (Clean Signals) [v6]📘 How to Use the Sniper Swing Indicator
1. What It Does
It looks for short-term swing breaks in price.
It uses an oscillator (RSI/Stoch) and swing pivots to confirm moves.
It gives you 3 clear signals only:
BUY → Enter long (expecting price to go up).
Gay bear → Enter short (expecting price to go down).
EXIT → Close your trade (long or short).
Candles also change color:
Green = in a BUY trade.
Red = in a Gay bear trade.
Neutral (gray/none) = no trade.
2. When to Use
Works best on short timeframes (1m–5m) for scalping/intraday.
Use on liquid markets (MES/ES, NQ, SPY, BTC, ETH).
Avoid dead hours with no volume (like overnight futures lull or midday chop).
3. How to Trade With It
A. BUY trade
Wait for a BUY triangle below the candle.
Confirm:
Candle turned green.
Price broke a recent swing high.
Oscillator shows strength (indicator does this for you).
Enter long at the close of that candle.
Place your stop-loss:
At the yellow stop line (auto trailing stop), or
Just below the last swing low.
Stay in while candles are green.
Exit when:
An orange X appears, or
Price hits your stop.
B. Gay bear (short) trade
Wait for a Gay bear triangle above the candle.
Confirm:
Candle turned red.
Price broke a recent swing low.
Oscillator shows weakness.
Enter short at the close of that candle.
Place stop-loss:
At the yellow stop line, or
Just above the last swing high.
Stay in while candles are red.
Exit on an orange X or stop hit.
4. Pro Tips for New Traders
Only take one signal at a time → don’t double dip.
Quality > Quantity: ignore weak, sideways markets. Best signals happen during trends.
Start small: trade micros (MES) or small position sizes.
Use alerts: set TradingView alerts for BUY/Gay bear/EXIT so you don’t miss setups.
Think of the indicator like a navigator: it tells you the likely path, but you’re the driver → always manage risk.
5. Quick Mental Checklist
Signal? (BUY or Gay bear triangle)
Confirmed? (candle color + swing break)
Enter? (on close)
Stop? (yellow line or swing)
Exit? (orange X or stop)