Bollinger Bands Breakout Oscillator [LuxAlgo]The Bollinger Bands Breakout Oscillator is an oscillator returning two series quantifying the significance of breakouts between the price and the extremities of the Bollinger Bands indicator.
Settings
Length: Period of the Bollinger Bands indicator
Mult: Controls the width of the Bollinger Bands
Src: Input source of the indicator
Usage
Each series is calculated by summing the distance between price and a respective Bollinger Bands extremity in the case price is outside this extremity and divided by the sum of the absolute distance between price and a respective extremity. This sum is done over the most recent Length bars.
Bullish breakouts are represented by the green areas of the indicator, while bearish breakouts are represented by the red areas of the indicator.
The oscillator can determine the presence of an uptrend when the bullish area is superior to the bearish area, while a downtrend is indicated by a bearish area being superior to the bullish one. The significance of the breakout is determined by the amplitude of each area, with higher amplitudes indicating more significant breakouts or strong trends.
Using higher Mult values would naturally return wider bands, which would induce less frequent breakouts, this would be highlighted by the oscillator.
In the chart above we can see the oscillator using a multiplicative factor of 2.
스크립트에서 "breakout"에 대해 찾기

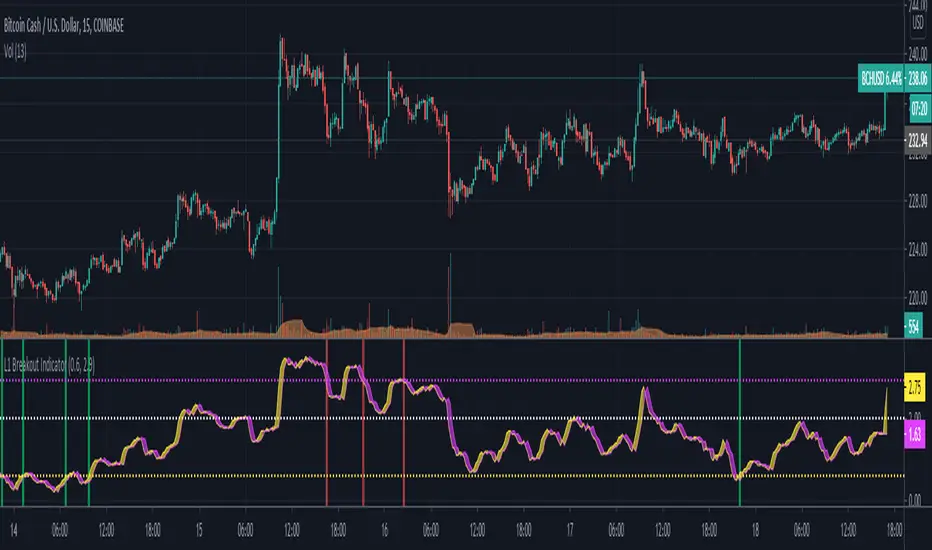
L1 Breakout IndicatorLevel: 1
Background
A breakout refers to when the price of an asset moves above a resistance area or below a support area. Breakouts indicate that the price may be trending in the direction of the breakout.
Function
L1 Breakout Indicator utilizes highest() and lowest() functions to define breakout levels. Use ema() to draw a trade line to detect the distance to breakout points. By doing that, you will know whether is overbought or oversold. Then, by applying a set of simple threshold inputs, you can locate the long and short entries points.
Key Signal
trade line and its lag version
Pros and Cons
Pros:
1. Simple but powerful to know overbought and oversold regions
2. Flexible input threshold values to adapt various market conditions
Cons:
1. It may satruate for extreme conditions of long and short.
2. Multiple long and short entries may be generated.
Remarks
Just simple
Readme
In real life, I am a prolific inventor. I have successfully applied for more than 60 international and regional patents in the past 12 years. But in the past two years or so, I have tried to transfer my creativity to the development of trading strategies. Tradingview is the ideal platform for me. I am selecting and contributing some of the hundreds of scripts to publish in Tradingview community. Welcome everyone to interact with me to discuss these interesting pine scripts.
The scripts posted are categorized into 5 levels according to my efforts or manhours put into these works.
Level 1 : interesting script snippets or distinctive improvement from classic indicators or strategy. Level 1 scripts can usually appear in more complex indicators as a function module or element.
Level 2 : composite indicator/strategy. By selecting or combining several independent or dependent functions or sub indicators in proper way, the composite script exhibits a resonance phenomenon which can filter out noise or fake trading signal to enhance trading confidence level.
Level 3 : comprehensive indicator/strategy. They are simple trading systems based on my strategies. They are commonly containing several or all of entry signal, close signal, stop loss, take profit, re-entry, risk management, and position sizing techniques. Even some interesting fundamental and mass psychological aspects are incorporated.
Level 4 : script snippets or functions that do not disclose source code. Interesting element that can reveal market laws and work as raw material for indicators and strategies. If you find Level 1~2 scripts are helpful, Level 4 is a private version that took me far more efforts to develop.
Level 5 : indicator/strategy that do not disclose source code. private version of Level 3 script with my accumulated script processing skills or a large number of custom functions. I had a private function library built in past two years. Level 5 scripts use many of them to achieve private trading strategy.
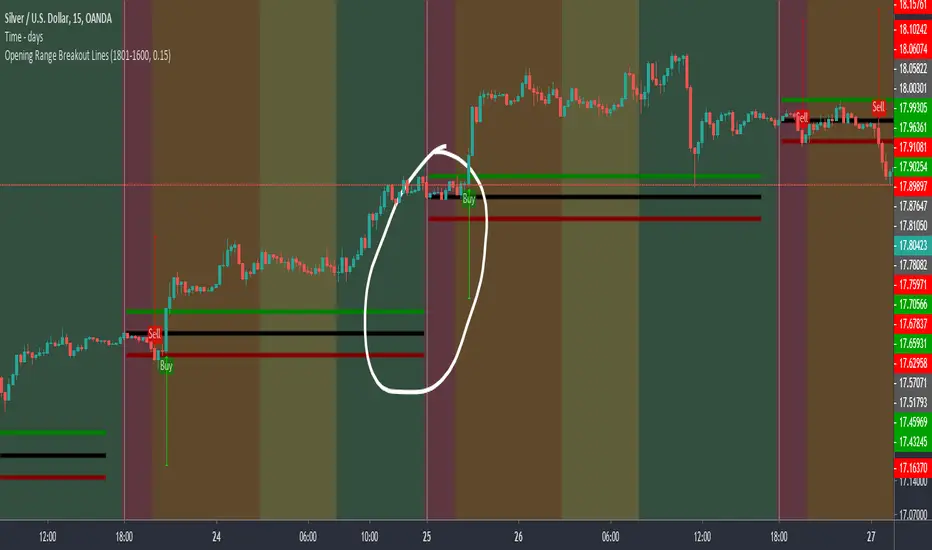
Opening Range Breakout LinesDisclaimer: Use proper risk management and remember that all trading involves risk.
Based on RicardoSantos' "Open Session Breakout Trader Strategy"
I turned it into a study and tweaked it for trading Silver
My goal when creating this was to help visualize breakout lines for multiple trading days at the same time without having to always draw them in.
15-Min ORB Indicator with Breakout Targets **What this indicator does:**
The 15-Min ORB (Opening Range Breakout) Indicator helps traders spot breakout trades by automatically detecting the high and low of the first 15 minutes after a session opens. It then monitors for breakouts above or below this range and plots dynamic take-profit levels based on your chosen multipliers.
**How it works:**
You set the start time for your session (hour and minute) in the settings.
The indicator marks the high and low during the first 15 minutes after your chosen open time, drawing lines on the chart and, if enabled, labels for these levels.
If price breaks above the 15-min high, a potential long breakout is identified; if it breaks below the low, a potential short breakout is detected.
Upon a breakout, the script calculates the distance from the entry (breakout) to the opposite side of the 15-min range and uses your input multipliers to project two take-profit levels (TP1/TP2).
All lines and labels (for the range and targets) can be individually toggled on or off in the settings.
Both the 15-min range and the targets can be styled (color, line style, label position).
**How to use it:**
Add the indicator to your chart.
Set the session start hour and minute to match your instrument’s open (e.g., 9:30 for US stocks or futures).
Use the settings to customize which levels and labels are shown, their appearance, and the target expansion multiples.
When price breaks out above or below the opening range, the script will plot TP1 and TP2 lines at your chosen risk/reward multiples, and label them if desired.
You can use the visual levels for trade entries, profit taking, or alerts.
**What makes it unique and useful:** >
Unlike many basic ORB indicators, this script not only marks the opening range but also tracks breakouts, auto-plots your profit targets based on range expansion, and gives you full control over display (styles, toggles, and label positions).
The TP targets are dynamic and can be set to any multiples, adapting to your risk/reward plan and breakout style.
Everything is customizable for your own session times, instrument, or trading approach.
**Typical uses:**
Intraday traders looking for clear breakout setups around the session open.
Automated R-multiple target planning for both long and short trades.
Visualizing volatility and measuring early price expansion.

Candle Breakout Oscillator [LuxAlgo]The Candle Breakout Oscillator tool allows traders to identify the strength and weakness of the three main market states: bullish, bearish, and choppy.
Know who controls the market at any given moment with an oscillator display with values ranging from 0 to 100 for the three main plots and upper and lower thresholds of 80 and 20 by default.
🔶 USAGE
The Candle Breakout Oscillator represents the three main market states, with values ranging from 0 to 100. By default, the upper and lower thresholds are set at 80 and 20, and when a value exceeds these thresholds, a colored area is displayed for the trader's convenience.
This tool is based on pure price action breakouts. In this context, we understand a breakout as a close above the last candle's high or low, which is representative of market strength. All other close positions in relation to the last candle's limits are considered weakness.
So, when the bullish plot (in green) is at the top of the oscillator (values above 80), it means that the bullish breakouts (close below the last candle low) are at their maximum value over the calculation window, indicating an uptrend. The same interpretation can be made for the bearish plot (in red), indicating a downtrend when high.
On the other hand, weakness is indicated when values are below the lower threshold (20), indicating that breakouts are at their minimum over the last 100 candles. Below are some examples of the possible main interpretations:
There are three main things to look for in this oscillator:
Value reaches extreme
Value leaves extreme
Bullish/Bearish crossovers
As we can see on the chart, before the first crossover happens the bears come out of strength (top) and the bulls come out of weakness (bottom), then after the crossover the bulls reach strength (top) and the bears weakness (bottom), this process is repeated in reverse for the second crossover.
The other main feature of the oscillator is its ability to identify periods of sideways trends when the sideways values have upper readings above 80, and trending behavior when the sideways values have lower readings below 20. As we just saw in the case of bullish vs. bearish, sideways values signal a change in behavior when reaching or leaving the extremes of the oscillator.
🔶 DETAILS
🔹 Data Smoothing
The tool offers up to 10 different smoothing methods. In the chart above, we can see the raw data (smoothing: None) and the RMA, TEMA, or Hull moving averages.
🔹 Data Weighting
Users can add different weighting methods to the data. As we can see in the image above, users can choose between None, Volume, or Price (as in Price Delta for each breakout).
🔶 SETTINGS
Window: Execution window, 100 candles by default
🔹 Data
Smoothing Method: Choose between none or ten moving averages
Smoothing Length: Length for the moving average
Weighting Method: Choose between None, Volume, or Price
🔹 Thresholds
Top: 80 by default
Bottom: 20 by default

Custom Previous High/Low + Breakout AlertsThis indicator plots the previous high and low of the selected timeframe and alerts you when the price breaks either level.
To prevent spam, it triggers only once per period. If both the high and low break within the same period, you will receive an alert for each, but no duplicates if price hovers around these levels.
How to Set Up Alerts
1. Choose Your Timeframe
- In the indicator settings, select the timeframe for the high/low reference.
- Example: If you select 1 hour, the indicator will plot the previous 1-hour high and low and alert you when either level is broken
2. Create an Alert
- Condition → High/Low Break Alerts
- Function → Any alert() function call
Optional:
- If you want alerts only for high breakouts or low breakouts, select High Breakout or Low Breakout and use "Once Per Bar" as the trigger. (It will still alert only once per period.)
3. Setting Alerts for Multiple Timeframes
- If you want to create another alert for a different timeframe, first select the new timeframe in the indicator settings, then create a new alert
- Note: Previous alerts will continue to notify you based on the timeframe they were originally set for, even if you change the timeframe in the indicator settings.

Price & Volume Breakout Fibonacci Probability [TradeDots]📝 OVERVIEW
The "Price & Volume Breakout Fibonacci Probability" indicator is designed to detect the probability of the maximum run-up and drawdown of each breakout trade on an asset, assisting traders in optimizing their take profit and stop loss strategies.
🧮 CALCULATIONS
The algorithm detects price and volume breakouts to activate the Fibonacci levels displayed on the chart. It calculates these levels using the period pivot high and low, with the close price of the breakout bar as the reference price.
The indicator then forward-tests within an user-selected number of bars, detecting the maximum run-up and drawdown during that period. Consequently, it calculates the probability of the price hitting either side of the Fibonacci levels, showing the likelihood of reaching take profit and stop loss targets for each breakout trade.
📊 EXAMPLE
The above example shows two breakout trades, circled within the yellow rectangle zone.
The first trade has a maximum run-up above the +0.382 Fibonacci level zone and a maximum drawdown below the -0.618 Fibonacci level zone.
When the price reaches the maximum run-up, it only has a ~45% probability of moving further upward into the last two zones (25% + 19.44%). This indicates that setting a take profit at a higher level may have less than a 50% chance of success.
Conversely, when the price reaches its maximum drawdown, there is only an ~8% probability of moving further downward into the last drawdown zone. This could indicate a potential reversal.
⚙️ SETTINGS
Breakout Condition: Determines the type of breakout condition to track: "Price", "Volume", "Price & Volume".
Backtest Period: The maximum run-up and drawdown are detected within this bar period.
Price Breakout Period: Specifies the number of bars the price needs to break out from.
Volume Breakout Period: Specifies the number of bars the volume needs to break out from.
Trendline Confirmation: Confirms that the close price needs to be above the trendline.
📈 HOW TO USE
By understanding the probabilities of price movements to both the upside and downside, traders can set take profit and stop loss targets with greater accuracy.
For instance, placing a stop loss order below the zone with the highest probability minimizes the chances of being stopped out of a profitable trade. Conversely, setting a take profit target at the zone with the highest probability increases the win rate.
Additionally, if the price breaches multiple Fibonacci levels during the breakout period, it may indicate an abnormal state, signaling a potential reversal or pullback. This can help traders exit trades in a timely manner.
Traders can adjust their take profit and stop loss levels based on their individual risk tolerance.
RISK DISCLAIMER
Trading entails substantial risk, and most day traders incur losses. All content, tools, scripts, articles, and education provided by TradeDots serve purely informational and educational purposes. Past performances are not definitive predictors of future results.

Liquidation Levels with Liquidity Sweeps/Breakouts [AlgoAlpha]🌊📈 Dive into the depths of market liquidity with "Liquidation Levels with Liquidity Sweeps/Breakouts" - your ultimate tool for navigating the turbulent waters of trading! 🧹💹 Crafted by the wizards at AlgoAlpha, this Pine Script™ masterpiece illuminates the unseen liquidity levels and sweeps, guiding you through the financial seas with insight. 🚀🔍
Key Features:
🕒 Timeframe Flexibility: Customize your analysis with a TimeFrame Multiplier, allowing the indicator to operate on higher timeframes for broader market insight.
💥 Dynamic Volume Threshold: Set your sensitivity to breakouts with the High Volume Threshold, ensuring you catch significant market movements while avoiding fakeouts.
👀 Visibility Controls: Toggle the display of swept liquidity and highlight liquidity breakouts with customizable background colors for clear, actionable insights.
🎨 Custom Appearance: Personalize your chart with bullish, bearish, and breakout colors to match your trading style.
How to Use the Liquidity Levels with Liquidation Sweeps Indicator:
Maximize your trading efficiency with the Liquidity Levels with Liquidation Sweeps Indicator by following these simple steps! 🚀🌟
⚙️ Customize Settings: Access the indicator settings to personalize the TimeFrame Multiplier, High Volume Threshold, and Relative Volume Period. Tailor these settings to match your trading strategy and chart preferences.
👁️ Analyze Liquidity Levels: Monitor the chart for liquidity levels and sweeps. Bullish sweeps are marked with green labels, bearish sweeps with red, and breakouts highlighted by the chart background.
🔔 Set Alerts: Enable alert conditions for liquidity breakouts and sweeps within the indicator's settings. This feature allows you to receive real-time notifications, helping you to act promptly on trading opportunities.
How It Works:
The heart of this indicator lies in its ability to track and highlight liquidity levels derived from swing pivots, and sweeps across multiple timeframes. By calculating relative volume against a user-defined threshold, it identifies strong volume movements indicative of liquidity breakouts, this helps filter out fake-outs. When a liquidity level is breached but not completely mitigated, it's either marked as a bullish or bearish sweep, which come with the option to show an estimate of the number of liquidations during the sweep.
if peakform and peakprinted != 1
aR.push(line.new(bar_index-mult, h.get(1), bar_index+1, h.get(1), color = red))
aRv.push(h.get(1))
peakprinted := 1
if valleyform and valleyprinted != 1
aS.push(line.new(bar_index-mult, l.get(1), bar_index+1, l.get(1), color = green))
aSv.push(l.get(1))
valleyprinted := 1

Custom % Breakout HighlightThe "Custom % Breakout Highlight" indicator in Pine Script is designed to visually identify candles that experience a significant percentage price change relative to a user-defined threshold. The primary goal of this indicator is to highlight candles that surpass a specified percentage breakout level, signaling potential price movements or shifts in market dynamics.
Parameters:
Percentage Breakout: Users can input a desired percentage value to define the threshold for identifying breakout candles. This parameter allows customization based on the trader's preference or the specific characteristics of the instrument being analyzed.
How it works:
The script calculates the percentage change in the closing price of each candle compared to the closing price of the previous candle.
It then checks whether the absolute value of this percentage change exceeds the user-defined percentage breakout threshold.
If the condition is met, the script highlights the corresponding candles by displaying a blue background in a new pane at the low of the breakout candle.
Interpretation:
Highlighted Candles: Candles with a background color indicate instances where the price change exceeds the defined percentage breakout level. Traders may interpret these highlighted candles as potential breakout or significant price movement signals.
Usage:
Traders and analysts can use this indicator to identify candles with notable price changes, helping them focus on potential breakout events or shifts in market sentiment.
By adjusting the "Percentage Breakout" parameter, users can customize the sensitivity of the indicator to match the volatility characteristics of different assets or trading preferences.
Note:
The indicator is designed for use on various timeframes and can be applied to different financial instruments.
It is important to consider other technical and fundamental analysis tools in conjunction with this indicator for comprehensive decision-making.
This indicator serves as a visual aid for traders seeking to highlight candles with significant percentage price movements, offering a customizable tool for breakout identification in financial markets.

Price breakout and reversal [TCS] | PAThis indicator is designed to identify potential breaks and reversals in price movements for a financial instrument.
The indicator displays several elements to assist users in spotting specific market conditions:
1. High and Low Pivots : The indicator marks the highest and lowest points on the price chart within a customizable lookback period. These pivots represent important turning points in the price movement and serve as reference levels for potential breakouts and reversals.
2. Fair Value Line : A horizontal line is drawn at the midpoint between the high and low pivots. This line represents the "fair value" based on the recent price action. Traders may consider this level as a reference for evaluating the price's deviation from its average value.
3. Bullish Breakouts : When the closing price of the financial instrument crosses above the high pivot the indicator identifies a potential bullish breakout. This suggests a possible buying opportunity.
4. Bearish Breakouts : Conversely, a bearish breakout is identified when the closing price crosses below the low pivot. This may indicate a selling opportunity.
5. Fair Value Breakouts : In addition to regular breakouts, the indicator can detect breakouts based on the fair value line. If the closing price crosses above or below the fair value line, it may signal a fair value breakout, indicating the price's potential return to its average level.
6. Reversals : Reversal patterns are essential in technical analysis. The indicator identifies potential bullish and bearish reversals .
The indicator enhances its visual signals with geometric shapes (triangles and diamonds) placed above or below the price bars to represent different types of breakouts and reversals.
Moreover, the indicator can be configured to send alerts to the user when any of these specific events occur, helping traders stay informed and respond promptly to potential trading opportunities.
Please note that this code is for educational purposes only and should not be used for trading without further testing and analysis.

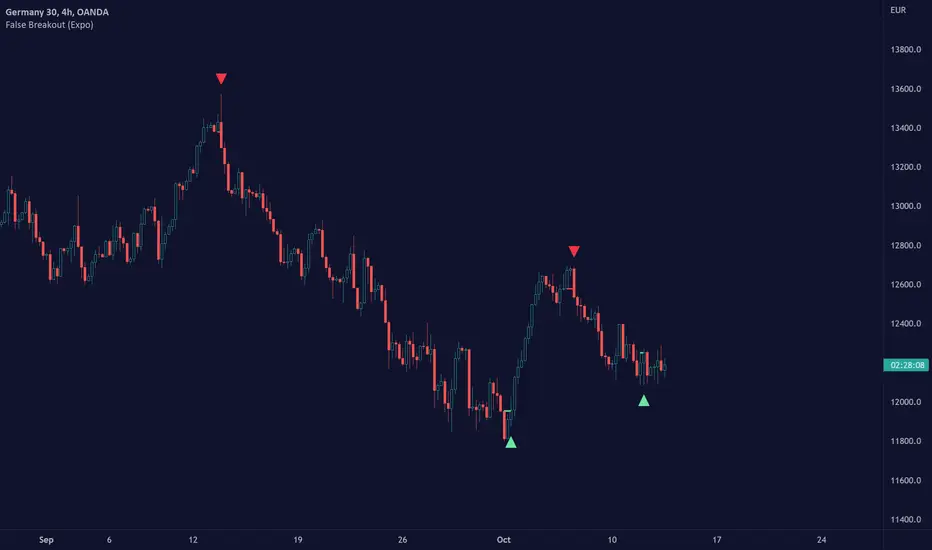
False Breakout (Expo)█ Overview
False Breakout (Expo) is an indicator that detects false breakouts in real-time. A false breakout occurs when the price moves through a certain level but doesn't continue to accelerate in that direction. This is because the price does not have enough momentum and the buying interest at this level is not high enough to keep pushing the price in that direction. Instead, the market reverses! All breakout traders are now forced to close their positions at a loss. However, contrarian traders that have identified this false breakout do get a perfect entry for a great reversal trade!
False Breakout is one of the most important price action trading patterns to learn because it can help traders understand whether a breakout is valid or false.
█ How to use
Identify False Breakouts
Identify Reversal trades
-----------------
Disclaimer
The information contained in my Scripts/Indicators/Ideas/Algos/Systems does not constitute financial advice or a solicitation to buy or sell any securities of any type. I will not accept liability for any loss or damage, including without limitation any loss of profit, which may arise directly or indirectly from the use of or reliance on such information.
All investments involve risk, and the past performance of a security, industry, sector, market, financial product, trading strategy, backtest, or individual's trading does not guarantee future results or returns. Investors are fully responsible for any investment decisions they make. Such decisions should be based solely on an evaluation of their financial circumstances, investment objectives, risk tolerance, and liquidity needs.
My Scripts/Indicators/Ideas/Algos/Systems are only for educational purposes!
[blackcat] L2 Ehlers Hilbert Channel Breakout Trading SystemLevel: 2
Background
John F. Ehlers introuced Hilbert Channel Breakout Trading System in Nov, 2000.
Function
This indicator will show how the adaptive filter is being applied to a trading strategy. After the Hilbert Channel Breakout Signal is optimized, set the inputs for this indicator to match the corresponding inputs for the signal.
In the March 2000 STOCKS & COMMODITIES, John Ehlers published a algorithm for the Hilbert cycle period, an indicator that plots the length of the current market cycle. The Hilbert transform achieved computational efficiency by using a two-dimensional numbering system. Unfortunately, this introduces amplitude error in calculating the quadrature component. Dr. Ehlers compensated for this error. He have updated the method of compensating for the amplitude error by applying a straight-line compensation term using the frequency calculation from one bar ago. This is possible because the cycle period cannot change drastically from bar to bar. The slowly varying cycle period is adequate to do a good job of amplitude compensation.
In addition, Dr. Ehlers have used a different way to compute the cycle period. He used a homodyne discriminator because it exhibits superior performance in a low signal-to-noise environment. Homodyne means he used the signal multiplied by itself one bar ago to produce a zero-frequency beat note. This beat note carries the phase angle of the one-bar change. Still using the basic definition of a cycle, the one-bar rate of change of phase is exactly the cycle period.
Here is the pine v4 code to generate the signals in the Hilbert channel breakout trading system, as discussed in Dr. Ehlers article in this issue, "Optimizing With Hilbert Indicators." The signal itself is a simple channel breakout system that generates buy and exit signals, that shows whether the system is long or flat; the high of the bar and the value of the entry channel; and the low of the bar and the value of the exit channel. This helps you see on a bar-by-bar basis exactly how the system is behaving.
Key Signal
longcond--> when high breakouts EntryChannel to long
shortcond--> when low breakouts ExitChannel to short
Pros and Cons
100% John F. Ehlers definition translation, even variable names are the same. This help readers who would like to use pine to read his book.
Remarks
The 66th script for Blackcat1402 John F. Ehlers Week publication.
I tested it and believe it work better in small time frame e.g. 15m than large time frames.
Readme
In real life, I am a prolific inventor. I have successfully applied for more than 60 international and regional patents in the past 12 years. But in the past two years or so, I have tried to transfer my creativity to the development of trading strategies. Tradingview is the ideal platform for me. I am selecting and contributing some of the hundreds of scripts to publish in Tradingview community. Welcome everyone to interact with me to discuss these interesting pine scripts.
The scripts posted are categorized into 5 levels according to my efforts or manhours put into these works.
Level 1 : interesting script snippets or distinctive improvement from classic indicators or strategy. Level 1 scripts can usually appear in more complex indicators as a function module or element.
Level 2 : composite indicator/strategy. By selecting or combining several independent or dependent functions or sub indicators in proper way, the composite script exhibits a resonance phenomenon which can filter out noise or fake trading signal to enhance trading confidence level.
Level 3 : comprehensive indicator/strategy. They are simple trading systems based on my strategies. They are commonly containing several or all of entry signal, close signal, stop loss, take profit, re-entry, risk management, and position sizing techniques. Even some interesting fundamental and mass psychological aspects are incorporated.
Level 4 : script snippets or functions that do not disclose source code. Interesting element that can reveal market laws and work as raw material for indicators and strategies. If you find Level 1~2 scripts are helpful, Level 4 is a private version that took me far more efforts to develop.
Level 5 : indicator/strategy that do not disclose source code. private version of Level 3 script with my accumulated script processing skills or a large number of custom functions. I had a private function library built in past two years. Level 5 scripts use many of them to achieve private trading strategy.


High Breakout PRO - Huy Hoang Trader
# High Breakout PRO - Huy Hoang Trader - Strategy Description
## 🚀 Overview
**High Breakout PRO** is a professional-grade Trend Following strategy designed to capture major market moves while strictly managing risk. Built on the core philosophy of "Price Action Breakouts," this script enhances the classic Donchian Channel breakout method with modern risk management tools like the **Hybrid Exit** and **EMA Trend Filter**.
This strategy is optimized for **Gold (XAUUSD)**, **Bitcoin (BTC)**, and **Major Stocks (AAPL, AMZN)** on **H4 and Daily** timeframes.
## 💎 Key Features
1. **Trend Filter (EMA):** Only takes long positions when the price is above the 200-period EMA. This filters out counter-trend noise and significantly improves winning probability.
2. **Hybrid Exit Mechanism ("Holy Grail"):** A unique dynamic trailing stop that combines:
* **Price Structure:** Uses the lowest low of the last Y bars (Donchian Support).
* **Volatility:** Uses ATR-based trailing (Chandelier Exit logic).
* *Logic:* The system automatically chooses the **tighter** (higher) stop level between the two, ensuring you lock in profits rapidly during strong volatility while giving the trade room to breathe during accumulation.
3. **Professional Visuals:** A refined "Wealth & Earth" themes (Gold/Silver/Brown) specifically designed to reduce eye strain and provide clear, professional signal visibility without chart clutter.
## 🛠 Strategy Logic
### entry rules
* **Breakout:** Price closes above the Highest High of the last `X` bars (Default: 20).
* **Trend Confirmation:** Closing Price > EMA 200 (Configurable).
### Exit Rules
* **Dynamic Stop Loss:** The trade is closed when price breaches the **Hybrid Trailing Stop**.
* The Trailing Stop never moves down. It only moves up as price increases.
* It effectively adapts to both slow-grinding trends and explosive spikes.
## ⚙️ Best Settings (Recommended)
* **Timeframe:** H4 (Swing Trading) or Daily (Position Trading).
* **Entry Period (X):** 20
* **Exit Period (Y):** 10
* **Trend Filter:** ON (EMA 200)
* **Risk Management:** Hybrid Mode (ATR Multiplier 3.0)
## ⚠️ Disclaimer
This strategy follows trends. It may experience drawdowns during choppy/sideways markets. Always use proper risk management (position sizing) and backtest on your specific asset before live trading.
---
*Developed by Antigravity. Empowering traders with institutional-grade tools.*
Contact for work: www.facebook.com

High Breakout PRO Huy Hoang Trader
High Breakout PRO - Strategy Description
## 🚀 Overview
**High Breakout PRO** is a professional-grade Trend Following strategy designed to capture major market moves while strictly managing risk. Built on the core philosophy of "Price Action Breakouts," this script enhances the classic Donchian Channel breakout method with modern risk management tools like the **Hybrid Exit** and **EMA Trend Filter**.
This strategy is optimized for **Gold (XAUUSD)**, **Bitcoin (BTC)**, and **Major Stocks (AAPL, AMZN)** on **H4 and Daily** timeframes.
## 💎 Key Features
1. **Trend Filter (EMA):** Only takes long positions when the price is above the 200-period EMA. This filters out counter-trend noise and significantly improves winning probability.
2. **Hybrid Exit Mechanism ("Holy Grail"):** A unique dynamic trailing stop that combines:
* **Price Structure:** Uses the lowest low of the last Y bars (Donchian Support).
* **Volatility:** Uses ATR-based trailing (Chandelier Exit logic).
* *Logic:* The system automatically chooses the **tighter** (higher) stop level between the two, ensuring you lock in profits rapidly during strong volatility while giving the trade room to breathe during accumulation.
3. **Professional Visuals:** A refined "Wealth & Earth" themes (Gold/Silver/Brown) specifically designed to reduce eye strain and provide clear, professional signal visibility without chart clutter.
## 🛠 Strategy Logic
### entry rules
* **Breakout:** Price closes above the Highest High of the last `X` bars (Default: 20).
* **Trend Confirmation:** Closing Price > EMA 200 (Configurable).
### Exit Rules
* **Dynamic Stop Loss:** The trade is closed when price breaches the **Hybrid Trailing Stop**.
* The Trailing Stop never moves down. It only moves up as price increases.
* It effectively adapts to both slow-grinding trends and explosive spikes.
## ⚙️ Best Settings (Recommended)
* **Timeframe:** H4 (Swing Trading) or Daily (Position Trading).
* **Entry Period (X):** 20
* **Exit Period (Y):** 10
* **Trend Filter:** ON (EMA 200)
* **Risk Management:** Hybrid Mode (ATR Multiplier 3.0)
## ⚠️ Disclaimer
This strategy follows trends. It may experience drawdowns during choppy/sideways markets. Always use proper risk management (position sizing) and backtest on your specific asset before live trading.
---
*Developed by Huy Hoang Trader. Empowering traders with institutional-grade tools.*
Contact for work: www.facebook.com

DkS Market Structure Breakout Strategy Crypto & ForexDkS Market Structure Breakout Strategy Crypto & Forex
🔍 Overview
DkSPro – Universal Market Analysis is a structure-based trading strategy designed for Crypto and Forex markets, focused on trend alignment, breakout confirmation, and volume validation.
This strategy is built to filter low-quality trades, avoid ranging conditions, and reduce false breakouts by requiring multiple layers of confirmation before any trade is executed.
It is intended for scalping and intraday trading, prioritizing consistency and risk control over trade frequency.
🧠 Strategy Logic (How It Works)
DkSPro follows a sequential decision process, not a single-indicator signal:
Trend Bias (EMA Structure)
A fast and slow EMA define the directional bias.
Long trades are only allowed during bullish EMA alignment.
Short trades are only allowed during bearish EMA alignment.
This prevents counter-trend and ranging-market entries.
Market Structure & Breakout Validation
The strategy identifies recent swing highs and lows.
Trades are triggered only after a confirmed breakout of structure, not during consolidation.
This avoids early entries and false momentum moves.
Volume Confirmation
Volume must exceed its moving average by a defined multiplier.
This ensures participation and filters out low-liquidity breakouts.
Volume thresholds adapt depending on the selected trading mode.
Momentum Confirmation (RSI)
RSI is used strictly as a momentum filter, not as a standalone signal.
It confirms that price movement aligns with the breakout direction.
Risk Management (Mandatory)
Every position includes a predefined Stop Loss and Take Profit.
Position sizing is based on a fixed percentage of equity, keeping risk per trade within sustainable limits.
All conditions must align simultaneously; otherwise, no trade is executed.
⚙️ Trading Modes
SAFE Mode
Stronger volume and RSI thresholds
Fewer trades, higher selectivity
Designed for risk control and consistency
AGGRESSIVE Mode
Slightly relaxed filters
Higher trade frequency during strong momentum
Intended for experienced users only
📊 Markets & Assets
This strategy has been actively used and tested on:
🟢 Crypto (Binance / Binance.US)
SOL-USDT
XRP-USDT
Other high-liquidity pairs (BTC, ETH)
Crypto mode benefits from stronger volume confirmation to adapt to higher volatility.
🔵 Forex
Major pairs such as EURUSD, GBPUSD, USDJPY
Optimized for liquid markets with lower relative volume
The same structural logic applies to both markets, with volume behavior naturally adapting to each asset class.
⏱ Recommended Timeframes
Crypto: 5m – 15m
Forex: 15m – 1H
Lower timeframes (1m) are not recommended due to noise and unreliable volume behavior.
🧪 Backtesting & Settings Transparency
Default strategy properties are intentionally conservative to reflect realistic conditions:
Initial capital: $20,000
Position size: 2% of equity
Commission: 0.08%
Slippage: 1 tick
Fixed Stop Loss and Take Profit on every trade
Backtests should be performed on sufficient historical data (ideally 6–12 months) to ensure a statistically meaningful sample size (100+ trades).
📈 Originality & Usefulness
DkSPro is not a simple indicator mashup.
Each component serves a specific role in a layered confirmation system:
EMAs define direction
Structure defines timing
Volume validates participation
RSI confirms momentum
Risk management controls exposure
Removing any layer significantly reduces signal quality. The strategy is designed as a complete decision framework, not a signal generator.
⚠️ Important Notes
This script is an analysis and execution tool, not financial advice.
Market conditions change, and no strategy performs well in all environments.
Users are encouraged to backtest, forward test, and adjust position sizing according to their own risk tolerance.
🧩 Version Notice
This publication represents a consolidated and refined version of an internal experimental script.
No parallel or duplicate versions are intended.
All future improvements will be released exclusively using TradingView’s Update feature.
🇪🇸 Descripción en Español (Resumen)
DkSPro es una estrategia basada en estructura de mercado, diseñada para Crypto y Forex, que combina tendencia, ruptura de estructura, volumen y control de riesgo.
Solo opera cuando todas las condiciones se alinean, evitando rangos, falsas rupturas y sobreoperar.
Ha sido utilizada en Binance con pares como SOL-USDT y XRP-USDT, así como en Forex, siempre con gestión de riesgo fija y condiciones realistas.

Volatility Breakout System [Fixed Risk]
This is a trend-following breakout strategy designed to capture volatility expansion while filtering out low-momentum "chop." It is built on the philosophy that significant price moves are often preceded by a breakout of volatility bands (Keltner Channels) accompanied by Volume and Trend Strength (ADX).
Strategy Logic:
Volatility Breakout: The primary trigger is a candle closing outside the Keltner Channels. This indicates price is moving faster than the average range.
Trend Filter: Trades are only taken in the direction of the 200 EMA.
Momentum Filter (ADX): The ADX filter ensures we only enter when the trend strength is above a specific threshold (Default: 20). This prevents the strategy from buying tops or selling bottoms in ranging markets.
Volume Confirmation: A breakout without volume is often a fake-out. This script requires volume to be higher than the moving average.
Risk Management (Automated):
Stop Loss: Based on ATR (Average True Range) to adapt to current market volatility.
Trailing Stop: Once the trade moves in favor, a trailing stop is activated to lock in profits.
Breakeven: If price moves X% in favor, the Stop Loss is automatically moved to the entry price to protect capital.
Cooldown: Includes a safety mechanism to prevent over-trading immediately after a signal.
Backtesting Notes:
This script is set up with use_bar_magnifier=true. For accurate results, use this on higher timeframes (1H, 4H) or ensure you have a Premium account for intrabar inspection.
Inputs:
You can toggle the "Compounding" feature to test fixed cash vs. % equity growth.
Webhooks are fully configurable for alert automation.

HV Spike Strategy (HVP + OR Breakout + Reversal + TP/SL Modes)Here is a script that I tried to make it simple, although it has several parameters, I will try to explain, here we go:
Logic: Open Range Breakout: otherwise knows as First Candle Rule, usually used for the first candle in the opening of a market session, in my strategy there is an option to use it even for Crypto that operate 24/7, how to do that? Simply by detecting Volatility from the HVP (Historical Volatility Percentile). Then the ORB logic kicks in and the first candle with high volatility gives the ranges for the trades. The proper HVP Activation Threshold has to be selected for each currency pair/index/crypto in order to have maximum profit.
Enter a trade: when the price goes 100% above/below the First Candle Rule Range. That way it is filtering fake breakouts. Also if the price reverses back into the range the strategy takes the opposite trade.
Exit a trade: SL/TP By percentage or ATR, selection in the input menu.
My intention is to avoid using lagging indicators or guessing of Price Action, purely Bull/Bear indication by the first candle.
I hope you find this helpful! Wishing all successful Trades!

NOVA Breakout Signals v2.2 (TF M30)A clean, rules-based breakout signal tool for 30-minute charts.
It detects Dow swing breakouts and filters them with RSI, MACD and Volume so you only see the higher-quality entries. The script does not place trades and does not calculate SL/TP – it only prints clear LONG/SHORT labels at the entry price.
⸻
How it works
1. Timeframe enforcement – Signals are generated only on M30. On other timeframes the script shows a notice and stays silent.
2. Breakout engine (Dow swings) – The last confirmed swing high/low (pivots) is tracked.
• Breakout Up: bar closes above the last swing high by a small buffer.
• Breakout Down: bar closes below the last swing low by a small buffer.
3. Quality filters (all must be true):
• RSI (default length 30):
• Long: RSI > threshold and rising.
• Short: RSI < threshold and falling.
• MACD (12/26/9):
• Long: histogram > 0 and line > signal.
• Short: histogram < 0 and line < signal.
• Volume: current volume > SMA(volume, 20) × multiplier.
4. Debounce / anti-spam
• Cooldown of 4 hours (8 M30 bars) after any signal.
• Minimum price distance from the previous signal to avoid clustered labels.
Signals appear once the bar closes (barstate.isconfirmed). No swing lines are drawn to keep the chart clean; only entry labels are shown.
⸻
Inputs (key)
• RSI length & thresholds for Long/Short confirmation.
• MACD uses 12/26/9 (fixed).
• Volume multiplier (relative to SMA 20).
• Breakout buffer %, Cooldown hours, Min distance %.
• Show labels (on/off).
⸻
Usage tips
• Start with gold/major FX/indices on M30; use “Once per bar close” if you attach alerts.
• Increase the breakout buffer and volume multiplier in choppy markets.
• Tighten RSI thresholds (e.g., 55/45) if you want fewer but stronger signals.
⸻
Notes & limitations
• Pivots confirm after a few bars by definition; signals themselves are printed only on confirmed bar close and do not repaint once shown.
• This is a signal indicator, not investment advice. Always manage risk.

Volatility Range Breakout Strategy [wbburgin]The "Volatility Range Breakout Strategy" uses deviations of high-low volatility to determine bullish and bearish breakouts.
HOW IT WORKS
The volatility function uses the high-low range of a lookback period, divided by the average of that range, to determine the likelihood that price will break in a specific direction.
High and low ranges are determined by the relative volatility compared to the current closing price. The high range, for example, is the (volatility * close) added to the close, the low range is this value subtracted by the close.
A volatility-weighted moving average is taken of these high and low ranges to form high and low bands.
Finally, breakouts are identified once the price closes above or below these bands. An upwards breakout (bullish) occurs when the price breaks above the upper band, while a downwards breakout (bearish) occurs when the price breaks below the lower band. Positions can be closed either by when the price falls out of its current band ("Range Crossover" in settings under 'Exit Type') or when the price falls below or above the volatility MA (default because this allows us to catch trends for longer).
INPUTS/SETTINGS
The AVERAGE LENGTH is the period for the volatility MA and the weighted volatility bands.
The VOLATILITY LENGTH is how far the lookback should be for highs/lows for the volatility calculation.
Enjoy! Let me know if you have any questions.

Yesterday’s High Breakout - Trend Following StrategyYesterday’s High Breakout it is a trading system based on the analysis of yesterday's highs, it works in trend-following mode therefore it opens a long position at the breakout of yesterday's highs even if they occur several times in one day.
There are several methods for exiting a trade, each with its own unique strategy. The first method involves setting Take-Profit and Stop-Loss percentages, while the second utilizes a trailing-stop with a specified offset value. The third method calls for a conditional exit when the candle closes below a reference EMA.
Additionally, operational filters can be applied based on the volatility of the currency pair, such as calculating the percentage change from the opening or incorporating a gap to the previous day's high levels. These filters help to anticipate or delay entry into the market, mitigating the risk of false breakouts.
In the specific case of NULS, a 9% Take-Profit and a 3% Stop-Loss were set, with an activated trailing-stop percentage. To postpone entry and avoid false breakouts, a 1% gap was added to the price of yesterday's highs.
Name : Yesterday's High Breakout - Trend Follower Strategy
Author : @tumiza999
Category : Trend Follower, Breakout of Yesterday's High.
Operating mode : Spot or Futures (only long).
Trade duration : Intraday.
Timeframe : 30M, 1H, 2H, 4H
Market : Crypto
Suggested usage : Short-term trading, when the market is in trend and it is showing high volatility.
Entry : When there is a breakout of Yesterday's High.
Exit : Profit target or Trailing stop, Stop loss or Crossunder EMA.
Configuration :
- Gap to anticipate or postpone the entry before or after the identified level
- Rate of Change for Entry Condition
- Take Profit, Stop Loss and Trailing Stop
- EMA length
Backtesting :
⁃ Exchange: BINANCE
⁃ Pair: NULSUSDT
⁃ Timeframe: 2H
⁃ Fee: 0.075%
⁃ Slippage: 1
- Initial Capital: 10000 USDT
- Position sizing: 10% of Equity
- Start : 2018-07-26 (Out Of Sample from 2022-12-23)
- Bar magnifier: on
Credits : LucF for Pine Coders (f_security function to avoid repainting using security)
Disclaimer : Risk Management is crucial, so adjust stop loss to your comfort level. A tight stop loss can help minimise potential losses. Use at your own risk.
How you or we can improve? Source code is open so share your ideas!
Leave a comment and smash the boost button!
Thanks for your attention, happy to support the TradingView community.

Matze BreakoutShows 2 different states of breakout:
Arrow = unusual volume, raising volume, positiv rate of change, standard deviation breakout
Bolt = very unusual volume, very high standard deviation breakout

Trend Following BreakoutEasy Trend Following Strategy using Highs and Lows breakout of the last X candles to enter and exit trades.
You can easily change the ENTRY and EXIT value in order to find the best settings.
This strategy seems to be working well for $BTC and $ETH on the 4H and 1D.
I didn't play with it too much as I am testing script to trade on the 15 minutes chart with margin. This script can't do this successfully but I hope it can be helpful for what you want to achieve.
