CG Inside Candle Breakout/BreakdownThe Inside Candle Breakout/Breakdown Indicator can be used to identify the breakout or breakdown cross of the mother candle and inside candle. This helps in deciding whether to go long on a breakout or short on a breakdown.
This indicator first identifies the mother candle and inside candle (baby candle). If the next candle, which is formed after the inside candle, breaks the high of the mother candle in the case of an uptrend or breaks the low of the mother candle in the case of a downtrend, it will indicate a breakout or breakdown.
스크립트에서 "breakout"에 대해 찾기
Manual Trend Line Breakout Labels and Alerts (TA:MTL)Manual Trend Line Breakout Labels and Alerts (TA:MTL)
TA:MTL is an indicator designed for manually plotting trend lines with advanced features including future extension, automatic breakout labels, and alerts. Developed for traders and analysts seeking precise trend determination and timely response to trend changes.
Key Features
Manual Trend Point Selection: Set two time points to define the start and end of the main trend line.
Adaptive Extension: The trend line automatically extends into the future, aiding in the anticipation of potential trend direction.
Strict Breakout Conditions: The indicator monitors strict breakout conditions where the price must cross the trend line post-bar closure, providing more reliable signals.
Visual Labels and Alerts: Visual labels appear upon detecting a breakout, accompanied by alerts for immediate user notification.
Customizable Appearance: Choose colors for primary and extended lines, as well as for breakout labels.
Usage Instructions
Set two time points (Trend time point 1 and Trend time point 2) to determine the initial and final points of the trend line.
Select the position type (Position Type) - "Long" for an upward trend or "Short" for a downward trend.
Customize the appearance of lines and labels using the available color parameters.
Activate the display of the future line extension (Show Future Line) if needed.
Monitor automatic labels and alerts to identify breakout moments of trend lines.

Fake BreakoutThis indicator detect fake breakout on previous day high/low and option previous swing high and low
Rule Detect Fake Breakout On Previous Day High/Low Or Swing high low Fake Breakout -
1) Detect previous day high/low or swing high/low
2)
A) If price revisit on previous day high/swing high look for upside breakout after input
number of candle (1-5) price came back to previous high and breakout happen downside
it show sell because its fake breakout of previous day high or swing high
B) If price revisit on previous day low/swing low look for downside breakout after input
number of candle (1-5) price came back to previous low and breakout upside of previous
day low it show Buy because its fake breakout of previous day low or swing low
Disclaimer -Traders can use this script as a starting point for further customization or as a reference for developing their own trading strategies. It's important to note that past performance is not indicative of future results, and thorough testing and validation are recommended before deploying any trading strategy.

Ranges With Targets [ChartPrime]The Ranges With Targets indicator is a tool designed to assist traders in identifying potential trading opportunities on a chart derived from breakout trading. It dynamically outlines ranges with boxes in real-time, providing a visual representation of price movements. When a breakout occurs from a range, the indicator will begin coloring the candles. A green candle signals a long breakout, suggesting a potential upward movement, while a red candle indicates a short breakout, suggesting a potential downward movement. Grey candles indicate periods with no active trade. Ranges are derived from daily changes in price action.
This indicator builds upon the common breakout theory in trading whereby when price breaks out of a range; it may indicate continuation in a trend.
Additionally, users have the ability to customize their risk-reward settings through a multiplier referred to as the Target input. This allows traders to set their Take Profit (TP) and Stop Loss (SL) levels according to their specific risk tolerance and trading strategy.
Furthermore, the indicator offers an optional stop loss setting that can automatically exit losing trades, providing an additional layer of risk management for users who choose to utilize this feature.
A dashboard is provided in the top right showing the statistics and performance of the indicator; winning trades; losing trades, gross profit and loss and PNL. This can be useful when analyzing the success of breakout trading on a particular asset or timeframe.

MTF Breakout/RetestIntroducing the MTF (Multi Timeframe) Breakout and Retest Indicator:
This indicator is designed to enhance your trading strategy by providing a clear view of support and resistance levels across multiple timeframes. What this simply means is that you can input your levels, and be on a lower timeframe such as the 1 minute timeframe, and are able to see when your support or resistance level has a breakout
📈 Short Trade Breakout Condition:
- Definition: A short breakout occurs when a candle closes below your specified support level on any chosen timeframe.
- Confirmation: It confirms as a valid short signal when a second candle closes below the support level without retesting.
- Visual Clarity: The indicator highlights the timeframe in which this breakout has occurred.
(Long conditions are same but reversed, and will be displayed in color green)
📊 Multi-Timeframe Insights:
- Scope: You can analyze support and resistance levels across various timeframes, including 5, 15, 30, and 60 minutes, while trading on a lower timeframe like 1 minute.
🎨 Dynamic Color-Coding:
- Visual Signaling: The indicator employs color-coding to visually signal breakout events. When a short breakout occurs on any timeframe the timeframe color will highlight red, and vice versa for long will highlight green. The physical line will change color based on the current timeframe you are viewing
- Real-Time Tracking: Colors reset when a level is retested, helping you track market sentiment in real-time.
🪙 Need Your Help
- I am still very much new to coding, and this code is clearly not optimized well. This code was mainly the based idea, and over the next coming months I will be working to enhance the code but I need tradingview help. If you are a coder and see a way to optimize this code please please let me know :)

IC breakoutThis indicator was implemented to detect indecision candles on a daily and 4-hour timeframe.
The settings of the indicator allow you to specify the maximum size (in percentage ) of the indecision candle, as well as the maximum price range (also in percentage ) between the low and the high of that indecision candle.
Moreover, as the title might indicate, the goal was not to only detect the indecision candles, but to get alerts (and information on the graph) when the high or low of an indecision candle is broken on the next block.
The alerts allow both merged and separate alerts.
The alert "1. IC breakout high/low" will be triggered for both a breakout under the previous low or above the previous high
The alert "2. IC breakout low" will be triggered only for a breakout under the previous low
The alert "3. IC breakout high" will be triggered only for breakout above the previous high

MATHR3E RAMP-MA█ OVERVIEW
MATHR3E RAMP-MA (R-MA) is a trend following indicator.
█ CONCEPTS
Disclaimer:
MATHR3E RAMP-MA indicator is intended for advanced traders and may fit your profile, whether you are a day trader or a long-term investor.
It was originally developed by a renowned market analyst and documented in numerous books. Among them is the author Jason Perl.
It is recommended to have read the trading techniques mentioned in the books covering this indicator beforehand.
How to use:
MATHR3E RAMP-MA is useful for determining if a market is trending and when so, to procure entry points to initiate a trade in line with the expected directional move.
It can be applied to markets as a stop-loss, as well as a low-risk entry qualifier in conjunction with other indicators of the same author.
Moving Average (R-MA I):
Only displayed when market is trending
• Bull trend: Green (moving avg Lows/Period)
• Bear trend: Red (moving avg Highs/Period)
Moving Average (R-MA II):
Always displayed
• Bullish outlook on the market: the 3-day moving average must be positioned above the 34-day moving average
• Bearish outlook on the market: the 3-day moving average must be positioned below the 34-day moving average
█ FEATURES & BENEFITS
Versatile:
This indicator is based on relative price action, so you can apply it to any market or time frame without having to change the default settings.
Rate of Change:
The ROC is calculated for the fast and slow periods of the R-MA (II).
R-MA (II) is colored blue when its rate of change is advancing and maroon when it is declining.
Breakout Qualifier:
A close above/below the moving average R-MA (I) that is confirmed by the following price bar's opening price
Materialized on chart with Flags:
• Green when bear trend ends
• Red when bull trend ends
Alerts
Get notified on:
• UpTrend breakout
• DnTrend breakout
• Any breakout Signal

Tendências com Breakout [THALES SARAIVA]Tendências com Breakout
Tendências com Breakout
Tendências com Breakout
Tendências com Breakout
Tendências com Breakout
Tendências com Breakout
Tendências com Breakout

PriceCatch Australia ASX Breakout Stocks Screener FHi,
TradingView community and Australia (ASX) traders. Warm Greetings.
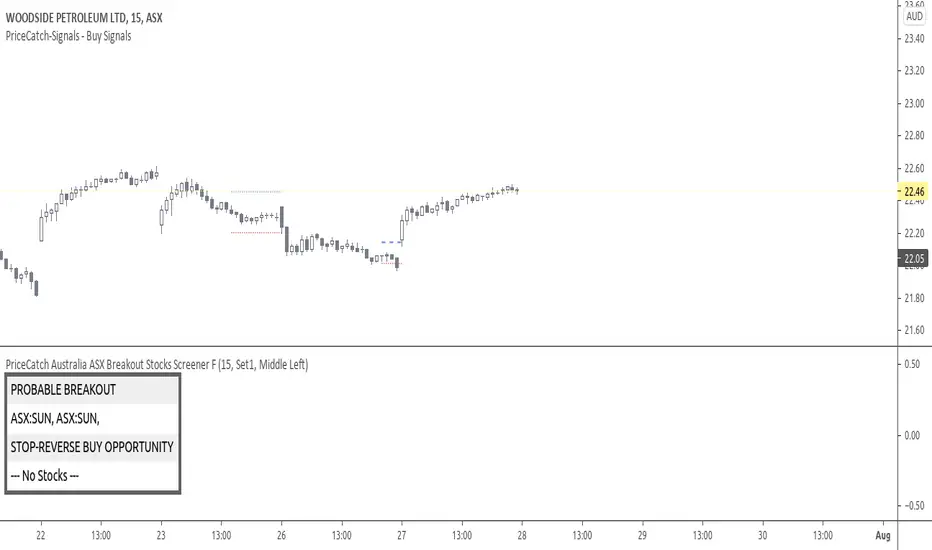
PriceCatch Australia (ASX) Breakout Stocks Screener
I am sharing a script that screens Australia (ASX) stocks for Probable Breakout Buy signal and Stop-Reverse Buy Signal. This script may prove to be useful to traders who trade Australia (ASX) listed stocks.
I have already shared the script "PriceCatch Signals Buy Signals" that marks the following levels on the chart.
Probable Breakout Buy Level
Stop-Reverse Buy Level
While the script "PriceCatch Signals Buy Signals" can be used independently, this script is intended to be used with the script "PriceCatch Signals Buy Signals".
Used together, these two scripts may help you identify probable breakout opportunities. This Screener will help you screen stocks that have broken out of any of the Breakout levels marked by the "PriceCatch Signals Buy Signals" script. This way you can quickly and automatically identify breakout stocks without manually going through every stock in your watchlist searching for breakout signals.
Please read the Notes of the script "PriceCatch Signals Buy Signals" for explanation of its functionality.
STOCKS SET
This Free screener scans a list of 20 stocks. The full version scans a list of 80 stocks. Care has been taken to include liquid stocks and stocks of AUD $10 and above only, to avoid penny stocks.
Chart resolution vs. Script resolution
It is suggested to set the chart resolution to a lower time-frame than the Screener resolution. For example, if the screener resolution is set to 1 Hour time-frame, set the chart resolution to less than 1 Hour time-frame and run the Screener.
CHART
The Screener runs independently and you may have any other ASX chart on your screen.
NOTE - PRIOR TO USING THIS SCRIPT:
Please remember that the script is shared with absolutely no assurances about usability and any warranties whatsoever and as a responsible trader, please satisfy yourselves thoroughly and use it only if you are satisfied it works for you. Remember, you are 100% responsible for your actions. If you understand and accept that, you may use the script.
QUERIES/FEEDBACK
Please PM me or comment.
Regards to all and wish everyone all the best with trading.
PriceCatch NASDAQ Breakout Stocks Screener FHi,
Tradingview community and NASDAQ traders. Warm Greetings.
NASDAQ Breakout Stocks Screener
I am sharing a script that screens NASDAQ stocks for Probable Breakout Buy signal and Stop-Reverse Buy Signal. This script may prove to be useful to traders who trade NASDAQ listed stocks.
I have already shared the script "PriceCatch Signals Buy Signals" that marks the following levels on the chart.
Probable Breakout Buy Level
Stop-Reverse Buy Level
While the script "PriceCatch Signals Buy Signals" can be used independently, this script is intended to be used with the script "PriceCatch Signals Buy Signals".
Used together, these two scripts may help you identify probable breakout opportunities. This Screener will help you screen stocks that have broken out of any of the Breakout levels marked by the "PriceCatch Signals Buy Signals" script. This way you can quickly and automatically identify breakout stocks without manually going through every stock in your watchlist searching for breakout signals.
Please read the Notes of the script "PriceCatch Signals Buy Signals" for explanation of its functionality.
STOCKS SET
This Free screener scans a list of 20 stocks. The full version scans a list of 160 stocks. Care has been taken to include liquid stocks with over 500K daily volume.
Chart resolution vs. Script resolution
It is suggested to set the chart resolution to a lower time-frame than the Screener resolution. For example, if the screener resolution is set to 1 Hour time-frame, set the chart resolution to less than 1 Hour time-frame and run the Screener.
CHART
The Screener runs independently and you may have any chart on your screen. As you can see chart is showing XLNX and the screener has identified a set of other stocks.
NOTE - PRIOR TO USING THIS SCRIPT:
Please remember that the script is shared with absolutely no assurances about usability and any warranties whatsoever and as a responsible trader, please satisfy yourselves thoroughly and use it only if you are satisfied it works for you. Remember, you are 100% responsible for your actions. If you understand and accept that, you may use the script.
QUERIES/FEEDBACK
Please PM me.
Regards to all and wish everyone all the best with trading.

Custom BreakOut [NLB]Hello Everyone it's Open Rang Breakout (ORB) Basically its Design for Forex or Crypto Market.
How to work its indicator?
➤ Its Open Rang Breakout it's automatically plotted first Bar High and Low if High Breakout when Providing Long Or if Low Breakout when Providing Short.
Indicator Feature
➤ Long Signal with Alert
➤ Short Long Signal with Alert
➤ Take Profit with Alerts calculated by Long or Short Bar Open You can also choose Percentage or Point by default percent
➤ Trailing Stop Loss with Alerts
➤ You Can Also Select Custom Open Rang Bar
Important: This Indicator we are using for Automation Trading if You Want This Indicator Access, Please Contact me PM on Tradingview

Support and Resistance-Heiken Ashi-Swing Index System-alertsThis is a breakout system that has pivot swing lines and a trailing stop built in. Many people try to use different ways to find out what a swing point is such as, zig zags, lookbacks, fractals, hand-drawn chart lines, or other subjective indicators. This looks at the heiken ashi price to objectively find the swing pivots. Many would agree that the color changes in the heiken ashi bars are signs of price reversals. This indicator tells where the significant swing points will be based on this concept. A lookback for a specific number of bars is then done to make sure the lowest low or the highest high is the actual swing point by looking at all possible combinations where it could be after finding the color change in the heiken ashi bar. After the swing points are found, the pivot lines can act as support and resistance levels, as trailing stops, as a confirmation of a breakout, or any other use that S/R lines might have. The colored zone filling is included along with the pivot top and bottom lines to show that the price has broken above/below the pivot lines and has remained above/below them. This trailing stop can be used as a final indication of an exit for trend following, breakout system, or any other system that it might benefit from by sometimes reacting before other trailing stop to give off a more reliable exit signal. It works similarly to other trailing stops such as ATR based ones and Supertrend, but instead of being used for an exit or stop, it is meant more for an entry or confirmation signal. A breakout of a price pattern or S/R levels can be confirmed when the colored red/green zone changes color. Other trailing stops or exit strategies can be combined to give off a better exit.
I made this indicator so that instead of using a trailing stop line to show the direction of the breakout or trend, a colored zone is used so that it doesn't get in the way of the upper and lower lines. It can be turned off in the settings if only the support and resistance lines are needed. Other than that, this indicator doesn't need any inputs whatsoever to find out where the swing pivots points might and are found objectively using heiken ashi. I also included several alerts to signal whenever the trend direction color zone changes, when the price breaks support or resistance, or when it breaks the previous support and resistance levels.

SuperTrend High or Low BreakoutSuperTrend Breakout Indicator
Indicator Feature
SuperTrend High Breakout Line With Alerts
SuperTrend Low Breakout Line With Alerts
SuperTrend High Breakout with TP and Alerts
SuperTrend Low Breakout with TP and Alerts
You Can add TP percentage base or Point Base
SuperTrend SL Candle Both Side
SuperTrend Next Candle High Breakout Line With Alerts
SuperTrend Next Candle Low Breakout Line With Alerts
All Alerts In build This Indicator
Thank you so much :)

TrendBand NakedSame concept as Trendband Guide script, but now, we can choose any combination of moving average that suite with our own trading style.
Default setting :
Input (candle base on your timeframe)
Breakout Candle : 5 (highest)
Breakdown Candle : 10 (lowest)
Moving Average Line
EMA : default EMA, uncheck for MA
Fast Line : 10
Slow Line : 20
Direction : 50
Long Term : 200
Style
Breakout Line / Breakdown Line : Horizontal line base on breakout or breakdown setting above
Green Triangle : Potential pullback breakout
Red Triangle : Candle make new high but close lower (potential weakness)
Black Triangle : Candle make new low but close higher (potential strength)
Inside Candle : High and low current candle was smaller and within the high and low the previous candle
Background color : Red for positive / uptrend (fast line above slow line) and green for negative/downtrend (fast line below slow line)

Price Breakout This indicator can be used on any market. It identifies a price breakout when the price moves up (or down) preset number of historical price points. If the price is moving up, the breakout will indicate with an 'H' above the breakout price bar. If the price is moving down, the breakout will indicate 'L' below the price bar. It used closing price. The historical price bars can be configured, default is last 10 price bars. Indicator works on daily, weekly or monthly price charts.

3 Session ORB (Opening Range Breakout) [TickDaddy]The ORB, or Opening Range Breakout indicator. will show all 3 sessions and you can adjust the times.

CRR Micro Breakout Option 3 EMA CRR Micro Breakout Option 3 EMA
This indicator is a price action breakout system with EMA based directional filtering
It is designed for intraday trading with improved stability during trending market conditions
The logic uses micro range breakout combined with EMA direction
Buy signal occurs when price breaks above the recent range and stays above EMA
Sell signal occurs when price breaks below the recent range and stays below EMA
Cooldown logic is applied to reduce nearest signals
Time based exit is used to control drawdown during sideways conditions
Buy sell and exit alerts are included
Signals are generated on bar close and do not repaint
The logic is suitable for manual trading and algorithmic execution
This option is suitable for direct trading on option charts and performs best on 1 minute and 3 minute timeframe
This logic can also be used across all scripts and performs well on 5 minute and 15 minute timeframe
For best results use on bar execution and trade during high volatility sessions
Invite only proprietary private use only

CRR Micro Breakout Option 2 VWAP CRR Micro Breakout Option 2 VWAP
This indicator is a price action scalping system with VWAP based market bias
It is designed for intraday trading with better control during trending conditions
The logic uses micro range breakout combined with VWAP direction
Buy signal occurs when price breaks above the recent range and stays above VWAP
Sell signal occurs when price breaks below the recent range and stays below VWAP
A VWAP distance control using volatility is applied to avoid late chase entries
Cooldown logic reduces nearest signals and improves trade quality
Time based exit is used to control drawdown during sideways markets
Alerts for buy sell and exit are included
Signals are generated on bar close and do not repaint
The logic is suitable for manual scalping and algorithmic trading
For best results use on bar execution and trade during high volatility sessions
Invite only proprietary private use only

CRR Ultra Micro Breakout Option 1 PureCRR Ultra Micro Breakout Option 1 Pure
CRR Ultra Micro Breakout Option 1 is a pure price action scalping indicator designed for fast intraday trading.
It uses micro range breakout logic to capture early momentum moves without using any lagging indicators.
HOW IT WORKS
Buy signal is generated when price closes above the previous micro range high.
Sell signal is generated when price closes below the previous micro range low.
Exit signal is generated using a time based exit if price does not move.
The logic includes cooldown control to reduce nearest signals and state control to avoid over trading.
This keeps the system fast but disciplined.
ALERTS AND AUTOMATION
Buy Sell and Exit alerts are included.
Alerts trigger on bar close only.
The logic is non repainting and suitable for algorithmic execution.
AUTHOR CONCLUSION
For best performance use on bar execution.
Intrabar execution increases noise and drawdown.
Recommended timeframes and settings
1 minute aggressive scalping lookback two to three cooldown four to six
3 minute best balance lookback three to four cooldown three to four
5 minute most stable lookback four cooldown two to three
15 minute controlled lookback four to five cooldown two
This indicator is designed for high volatility sessions and momentum trading.
Risk management is required.
Invite only proprietary private use only

CRR Ultra Micro Breakout Option 1 CRR Ultra Micro Breakout Option 1 Pure
This indicator is a pure price action scalping tool designed for fast intraday trading
It uses micro range breakout logic to capture early momentum moves without lagging indicators
Buy signal occurs when price closes above the previous micro range high
Sell signal occurs when price closes below the previous micro range low
Exit signal is based on a time exit if price does not move
The logic includes cooldown control to reduce nearest signals and state control to avoid over trading
Signals are generated on bar close and do not repaint
This indicator is suitable for manual scalping and algorithmic trading
For best results use on bar execution and trade during high volatility sessions
Invite only proprietary private use only

MA-breakout signal (Skull).V1
MA-breakout signal (이평선 돌파 시그널) - V1
역배열에서 정배열 돌파시 -그린 스컬
정배열에서 역배열 돌파시 -레드 스컬
일목구름 완전 돌파시 - 배경 스컬
Moving average line breakout signal
/GREEN Skull /RED Skull
Ichimoku Cloud completely - Background Skull

Explosive Candle Detector [CodeAlchemyLab]Explosive Candle Detector
This indicator identifies potential high-momentum trading opportunities by detecting explosive candles that form after consolidation periods (base candles).
How It Works:
The indicator uses a two-candle pattern system:
Base Candle (Boring): A consolidation candle where the wicks are larger than the body, indicating indecision and potential accumulation/distribution by smart money. This represents a compression phase where price is being absorbed.
Explosive Candle: A momentum candle that appears immediately after a base candle, with a size at least 50% larger than the base candle. This represents an expansion phase where price breaks out with strong directional movement.
Features:
• Detects bullish explosive candles (green markers below candle)
• Detects bearish explosive candles (red markers above candle)
• Highlights base candles with background color
• Customizable explosive threshold (default: 50% size increase)
• Clean visual signals for easy pattern recognition
Trading Applications:
• Supply and Demand zone identification
• Breakout confirmation signals
• Momentum trade entries
• Order block detection
• Smart money accumulation/distribution phases
Best Used With:
Support/resistance levels, trend analysis, and volume confirmation for optimal trade setups.
Parameter:
Boring Candle Parameters:
1. Min wick ratio (0.6 = 60%): The total wicks (upper + lower) must be at least 60% of the candle's total range. Higher values = more wick required, meaning the candle is more "indecisive" with long wicks.
2. Max body ratio (0.4 = 40%): The body must be at most 40% of the candle's total range. Lower values = smaller body required, confirming the candle is mostly wicks with a small body.
Example: If candle range is 100 pips, wicks must be ≥60 pips and body must be ≤40 pips.
──────────────────────────────────────────
Explosive Candle Parameters:
3. Min size vs Boring (1.5 = 150%): The explosive candle must be at least 1.5x (or 50% bigger) than the boring candle's range. If boring candle is 100 pips, explosive must be ≥150 pips.
4. Min body ratio (0.5 = 50%): The explosive candle's body must be at least 50% of its total range. This ensures it's a strong directional move with a large body, not just wicks.
──────────────────────────────────────────
In Simple Terms:
• Boring candle = Big wicks, small body (consolidation/indecision)
• Explosive candle = Big body, much larger than boring candle (strong directional move)

Bullish Breakout Finder by St0icTraderThis breakout finder is for PSEI. Buy on breakout candle close with stop loss of 5%.
