Opening Range Breakout (15 mins Range)Take the guesswork out of your trading with the Opening Range Breakout Pro script. This tool automatically marks the high and low of the first 15 minutes of the NYSE session, then highlights the first candle to break out above or below this range—removing ambiguity from your trade entries.
The opening range is one of the most powerful concepts in day trading. By identifying the price range set during the market’s first minutes, you gain a clear framework for your trades. When price breaks out above the range, it often signals a strong bullish move; a break below signals bearish momentum. This script visually marks these moments, so you can react quickly and confidently.
Why use Opening Range Breakout Pro?
• Defined Entry and Exit Points: The script gives you clear, objective breakout levels—no more guessing when to enter a trade.
• Removes Emotional Trading: With visual cues for breakouts, you can follow a systematic approach and avoid hesitation or FOMO.
• Backtested, Time-Tested Strategy: The opening range breakout has been used by professional traders for decades to capture early trends and maximize profit potential.
• High Reward Potential: By capitalizing on the volatility and momentum of the opening session, traders often catch the best moves of the day.
• Easy to Use: Just add to your chart—no configuration needed. The script works on any NYSE stock, on a 5-minute chart.
How it works:
• Draws the opening 15-minute high and low as orange lines.
• Labels the range prices for quick reference.
• Marks the first candle to close above the range with an orange ▲, and the first to close below with an orange ▼.
Take control of your trading day, remove uncertainty, and trade with confidence—just like the pros.
스크립트에서 "breakout"에 대해 찾기

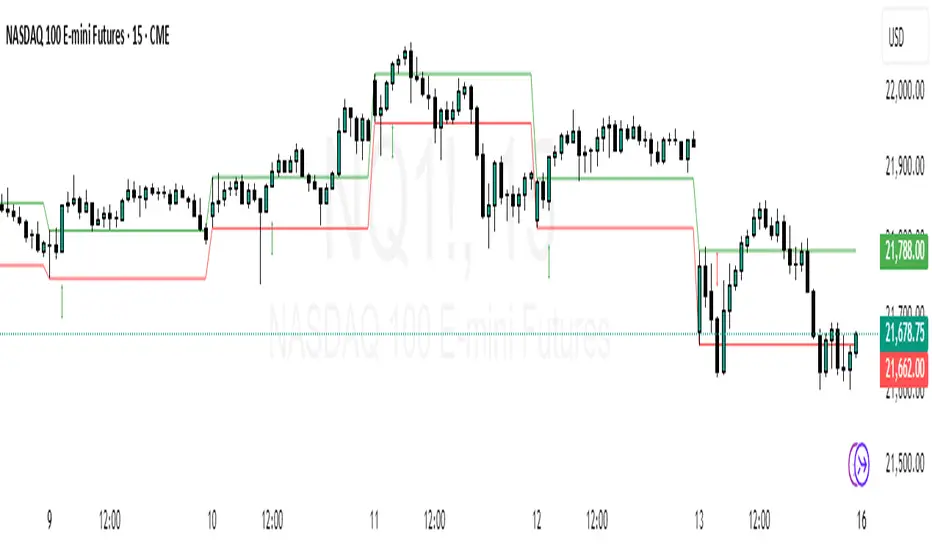
ORB Breakout Indicator - NQ1!The purpose of this indicator is to assist traders in rapidly identifying high-probability Opening Range Breakout (ORB) setups on the NQ1! 1-minute time frame (Nasdaq Futures)
Key Features:
Opening Range: Automatically plots the high and low of the 1st 15min of the (NYSE session) (09:30–09:45 EST)
Breakout Signals : Illustrates the first candle that breaks upward or downward and:
Green arrow for a bullish breakout
Red arrow for a bearish breakout
Clean Visuals: Dynamic lines show the high and low of the ORB window for easy reference.
(DON'T USE THIS ONLY FOR ENTRY SIGNALS, PAIR THIS WITH OTHER INFLUENCES TO GET HIGH PROBABILITY BREAKOUTS)
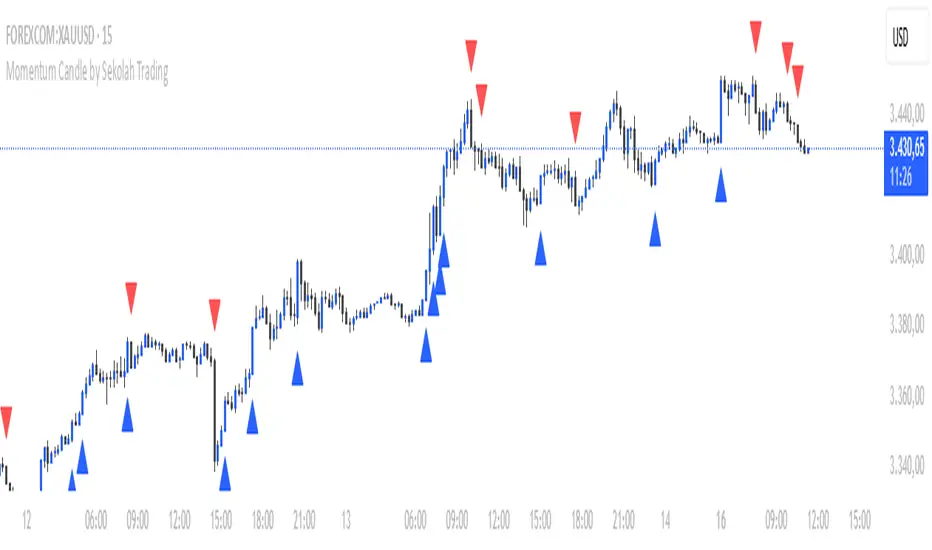
Momentum Candle by Sekolah Trading## 🔷 Introduction
**Momentum Candle by Sekolah Trading** is a proprietary price action tool that identifies high-conviction candles with large bodies and minimal wicks, based on dynamically adjusted thresholds tailored to each pair and timeframe. This script helps traders recognize moments of price acceleration that often precede breakouts, trend continuation, or sharp reversals.
---
## 🔷 What Makes This Script Unique (Originality & Utility)
Unlike traditional candle filters that rely on static size comparisons, this indicator uses:
- **Instrument-specific pip sensitivity**: Automatically detects if the pair is XAUUSD, JPY-based, or other Forex instruments.
- **Timeframe-based calibration**: Adjusts body size thresholds dynamically for 5m, 15m, 30m, and 1h.
- **Wick ratio control**: Validates only candles with short wicks (<30%), filtering indecisive moves.
- **Non-repainting logic**: Signals appear after candle close, with no future data lookahead.
This logic has been tested and refined internally by **Sekolah Trading**, designed for scalpers and intraday traders who rely on clean price action structure.
---
## 🔷 How It Works
1. **Pair & Timeframe Detection**
Adjusts `minRange` dynamically based on:
- Gold (XAUUSD), JPY pairs, or other Forex
- Timeframe: 5m to 1h
2. **Candle Structure Analysis**
- Calculates body = `abs(open - close)`
- Wick = `upper + lower shadows`
- Valid only if wick is under 30% of total candle
3. **Conditions for Signal**
- Body ≥ minRange
- Wick ≤ 30%
- Clear bullish or bearish direction
4. **Plots**
- 🔺 Blue triangle = Bullish momentum candle
- 🔻 Red triangle = Bearish momentum candle
---
## 🔷 How to Use
1. **Add to any 5m–1h chart**, ideally on XAUUSD or major Forex pairs
2. **Wait for signal triangle** to appear at the close of a candle
3. Use with:
- Trend indicators (MA, Supertrend, etc.)
- Support/resistance zones
- Breakout levels
4. **Set alerts** using:
`Momentum Candle (Body)`
---
## 🔷 Why This Script is Closed-Source
This indicator includes proprietary logic created by **Sekolah Trading** for professional and community use:
- Original dynamic pip sensitivity calibration
- Custom multi-condition filtering
- Non-reused, non-public logic with adaptive precision
The source is protected to prevent unauthorized duplication. However, all relevant logic and intent have been clearly explained above as required by TradingView’s House Rules.
---
## 🔷 Disclaimer
This indicator does not provide financial advice or guaranteed signals. Always combine with your own analysis and risk management. Historical performance does not guarantee future results.
---
## 🔷 Suggested Tags
`momentum`, `price action`, `breakout`, `forex`, `xauusd`, `jpy`, `scalping`, `candle`, `non-repainting`, `trend confirmation`
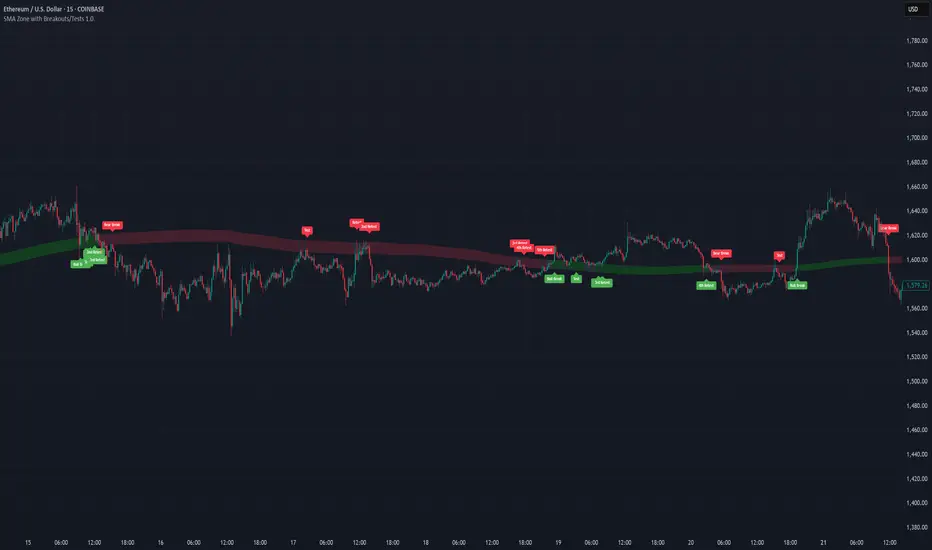
SMA Zone with Breakouts/Tests 1.0.This indicator plots a dynamic “SMA Zone” between two simple moving averages (one applied to lows, one to highs) and highlights key interaction points with the zone:
Breakouts
Bull Break: price closes above the upper SMA
Bear Break: price closes below the lower SMA
Requires confirmation via either above-average volume or an unusually wide bar (spread > ATR) closing near its extreme
Tests & Retests
After a breakout, the first re-entry into the zone edge is labeled “Test,” subsequent re-entries are numbered “Retest,” “2nd Retest,” etc.
Zone Weakening: each additional Test/Retest signifies diminished zone strength—fewer reliable boundaries remain (Traditional S/R theory)
Alerts
Fires a unified “Zone Signal” alert on every Break, Test, and Retest (set condition to “Any alert() function call”).
Disclaimer:
This is not financial advice and should not be used as a standalone trading signal.
It’s designed to draw your attention to important price-zone interactions so you can manually tune in.
The logic can be further enhanced or combined with other indicators/algorithms as part of a more complex trading system.
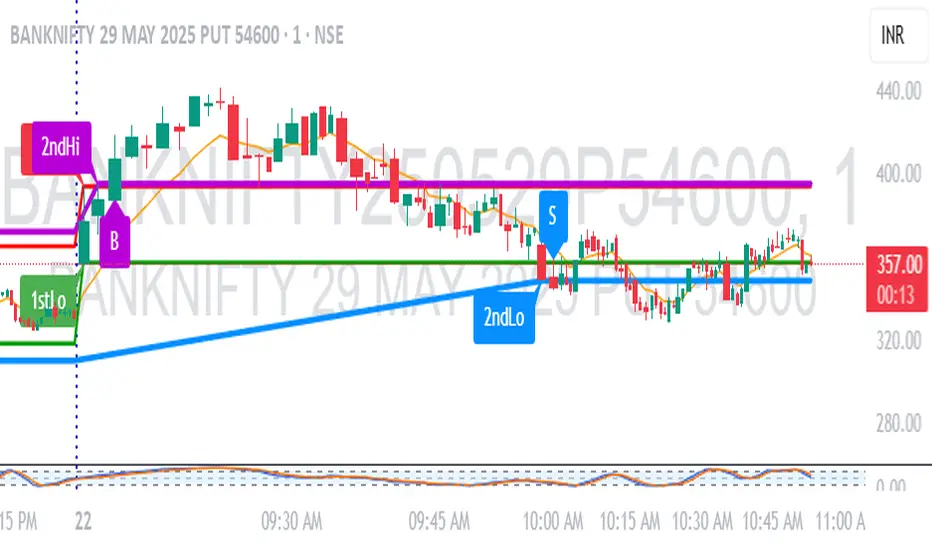
1M Scalp Setup – 2ndHi/2ndLo Breakout1M Scalp Setup – 2ndHi/2ndLo Breakout
This script is designed for 1-minute chart scalpers seeking high-probability intraday breakout setups based on early session price action. The strategy revolves around identifying the first high and low of the day, and then detecting the second breach (2nd high or 2nd low) to anticipate breakout entries.
🔍 Core Logic:
EMA Filter : A configurable EMA (default 8-period) is plotted for trend context.
1st High/Low Detection : Captures the very first high and low of each trading day.
2nd High/Low Markers : Identifies the second time price breaks the initial high or low, acting as a potential signal zone.
Breakout Signals :
A Buy Signal is triggered when price closes above the 2nd high.
A Sell Signal is triggered when price closes below the 2nd low.
Each signal is only triggered once per day to reduce noise and avoid overtrading.
🖌️ Visual Markers:
1stHi and 1stLo : Early session levels (red and green).
2ndHi and 2ndLo : Key breakout reference points (purple and blue).
B and S Labels : Buy and Sell triggers marked in real-time once breakouts occur.
⚙️ Inputs:
EMA Length (default: 8)
Customizable Colors for Buy/Sell signals and key markers
This tool is best used in fast-moving markets or during high-volume sessions. Combine with volume or higher-timeframe confirmation for improved accuracy.
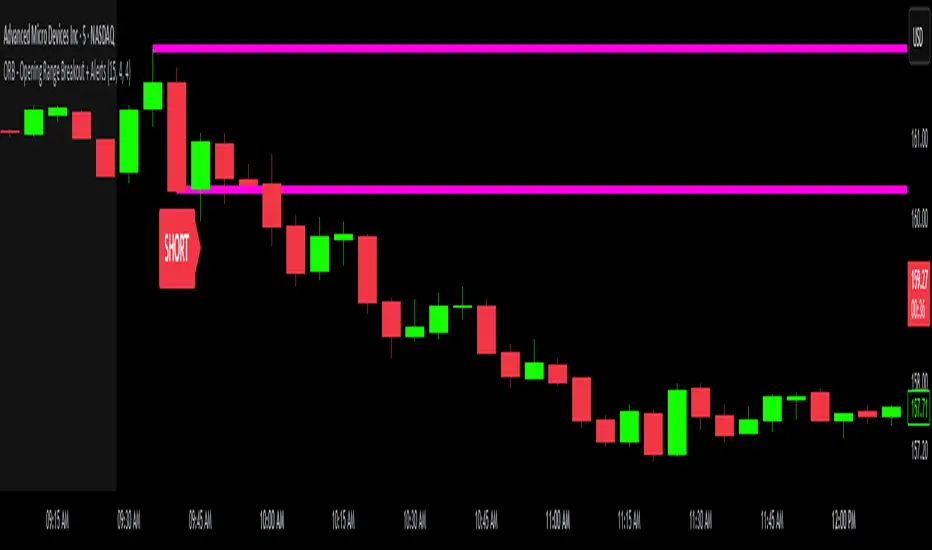
ORB - Opening Range Breakout + AlertsThe only ORB indicator you'll ever need.
- Flexible Range: Tailor the opening range (e.g., 5m, 15m, 30m) to your trading style.
- Key Levels: Auto-plots striking pink/purple support/resistance lines post-range for clear trade setups.
- Breakout Alerts: Reliable LONG/SHORT signals on 5m chart for confirmed breakouts; enable/disable as needed.
- Personalized Design: Customize line color and thickness for optimal visibility.
A friendly reminder that no tool or indicator guarantees success. Integrate this into a robust trading plan.
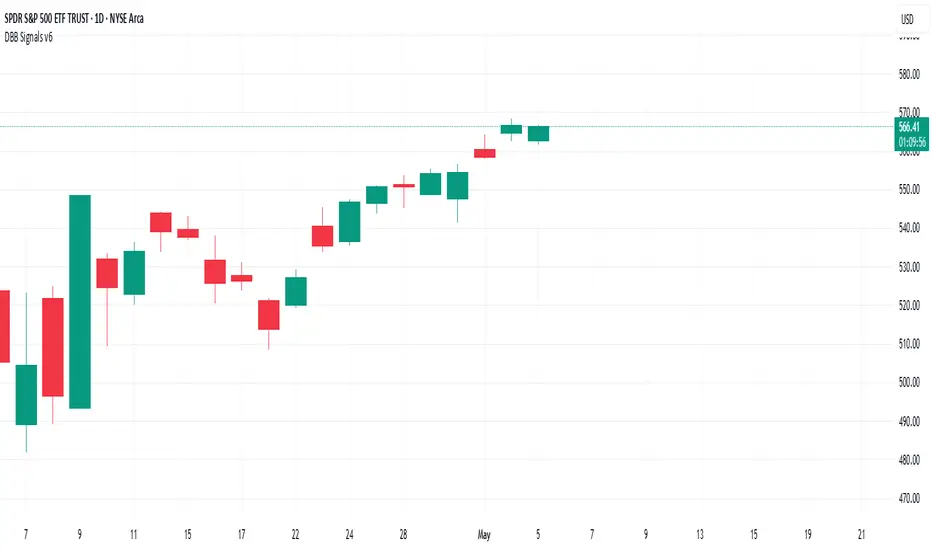
Darvas Box Breakout Signals v6 (Manus)Purpose:
This script is designed for TradingView to automatically identify potential "Darvas Boxes" on your price chart and signal when the price breaks out of these boxes.
How it Works:
Finds Highs: It looks back over a set number of bars (default is 20, but you can change this) to find the highest price point.
Confirms Box Top: It waits until the price stays below that high point for a specific number of bars (default is 3) to confirm the top of the box.
Confirms Box Bottom: After the top is confirmed, it looks for the lowest price reached and waits until the price stays above that low point for the same number of bars (3) to confirm the bottom of the box.
Draws Box (Optional): If enabled in the settings, it draws lines on the chart representing the top and bottom of the confirmed box.
What Signals It Shows:
Breakout Signal: When the price closes above the top line of a confirmed box, it plots a green upward-pointing triangle above that price bar. This suggests the stock might be starting a move higher.
Breakdown Signal: When the price closes below the bottom line of a confirmed box, it plots a red downward-pointing triangle below that price bar. This suggests the stock might be starting a move lower.
Key Features:
Uses the Darvas Box theory logic.
Provides clear visual signals for potential entries based on breakouts or breakdowns.
Allows customization of the lookback period and confirmation bars via the indicator settings.
Written in Pine Script version 6.
Remember, this script just provides signals based on price patterns; it doesn't predict the future or guarantee profits. It should be used as one tool within the larger trading plan we discussed, especially considering risk management.
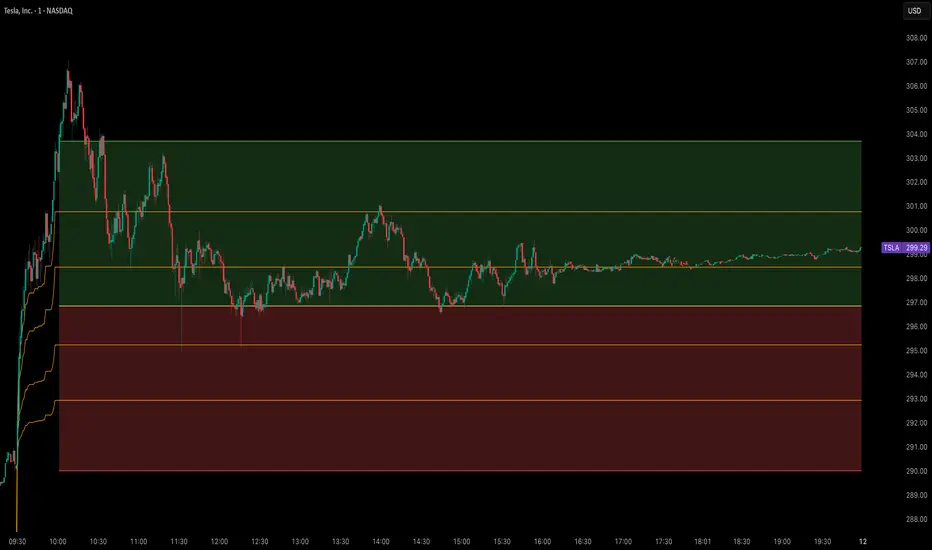
Opening Range Breakout Cloud Indicator by TenAMTraderOpening Range Breakout Cloud Indicator – by TenAMTrader
This indicator visually maps out the Opening Range of the trading day — the price high and low between a configurable start and end time (default: 9:30 AM–10:00 AM EST). It helps traders identify breakout levels, key intraday zones, and price behavior relative to the early range.
🔹 What It Shows:
Opening High, Low, and Midpoint lines for each day.
Clouds between the midpoint and high/low for visual clarity.
Optional Second Range (e.g., 9:30–9:45 AM) for more aggressive early signals.
Historical Ranges are preserved, allowing you to view previous days' levels on the chart.
Custom Alerts when price crosses the Opening High, Low, or Midpoint.
Full customization: colors, range times, and display toggles.
🔔 Use It For:
Spotting breakouts or rejections at key levels.
Finding early support/resistance zones.
Planning trades using intraday structure.
⚠️ Use this tool as part of a broader trading strategy. No indicator guarantees results — always trade at your own discretion.
BTC Breakout Alert📈 BTC Breakout & Fakeout Detector with Volume, RSI & MACD Filters
This script helps identify high-confidence breakout setups by combining price action, volume spikes, and optional momentum filters (RSI & MACD). It’s designed to alert you when Bitcoin (or any asset) breaks above a defined resistance level with strong conviction — and warns you if that move turns out to be a fakeout.
🔍 Features:
✅ Confirmed Breakout Alerts: Triggers when price closes above your set resistance level with volume ≥ 1.5× the 20-period average.
⚠️ Fakeout Detection: Highlights when price closes back below resistance within a few candles after breakout.
📊 Momentum Filters:
RSI > 50 for bullish confirmation
MACD line > signal line to support breakout momentum
🔔 Custom Alerts: Built-in alert conditions for both breakout and fakeout events.
🔼🔽 Visual Markers: Arrows plotted directly on the chart for clear entry and caution zones.
🕒 Works on all timeframes and any asset that includes volume data.
Ideal for breakout traders who want more than just a price spike — this tool ensures volume and momentum alignment, helping you reduce false signals and react with more confidence.

OpeningRange (Trading_Tix)Purpose:
The indicator highlights the high, low, and middle (50%) price levels of a specified session's opening range. These levels can serve as key support and resistance zones for trading strategies. The indicator also offers options to extend these levels beyond the session into later timeframes, making it useful for tracking breakout or trend continuation setups.
Key Features:
1. Session Detection:
The indicator identifies a specific session period using the user-defined Session Time. It calculates the start time, high, and low prices during this period:
rangeTime: Defines the session time range (default: 5:00 PM to 2:59 AM).
extendTime: Defines the extended time range where lines/backgrounds can be prolonged.
2. Opening Range Calculation:
High (high_val) and Low (low_val)**:
Tracks the highest and lowest prices during the session.
Middle Line:
A midpoint is calculated by averaging high_val and low_val.
3. Visual Elements:
Horizontal Lines:
Drawn at the high, low, and middle levels.
Customizable in width and color.
Shaded Background Box:
Covers the range between high and low prices.
The box’s color and transparency can be adjusted.
Line and Box Extension:
Optionally extends these elements into the extended time range.
4. Customization:
Users have the flexibility to:
Toggle visibility of lines, middle line, and background box.
Adjust colors, line thickness, and style.
Enable or disable the extension of lines and backgrounds into the extended period.
How It Works:
Initialization:
The script initializes variables to store range data (startTime, high_val, low_val) and drawing objects (lines, boxes).
It detects whether the current bar falls within the session (inSession) or extended timeframe (inExtend).
Plotting:
During the session:
Deletes previous lines and boxes from prior sessions.
Draws new lines at the high, low, and middle levels.
Creates a background box covering the range, if enabled.
During the extended period:
Extends the session lines and box, if the user has opted for extensions.
Updates:
Continuously adjusts the high/low values and updates the lines as new price data arrives.
Use Cases:
This indicator can be valuable for traders who:
Use the opening range to identify potential breakout zones.
Trade based on price consolidation within the range.
Want a visual representation of key price levels to plan entries and exits.
Would you like help refining this script further or adjusting its settings to match your trading style?

ZVOL — Z-Score Volume Heatmapⓩ ZVOL transforms raw volume into a statistically calibrated heatmap using Z-score thresholds. Unlike classic volume indicators that rely on fixed MA comparisons, ZVOL calculates how many standard deviations each volume bar deviates from its mean. This makes the reading adaptive across timeframes and assets, in order to distinguish meaningful crowd behavior from random volatility.
📊 The core display is a five-zone histogram, each encoded by color and statistical depth. Optional background shading mirrors these zones across the entire pane, revealing subtle compression or structural rhythm shifts across time. By grounding the volume reading in volatility-adjusted context, ZVOL inhibits impulsive trading tactics by compelling the structure, not the sentiment, to dictate the signal.
🥵 Heatmap Coloration:
🌚 Suppressed volume — congestion, coiling phases
🩱 Stable flow — early trend or resting volume
🏀 High activity — emerging pressure
💔 Extreme — possible climax or institutional print
🎗️ A dynamic Fibonacci-based 21:34-period EMA ribbon overlays the histogram. The fill area inverts color on crossover, providing a real-time read on tempo, expansion, or divergence between price structure and crowd effort.
💡 LTF Usage Suggestions:
• Confirm breakout legs when orange or red zones align with range exits
• Fade overextended moves when red bars appear into resistance
• Watch for rising EMAs and orange volume to front-run impulsive moves
• Combine with volatility suppression (e.g. ATR) to catch compression → expansion transitions
🥂 Ideal Pairings:
• OBVX Conviction Bias — to confirm directional intent behind volume shifts
• SUPeR TReND 2.718 — for directional filters
• ATR Turbulence Ribbon — to detect compression phases
👥 The OBVX Conviction Bias adds a second dimension to ZVOL by revealing whether crowd effort is aligning with price direction or diverging beneath the surface. While ZVOL identifies statistical anomalies in raw volume, OBVX tracks directional commitment using cumulative volume and moving average cross logic. Use them together to spot fake-outs, anticipate structure-confirmed breakouts, or time pullbacks with volume-based conviction.
🔬 ZVOL isn’t just a volume filter — it’s a structural lens. It reveals when crowd effort is meaningful, when it's fading, and when something is about to shift. Designed for structure-aware traders who care about context, not noise.

Adaptable Relative Momentum Index [ParadoxAlgo]The Adaptable Relative Momentum Index (RMI) by ParadoxAlgo is an advanced momentum-based indicator that builds upon the well-known RSI (Relative Strength Index) concept by introducing a customizable momentum length. This indicator measures price momentum over a specified number of periods and applies a Rolling Moving Average (RMA) to both the positive and negative price changes. The result is a versatile tool that can help traders gauge the strength of a trend, pinpoint overbought/oversold levels, and potentially identify breakout opportunities.
⸻
Smart Configuration Feature
What sets this version of the RMI apart is ParadoxAlgo’s exclusive “Smart Configuration” functionality. Instead of manually adjusting parameters, traders can simply select their Asset Class (e.g., Stocks, Forex, Futures/Indices, Crypto, Commodities) and Trading Style (e.g., Scalping, Day Trading, Swing Trading, Short-Term Investing, Long-Term Investing). Based on these selections, the indicator automatically optimizes its core parameters:
• Length – The period over which the price changes are smoothed.
• Momentum Length – The number of bars used to calculate the price change.
By automating this process, users save time on tedious trial-and-error adjustments, ensuring that the RMI’s settings are tailored to the characteristics of specific markets and personal trading horizons.
⸻
Key Features & Benefits
1. Momentum-Based Insights
• Uses RMA to smooth price movements, helping identify shifts in market momentum more clearly than a basic RSI.
• Enhanced adaptability for a wide range of asset classes and time horizons.
2. Simple Yet Powerful Configuration
• Smart Configuration automatically sets optimal parameter values for each combination of asset class and trading style.
• Eliminates guesswork and manual recalibration when switching between markets or timeframes.
3. Overbought & Oversold Visualization
• Integrated highlight zones mark potential overbought and oversold extremes (default at 80 and 20).
• Optional breakout highlighting draws attention to times when the indicator crosses these key thresholds, helping spot possible entry or exit signals.
4. Intuitive Design & Ease of Use
• Clean plotting and color-coded signal lines make it easy to interpret bullish or bearish shifts in momentum.
• Straightforward dropdown menus keep the interface user-friendly, even for novice traders.
⸻
Practical Applications
• Early Trend Detection: Spot emerging trends when the RMI transitions from oversold to higher levels or vice versa.
• Breakout Confirmation: Confirm potential breakout trades by tracking overbought/oversold breakouts alongside other technical signals.
• Support/Resistance Confluence: Combine RMI signals with horizontal support/resistance levels to reinforce trade decisions.
• Trade Timing: Quickly gauge when momentum could be shifting, helping you time entries and exits more effectively.
⸻
Disclaimer
As with any technical indicator, the Adaptable Relative Momentum Index should be used as part of a broader trading strategy that includes risk management, fundamental analysis, and other forms of technical confirmation. Past performance does not guarantee future results.
⸻
Enjoy using the Adaptable RMI and experience a more streamlined, flexible approach to momentum analysis. Feel free to explore different asset classes and trading styles to discover which configurations resonate best with your unique trading preferences.

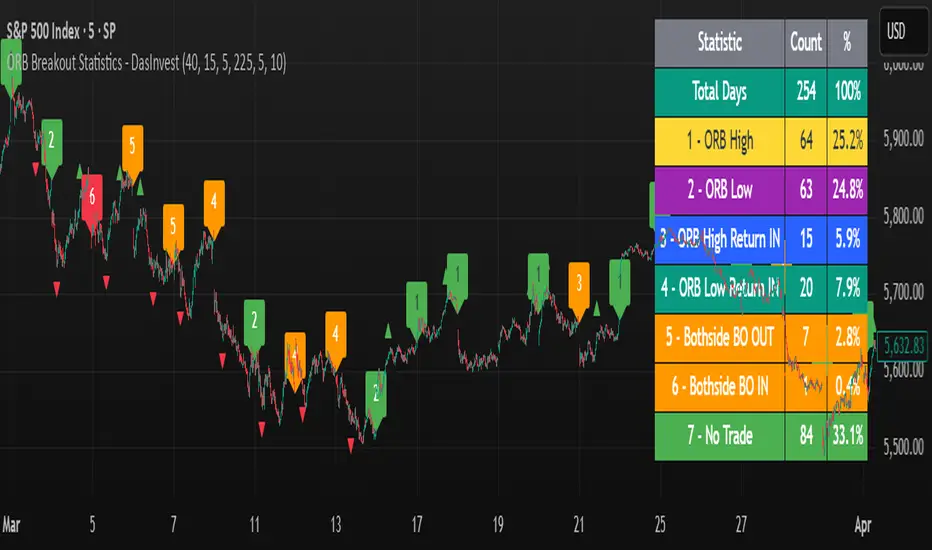
ORB Breakout Statistics with Labels and ProfitOpening Range Breakout Statistics – This indicator identifies the opening range based on user-defined inputs and detects breakouts above the high or below the low. At the end of each trading day, it classifies the session into a specific category based on price action. Additionally, it tracks profit and loss for each classification, allowing you to backtest the strategy using log files.
GLB - Green Line BreakoutThis script helps traders automatically detect Green Line Breakouts (GLBs) — a concept popularized by Dr. Eric Wish. A GLB occurs when a stock breaks out above a long-term pivot high that hasn’t been touched for a specified confirmation period (e.g., 3 months).
📌 Key Features:
Pivot High Detection based on customizable pivot strength.
Flexible Lookback Periods: Choose from 1 week to 5 years or ATH.
Confirmation Logic: Ensures the pivot remains unbroken for a set period before being marked as valid.
Breakout Detection: Marks the first breakout bar with a labeled event.
Dynamic Timeframe Support: Use daily bars or scale automatically with your chart's timeframe.
Historical Anchoring: Draws persistent lines from confirmation to breakout, helping visualize past GLBs.
🛠 Settings Include:
Pivot Strength
Timeframe Mode (Daily or Current)
Lookback Period (1W–ATH)
Confirmation Period (1W–1Y)

BB Session RangesBB Session Ranges Indicator
Overview
The Bender Bot Session Ranges indicator is a powerful tool for traders who want to visualize and analyze important market sessions throughout the trading day. This indicator identifies and tracks price ranges during specific time periods, helping you spot potential trading opportunities based on session breakouts, retests, and range comparisons.
Key Features
• Multiple Session Tracking: Monitor up to 6 different time-based ranges simultaneously (pre-configured for NY AM Open, NY PM Open, Lunch, Premarket, Midnight Open, and a custom session).
• Range Visualization: Clearly displays high and low boundaries for each session with customizable colors and line styles.
• Historical Comparison: Tracks and displays the average size of ranges over time, helping you identify when current ranges are larger or smaller than typical.
• Flexible Time Settings: Easily configure exact session times based on your trading schedule and preferred markets.
• Range Extension Options: Extend range boundaries by bars, days, or weeks to track the longer-term influence of session ranges.
• Sidecar Information Display: Optional labels show range details, including size, percentage of average, and dollar value.
How It Works
The indicator identifies specific time-based sessions (for example, the first 5 minutes of the NY market open) and tracks the high and low prices established during these periods. Once a session is complete, the range boundaries are plotted on your chart and can be extended for further analysis. The indicator calculates the current range size and compares it to historical averages, giving you context for the day’s market behavior.
Sidecar Functionality
The sidecar feature is a key aspect of this indicator that helps keep your charts clean and organized. Instead of cluttering your price action with labels and annotations directly on the ranges, the sidecar system:
• Creates a dedicated information panel offset from the price action.
• Connects to ranges with discreet connecting lines.
• Displays key statistics like range size, dollar value, and percentage of average.
• Can be positioned at custom distances from the main chart (measured in bars).
• Allows you to see important data without interfering with your price analysis.
• Can be completely disabled when you prefer minimal chart elements.
• Helps maintain visual clarity even when tracking multiple sessions simultaneously.
This design philosophy puts trader experience first by separating information display from price action analysis, giving you the best of both worlds: clean charts and detailed information.
Setup Guide
1. Choose Your Sessions: Enable or disable each of the six available ranges by setting the Max Ranges to Plot parameter (use 0 to disable a range).
2. Configure Session Times: Set exact times for each range using standard 24-hour format (for example, 0930-0935 for 9:30-9:35 AM).
3. Customize Display: Select colors, line widths, and information display options for each range.
4. Set Extension Parameters: Choose how far to extend range lines (by a number of bars, days, or weeks, or select Always for continuous extension).
5. Configure Sidecar Labels: Set the offset for the information displays (use 0 to disable sidecar labels entirely).
Trading Applications
• Identify potential support and resistance levels based on session highs and lows.
• Compare current session ranges to historical averages to gauge volatility.
• Look for breakouts from established session ranges.
• Use range extensions to anticipate potential price targets.
• Monitor multiple session ranges to identify pattern correlations.
Advanced Usage
The indicator includes fields that help you assess range size relative to past performance, including dollar value calculations. This can be particularly useful for position sizing and risk management when trading breakouts from these ranges.
Future Development
We’re actively working on expanding this indicator to include robust strategy and alert functionality. This will allow traders to:
• Backtest trading strategies based on session range breakouts and retests.
• Customize entry, exit, and risk management parameters.
• Receive real-time alerts when price interacts with significant range levels.
• Set conditional alerts based on range size compared to historical averages.
• Automate trading decisions based on your specific session-based criteria.
If these strategy and alert features would be valuable for your trading, please let us know in the comments. Your feedback directly influences our development priorities and helps us create tools that best serve the trading community.
Notes
• All times are based on the America/New_York timezone.
• The indicator dynamically adjusts to different timeframes, providing consistent results whether you’re viewing 1-minute or daily charts.
• Range calculations are based on the highs and lows established during the defined sessions.
Geometric Momentum Breakout with Monte CarloOverview
This experimental indicator uses geometric trendline analysis combined with momentum and Monte Carlo simulation techniques to help visualize potential breakout areas. It calculates support, resistance, and an aggregated trendline using a custom Geo library (by kaigouthro). The indicator also tracks breakout signals in a way that a new buy signal is triggered only after a sell signal (and vice versa), ensuring no repeated signals in the same direction.
Important:
This script is provided for educational purposes only. It is experimental and should not be used for live trading without proper testing and validation.
Key Features
Trendline Calculation:
Uses the Geo library to compute support and resistance trendlines based on historical high and low prices. The midpoint of these trendlines forms an aggregated trendline.
Momentum Analysis:
Computes the Rate of Change (ROC) to determine momentum. Breakout conditions are met only if the price and momentum exceed a user-defined threshold.
Monte Carlo Simulation:
Simulates future price movements to estimate the probability of bullish or bearish breakouts over a specified horizon.
Signal Tracking:
A persistent variable ensures that once a buy (or sell) signal is triggered, it won’t repeat until the opposite signal occurs.
Geometric Enhancements:
Calculates an aggregated trend angle and channel width (distance between support and resistance), and draws a perpendicular “breakout zone” line.
Table Display:
A built-in table displays key metrics including:
Bullish probability
Bearish probability
Aggregated trend angle (in degrees)
Channel width
Alerts:
Configurable alerts notify when a new buy or sell breakout signal occurs.
Inputs
Resistance Lookback & Support Lookback:
Number of bars to look back for determining resistance and support points.
Momentum Length & Threshold:
Period for ROC calculation and the minimum percentage change required for a breakout confirmation.
Monte Carlo Simulation Parameters:
Simulation Horizon: Number of future bars to simulate.
Simulation Iterations: Number of simulation runs.
Table Position & Text Size:
Customize where the table is displayed on the chart and the size of the text.
How to Use
Add the Script to Your Chart:
Copy the code into the Pine Script editor on TradingView and add it to your chart.
Adjust Settings:
Customize the inputs (e.g., lookback periods, momentum threshold, simulation parameters) to fit your analysis or educational requirements.
Interpret Signals:
A buy signal is plotted as a green triangle below the bar when conditions are met and the state transitions from neutral or sell.
A sell signal is plotted as a red triangle above the bar when conditions are met and the state transitions from neutral or buy.
Alerts are triggered only on the bar where a new signal is generated.
Examine the Table:
The table displays key metrics (breakout probabilities, aggregated trend angle, and channel width) to help evaluate current market conditions.
Disclaimer
This indicator is experimental and provided for educational purposes only. It is not intended as a trading signal or financial advice. Use this script at your own risk, and always perform your own research and testing before using any experimental tools in live trading.
Credit
This indicator uses the Geo library by kaigouthro. Special thanks to Cryptonerds and @Hazzantazzan for their contributions and insights.

Swing Breakout System (SBS)The Swing Breakout Sequence (SBS) is a trading strategy that focuses on identifying high-probability entry points based on a specific pattern of price swings. This indicator will identify these patterns, then draw lines and labels to show confirmation.
How To Use:
The indicator will show both Bullish and Bearish SBS patterns.
Bullish Pattern is made up of 6 points: Low (0), HH (1), LL (2 | but higher than initial Low), New HH (3), LL (5), LL again (5)
Bearish Patten is made up of 6 points: High (0), LL (1), HH (2 | but lower than initial high), New LL (3), HH (5), HH again (5)
A label with an arrow will appear at the end, showing the completion of a successful sequence
Idea behind the strategy:
The idea behind this strategy, is the accumulation and then manipulation of liquidity throughout the sequence. For example, during SBS sequence, liquidity is accumulated during step (2), then price will push away to make a new high/low (step 3), after making a minor new high/low, price will retrace breaking the key level set up in step (2). This is price manipulating taking liquidity from behind high/low from step (2). After taking liquidity price the idea is price will continue in the original direction.
Step 0 - Setting up initial direction
Step 1 - Setting up initial direction
Step 2 - Key low/high establishing liquidity
Step 3 - Failed New high/low
Step 4 - Taking liquidity from step (2)
Step 5 - Taking liquidity from step 2 and 4
Pattern Detection:
- Uses pivot high/low points to identify swing patterns
- Stores 6 consecutive swing points in arrays
- Identifies two types of patterns:
1. Bullish Pattern: A specific sequence of higher lows and higher highs
2. Bearish Pattern: A specific sequence of lower highs and lower lows
Note: Because the indicator is identifying a perfect sequence of 6 steps, set ups may not appear frequently.
Visualization:
- Draws connecting lines between swing points
- Labels each point numerically (optional)
- Shows breakout arrows (↑ for bullish, ↓ for bearish)
- Generates alerts on valid breakouts
User Input Settings:
Core Parameters
1. Pivot Lookback Period (default: 2)
- Controls how many bars to look back/forward for pivot point detection
- Higher values create fewer but more significant pivot points
2. Minimum Pattern Height % (default: 0.1)
- Minimum required height of the pattern as a percentage of price
- Filters out insignificant patterns
3. Maximum Pattern Width (bars) (default: 50)
- Maximum allowed width of the pattern in bars
- Helps exclude patterns that form over too long a period

Silver Bullet ICT Strategy [TradingFinder] 10-11 AM NY Time +FVG🔵 Introduction
The ICT Silver Bullet trading strategy is a precise, time-based algorithmic approach that relies on Fair Value Gaps and Liquidity to identify high-probability trade setups. The strategy primarily focuses on the New York AM Session from 10:00 AM to 11:00 AM, leveraging heightened market activity within this critical window to capture short-term trading opportunities.
As an intraday strategy, it is most effective on lower timeframes, with ICT recommending a 15-minute chart or lower. While experienced traders often utilize 1-minute to 5-minute charts, beginners may find the 1-minute timeframe more manageable for applying this strategy.
This approach specifically targets quick trades, designed to take advantage of market movements within tight one-hour windows. By narrowing its focus, the Silver Bullet offers a streamlined and efficient method for traders to capitalize on liquidity shifts and price imbalances with precision.
In the fast-paced world of forex trading, the ability to identify market manipulation and false price movements is crucial for traders aiming to stay ahead of the curve. The Silver Bullet Indicator simplifies this process by integrating ICT principles such as liquidity traps, Order Blocks, and Fair Value Gaps (FVG).
These concepts form the foundation of a tool designed to mimic the strategies of institutional players, empowering traders to align their trades with the "smart money." By transforming complex market dynamics into actionable insights, the Silver Bullet Indicator provides a powerful framework for short-term trading success
Silver Bullet Bullish Setup :
Silver Bullet Bearish Setup :
🔵 How to Use
The Silver Bullet Indicator is a specialized tool that operates within the critical time windows of 9:00-10:00 and 10:00-11:00 in the forex market. Its design incorporates key principles from ICT (Inner Circle Trader) methodology, focusing on concepts such as liquidity traps, CISD Levels, Order Blocks, and Fair Value Gaps (FVG) to provide precise and actionable trade setups.
🟣 Bullish Setup
In a bullish setup, the indicator starts by marking the high and low of the session, serving as critical reference points for liquidity. A typical sequence involves a liquidity grab below the low, where the price manipulates retail traders into selling positions by breaching a key support level.
This movement is often orchestrated by smart money to accumulate buy orders. Following this liquidity grab, a market structure shift (MSS) occurs, signaled by the price breaking the CISD Level—a confirmation of bullish intent. The indicator then highlights an Order Block near the CISD Level, representing the zone where institutional buying is concentrated.
Additionally, it identifies a Fair Value Gap, which acts as a high-probability area for price retracement and trade entry. Traders can confidently take long positions when the price revisits these zones, targeting the next significant liquidity pool or resistance level.
Bullish Setup in CAPITALCOM:US100 :
🟣 Bearish Setup
Conversely, in a bearish setup, the price manipulates liquidity by creating a false breakout above the high of the session. This move entices retail traders into long positions, allowing institutional players to enter sell orders.
Once the price reverses direction and breaches the CISD Level to the downside, a change of character (CHOCH) becomes evident, confirming a bearish market structure. The indicator highlights an Order Block near this level, indicating the origin of the institutional sell orders, along with an associated FVG, which represents an imbalance zone likely to be revisited before the price continues downward.
By entering short positions when the price retraces to these levels, traders align their strategies with the anticipated continuation of bearish momentum, targeting nearby liquidity voids or support zones.
Bearish Setup in OANDA:XAUUSD :
🔵 Settings
Refine Order Block : Enables finer adjustments to Order Block levels for more accurate price responses.
Mitigation Level OB : Allows users to set specific reaction points within an Order Block, including: Proximal: Closest level to the current price. 50% OB: Midpoint of the Order Block. Distal: Farthest level from the current price.
FVG Filter : The Judas Swing indicator includes a filter for Fair Value Gap (FVG), allowing different filtering based on FVG width: FVG Filter Type: Can be set to "Very Aggressive," "Aggressive," "Defensive," or "Very Defensive." Higher defensiveness narrows the FVG width, focusing on narrower gaps.
Mitigation Level FVG : Like the Order Block, you can set price reaction levels for FVG with options such as Proximal, 50% OB, and Distal.
CISD : The Bar Back Check option enables traders to specify the number of past candles checked for identifying the CISD Level, enhancing CISD Level accuracy on the chart.
🔵 Conclusion
The Silver Bullet Indicator is a cutting-edge tool designed specifically for forex traders who aim to leverage market dynamics during critical liquidity windows. By focusing on the highly active 9:00-10:00 and 10:00-11:00 timeframes, the indicator simplifies complex market concepts such as liquidity traps, Order Blocks, Fair Value Gaps (FVG), and CISD Levels, transforming them into actionable insights.
What sets the Silver Bullet Indicator apart is its precision in detecting false breakouts and market structure shifts (MSS), enabling traders to align their strategies with institutional activity. The visual clarity of its signals, including color-coded zones and directional arrows, ensures that both novice and experienced traders can easily interpret and apply its findings in real-time.
By integrating ICT principles, the indicator empowers traders to identify high-probability entry and exit points, minimize risk, and optimize trade execution. Whether you are capturing short-term price movements or navigating complex market conditions, the Silver Bullet Indicator offers a robust framework to enhance your trading performance.
Ultimately, this tool is more than just an indicator; it is a strategic ally for traders who seek to decode the movements of smart money and capitalize on institutional strategies. With the Silver Bullet Indicator, traders can approach the market with greater confidence, precision, and profitability.

Bullseye NYSE 1st5mThis script, "BullseyeNYSE1st5m," is a TradingView indicator designed to highlight the high and low price levels during the first 5 minutes of the NYSE trading session. It works as follows:
1. **Identify NYSE Trading Hours**: The script identifies bars that fall within NYSE trading hours, specifically focusing on the first five minutes after the market opens.
2. **Calculate First 5-Minute High and Low**: During the first five minutes of the trading day, the script captures and updates the high and low prices, storing these values for the remainder of the session.
3. **Plot High and Low Levels**: The high and low values from the first five minutes are plotted as lines on the chart in yellow. This helps traders quickly identify the initial range set by the market.
4. **Fill the Area Between High and Low**: The area between the high and low levels is filled with a translucent yellow color to visually emphasize the first five-minute range.
5. **Alerts for Breakouts**: Alerts are set to notify the user when the price closes above or below the first five-minute range. This helps traders stay informed of potential breakout opportunities beyond this key opening range.
This indicator is useful for day traders looking to leverage the first few minutes of NYSE trading to identify early support and resistance levels and to spot breakout opportunities.
Swing Data - Optimized SK60
v. 1.83
indicator adjust to time frame.
This Pine Script code generates a trading indicator that calculates and displays various data points on a stock, including Average Daily Range (ADR%), Market Cap, Current Volume, Free Cash Flow (FCF) Yield %, Float %, whether moving averages (MA) are inline, and the moving averages of certain indexes like the Russell 2000, Nasdaq 100, and S&P 500. Here’s a breakdown of the script and how to use it.
Key Concepts and Functionality
Indicator Definition: The script begins by defining the indicator with a title (Swing Data - Optimized ADR%...) and short title (Optimized Swing Data), which will appear on the chart. The overlay=true command ensures that the indicator is drawn on the main price chart rather than in a separate pane.
Sector and Ticker:
s = syminfo.tickerid: This stores the ticker ID of the stock being analyzed.
sector = syminfo.sector: This retrieves the sector to which the stock belongs. If the sector information is unavailable, it assigns the value "N/A".
Dynamic Inputs: Several input parameters allow you to customize the indicator:
adrp_len: Defines the length for ADR% calculation.
len: Defines the moving average length for volume.
tbl_size, bg_col, and txt_col: Control the table's appearance, including the size of the text, background color, and text color.
posTable: Allows positioning of the table on the chart. Options include top-left, top-right, bottom-left, and bottom-right.
show_empty_row: Adds an empty row above the displayed values if set to true.
Volume Unit Handling (f_vol_unit): This function converts volume into appropriate units, like thousands (K), millions (M), or billions (B), to make volume easier to read. It’s applied to both the current volume and the average daily volume.
Moving Averages for Indexes (f_ma_indexes): This function calculates the 10-day, 20-day, 50-day, and 200-day simple moving averages (SMAs) for an index (such as Russell 2000 or Nasdaq 100). It also checks whether the MAs are inline, meaning if shorter MAs are above longer MAs, which is usually a bullish sign. It returns the result as "YES" or "NO" and assigns a color (green for yes, red for no).
Volume and Price Data: The script fetches several important data points:
vol_display: Current volume in human-readable units.
avgDaVol: Average daily volume.
adrp: Average Daily Range (ADR%) over a specified length.
fcf_yield_percent: Free Cash Flow Yield percentage.
ADR Calculation: The ADR% is calculated using the formula 100 * (ta.sma(high / low, adrp_len) - 1) and is fetched for the daily timeframe.
FCF Yield Color Logic: The Free Cash Flow yield is classified into three categories:
Green: Undervalued if FCF yield is over 5%.
Yellow: Neutral between 2-5%.
Red: Overvalued if below 2%.
MA's Inline Check for the Stock: The script checks if the stock's 10-day, 20-day, 50-day, and 200-day moving averages are inline (i.e., in a bullish alignment where shorter MAs are higher than longer MAs).
Float % Calculation: The float percentage is calculated as the ratio of float shares outstanding (FSO) to total shares outstanding (TSO). The color is set based on its breakout potential:
Red: Below 20% (manipulation risk).
Green: 20-50% (ideal breakout range).
Yellow: Above 50%.
Price Change %: The script calculates the percentage change in price between the current and previous close.
Volume Color Logic: The color of the "Current Volume" is based on whether it indicates buying or selling pressure:
Green: Volume is higher than average, and the price increased more than ADR%.
Red: Volume is higher than average, and the price decreased more than ADR%.
Yellow: Default color if neither condition is met.
Market Cap: The market cap is calculated by multiplying the total shares outstanding (TSO) by the current close price, and it’s displayed in a human-readable unit (K, M, or B).
Display Table:
A table is created to display all the calculated data in an organized manner. It includes fields for Market Cap, Avg Volume, ADR%, Current Volume, FCF Yield %, Float %, MA's Inline status, and Sector. Additionally, it shows the inline status for the Russell 2000, Nasdaq 100, and S&P 500.
How to Use:
Customization: Users can customize the inputs, including the length of ADR% and volume moving averages, and adjust the table size, text color, and position.
Visualization: The indicator provides a comprehensive table on the chart showing key data points for technical analysis, including whether moving averages are inline for both the stock and major indexes.
This indicator is particularly useful for swing traders or technical analysts who want a clear overview of a stock’s volume, volatility (via ADR%), and the alignment of moving averages, combined with fundamental metrics like market cap and free cash flow yield.

The real breakout indicator CCI + Money Flow + Buy / SellComponents of the indicator
1. CCI (Commodity Channel Index)
The CCI component measures the deviation of the price from its statistical average. It is used to identify overbought or oversold conditions and is integrated into the trend logic to determine potential trend reversals. High values may indicate overbought conditions, while low values could signify oversold situations.
Detailed
The CCI (Commodity Channel Index) used in "The Real Breakout Indicator Hawk" is an enhanced version compared to the traditional CCI, offering several advantages:
1. Weighting and Smoothing Mechanism
In this version, the CCI values are weighted and smoothed using custom parameters (c1, c2, c3), which allows for greater flexibility in adjusting the sensitivity of the CCI to market conditions. This smoothing reduces noise and provides clearer signals compared to the standard CCI, which can be prone to whipsaws in volatile markets.
2. Multi-level Calculation
The indicator uses an array-based approach to calculate multiple variations of CCI values (with p as the parameter for different levels of calculation), which is then combined to create a more robust signal. This multi-level approach allows for capturing different market cycles, unlike the traditional CCI that only uses a single period for calculation.
3. Integration with Moving Averages and Trend Detection
Unlike the original CCI, which is often used in isolation, this version integrates with the trend detection logic by combining it with moving averages and money flow. The enhanced CCI contributes to the broader trend analysis, ensuring that buy/sell signals are not just based on CCI overbought/oversold levels but also validated by moving averages and slope calculations.
4. Trend-Weighted CCI
This version adds weight to recent price action trends, making it more adaptive to current market momentum. The CCI values are influenced by recent high and low prices, adding a trend-following aspect that is missing from the original CCI, which treats all price deviations equally.
This image of EURAD shows for example that when CCI component is green a strong trend is detected which can hold for up to 10 days in this example, ideal for swing trades;
EURAUD 2H
5. Improved Overbought/Oversold Detection
The script incorporates a dynamic overbought/oversold detection zone based on the enhanced CCI. It accounts for market volatility, allowing it to adjust its thresholds (such as the 200 level) more effectively in different market environments. This makes the enhanced CCI better suited for varying market conditions compared to the fixed thresholds of the original CCI.
You can see that the red diamond signal is generated at the absolute top of the price range after which price started to reverse, the detection is based on a cross over value together with Money Flow strength
BTCUSDT 2H
6. Strong Buy/Sell Confirmation
The enhanced CCI works in tandem with other components like Money Flow and Moving Averages to confirm buy or sell signals. This cross-validation makes the indicator less reliant on CCI alone and ensures that the signals generated are stronger and less prone to false positives, which is a common issue with the standalone CCI.
The green diamond buy signal in a strong downtrend is mostly a short retrace of price before continuing down further, yo can use this as an entry signal after the bounce up into an FVG for example. However when price is at a support, meaning price is not moving down further and this occurs this could be a potential reversal signal as shown on the right side on the chart below. FVG is not respected, retested and price continues up.
BTCUSDT 2H
Summary:
In summary, the enhanced CCI in this indicator improves over the original CCI by providing better noise reduction, multi-level analysis, trend integration, and adaptability to different market conditions. These improvements lead to more reliable and actionable trading signals.
2. Money Flow (MF) www.tradingview.com
The Money Flow component tracks the flow of capital in and out of an asset. Positive values indicate strong buying pressure, while negative values show selling pressure. This is smoothed to avoid noise and is used to confirm strong buy or sell conditions.
The Money Flow (MF) in "The Real Breakout Indicator Hawk" measures the flow of capital into or out of an asset, helping to assess the underlying buying or selling pressure in the market.
1. Positive Money Flow (Buying Pressure)
When the MF is positive, it indicates that more money is flowing into the asset, which suggests strong buying interest. This helps confirm that a price increase or breakout to the upside is supported by demand.
2. Negative Money Flow (Selling Pressure)
A negative MF indicates that capital is leaving the asset, reflecting selling pressure. This is a sign that the market is under bearish conditions, and prices are likely to decline or break down.
3. Confirmation of Buy and Sell Signals
The MF is used to confirm buy and sell signals generated by other components of the indicator. When the MF aligns with other bullish signals, it strengthens the buy condition, and similarly, when the MF shows strong selling pressure, it reinforces a sell signal.
4. Filtering Noise
The MF is smoothed to filter out noise, ensuring that only significant movements in buying or selling pressure are considered. This helps avoid false signals and makes the MF a reliable tool for detecting true market strength.
5. Range Sensitivity
The MF operates within defined ranges, ensuring that buy or sell signals are only triggered when the flow of money is strong enough, adding precision to signal generation.
In summary, the Money Flow component is crucial for validating market direction, enhancing signal reliability, and helping traders make more informed decisions based on the underlying capital movement in the market.
3. Moving Averages (MA)
Multiple types of moving averages (SMA, EMA, HMA, etc.) are used to smooth price action and highlight the trend direction. The script supports different types of moving averages, and their slopes are calculated to assist in identifying changes in trend momentum.
The Moving Averages (MA) section of "The Real Breakout Indicator Hawk" plays a critical role in smoothing price data, identifying trends, and generating buy/sell signals. Here’s a breakdown of what it does and how you can use it effectively without diving into the script:
1. Moving Average Types
This section allows the user to choose from different types of moving averages, each with unique characteristics:
SMA (Simple Moving Average): Takes the average of closing prices over a specific period. It’s slower and better suited for detecting long-term trends.
EMA (Exponential Moving Average): Gives more weight to recent prices, making it more responsive to new price action and suitable for short-term trading.
HMA (Hull Moving Average): A smoother and faster moving average, useful for reducing lag in fast-moving markets.
LVMA (Linear Weighted Moving Average): Places the most weight on recent prices, making it even more responsive than EMA.
Alma (Arnaud Legoux Moving Average): A smoother version that reduces noise while maintaining responsiveness to recent price action.
2. Smoothing and Trend Detection
The moving average smooths out price data to remove small fluctuations and focuses on the overall trend. When prices are trading above the moving average, it suggests that the market is in an uptrend. When prices are below the moving average, it indicates a downtrend.
3. Trend Confirmation
The moving average serves as a confirmation tool. When the price crosses above the moving average, it could signal the start of a bullish trend, and when the price crosses below, it may indicate the beginning of a bearish trend.
4. Buy and Sell Signals
Buy Signal: The system detects a buy signal when:
The moving average crosses above 0, indicating a potential upward momentum.
Other indicators like Money Flow and CCI align to confirm the trend.
Sell Signal: A sell signal is triggered when:
The moving average crosses below 0, signaling a potential downtrend.
This signal is further validated by other components such as Money Flow and CCI to reduce false signals.
5. Using Moving Averages in Trading
Crossover Strategy: One of the simplest ways to use moving averages is by employing a crossover strategy. For instance:
When the shorter-term moving average (e.g., 20-period) crosses above a longer-term moving average (e.g., 50-period), this is a bullish crossover, indicating a buy signal.
Conversely, when the shorter-term moving average crosses below the longer-term moving average, this is a bearish crossover, indicating a sell signal.
Trend Following: If you’re trading with the trend, you can use a moving average to stay in the trade as long as the price remains above (for long positions) or below (for short positions) the moving average.
Support and Resistance: Moving averages can also act as dynamic support or resistance levels. For example, in an uptrend, the CCI might bounce off the moving average, offering a good entry point for a long position. In a downtrend, the moving average could act as resistance where prices may reverse, offering a shorting opportunity.
To use the MA section effectively:
Choose the right type of moving average based on your trading style (e.g., use EMA for faster response or SMA for long-term trends).
Watch for crossovers as buy/sell signals, especially in combination with other indicators.
Follow the trend by observing whether the price is above or below the moving average.
Use the moving average as a dynamic support/resistance level to find optimal entry/exit points.
This approach makes the moving average a versatile tool for identifying trends, refining entry and exit points, and confirming overall market direction.
an example when MA crosses below 0, keep in mind that when it it starts curving up and turning green there is a reversal brewing, this could take time...
BTCUSDT 2H
4. Buy Signals
Buy signals are generated when the moving average crosses up, and the Money Flow and other trend-based conditions are met, including CCI levels confirming the strength of the breakout. Additionally, slope calculations and other momentum indicators provide extra confirmation for entries.
5. Sell Signals
Sell signals occur when the moving average crosses down, combined with negative Money Flow, confirming downward pressure. Other trend-based conditions, including the CCI, must also align to validate the signal, and slope calculations ensure that momentum is on the sell side.
6. Slope and Trend Detection
The script includes calculations for the slope of price action over a lookback period to measure trend strength and direction. The slope is normalized to help identify when the market is gaining or losing momentum. This slope is used in conjunction with the moving averages and Money Flow to give more accurate trend signals.
The Slope and Trend Detection component in "The Real Breakout Indicator Hawk" is designed to measure the direction and strength of the market’s trend by calculating the slope of the price action over a specific period. This helps to identify whether the market is gaining or losing momentum, and it is a key element in refining buy/sell signals.
Here’s how the Slope and Trend Detection works and how you can use it effectively without diving into the script:
1. Slope Calculation
Slope is essentially the rate of change of the moving average (or price) over a given number of bars. It measures how steeply the price is moving up or down.
The script calculates the slope by measuring the difference between the moving average over a defined number of bars (e.g., 12 bars in this case). A larger slope indicates a stronger trend, while a smaller slope suggests a weaker or consolidating trend.
2. Normalized Slope
The slope is normalized, meaning it is adjusted to fall within a range that makes it easier to compare across different time frames and markets. This normalization helps to gauge whether the slope is strong or weak relative to historical data.
Positive slopes (above 0) indicate an uptrend or rising price momentum, while negative slopes (below 0) indicate a downtrend or falling price momentum.
3. Trend Detection
The slope of the moving average is used to detect the current trend:
If the slope is positive, the market is in an uptrend.
If the slope is negative, the market is in a downtrend.
The stronger the slope (the steeper it is), the stronger the trend. A small slope indicates a weak trend or consolidation.
4. Slope Thresholds
The system uses thresholds to determine the significance of the slope. These thresholds are set as upper and lower bounds:
Upper Threshold: If the slope exceeds this threshold, the trend is considered strong, and it could trigger a buy signal.
Lower Threshold: If the slope falls below this threshold (into the negative range), it indicates a strong downtrend, and it could trigger a sell signal.
These thresholds help filter out weak or false signals that occur in sideways or low-momentum markets.
5. Positive and Negative Slope Arrays
The system keeps track of both positive and negative slopes over a defined lookback period (e.g., 500 bars). By storing these values, it creates a historical context that helps to assess the current slope in relation to past price movements.
It calculates the standard deviation and the average of these slopes to dynamically adjust the thresholds for each market condition, making the trend detection more adaptive to different types of assets or market phases.
6. Using Slope and Trend Detection in Trading
Buy Signal with Positive Slope: When the slope is positive and exceeds a certain threshold, it confirms that the market is in a strong uptrend. This can be used as a signal to enter a long position or add to existing long trades.
Sell Signal with Negative Slope: When the slope turns negative and falls below the lower threshold, it signals a strong downtrend, indicating a potential short-selling opportunity or the time to exit long positions.
Avoiding Flat Markets: If the slope remains close to zero (neither strongly positive nor negative), it suggests a lack of clear trend or a consolidating market. In these conditions, it might be better to avoid taking new trades or use additional filters to confirm signals.
7. Slope-Based Trend Strength Indicator
You can also use the slope as a measure of trend strength:
Strong Trend: When the slope is steep (either positive or negative), it indicates strong momentum, and you can be more confident in holding a trade in that direction.
Weak Trend or Consolidation: When the slope is flat, it indicates weak price momentum, which may signal a period of consolidation or indecision in the market.
8. Visual Representation
The slope is often visually represented as a gradient or line that fluctuates around a central point (usually zero). Positive values are shown in one color (e.g., green for an uptrend), while negative values are shown in another color (e.g., red for a downtrend). This allows traders to quickly identify the current trend direction and its strength.
Summary:
To use Slope and Trend Detection effectively:
Monitor the slope to determine the trend direction (positive = uptrend, negative = downtrend).
Look for thresholds to identify strong trends. For instance, a steep positive slope signals a strong uptrend, while a steep negative slope signals a strong downtrend.
Use slope changes to confirm buy/sell signals. For example, if you receive a buy signal and the slope is positive and increasing, it confirms that momentum is behind the trade.
Avoid low-slope periods when the slope is close to zero, indicating a lack of trend or sideways market conditions.
This approach helps traders stay on the right side of the trend while avoiding periods of low momentum, enhancing the accuracy of trade signals.
7. Banker Fund Flow Trend
This component identifies potential large institutional moves by tracking specific patterns in price and volume data. When the institutional or "banker" entry or exit conditions are met, it highlights these moments with candles and generates alerts.
The Banker Fund Flow Trend in "The Real Breakout Indicator Hawk" helps detect the flow of institutional (or "smart money") into and out of the market by tracking price trends and large player activity. It uses red and yellow candles to signal when institutional money is influencing the market.
Key Points:
Yellow Candles (Banker Entry):
A yellow candle is plotted when institutional money starts flowing into the market.
This signals a potential buy opportunity, as large market players are likely pushing prices upward.
Red Candles (Banker Exit):
A red candle appears when institutional money starts exiting the market.
This is a signal to consider selling or exiting long positions, as institutional selling could drive prices lower.
Usage:
Yellow candles: Use these as signals to enter long trades or add to existing positions, confirming upward momentum driven by institutional buyers.
Red candles: Treat these as signals to exit long trades or consider short positions, as institutional selling may lead to further downside.
BTCUSDT 2H
The yellow and red candles provide clear, actionable signals for aligning trades with institutional flows, ensuring you’re following the "smart money."
8. Dynamic Buy/Sell Calculations
A dynamic component is designed to refine the buy and sell signals further based on additional conditions like price patterns, volatility, and Money Flow. This ensures that signals are more responsive to changing market conditions.
The Dynamic Buy/Sell Calculations in "The Real Breakout Indicator Hawk" are designed to refine entry and exit points for trades by using additional conditions beyond simple crossovers. These calculations adapt to the current market conditions, making them more responsive to changes in volatility, trend strength, and momentum.
Key Features:
Dynamic Buy Calculation:
The indicator generates a buy signal when multiple conditions align. These conditions include the money flow (MF) being within a favorable range, the moving average (MA) confirming upward momentum, and the CCI and other trend components indicating strength.
This makes the buy signal more reliable, as it considers multiple aspects of market behavior (price, momentum, and money flow) to avoid false entries.
Dynamic Sell Calculation:
Similarly, the sell signal is triggered when the dynamic conditions indicate downward momentum.
This includes:
The moving average crossing down.
Negative money flow, suggesting selling pressure.
Other trend signals confirming a bearish move.
The dynamic nature of these conditions ensures that sell signals are only generated when there’s a high probability of continued downside movement.
Adaptive to Market Conditions:
The dynamic nature of these calculations means that the buy/sell signals adapt to market changes, like volatility spikes or sudden trend reversals. Instead of relying on static conditions, the system adjusts to current price movements and volatility.
Avoiding Noise:
By adding multiple filters like MF thresholds, slope, and moving averages, the dynamic calculations help reduce false signals that occur in noisy, sideways markets. This helps traders avoid entering trades during periods of low momentum or unclear trends.
How to Use:
Buy Signals: Use these signals to enter long trades when the dynamic conditions align, confirming that upward momentum is strong and backed by institutional flows.
BTCUSDT 2H
Aqua marker/cross signals (price manipulation/continuation)
BTCUSDT 2H
Sell Signals: Use the sell signals to exit long positions or enter short trades when the market shows signs of bearish momentum, confirmed by multiple conditions like MA crossovers and negative money flow.
BTCUSDT 2H
In summary, the Dynamic Buy/Sell Calculations provide a more sophisticated approach to generating trade signals by combining various trend and momentum indicators, helping traders make more informed decisions in different market conditions.
This part of the code is identifying two key trading signals: moments to buy and moments to sell based on the behavior of a calculated trend line.
Buy Condition:
The system looks for a situation where the trend has been moving downward but has started to reverse upward. Specifically, it checks if the trend was declining a little while ago, then stopped falling, and is now starting to rise. If these conditions are met and the trend is still below a certain level, the system considers this a possible time to buy.
Sell Condition:
The opposite happens for selling. The system monitors for a situation where the trend has been moving upward but starts to turn downward. It checks if the trend was rising, leveled off, and now seems to be starting to fall. If these conditions are met and the trend is above a certain level, this could indicate a good time to sell.
Visual Markers:
To help the user easily see these signals on a chart, the system places symbols at specific points. A marker appears on the chart where the conditions for buying or selling are met, allowing the trader to quickly spot potential entry or exit points in the market.
In summary, this logic is designed to detect possible changes in trend direction and signal appropriate times to consider buying or selling, with clear visual markers on the chart for quick identification.
9. Alerts for Buy and Sell
The indicator provides built-in alert conditions for both buy and sell signals. When these conditions are met, the system generates alerts, making it suitable for automated monitoring.
Each of these components works together to detect potential breakout opportunities, trend continuations, and reversals, making the indicator suitable for both short-term and long-term trading strategies.

20-day High BreakoutOverview:
The 20-day High Breakout Indicator is a very simple yet powerful tool designed for traders seeking to capitalize on significant price movements in the stock market. This indicator identifies potential buy and sell signals based on a stock's 20-day high breakout levels, making it an essential addition to your trading strategy.
Key Features:
Swing Period Input: Customize the swing period to your preferred number of days, with a default of 20 days, allowing flexibility based on your trading style.
Trailing Stop Level: Automatically calculates the trailing stop level based on the highest high and lowest low within the defined swing period, helping to manage risk and lock in profits.
Buy and Sell Signals: Generates clear buy signals when the price crosses above the trailing stop level and sell signals when the price crosses below, enabling timely entries and exits.
Visual Indicators: Plots buy signals as green upward triangles below the bars and sell signals as red downward triangles above the bars, providing easy-to-interpret visual cues directly on the chart.
How It Works:
Resistance and Support Levels: The indicator calculates the highest high (resistance) and lowest low (support) over the defined swing period.
Swing Direction: It determines the market direction by comparing the current closing price to the previous resistance and support levels.
Trailing Stop Calculation: Depending on the market direction, the trailing stop level is set to either the support or resistance level.
Signal Generation: Buy and sell signals are generated based on the crossover of the closing price and the trailing stop level, filtered to ensure only valid signals are displayed.
Visual Representation: The trailing stop level is plotted as a line, and buy/sell signals are marked with respective shapes for easy identification.
Usage:
Trend Following: Ideal for traders looking to follow trends and catch significant breakouts in the stock price.
Risk Management: Helps in managing risk by providing a trailing stop level that adjusts with market movements.
Visual Clarity: The clear visual signals make it easy for traders to interpret and act upon the indicator's signals.
Add the 20-day High Breakout Indicator to your TradingView charts to enhance your trading strategy and gain an edge in identifying profitable trading opportunities.

KillZones + ACD Fisher [TradingFinder] Sessions + Reversal Level🔵 Introduction
🟣 ACD Method
"The Logical Trader" opens with a thorough exploration of the ACD Methodology, which focuses on pinpointing particular price levels associated with the opening range.
This approach enables traders to establish reference points for their trades, using "A" and "C" points as entry markers. Additionally, the book covers the concept of the "Pivot Range" and how integrating it with the ACD method can help maximize position size while minimizing risk.
🟣 Session
The forex market is operational 24 hours a day, five days a week, closing only on Saturdays and Sundays. Typically, traders prefer to concentrate on one specific forex trading session rather than attempting to trade around the clock.
Trading sessions are defined time periods when a particular financial market is active, allowing for the execution of trades.
The most crucial trading sessions within the 24-hour cycle are the Asia, London, and New York sessions, as these are when substantial money flows and liquidity enter the market.
🟣 Kill Zone
Traders in financial markets earn profits by capitalizing on the difference between their buy/sell prices and the prevailing market prices.
Traders vary in their trading timelines.Some traders engage in daily or even hourly trading, necessitating activity during periods with optimal trading volumes and notable price movements.
Kill zones refer to parts of a session characterized by higher trading volumes and increased price volatility compared to the rest of the session.
🔵 How to Use
🟣 Session Times
The "Asia Session" comprises two parts: "Sydney" and "Tokyo." This session begins at 23:00 and ends at 06:00 UTC. The "Asia KillZone" starts at 23:00 and ends at 03:55 UTC.
The "London Session" includes "Frankfurt" and "London," starting at 07:00 and ending at 14:25 UTC. The "London KillZone" runs from 07:00 to 09:55 UTC.
The "New York" session starts at 14:30 and ends at 19:25 UTC, with the "New York am KillZone" beginning at 14:30 and ending at 22:55 UTC.
🟣 ACD Methodology
The ACD strategy is versatile, applicable to various markets such as stocks, commodities, and forex, providing clear buy and sell signals to set price targets and stop losses.
This strategy operates on the premise that the opening range of trades holds statistical significance daily, suggesting that initial market movements impact the market's behavior throughout the day.
Known as a breakout strategy, the ACD method thrives in volatile or strongly trending markets like crude oil and stocks.
Some key rules for employing the ACD strategy include :
Utilize points A and C as critical reference points, continually monitoring these during trades as they act as entry and exit markers.
Analyze daily and multi-day pivot ranges to understand market trends. Prices above the pivots indicate an upward trend, while prices below signal a downward trend.
In forex trading, the ACD strategy can be implemented using the ACD indicator, a technical tool that gauges the market's supply and demand balance. By evaluating trading volume and price, this indicator assists traders in identifying trend strength and optimal entry and exit points.
To effectively use the ACD indicator, consider the following :
Identifying robust trends: The ACD indicator can help pinpoint strong, consistent market trends.
Determining entry and exit points: ACD generates buy and sell signals to optimize trade timing.
Bullish Setup :
When the "A up" line is breached, it’s wise to wait briefly to confirm it’s not a "Fake Breakout" and that the price stabilizes above this line.
Upon entering the trade, the most effective stop loss is positioned below the "A down" line. It's advisable to backtest this to ensure the best outcomes. The recommended reward-to-risk ratio for this strategy is 1, which should also be verified through backtesting.
Bearish Setup :
When the "A down" line is breached, it’s prudent to wait briefly to ensure it’s not a "Fake Breakout" and that the price stabilizes below this line.
Upon entering the trade, the most effective stop loss is positioned above the "A up" line. Backtesting is recommended to confirm the best results. The recommended reward-to-risk ratio for this strategy is 1, which should also be validated through backtesting.
Advantages of Combining Kill Zone and ACD Method in Market Analysis :
Precise Trade Timing : Integrating the Kill Zone strategy with the ACD Method enhances precision in trade entries and exits. The ACD Method identifies key points for trading, while the Kill Zone focuses on high-activity periods, together ensuring optimal timing for trades.
Better Trend Identification : The ACD Method’s pivot ranges help spot market trends, and when combined with the Kill Zone’s emphasis on periods of significant price movement, traders can more effectively identify and follow strong market trends.
Maximized Profits and Minimized Risks : The ACD Method's structured approach to setting price targets and stop losses, coupled with the Kill Zone's high-volume trading periods, helps maximize profit potential while reducing risk.
Robust Risk Management : Combining these methods provides a comprehensive risk management strategy, strategically placing stop losses and protecting capital during volatile periods.
Versatility Across Markets : Both methods are applicable to various markets, including stocks, commodities, and forex, offering flexibility and adaptability in different trading environments.
Enhanced Confidence : Using the combined insights of the Kill Zone and ACD Method, traders gain confidence in their decision-making process, reducing emotional trading and improving consistency.
By merging the Kill Zone’s focus on trading volumes and the ACD Method’s structured breakout strategy, traders benefit from a synergistic approach that enhances precision, trend identification, and risk management across multiple markets.
