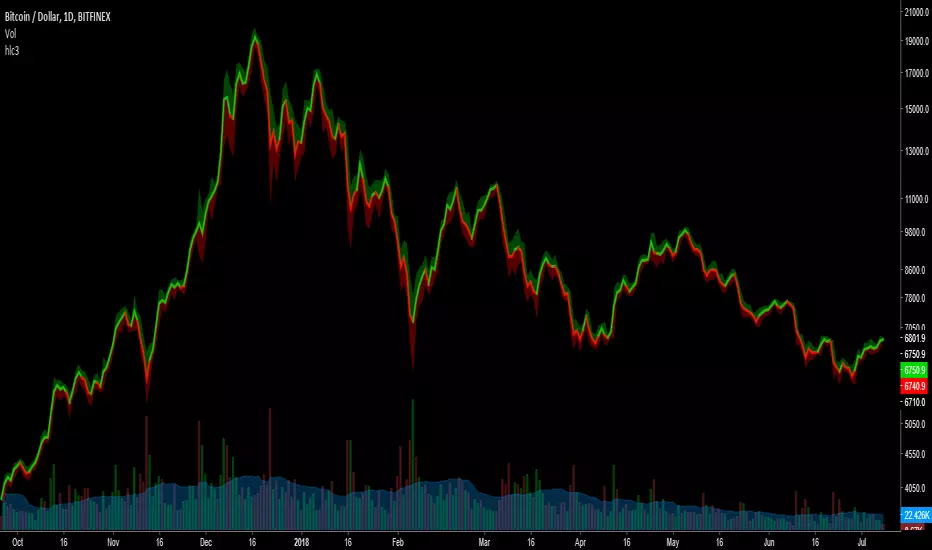
HLC3This is a script I wrote years ago. Some people prefer a line instead of candles, the standard tradingview line is too simple, so I copied the line from bitcoinity.org. I added heiken ashi colors to it as well. If you don't want that you can configure that in the options, you get a yellow line instead. You can also configure the source there, you do not have to use hlc3.
스크립트에서 "bitcoin"에 대해 찾기
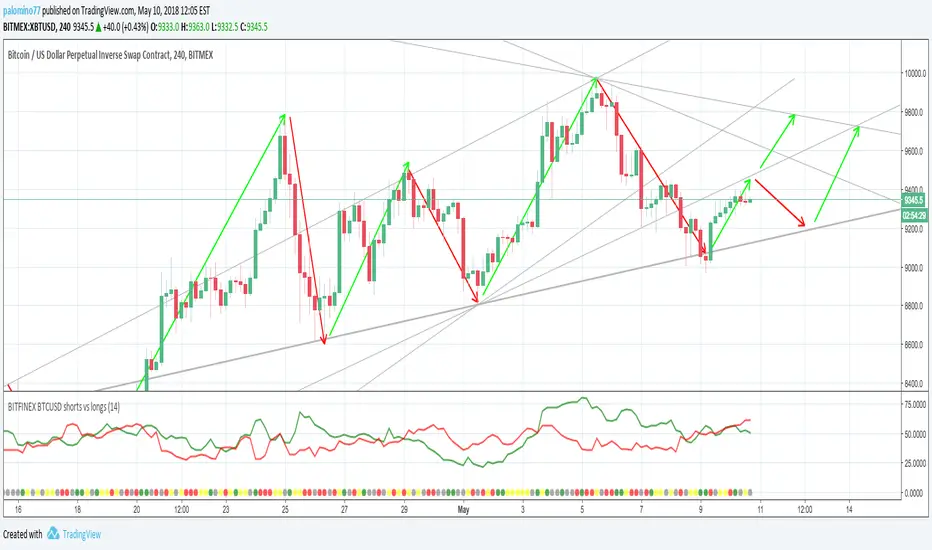
BITFINEX BTCUSD shorts vs longsA simple script to get an RSI of BTCUSD SHORTS and LONGS on Bitfinex.
(Forked from an open sourced script)
Moving Average Price MultipleAuthor: Preston Pysh & Trace Mayer
Visit www.MayerMultiple.com to see current charts & explanation
Listen to Preston's Podcast: www.theinvestorspodcast.com
Follow Preston on Twitter: twitter.com
This indicator calculate the Price Multiple from Current Close Price vs 200 Day Moving Average.
Based on Preston's article:
+ The average Mayer Multiple is 1.44 for the history of Bitcoin.
+ Safe Buying Threshold is 2.4

rem sim v0.1every alt-coin has similarity.
cause of bitcoin.
always i want to delete that similarity and read the true(?) value of each coin.
and i made some script for that, but not good enough.
this one is different.
Rem Sim (rs) removes the similarity very effectively.
it make avg WaveTrend from nxt, strat, steem, ...
and that is the similarity
and it show true(?) WaveTrend without similarity.
so if the alt-coin move like other alt-coin, the WT almost 0.
sorry my bad english.
if you dont understand my english. just look at that chart.
also you can see source code.
--------
대부분의 알트가 어느정도 비슷한 차트를 가지는데, 그 유사성을 제거하면 어떤 모양인지 궁금해서 만들었어요.
전에 만들었던 비트코인의 영향력을 제거해주는 아이디어는 실제론 별 효용이 없는데 이건 좀 쓸만해보이네요.
웨이브트렌드의 모양으로 보여줍니다.

UCS Squeeze Momentum Overlay with AlertsAll credit to the great ucsgears. His original indicator is on this page:
I just remixed the visuals and added alerts when price is released from the squeeze. I find it works well on lower timeframes for Forex and Bitcoin. Suggestions for other instruments and timeframes are welcome! When adding alerts use 'On Condition' to get the fastest alerts.
Best used in conjunction with the USC_SQZ_Opt Ooscillator from this page:
Possibly useful tip: the squeeze code here is great for identifying ranging markets, and can be used with other indicators to stop alerts firing in choppy markets.


MAGNUS® CyclesThis indicator will help you if you struggle making any profit in bitcoin.
It generates very few signals with very nice profit potential ( around 100% this year ! ).
Perfect tool for longterm swing traders and new traders that need help figuring out the midterm trend.
Use it with these parameters only:
weekly: 13, 5, 12
daily: 92, 21, 96

Cinematic Session Fade [Pro]🎬 Cinematic Session Fade — A Clean Way to See Market Mood
This indicator is designed to enhance visual clarity, not clutter your chart.
Instead of adding more lines, boxes, or signals, it uses soft cinematic session shading to show how market behavior naturally changes throughout the day.
🌍 Session-Based Market Atmosphere
Asia Session (Calm Blue)
Represents balance, low volatility, and range-building conditions.
London Session (Warm Gold)
Highlights the transition phase where momentum often starts to build.
New York Session (Deep Red)
Emphasizes decision-making hours, volatility, and directional moves.
The session colors fade smoothly in the background, creating a professional and distraction-free viewing experience.
🎨 Why This Indicator Looks Clean & Professional
No indicators stacked on price
No buy/sell arrows or noisy labels
Soft, eye-friendly background shading
Clean candle colors for clear price focus
Optimized for dark mode charts
This makes the chart easy to read, easy on the eyes, and visually attractive for both analysis and screenshots.
🧠 How Traders Use It
Identify which session the market is in at a glance
Adjust expectations for volatility and behavior
Combine with your own strategy (structure, SMC, trend, or price action)
Perfect for education, market commentary, and clean chart presentations
📈 Best Markets
Forex
Gold (XAUUSD)
Bitcoin & Crypto
Indices
🎯 Final Note
This tool does not predict price.
It simply provides context and atmosphere, helping traders stay aligned with market rhythm while keeping charts elegant and professional.
If you value clarity over clutter, this indicator is built for you.

BTC vs US500: Normalized Trend Divergence Backtest StrategyOverview:
This strategy script provides a framework for testing the hypothesis that Bitcoin’s price movements are heavily influenced by global macro trends. It utilizes a unique normalization technique to overlay the S&P 500's momentum onto the Bitcoin chart.
This strategy is tailored for trading Bitcoin on higher timeframes to capture significant, macro-driven swings, rather than intraday noise.
Strategy Logic:
The core logic of the strategy is based on the relationship between the BTC price and a Normalized Moving Average of the S&P 500.
Target Asset: BTCUSD
Recommended Timeframe: 1D for the most effective backtest results.
Long Entry: Triggered when BTC price crosses ABOVE the Normalized US500 Moving Average.
Short/Exit Entry: Triggered when BTC price crosses BELOW the Normalized US500 Moving Average.

BTC Correlation multiframesBTC Correlation indicator for scalping. Shows real-time correlation between the current asset and Bitcoin across three timeframes (30m, 1H, 4H), regardless of the chart timeframe you're viewing.
Green indicates strong positive correlation (asset follows BTC), yellow shows independence (ideal for scalping without BTC influence), and red indicates inverse correlation. Perfect for quick identification of whether your scalping target is moving independently from Bitcoin's price action.
The indicator compares percentage changes of the current candle in each timeframe, providing instant visual feedback on correlation strength through color-coded values.

GLOBAL 3H SCALPING (BTC FILTER)글로벌 멀티 세션 & BTC 필터 고강도 스캘핑 알고리즘 기술 보고서
파인 스크립트 v5의 기술적 패러다임과 알고리즘 트레이딩의 진화
금융 시장의 디지털화가 가속화됨에 따라 개인 트레이더와 기관 투자자 모두 정교한 알고리즘을 활용하여 시장의 비효율성을 포착하려는 시도를 지속하고 있다. 파인 스크립트 v5는 네임스페이스 기반 아키텍처를 도입하여 코드의 가독성과 실행 효율성을 극대화하였습니다. 본 보고서에서는 기존 코드의 구문 오류를 수정하고, 아시아·유럽·미국 세션 및 비트코인(BTC) 커플링 필터를 포함한 최적화된 스크립트를 제공합니다.
🚀 GLOBAL 3H SCALPING (BTC FILTER) 전체 코드
이 코드는 모든 세션(아시아/유럽/미국)의 3시간 골든 아워를 포착하며, 비트코인의 추세가 알트코인과 일치할 때만 신호를 생성하는 '커플링 필터'가 내장된 최종 버전입니다.
Pine Script
//@version=5
indicator("GLOBAL 3H SCALPING (BTC FILTERED)", overlay=true, max_lines_count=300, max_labels_count=100)
//────────────────────
// ⏰ 세션 정의 (한국 시간 KST 기준)
//────────────────────
string tz = "Asia/Seoul"
string asiaSess = "0900-1200"
string euSess = "1600-1900"
string usSess = "2300-0200"
f_getFocus(sessionStr) =>
inSess = not na(time(timeframe.period, sessionStr, tz))
start = inSess and not nz(inSess , false)
float tfInSec = timeframe.in_seconds()
int bars3H = math.max(1, math.round(10800 / tfInSec))
int barsSinceStart = ta.barssince(start)
bool focus = inSess and (not na(barsSinceStart) and barsSinceStart < bars3H)
focus
bool asiaFocus = f_getFocus(asiaSess)
bool euFocus = f_getFocus(euSess)
bool usFocus = f_getFocus(usSess)
bool totalFocus = asiaFocus or euFocus or usFocus
bgcolor(asiaFocus? color.new(color.green, 92) : na, title="Asia Focus")
bgcolor(euFocus? color.new(color.blue, 92) : na, title="EU Focus")
bgcolor(usFocus? color.new(color.red, 92) : na, title="US Focus")
//────────────────────
// 🟠 BTC 커플링 필터 (BTC Trend Filter)
//────────────────────
// 비트코인의 추세를 실시간으로 가져와 알트코인 매매의 안전장치로 활용함
float btcPrice = request.security("BINANCE:BTCUSDT", timeframe.period, close)
float btcEMA = request.security("BINANCE:BTCUSDT", timeframe.period, ta.ema(close, 200))
bool btcBullish = btcPrice > btcEMA
bool btcBearish = btcPrice < btcEMA
//────────────────────
// 📈 기술적 지표 (Altcoin 자체 지표)
//────────────────────
float ema200 = ta.ema(close, 200)
plot(ema200, title="EMA200", color=color.new(color.yellow, 0), linewidth=2)
float vwapVal = ta.vwap(hlc3)
plot(vwapVal, title="VWAP", color=color.new(color.aqua, 0), linewidth=2)
float volMA = ta.sma(volume, 20)
bool volOK = volume > volMA
bool longVWAP = low <= vwapVal and close > vwapVal
bool shortVWAP = high >= vwapVal and close < vwapVal
//────────────────────
// 🚀 진입 조건 (BTC 필터 통합)
//────────────────────
bool longCond = totalFocus and close > ema200 and close > vwapVal and longVWAP and volOK and btcBullish
bool shortCond = totalFocus and close < ema200 and close < vwapVal and shortVWAP and volOK and btcBearish
plotshape(longCond, title="LONG", location=location.belowbar, style=shape.triangleup, size=size.small, color=color.lime, text="LONG")
plotshape(shortCond, title="SHORT", location=location.abovebar, style=shape.triangledown, size=size.small, color=color.red, text="SHORT")
//────────────────────
// 🧠 실시간 통합 대시보드
//────────────────────
var label infoLabel = na
if barstate.islast
label.delete(infoLabel)
string sessName = asiaFocus? "ASIA" : euFocus? "EUROPE" : usFocus? "US" : "WAITING"
string labelText = "GLOBAL ALGO (BTC FILTERED) 🌍\n" +
"--------------------------\n" +
"Active Session: " + sessName + "\n" +
"BTC Trend: " + (btcBullish? "BULLISH 🟢" : "BEARISH 🔴") + "\n" +
"Alt Trend: " + (close > ema200? "BULLISH" : "BEARISH") + "\n" +
"Volume: " + (volOK? "STRONG" : "WEAK")
infoLabel := label.new(
x = bar_index,
y = high,
text = labelText,
style = label.style_label_left,
color = color.new(color.black, 20),
textcolor = color.white
)
📘 Comprehensive User Manual (EN/KR)
1. English: Multi-Session & BTC Filtered Scalping Guide
Core Philosophy
The "Golden Hours" strategy focuses on the first 3 hours of global market openings when volatility and liquidity are at their peak . By filtering altcoin signals with the Bitcoin (BTC) trend, we ensure high-probability entries aligned with the overall market momentum .
Session Schedule (Korea Standard Time - KST)
The indicator highlights three major trading windows :
Asia Focus (Green): 09:00 – 12:00 KST (Tokyo/Seoul opening).
Europe Focus (Blue): 16:00 – 19:00 KST (London opening).
US Focus (Red): 23:00 – 02:00 KST (New York opening).
Trading Rules
Long (Buy) Entry Conditions:
Zone: Price must be within one of the colored Focus Zones.
BTC Filter: BTC must be trading above its EMA 200 (Market Sentiment: Bullish) .
Alt Trend: Altcoin price must be above its own EMA 200.
Value: Price is above VWAP.
Reaction: Candle low touches or dips below VWAP, then closes above it (Pullback) .
Volume: Current volume is higher than the 20-period average.
Short (Sell) Entry Conditions:
Zone: Price must be within one of the colored Focus Zones.
BTC Filter: BTC must be trading below its EMA 200 (Market Sentiment: Bearish).
Alt Trend: Altcoin price must be below its EMA 200.
Value: Price is below VWAP.
Reaction: Candle high touches or goes above VWAP, then closes below it (Rejection).
Volume: Current volume is higher than the 20-period average.
Professional Risk Management
1% Rule: Never risk more than 1% of your total capital on a single trade .
Leverage: Use 1x–5x for beginners, and 5x–20x for advanced traders only with tight stop-losses .
Stop-Loss: Place stop-losses 0.1%–0.5% away from the entry point or at the most recent swing high/low .

[RoyalNeuron] Supertrend [Medusa v1.0]Hey everyone, 👋
This is Medusa Supertrend v1.0.
Proper Supertrend logic using ATR with trend continuation rules.
Optimized default settings for BTC 30 minute charts, but fully adjustable to you liking.
Optional BUY and SELL labels only when the trend actually flips
Soft trend highlighting so you can see regime shifts without blinding your chart
Quick way to use it:
Green Supertrend with bullish fill means bias stays long and you look for continuation setups
Red Supertrend with bearish fill means bias stays defensive or short.
BUY and SELL labels mark trend changes.
It works best when combined with momentum or volume tools like WidowMaker to time entries with the trend instead of fighting it.
Use it, break it, tell me what you’d improve. More Medusa iterations and free tools coming.
Cheers,
RoyalNeuron 👑
Supertrend, Trend, ATR, Directional Bias, Buy Sell, Bitcoin, BTC, Clean Charts. Free, Alerts

Right-Side Master Pro: Adaptive Trend SystemHere is a professional English introduction for your strategy, tailored for a TradingView description, portfolio presentation, or documentation.
I have provided two versions: a Concise Summary (for quick reading) and a Detailed Technical Breakdown (for in-depth explanation).
Option 1: Concise Summary (Best for TradingView Description)
Strategy Name: Right-Side Master Pro: A Systematic Trend-Following System
Description: Built on the timeless principles of trading legends like Jesse Livermore, William O'Neil, and Mark Minervini, the Right-Side Master Pro is a pure trend-following system designed to prioritize confirmation over prediction.
This strategy does not guess bottoms; it waits for specific momentum breakouts (Donchian Channels) aligned with institutional moving averages. Its core edge lies in its "Market Regime Filter," which restricts long positions on altcoins unless Bitcoin is in a confirmed uptrend (above the 200 EMA), effectively shielding capital during bear markets.
Key Features:
The "M" Filter: Automatically filters out bad market environments by tracking BTC trend health.
Hybrid Exit Strategy: Secures wins by closing 50% of the position at a 2R (Reward/Risk) target, while letting the remainder ride the "fat tail" trends with a dynamic trailing stop.
Capital Efficiency: Implements a "Time Stop" to cut stagnant trades that fail to launch within 5 bars, keeping capital active.
Volatility Sizing: Dynamically adjusts position size based on ATR, ensuring consistent risk exposure regardless of market volatility.
Option 2: Detailed Technical Breakdown (Best for Documentation)
Title: The Right-Side Master Pro Edition
Overview The Right-Side Master Pro is a sophisticated algorithmic trading strategy engineered for the cryptocurrency markets. It automates the "Right-Side Trading" philosophy, focusing on entering established trends during high-momentum breakouts while maintaining strict defensive protocols.
Core Logic & Mechanisms
1. Trend & Environment Filtering (The "M" Factor) Following O'Neil's CAN SLIM principle on Market Direction, this strategy incorporates a Bitcoin Regime Filter.
Logic: It monitors Bitcoin’s price relative to its 200-period EMA.
Effect: If BTC is bearish, the strategy disables all long signals for altcoins, preventing "catching falling knives" during systemic corrections.
2. Precision Entry (Momentum)
Trigger: Utilizes a Donchian Channel Breakout (20-period high) to identify genuine strength.
Trend Template: Entries are only valid if the short-term EMA (20) is above the long-term EMA (50), confirming a Stage 2 uptrend structure.
3. Advanced Risk Management
Volatility Sizing: Position size is calculated mathematically using Risk % / (2 * ATR), ensuring that high-volatility coins receive smaller allocations and stable coins receive larger ones.
Time Stop: Adhering to the "Time is Money" principle, the strategy forces an exit if the price fails to move away from the cost basis within 5 candles, eliminating dead money.
4. Hybrid Execution (The "Free Roll")
Take Profit 1 (TP1): Automatically liquidates 50% of the position when the price hits a 2:1 Reward-to-Risk ratio. This banks profit and reduces psychological pressure.
Trailing Stop: The remaining 50% is managed with a loose ATR-based trailing stop, designed to capture outlier trends (100%+ moves) without being shaken out by intraday noise.
Recommended Configurations
Daily Timeframe (1D): For conservative, high-win-rate growth using leverage (2x-3x).
4-Hour Timeframe (4H): For aggressive, high-turnover growth using spot or low leverage (1x).

Supply Demand Zones PRO | ProjectSyndicateSupply Demand Zones PRO by ProjectSyndicate
Version: 1.0
Author: ProjectSyndicate
Built with: Pine Script v6
________________________________________
Executive Summary: PRO Features Overview
The Supply Demand Zones PRO indicator is a professional-grade tool built on the latest Pine Script v6, designed to automatically identify and score high-probability supply and demand zones.
It moves beyond simple zone plotting by incorporating a suite of advanced features that provide a deeper, more actionable market context. This allows traders to filter out noise, focus on significant levels, and make more informed decisions.
The indicator is universally compatible and works seamlessly across all major asset classes and timeframes:
• Forex: EURUSD, GBPUSD, USDJPY
• Commodities: Gold/XAUUSD, Silver, Oil
• Indices: NQ, ES, DAX, FTSE
• Cryptocurrencies: Bitcoin, Ethereum, Altcoins
• Stocks: Individual equities
Most symbols available on TradingView are fully supported.
Notice on repainting:
Active zones won’t repaint, unless they are invalidated. Gray/Historic zones may repaint and that’s fine, as script only displays most recent and stronger historic zones if historic zones are enabled.
________________________________________
How to Support ProjectSyndicate
Thank you for using the Supply Demand Zones PRO indicator! If you find this tool valuable, you can support our work:
• Follow us on TradingView: Stay up-to-date with our latest script releases and updates.
• Add to Favorites: Click the “Add to Favorite Scripts” button on TradingView to save it for easy access.
• Explore our other scripts: We offer a range of free, high-quality indicators for the modern trader, specializing in Smart Money Concepts (SMC) and Supports and Resistance Levels.
Your support helps us continue to develop and share powerful, free tools with the trading community.
________________________________________
Key PRO Features (Overview)
⚙️ Feature Description
⚙️ Zone Strength Ranking ||| Each zone is dynamically scored from 1–10 based on its age and the number of retests. Fresher, less-tested zones are considered stronger, helping you prioritize the most potent levels.
⚙️ Real-Time Distance ||| The info label for each active zone shows the exact distance (in pips) from the current price to the zone's edge, allowing for quick assessment of risk and opportunity.
⚙️ Trading Session Tracking ||| Zones are automatically tagged with the trading session in which they were formed (Asian, London, or New York). This provides crucial context, as zones formed in high-volume sessions are often more significant.
⚙️ Automated Retest Markers ||| The indicator automatically tracks how many times a zone has been retested. An “R” marker appears on the chart for each retest, providing a visual history of the zone’s interaction with price.
⚙️ Advanced ATR Filtering ||| Utilize volatility-based filtering to ensure zone quality. You can set the minimum, maximum, and even force a consistent zone height based on the Average True Range (ATR), eliminating zones that are too thin or too wide to be effective.
⚙️ Minimum Zone Distance ||| Prevent chart clutter by setting a minimum number of bars that must pass before a new zone can be drawn. This ensures that only distinct, well-separated levels are identified.
⚙️ Dual Label Controls ||| Independently control the visibility of info labels for Active Zones and Historic Zones. Keep your chart clean by hiding details for old, broken levels while keeping fresh, active zones fully detailed.
⚙️ Built on Pine Script v6 ||| Leveraging the latest and most efficient Pine Script version, the indicator is faster, more reliable, and capable of handling more complex calculations and drawings without lagging.
________________________________________
Detailed Feature Breakdown
Zone Strength Ranking
The strength score is a proprietary calculation that helps traders instantly gauge the potential of a supply or demand zone. It is calculated in real-time based on two primary factors:
1. Age of the Zone: The older a zone gets, the less relevant it may become. The strength score decreases as the number of bars since its creation increases.
2. Number of Retests: The first test of a fresh zone is often the highest probability setup. With each subsequent retest, the zone's strength diminishes as liquidity is absorbed. The score is reduced for every retest.
A high strength score (e.g., 7/10 or higher) indicates a fresh, untested zone that could offer a significant reaction. A low score suggests a zone that is either old or has been tested multiple times and should be approached with caution.
________________________________________
Invalidation & Historic Zones
A zone is considered invalidated or “broken” the moment price closes beyond its outer boundary (or wicks beyond it, depending on your settings). Once a zone is broken, it is re-classified as a Historic Zone and turns gray.
This is critical for understanding market structure. A broken supply zone that becomes a historic level can often transform into a future demand zone (a flip zone), and vice-versa.
________________________________________
Advanced Filtering Explained
The indicator provides three powerful ATR-based filters to control zone quality:
• Max Zone Height (ATR Multiplier): Prevents the indicator from drawing zones that are excessively large and impractical for trading. For example, a setting of 1.0 will ignore any potential zone whose height is greater than 1× the current ATR.
• Min Zone Height (ATR Multiplier): Filters out zones that are too thin or “pancaked,” which often represent noise rather than a true consolidation of orders. A setting of 1.0 will reject any zone smaller than 1× the current ATR.
• Force Zone Height (ATR Multiplier): This unique feature normalizes zone heights. It expands zones that are smaller than the specified ATR value, creating more visually consistent and usable levels. A setting of 1.0 will expand any valid zone to be at least 1× the ATR in height.
________________________________________
Configuration Guide
This section details every input and setting available in the indicator.
Zone Detection
⚙️ Setting Default Description
⚙️ Swing Length (Sensitivity) 12 The number of bars to look back to identify a pivot high/low. Higher values create fewer, more significant zones.
⚙️ Max Zones to Display 10 The maximum number of active Supply and Demand zones to display on the chart.
⚙️ Max Zone Height (ATR) 1.0 Rejects zones with a height greater than this ATR multiplier.
⚙️ Min Zone Height (ATR) 1.0 Rejects zones with a height smaller than this ATR multiplier.
⚙️ Force Zone Height (ATR) 1.0 Expands valid zones to be at least this ATR multiplier in height.
⚙️ Min Distance Between Zones 44 The minimum number of bars required between two consecutive zones of the same type.
________________________________________
Zone Settings
⚙️ Setting Default Description
⚙️ Zone Invalidation Close How a zone is broken. “Close” requires a candle to close past the zone; “Wick” considers it broken if a wick touches past it.
⚙️ Show Historic Zones On Toggles the visibility of broken (historic) zones.
⚙️ Active Zones Lookback 1000 Hides active zones that are older than this many bars.
⚙️ Historic Zones Lookback 1000 Hides historic zones that are older than this many bars.
________________________________________
Display
⚙️ Setting Default Description
⚙️ Show Active Zone Info On Toggles the text label for active (unbroken) zones.
⚙️ Show Historic Zone Info Off Toggles the text label for historic (broken) zones.
⚙️ Label Size Small Adjusts the font size of the zone info labels.

Reversal Detection v3.1 - Real-Time Pro (Non-Repainting)Reversal Detection Pro v3.1 - Universal Non-Repainting
ACKNOWLEDGMENTS
Special thanks to @ksiva100 for extensive testing and detailed feedback on v3.0 that led to the major improvements in v3.1. Their real-world testing on GC, ES, NQ, NG, and CL futures across 3-5 minute timeframes identified critical issues with sensitivity scaling and helped shape the universal ATR-adaptive system that makes this version work seamlessly across all instruments and timeframes.
Community feedback like this is invaluable in creating better tools for all traders.
FULL DESCRIPTION:
OVERVIEW
Reversal Detection Pro v3.1 is a non-repainting reversal identification system designed for futures trading across all timeframes. The indicator uses ATR-adaptive thresholds combined with a zigzag-based pivot detection algorithm to identify confirmed price reversals. A triple EMA trend filter provides directional context, while optional supply/demand zones highlight key reversal areas.
The indicator automatically scales to any instrument's price level and volatility through its ATR-adaptive mechanism, eliminating the need for manual threshold adjustments when switching between instruments or timeframes.
KEY FEATURES
Non-Repainting Confirmation System
All confirmed reversal signals are final and do not disappear or move to different bars. The indicator includes an optional preview mode that shows potential reversals before confirmation, clearly labeled to distinguish them from confirmed signals. Users can add extra confirmation bars for additional validation before signals appear.
ATR-Adaptive Sensitivity
The indicator uses Average True Range (ATR) as its primary sensitivity mechanism. Five preset sensitivity levels (Very High, High, Medium, Low, Very Low) multiply the ATR by factors ranging from 0.8x to 3.5x. This approach automatically adapts to:
Different price levels (works equally on $25 micro futures and $25,000 instruments)
Varying volatility conditions (calm vs. volatile markets)
Multiple timeframes (1-minute through daily charts)
Different trading sessions (regular hours vs. after-hours)
Triple EMA Trend Detection
Three exponential moving averages (9, 14, and 21 periods) create a trend identification system. The info table displays current trend status as BULLISH, BEARISH, or NEUTRAL. Strong signals occur when a reversal aligns with the prevailing trend direction.
Supply and Demand Zones
Optional rectangular zones display at confirmed pivot points. These zones are color-coded (green for demand/support, red for supply/resistance) and can be configured for thickness, extension length, and maximum number displayed. Zones can be toggled on or off independently of reversal signals.
Information Display Table
A customizable table shows real-time indicator settings including:
Current signal mode (Confirmed Only, Preview, or Both)
Active sensitivity preset
ATR multiplier value
Percentage threshold
Current ATR reading
Calculated reversal threshold
Current trend status
Comprehensive Alert System
Eight different alert conditions cover all signal types:
Bullish reversal confirmed
Bearish reversal confirmed
Any reversal (combined)
EMA buy signal (trend change to bullish)
EMA sell signal (trend change to bearish)
Trend changed to bullish
Trend changed to bearish
Strong bullish (reversal + bullish trend aligned)
Strong bearish (reversal + bearish trend aligned)
HOW IT WORKS
Reversal Detection Algorithm
The indicator tracks price using a zigzag methodology that requires a minimum reversal amount before confirming a pivot. This reversal threshold is calculated using three components:
ATR Component (Primary): ATR × Sensitivity Multiplier
Percentage Component (Safety Floor): Close Price × Percentage Threshold
Absolute Component (Minimum Floor): Fixed dollar/point amount
The reversal threshold equals whichever of these three values is largest. This ensures appropriate sensitivity across all instruments and timeframes.
Pivot Confirmation Process
Price must move in one direction to establish a high or low pivot point. When price reverses by the minimum threshold amount, that pivot is confirmed. A reversal signal triggers when price subsequently breaks through the previous confirmed pivot in the opposite direction.
Signal Generation
Green labels and lines: Bullish reversal confirmed (buy signal)
Red labels and lines: Bearish reversal confirmed (sell signal)
Preview labels (if enabled): Potential reversals not yet confirmed (semi-transparent)
Trend Filter Operation
The 9/14/21 EMA system identifies trend direction:
BULLISH: 9 EMA > 14 EMA > 21 EMA, with price above 9 EMA
BEARISH: 9 EMA < 14 EMA < 21 EMA, with price below 9 EMA
NEUTRAL: EMAs not in sequential order
Strong signals occur when reversals align with trend direction.
HOW TO USE
Initial Setup
Add Indicator to Chart
Search "Reversal Detection Pro v3.1" in TradingView indicators
Click to add to any futures chart
Default settings work immediately on any instrument/timeframe
Choose Signal Mode (Signal Controls section)
Confirmed Only: Shows only final, non-repainting signals (recommended for trading)
Confirmed + Preview: Shows both confirmed and potential signals
Preview Only: Shows only potential signals (educational/learning mode)
Set "Extra Confirmation Bars" to 0 for immediate signals, or 1-5 for additional validation
Select Sensitivity (Main Controls section)
Very High: Maximum signals, catches small swings (0.8× ATR)
High: Active trading with more opportunities (1.2× ATR)
Medium: Balanced quality and quantity - recommended starting point (2.0× ATR)
Low: Conservative, higher quality signals (2.8× ATR)
Very Low: Major reversals only, highest quality (3.5× ATR)
Recommended Settings by Timeframe
1-2 Minute Charts (Ultra-Short Scalping)
Sensitivity: High or Very High
Confirmation Bars: 0
Expected: 10-20+ signals per session
Best for: Quick scalps, high-frequency trading
3-5 Minute Charts (Active Day Trading)
Sensitivity: Medium or High
Confirmation Bars: 0-1
Expected: 5-15 signals per session
Best for: Standard scalping, intraday swings
15-30 Minute Charts (Swing Trading)
Sensitivity: Medium or Low
Confirmation Bars: 0-1
Expected: 2-8 signals per session
Best for: Larger intraday swings, part-time trading
1-4 Hour Charts (Position Trading)
Sensitivity: Low or Very Low
Confirmation Bars: 1-2
Expected: 1-5 signals per week
Best for: Multi-day position trades
Daily Charts (Long-Term Swing Trading)
Sensitivity: Very Low
Confirmation Bars: 1-3
Expected: 1-4 signals per month
Best for: Weekly to monthly swing trades
Customizing Display
Supply/Demand Zones (Zones section)
Enable "Show Supply/Demand Zones" to display rectangular areas at pivots
Adjust "Number of Zones" to control how many recent zones appear (0-20)
Set "Zone Box Extension" for forward projection length (5-100 bars)
Modify "Zone Thickness" as percentage of price (0.01%-0.2%)
Visual Elements (Labels section)
"Stop Line Extension": Length of horizontal lines at reversal points (1-50 bars)
"Maximum Lines to Display": Limits historical lines visible (3-50)
"Label Size": Small, Normal, or Large text
Information Table (Info Table section)
Toggle "Show Info Table" on/off
Choose "Table Position": Six position options
Select "Table Size": Tiny through Huge
Setting Up Alerts
Click the "Alert" button (clock icon) on TradingView
Select "Reversal Detection Pro v3.1" from Condition dropdown
Choose specific alert type or "Any REVERSAL" for all signals
Set "Options" to "Once Per Bar Close" (recommended)
Configure notifications (popup, email, SMS, webhook)
Name your alert and click "Create"
For highest-probability trades, use "STRONG Bullish Signal" and "STRONG Bearish Signal" alerts which combine reversals with trend confirmation.
Advanced Settings (Custom Mode)
For experienced users, selecting "Custom" sensitivity unlocks manual control:
Calculation Method: "average" for smoother signals, "high_low" for more responsive
Percentage Reversal: Manual percentage threshold (0.01%-1.0%)
Absolute Reversal: Fixed dollar/point minimum ($0.01-$50)
ATR Multiplier: Manual ATR multiplication factor (0.1-10.0)
ATR Length: Period for ATR calculation (1-50, standard is 14)
Average Length: Smoothing period for high/low when using "average" method (1-50)
Trading Workflow Example
Identify Market Context
Check info table for trend status (BULLISH, BEARISH, NEUTRAL)
Note current ATR and reversal threshold values
Observe recent reversal signal quality
Wait for Signal
Green label = potential long entry (bullish reversal)
Red label = potential short entry (bearish reversal)
Horizontal line shows reversal pivot level
Evaluate Signal Quality
Strongest signals align with trend (STRONG alerts)
Check if reversal occurs at supply/demand zone
Verify adequate volume on reversal bar
Execute Trade
Enter on signal confirmation
Place stop loss below/above reversal pivot line
Target next supply/demand zone or opposing reversal signal
Manage Position
Trail stop loss with price movement
Take partial profits at zones
Exit on opposing reversal signal or stop hit
Multi-Timeframe Analysis
For optimal results, use multiple timeframes:
Higher timeframe (3-5× larger): Determine overall trend direction
Trading timeframe: Execute trades on reversal signals
Lower timeframe (3-5× smaller): Fine-tune entries and exits
Example: Trade ES futures
1 Hour chart: Identify BULLISH trend
5 Minute chart: Take only green (long) reversal signals
1 Minute chart: Time precise entry after signal appears
IMPORTANT USAGE NOTES
Understanding Signal Timing
This is a reversal identification indicator, not a prediction tool. Signals appear AFTER price begins reversing from a pivot, not at the exact top or bottom. This is intentional design - the confirmation process ensures reliability at the cost of capturing the absolute extremes.
Timeframe and Signal Frequency
Higher timeframes naturally produce fewer signals. This is correct behavior:
Daily charts: 1-4 signals per month is normal
1-hour charts: 1-5 signals per week is normal
5-minute charts: 5-15 signals per day is normal
1-minute charts: 10+ signals per hour is normal
If you want more signals, either use a lower timeframe or higher sensitivity setting.
Optimal Market Conditions
Best performance occurs during:
Regular trading hours (RTH) with normal volume
Trending or ranging markets
Liquid instruments with tight spreads
Normal volatility environments
Reduced performance may occur during:
Major economic announcements (FOMC, NFP, CPI)
Opening gaps or halted trading
Extremely thin markets (after-hours, holidays)
Flash crash or extreme volatility events
Risk Management Requirements
Always use stop losses (place beyond reversal pivot)
Position size appropriately (1-2% account risk per trade)
Account for commissions and slippage in planning
Never trade with funds you cannot afford to lose
Paper trade new settings before using real capital
Not a Complete Trading System
This indicator identifies potential reversal points but should be used as part of a complete trading plan including:
Overall market analysis and context
Risk/reward assessment
Position sizing methodology
Trade management rules
Psychological discipline
TECHNICAL SPECIFICATIONS
Calculation Method
Base Algorithm: Modified zigzag with adaptive thresholds
Primary Sensitivity: ATR-based multiplier system
Trend Filter: Triple EMA (9/14/21 exponential moving averages)
Price Calculation: Configurable (high/low or EMA-smoothed high/low)
Confirmation: Configurable delayed confirmation (0-5 bars)
Resource Usage
Maximum Boxes: 50 (for supply/demand zones)
Maximum Lines: 200 (user-configurable display limit)
Maximum Labels: 100 (for reversal markers)
Calculation Speed: Fast (minimal computational overhead)
Compatibility
TradingView Pine Script: Version 6
Chart Types: All (candlestick, bar, line, etc.)
Instruments: All futures contracts (optimized for liquid markets)
Timeframes: All (1 second through 1 month)
Features: Alerts, Strategy Tester compatible
SUITABLE INSTRUMENTS
Micro E-mini Futures
MES (Micro E-mini S&P 500), MNQ (Micro E-mini Nasdaq-100), MYM (Micro E-mini Dow), M2K (Micro E-mini Russell 2000), MGC (Micro Gold), MCL (Micro Crude Oil)
E-mini Futures
ES (E-mini S&P 500), NQ (E-mini Nasdaq-100), YM (E-mini Dow), RTY (E-mini Russell 2000)
Commodities
GC (Gold), SI (Silver), CL (Crude Oil), NG (Natural Gas), HG (Copper), ZW (Wheat), ZC (Corn), ZS (Soybeans)
Indices
SPX (S&P 500 Index), NDX (Nasdaq-100 Index), DJI (Dow Jones Industrial Average)
Currencies
6E (Euro FX), 6B (British Pound), 6J (Japanese Yen), 6A (Australian Dollar)
Interest Rates
ZB (30-Year T-Bond), ZN (10-Year T-Note), ZF (5-Year T-Note)
Crypto Futures
BTC (Bitcoin Futures), ETH (Ethereum Futures)
The ATR-adaptive system works on any liquid futures contract. Results may vary on extremely thin markets or instruments with unusual price structures.
LIMITATIONS AND CONSIDERATIONS
What This Indicator Does
Identifies confirmed price reversals after they begin
Adapts threshold requirements to market volatility
Provides trend context through EMA analysis
Marks potential support/resistance zones
Generates alerts for reversal conditions
What This Indicator Does NOT Do
Predict future price movements
Guarantee profitable trades
Work equally in all market conditions
Eliminate the need for trader judgment
Replace a complete trading strategy
Known Limitations
Signals lag actual reversal by design (confirmation required)
May generate false signals during choppy, directionless markets
Not optimized for gapping markets or illiquid instruments
Requires normal volatility (extreme VIX can affect performance)
EMAs are lagging indicators (trend status reflects recent past)
User Responsibility
Users are responsible for:
Backtesting settings on their chosen instruments
Understanding how the indicator works before trading
Implementing proper risk management
Complying with their broker's margin requirements
Following applicable regulations in their jurisdiction
DISCLAIMERS
Educational Purpose
This indicator is provided for educational and informational purposes only. It is a technical analysis tool designed to assist traders in identifying potential reversal points. It does not constitute financial advice, investment recommendations, or trading signals.
No Performance Guarantees
Past performance of this indicator does not guarantee future results. Markets are inherently uncertain and no technical indicator can predict future price movements with certainty. Losses are a normal part of trading and users should expect both winning and losing trades.
Risk Warning
Trading futures involves substantial risk of loss and is not suitable for all investors. Users should carefully consider whether trading is appropriate for them in light of their experience, objectives, financial resources, and other relevant circumstances. Users should only trade with capital they can afford to lose entirely.
No Liability
The indicator creator and publisher are not responsible for any losses incurred through use of this indicator. Users assume full responsibility for their trading decisions and outcomes. The indicator is provided "as-is" without warranties of any kind.
Testing Requirement
Users should thoroughly test this indicator using paper trading or small position sizes before committing significant capital. Different instruments, timeframes, and market conditions will produce different results. What works well in one context may not work in another.
Not Investment Advice
Nothing in this description or in the indicator itself constitutes investment advice or a recommendation to buy or sell any security. Users should consult with a licensed financial advisor before making investment decisions.
SUPPORT AND UPDATES
Version Information
Current Version: 3.1
Release Date: 21 January 2025
Pine Script Version: 6
Updates and Improvements
This indicator may receive updates to improve functionality, fix bugs, or add features. Users will automatically receive updates through TradingView's indicator system. Major version changes may include breaking changes to settings or behavior.
User Feedback
Community feedback helps improve the indicator. Users are encouraged to share their experiences, report issues, and suggest enhancements through comments. Please include specific details about instruments, timeframes, and settings when reporting issues.
Following for Updates
Click "Follow" on the @NPR21 profile to receive notifications about new indicators, updates, and educational content.

Unreached Highs/Lows Oscillator [LuxAlgo]The Unreached Highs/Lows Oscillator highlights the amount of unreached high/low prices as a percentage over time, helping visualize trend strength and momentum from bullish and bearish market participants.
🔶 USAGE
This indicator measures the strength of directional price movements, helping traders visualize the strength of both the bullish and bearish market participants.
When prices are moving up with strength, the price structure will not come back to retest previous lows. Therefore, unreached lows keep adding up.
When prices are moving down with strength, they will not retest previous highs; therefore, unreached highs keep adding up.
As we can see on the chart, high readings of unreached highs (red) and low readings of unreached lows (green) are considered bearish, and a downtrend in price confirms this bias. Conversely, high readings of unreached lows and low readings of unreached highs are considered bullish. On the chart, this is reflected as an uptrend.
Additionally, the oscillator can reveal significant breakouts on the chart, with unreached highs or lows decreasing rapidly indicating that a large number of highs/lows have been reached.
Due to the oscillator being normalized, overbought and oversold levels are included.
In this gold chart, we have different examples of how to use the tool in conjunction with price behavior to understand the market. Let's dissect it step by step:
1. Uptrend: Bullish readings are above 80, and bearish readings are below 20. The market is trending up.
2. Range: Mixed readings around 50 for both bullish and bearish; the market is ranging.
3. Uptrend: The same as before. Bullish above 80 and bearish below 20.
4. Pullback: A bullish dip below 80 to 50 and a bearish reading below 20 indicates a pullback.
5. Range: Mixed readings. In this case, it is bullish above and below 80 and bearish above and below 20. The market is ranging.
6. Uptrend: Bullish above 80 and bearish below 20; the market keeps moving up.
7. Pullback: Bullish dips below 80 and bearish rises to 50 indicate a pullback.
8. Uptrend: As before, bullish is above 80 and bearish is below 20; the market is trending up.
This Bitcoin chart shows how to use extreme readings of 0 and 100 to detect potential reversals. When both readings are at extreme opposites, we set the threshold level at 100 and 0 instead of the default levels of 80 and 20 to better identify these areas.
As we can see, extreme readings at points 1 and 5 identify major reversals that lead to a change in trend. Extreme readings at points 2, 3, 4, and 6 identify minor reversals that do not lead to a change in trend.
From the settings panel, traders can adjust the length parameter. A smaller value measures smaller price movements, while a larger value measures larger price movements. A length value of 20 is used by default.
The chart shows how different values affect bullish and bearish measures.
🔶 SETTINGS
Length: Select the maximum number of highs and lows to be used.
🔹 Style
Bullish: Select a color for unreached lows.
Bearish: Select a color for unreached highs.
Top Threshold: Select the top threshold level and color. Enable the Auto feature to choose the default color.
Bottom Threshold: Select the bottom threshold level and color. Enable the Auto feature to choose the default color.

UT Bot Alerts [2026 Elite Edition]🚀 Overview
The UT Bot 2026 Elite Edition is the ultimate evolution of the legendary volatility trading system originally conceptualized by QuantNomad. While the original tool revolutionized trend following, this "Elite Edition" introduces Asymmetric Sensitivity—a professional feature that acknowledges a fundamental market truth: Assets do not fall the same way they rise.
This script allows you to decouple your Long and Short strategies, offering surgical precision for both bull runs and bear crashes, all while monitoring trade health via a new real-time Safety Dashboard.
🧠 The Logic: Why "Elite"?
Most trailing stop systems use a single setting (e.g., Key: 2, ATR: 10) for both buying and selling. This is efficient but often suboptimal.
Bull Markets often grind up slowly (requiring looser stops to avoid shakeouts).
Bear Markets often crash quickly (requiring tighter, faster stops to protect capital).
The Dual-Engine Solution: This script runs two separate calculation engines simultaneously:
The Buy Engine (Ceiling): Calculates the resistance ceiling using its own Sensitivity (Key) and Smoothness (ATR) settings.
The Sell Engine (Floor): Calculates the support floor using entirely different settings.
This means you can have a "Slow & Steady" settings for buying Bitcoin, but a "Fast & Aggressive" setting for shorting it, all within the same indicator.
✨ Key Features
1. Asymmetric "Dual-Key" Sensitivity
Buy Key & ATR: Tune your entry sensitivity for long positions.
Sell Key & ATR: Tune your short parameters independently.
Why this matters: You can now set a wide stop for trending up, but a tight stop for trending down to capture profit instantly when momentum breaks.
2. The Safety Dashboard (HUD) A professional Heads-Up Display (HUD) located in the top-right corner. It provides critical "Flight Data" that simple buy/sell labels hide:
Status: Instantly see if you are net Long or Short.
Stop Price (The Kill Level): The exact price where the trend will flip. Use this for your hard Stop Loss orders.
Active ATR: Displays the current volatility width. High ATR = High Volatility (Wide Stops). Low ATR = Consolidation (Tight Stops).
3. Heikin Ashi Smoothing
Includes a built-in toggle to calculate signals based on Heikin Ashi candles while viewing standard candles. This filters out "noise" and wicks, often keeping you in a trend longer.
4. Pine Script v6 Optimization
Refactored for the latest Pine Script v6 standards, ensuring faster execution and compatibility with the latest TradingView features.
🛠️ How to Use (Best Practices)
For Scalping (1m - 5m Timeframes):
Suggestion: Set Sell Key lower (e.g., 1.5) and Sell ATR lower (e.g., 5) to react quickly to drops. Keep Buy Key higher to avoid choppy fake-outs. I personally use the default settings on the 3M time frame with Gold and NQ with a high rate of success.
For Swing Trading (4h - Daily):
Suggestion: Increase Buy ATR (e.g., 30-100) to smooth out the noise of daily fluctuations.
The Dashboard:
Always check the Stop Price on the dashboard before entering. If the Stop Price is too far away from the current price, your risk might be too high for the trade size.
🙏 Credits & Appreciation
This script stands on the shoulders of giants.
Original Logic: Huge props and credit to QuantNomad for the original UT Bot strategy. His work laid the foundation for volatility-based trailing stops on TradingView.
Concept: Based on the "Ceiling/Floor" volatility theory.
Development: Enhanced and refactored by for the 2026 market environment.
Disclaimer: This tool is for information purposes only. Past performance does not guarantee future results.

BTC Spot Premium Index (Coinbase - Binance )Overview
This indicator measures the price difference between Bitcoin (BTC) on Coinbase and Binance, providing insights into the buying pressure from US-based investors versus the global market. A positive premium suggests stronger buying activity on Coinbase, which is often interpreted as a bullish signal for BTC.
Key Features
•
Premium Calculation: The core of the indicator is the formula: Coinbase BTC Price - Binance BTC Price.
•
Visual Representation: The premium is plotted as an oscillator with a zero line. Positive values are colored green, and negative values are red, making it easy to identify the prevailing market sentiment.
•
Moving Average: A customizable moving average (default is a 20-period SMA) is included to help identify the trend of the premium. The MA line is displayed in white.
•
Adjustable Parameters: You can adjust the moving average length and type (SMA, EMA, WMA, RMA) to fit your trading style.
How to Use
1.
Identify US Market Sentiment: A sustained positive (green) premium suggests strong buying interest from the US market, which can be a precursor to price appreciation.
2.
Spot Trend Reversals: A crossover of the premium line above the zero line can signal a shift from bearish to bullish sentiment. Conversely, a cross below the zero line may indicate weakening US demand.
3.
Confirm with Moving Average: When the premium line crosses above its moving average, it can signal strengthening momentum. A cross below the MA may suggest a potential slowdown.
Interpretation
•
Green Area (Positive Premium): Indicates that BTC is trading at a higher price on Coinbase than on Binance. This is generally considered a bullish sign, as it reflects strong demand from US investors.
•
Red Area (Negative Premium): Indicates that BTC is trading at a lower price on Coinbase. This may suggest weaker demand in the US market or stronger selling pressure.
•
White Line (Moving Average): Helps to smooth out the premium data and identify the underlying trend. Use it as a dynamic support or resistance level for the premium itself.
This indicator is a powerful tool for gauging market sentiment and can be a valuable addition to any BTC trader's toolkit. However, it should be used in conjunction with other technical analysis tools and not as a standalone signal for making trading decisions.

Auto Fibonacci Lines Depending on ZigZag %In the world of technical analysis, few tools are as powerful—or as misused—as Fibonacci Retracements. The Auto Fibonacci Lines Depending on ZigZag % is not just an indicator; it is a complete, automated trading system designed to eliminate subjectivity and bring institutional-grade precision to your charts.
This script automates the identification of significant market structures using a ZigZag algorithm. Once a market swing is mathematically confirmed (based on your deviation settings), it instantly projects a complete suite of Retracement and Extension levels. This allows you to stop guessing where to draw your lines and start focusing on price action.
🧠 The Logic Behind the Indicator
Understanding how your tools work is the first step to trusting them. This script operates on a three-step logic loop:
ZigZag Identification:
The script continuously monitors price action relative to the last known pivot point. It uses a user-defined Deviation % to filter out market noise. A new "Leg" is only confirmed when price reverses by this specific percentage. This ensures that the Fibonacci lines are only drawn on significant market moves, not random chop.
Automated Anchor Points:
Once a downward trend is confirmed (e.g., price drops 30% from the top), the script automatically anchors the Fibonacci tool to the Swing High (Start) and the Swing Low (End). It does this without you needing to click or drag anything.
Dynamic Cleanup:
Markets evolve. A key feature of this script is its self-cleaning mechanism. As soon as a new trend leg is confirmed, the script automatically deletes the old, invalidated Fibonacci lines and draws a fresh set for the new structure. This keeps your chart clean and focused on the now.
🎓 How to Trade This System
This indicator is color-coded to simplify your decision-making process. It moves beyond standard "rainbow" charts by categorizing price levels into three distinct actionable zones.
1. The "Reload Zone" (White Lines: 0.618 - 0.786) ⚪
Role: High-Probability Support / Entry
In institutional trading, the 0.618 (Golden Ratio) to 0.786 region is often where algorithms step in to defend a trend.
Why it works : This is the "discount" area where smart money re-accumulates positions before the next leg up.
2. The "Decision Wall" (Blue Lines: 1.382 - 1.5) 🔵
Role: Strong Resistance / Trend Check
This is a unique feature of this suite. The 1.382 and 1.5 levels often act as a "ceiling" for weak breakouts.
Strategy : If you entered in the White Zone, the Blue Zone is your first major hurdle. If price stalls here, consider securing partial profits.
Warning : A rejection from the Blue Lines often leads to a double-top formation. However, a clean break above the Blue Lines usually signals a parabolic move is beginning.
3. The "Extension Zone" (Yellow, Red, Purple > 1.618) 🟡🔴
Role : Take Profit / Exhaustion
Levels above 1.5 (starting with the 1.618 Golden Extension) are statistical extremes.
Strategy : These are Strict Take Profit levels. Do not FOMO (Fear Of Missing Out) into new long positions here. The probability of a reversal increases drastically as price climbs through these levels (2.618, 3.618, 4.618).
📐 The Mathematical Edge: Logarithmic vs. Linear
One of the most critical features of this script is the ability to toggle between Logarithmic and Linear calculations.
Why use Logarithmic?
If you are trading Crypto (Bitcoin, Altcoins) or high-growth Tech Stocks, linear Fibonacci levels are mathematically incorrect over large moves. A 50% drop from $100 is different than a 50% drop from $10.
This script calculates the percentage difference (Log Scale), ensuring your targets are accurate even during 100%+ parabolic runs.
Why use Linear?
For mature markets like Forex (EURUSD) or Indices (SPX500) where volatility is lower, Linear scaling is the industry standard.
🛠️ Configuration & Best Practices
Deviation % : This is the heartbeat of the indicator.
Swing Trading : Set to 20-30%. This filters out noise and only draws Fibs on major macro moves.
Scalping : Set to 3-5%. This will catch smaller intraday waves.
Text Place : Keeps your chart clean by pushing labels to the right, ensuring they don't overlap with the current price action.
👤 Who Is This Indicator For?
The Disciplined Trader : Who wants to remove emotional bias from their charting.
The Crypto Investor : Who needs accurate Logarithmic targets for long-term holding.
The Confluence Trader : Who combines these automated levels with Order Blocks, RSI, or Volume to find the perfect entry.
⚠️ RISK DISCLAIMER & TERMS OF USE
For Educational Purposes Only:
This script and the strategies described herein are provided strictly for educational and informational purposes. They do not constitute financial, investment, or trading advice. The "Auto Fibonacci Lines" indicator is a tool for technical analysis and should not be used as the sole basis for any trading decision.
No Guarantees:
Past performance of any trading system or methodology is not necessarily indicative of future results. Financial markets are inherently volatile, and trading involves a high level of risk. You could lose some or all of your capital.
User Responsibility:
By using this script, you acknowledge that you are solely responsible for your own trading decisions and risk management. The author assumes no liability for any losses or damages resulting from the use of this tool or the information provided. Always consult with a qualified financial advisor before making investment decisions.

WEEKEND BOX (FRIDAY 17:00 - SUNDAY 18:00 NY)As the name “Weekend Box” suggests, this indicator highlights the price range of cryptocurrencies between Friday 17:00 and Sunday 18:00 (New York time). It draws a box around this period to visualize how Bitcoin and other crypto assets behave while the forex market is closed. The goal is to provide a simple, educational tool for anyone interested in studying weekend volatility and market behavior in crypto. Thank you.

Gold Profit Target SystemGOLD PROFIT TARGET SYSTEM
Track Real Profits, Exit With Confidence
Best on Daily or Weekly - copy and mod as you see fit. Have fun!
WHAT THIS INDICATOR DOES:
This indicator tracks your gold position from entry and shows color-coded profit targets as the price rises. Instead of guessing when to exit, you see exact profit levels in real-time: 1%, 2%, 3%, 4%, 5%, 10%, 15%, 20%, 25%, and 25%+.
Simple concept: BUY on the signal, SELL at YOUR chosen profit level.
HOW IT WORKS - 3 SIMPLE STEPS:
STEP 1: Wait for BUY Signal
• Green triangle (▲) appears below the composite line
• Triggered when inverse assets (DXY, rates, etc.) show strong correlation and are falling
• Entry price is automatically recorded
• Position tracking begins
STEP 2: Watch Profit Targets Appear
• As gold rises, color-coded symbols appear above the composite line
• Each symbol represents a profit milestone
• The info table shows your current profit
• You decide when to exit based on YOUR target
STEP 3: Exit at Your Chosen Level
• Conservative? Exit at 5-10%
• Moderate? Exit at 10-15%
• Aggressive? Hold for 20%+
• The indicator just shows the levels - YOU make the call
THE COMPOSITE LINE - WHAT IT MEANS:
The main line is a weighted composite of inverse-correlated assets:
• DXY (US Dollar Index)
• Real Interest Rates (10Y TIPS)
• US 10-Year Treasury Yield
• US 2-Year Treasury Yield
• Bitcoin (optional)
• Copper (optional)
Line Position:
• Below -30 (Bright Green): Very strong inverse correlation - excellent BUY conditions
• Below 0 (Green): Inverse correlation present - moderate BUY conditions
• Above 0 (Red): Inverse assets rising - neutral to bearish
• Above 30 (Bright Red): Strong inverse rally - bearish for gold
What Causes BUY Signals:
When the composite line is negative (inverse assets falling) AND shows strong correlation (>0.3), this suggests gold is likely to rise. The indicator records your entry and begins tracking profits.
COLOR-CODED PROFIT TARGETS:
EARLY PROFITS (Green Circles):
• 1% - Very Light Green (#c8e6c9) - First confirmation
• 2% - Light Green (#a5d6a7) - Building profit
• 3% - Green (#81c784) - Good profit
• 4% - Medium Green (#66bb6a) - Strong profit
• 5% - Dark Green (#4caf50) - Solid profit!
EXCELLENT PROFIT (Yellow Diamond):
• 10% - Yellow (#ffd54f) - Double digits, excellent trade!
OUTSTANDING PROFIT (Orange Diamonds):
• 15% - Orange (#ffb74d) - Exceptional profit, consider partial exit
EXCEPTIONAL PROFIT (Red Diamonds):
• 20% - Light Red (#ff8a65) - Rare territory, strong exit consideration
• 25% - Red (#f44336) - Extraordinary profit, very rare!
PEAK PROFIT (Purple Star):
• 25%+ - Purple (#9c27b0) - Once in a blue moon! The home run trade!
STOP LOSS (Red X):
• Default -5% - Protection against losses
• Position auto-resets if stop is hit
THE PROFIT BAR (Histogram):
Below the composite line, you'll see a colored histogram when in position:
Bar Color = Your Current Profit Tier
• Light green bar = 1-2% profit
• Green bar = 3-5% profit
• Yellow bar = 10% profit
• Orange bar = 15% profit
• Red bar = 20-25% profit
• Purple bar = 25%+ profit
• Red negative bar = Currently at a loss
Bar Height = Current Profit %
The taller the bar, the larger your profit. Negative bars extend downward when you're at a loss.
THE INFORMATION TABLE:
The table (top-right by default) shows everything at a glance:
Position: ✓ IN (green) or ✗ OUT (gray)
Shows whether you're currently holding a position
Entry Price: Your recorded buy price
Example: 2,100.50
Current Price: Gold's current price
Example: 2,142.75
Current P/L: YOUR PROFIT %
This is the most important metric - shows exactly how much you're up (or down)
Color matches your current profit tier
Example: +2.01% in light green
Profit Tier: Current milestone reached
Shows which profit level you've hit: "1%", "2%", "5%", "10%", etc.
Next Target: The next profit level to watch
Tells you what milestone is coming up next
Bars Held: How long you've been in the trade
Helps track holding time
Composite: Current correlation strength
Shows the underlying composite correlation value
REFERENCE LINES:
Zero Line (Gray):
The center line. Above = bearish for gold, Below = bullish for gold
Strong Bull Line (Green dashed at -30):
When composite crosses below -30, very strong BUY conditions
Strong Bear Line (Red dashed at +30):
When composite crosses above +30, strong bearish conditions
BACKGROUND SHADING:
Very Light Green Background:
You're in profit (position open and above entry price)
Very Light Red Background:
You're at a loss (position open and below entry price)
No Background:
No position currently open
SYMBOLS ON CHART:
▲ Green Triangle Below Line: BUY SIGNAL
Enter long position here. Entry price recorded.
● Small Green Circles Above Line: 1-5% Profits
Early profit targets. Light green to dark green progression.
◆ Diamonds Above Line: 10-25% Profits
Major profit milestones. Yellow → Orange → Red progression.
★ Purple Star Above Line: 25%+ Profit
The holy grail! Peak profit achieved.
✖ Red X Below Line: STOP LOSS HIT
Trade went against you. Position resets (if auto-reset enabled).
PROFIT-TAKING STRATEGIES:
Strategy 1: Fixed Target (Simple)
Pick one target (e.g., 10%) and always exit there.
Best for: Beginners, disciplined traders
Strategy 2: Scaled Exit (Advanced)
Exit in portions:
• 5% profit → Sell 25%
• 10% profit → Sell 25% (50% total out)
• 15% profit → Sell 25% (75% total out)
• 20%+ profit → Let final 25% ride
Best for: Risk management, maximizing upside
Strategy 3: Trailing Stop
• Hit 10%? Set stop at 5%
• Hit 15%? Set stop at 10%
• Lock in profits while letting winners run
Best for: Trend followers, bull markets
Strategy 4: Adaptive
• Strong uptrend → wait for 15-20%
• Choppy market → exit at 5-10%
• Weakening trend → exit at any profit
Best for: Experienced traders
SETTINGS YOU CAN CUSTOMIZE:
Profit Target Levels:
Change any profit % to match your strategy
• Conservative: Lower targets (0.5%, 1%, 2%, 3%, 5%)
• Aggressive: Higher targets (2%, 5%, 10%, 20%, 30%)
Assets to Include:
• Enable/disable Bitcoin
• Enable/disable Copper
• Toggle which inverse assets to track
Display Options:
• Show all targets or just current tier
• Show/hide profit bar
• Show/hide composite line
• Move table position
Stop Loss:
• Set your risk tolerance (default 5%)
• Enable/disable auto-reset on stop loss
Correlation Periods:
• Adjust for your timeframe
• Hourly: 14/30/60
• Daily: 20/50/100
• Weekly: 10/20/50
ALERTS AVAILABLE:
Set alerts for any profit milestone:
Critical Alerts:
• "BUY Signal" - Entry notification
• "5% Profit Target" - First major milestone
• "10% Profit Target" - Decision point
• "Stop Loss Hit" - Risk protection
Optional Alerts:
• 1%, 2%, 3%, 4% - Early confirmations
• 15%, 20%, 25% - Major milestones
• Individual levels for your strategy
BEST TIMEFRAMES:
Daily Chart (Recommended):
Best for swing traders holding 3-10 days
Use default settings (20/50/100 periods)
Target 5-15% profits
4-Hour Chart:
Good for active swing traders
Adjust periods to 14/30/60
Target 3-10% profits
Hourly Chart:
For day traders and scalpers
Use shorter periods (14/30/60)
Target 1-5% profits
Adjust profit levels lower (0.5%, 1%, 2%, 3%)
WHY THIS INDICATOR IS DIFFERENT:
Most indicators tell you WHEN to enter.
This one tells you WHEN TO EXIT with profit.
Most indicators use vague signals.
This one shows EXACT profit percentages.
Most indicators leave exit decisions to you.
This one gives CLEAR, COLOR-CODED milestones.
Most indicators don't track your P/L.
This one shows your profit in text you can't miss.
QUICK START GUIDE:
1. Add indicator to gold chart (XAUUSD, GLD, GC1!)
2. Wait for green triangle (▲) BUY signal
3. Watch your profit grow in the table
4. Exit when you hit YOUR target (5%, 10%, 15%, etc.)
5. Repeat
That's it. Simple. Effective. Profitable.
IMPORTANT NOTES:
• This is for LONG positions only - not for shorting gold
• Position tracking begins only after a BUY signal
• The indicator shows levels - YOU decide when to exit
• Always use stop losses (default 5% is reasonable)
• Past performance doesn't guarantee future results
• Not financial advice - use for educational purposes
PRO TIPS:
Tip 1: Don't get greedy - 10-15% is an excellent profit for most trades
Tip 2: Purple stars (25%+) are RARE - don't wait for them on every trade
Tip 3: The profit bar color change is your visual cue - green→yellow→orange→red
Tip 4: Combine with resistance levels - "10% profit + resistance = exit"
Tip 5: Set alerts for YOUR target level so you never miss it
Tip 6: The giant P/L number in the table removes emotion from decisions
EXAMPLE TRADE:
Day 1: ▲ BUY signal at $2,100
Table shows: Position ✓ IN | Entry: 2,100
Day 2: Current P/L: +1.8%
First green circle appears (1% target hit)
Table tier: "1%"
Day 4: Current P/L: +5.2%
Dark green circle appears (5% target hit)
Profit bar is dark green
Decision point: Exit 50% here?
Day 7: Current P/L: +10.5%
Yellow diamond appears (10% target hit!)
Table shows: +10.5% in yellow text
Decision point: Exit remaining 50%?
Result: Average exit ~7.5% over 7 days. Excellent swing trade!
WORKS ON:
• Gold Spot (XAUUSD)
• Gold Futures (GC1!)
• Gold ETFs (GLD, IAU)
• Any gold instrument
Inverse Assets Tracked:
• DXY (US Dollar Index)
• Real Interest Rates (TIPS)
• US Treasury Yields (2Y, 10Y)
• Bitcoin (optional)
• Copper (optional)
THE BOTTOM LINE:
Stop guessing when to take profits.
Start SEEING your profit levels in real-time.
The indicator shows you the targets.
YOU choose when to cash out.
That's YOUR edge.
Developed for traders who want clear, actionable profit targets instead of vague signals.

RSI Open-Source IndicatorA simple open-source RSI indicator
using default settings.
No signals.
No predictions.

Lot Size & Risk Calculator All Pairs NEWLot Size & Risk Calculator All Pairs NEW
Description
Professional risk and position size calculator for traders working with various financial instruments.
Main difference from standard indicators:
Standard risk calculators only show basic Risk/Reward for the entire position. But in real trading, we often close positions partially at different take-profit levels, and the final Risk/Reward changes significantly with this approach! This indicator calculates weighted Risk/Reward taking into account position distribution across multiple take-profit levels.
Main features:
- Support for 4 instrument types: Forex, XAUUSD (gold), BTCUSD (bitcoin), US100 (NASDAQ index)
- Automatic position size calculation based on risk and stop-loss distance
- Multiple take-profit levels with customizable closing percentages
- Weighted Risk/Reward calculation considering position distribution
- Ability to adjust position distribution between take-profits to optimize final profit
- Display of total percentage growth of deposit from all take-profit levels
- 2 visualization options: colored fill between levels or lines
- Informative results panel in table format
Settings by groups:
Core Settings
- Currency: select instrument type (Forex, XAUUSD, BTCUSD, US100)
- Account Balance: trading account size in dollars
- Risk %: risk percentage from deposit (0.1-100%)
- Use Custom Contract Sizes: manual contract size configuration
Point Value Settings
- Use automatic point value calculation: automatic point value calculation
- Manual point value: manual point value input (for non-standard contracts)
Levels
- Entry Price: entry price (confirmation required on first use)
- Stop Price: stop-loss price
- Take-Profit Prices: take-profit prices (up to 3 levels)
- TP Close %: percentage of position closed at each take-profit level
Dashboard
- Show Targets Profit: display profit from take-profit levels
- Label Size: text size in the table
- Dashboard Position: table position on the chart
How to use:
Step 1: Initial setup (when first adding)
1. Enter entry price (Entry Price) - confirmation window will appear (click on desired bar)
2. Then enter stop-loss price (Stop Price) (click on desired bar)
3. Add first take-profit (TP1) (click on desired bar)
4. Second and third take-profits are added through checkboxes (click on the settings gear icon to open them)
Step 2: Instrument selection and risk configuration
1. In "Core" group, select your instrument type
2. Set account balance and risk percentage
Step 3: Position distribution configuration
1. Set TP Close % for each take-profit level (e.g.: TP1 - 33%, TP2 - 33%, TP3 - 34%)
2. Experiment with distribution! By changing closing percentages, you can:
- Increase/decrease final Risk/Reward
- Optimize risk/profit ratio
- Find the most comfortable position distribution for you
Step 4: Results analysis
1. Results table will show:
- Calculated position size (lots/contracts)
- Risk in monetary terms
- Risk/Reward for each take-profit level
- Weighted R:R considering position distribution
- Total potential profit from all take-profits
- Percentage growth of deposit - total profit percentage from all take-profit levels
Key features:
Position distribution adjustment
You can easily find optimal position distribution between take-profits:
- Aggressive approach: higher percentage on distant take-profit (higher profit potential)
- Conservative approach: higher percentage on near take-profit (faster profit taking)
- Balanced: even distribution for risk reduction
Weighted Risk/Reward
The indicator calculates not just simple R:R for the entire position, but weighted value that considers:
- Position distribution between take-profits
- Different distances to each take-profit level
- Closing percentage at each level
Results visualization
- Colored fill shows risk and profit zones
- Labels at levels display specific profit/loss values
- Results table contains all key metrics
Creation story
This indicator was created based on the original calculator by @Algoryze As a trader, I lacked the ability to see real Risk/Reward when partially closing positions and a convenient tool for selecting optimal position distribution between take-profit levels. I improved the indicator by adding:
- Weighted Risk/Reward calculation
- Ability to adjust closing percentage at each take-profit
- Display of total percentage growth of deposit
- Improved interface and visualization
I hope this tool will be useful to other traders who use strategies with partial position closing!
Important notes:
1. When first adding the indicator, be sure to enter prices in order: Entry → Stop → TP1
2. TP2 and TP3 are added through input fields (no confirmation required)
3. Closing percentages are automatically normalized if the sum is not 100%
4. Experiment with position distribution to find optimal risk/profit ratio
5. For different instruments, add separate copies of the indicator in different tabs
Support
For questions and suggestions, leave comments in the indicator publication on TradingView.
---
Important: All calculations are provided for informational purposes only. Trading involves risks, trade responsibly. The indicator helps with calculations but does not guarantee profit.
