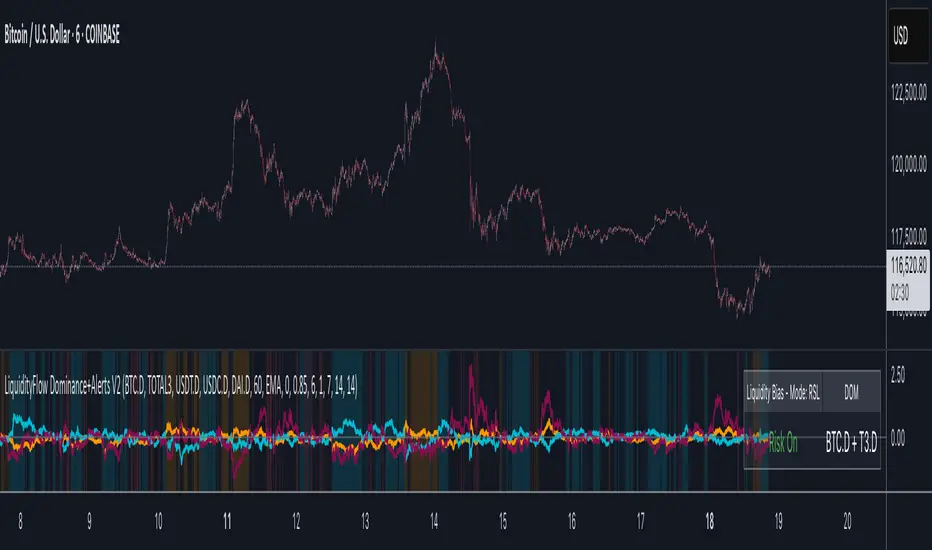
Change in DominanceTitle: Change in Dominance Indicator
Description:
This is a tool designed to gauge the prevailing trend in the cryptocurrency market. By analyzing the Rate of Change (ROC) in percentage terms over the previous 9 bars for BTC Dominance (BTC.D), Ethereum Dominance (ETH.D), Other Altcoins Dominance (OTHER.D), and USDT Dominance (USDT.D).
How It Works:
The indicator calculates the ROC for BTC.D, ETH.D (aggregated as part of the Altcoin market), OTHER.D (also included in the Altcoin calculation), and USDT.D.
Three lines represent the trends for Bitcoin (BTC), Altcoins (ETH and OTHER combined), and USDT respectively:
Green Line: Represents the trend for BTC. A higher green line indicates a dominance of BTC in the market trend, suggesting money flow into Bitcoin.
Silver Line: Indicates the Altcoin trend (combining ETH and OTHER). When the silver line is the highest among the three, it signals that Altcoins are leading the market, which can be considered bullish as it suggests money is flowing into Altcoins.
Red Line: Represents the USDT trend. A dominant red line over others implies a bearish market sentiment, indicating money flow out of cryptocurrencies and into USDT.
Usage Tips:
Altcoin Bullishness: When the silver line is above both the red and green lines, it suggests a bullish trend for Altcoins, indicating that money is flowing into the Altcoin sector of the market.
Market Bearishness: If the red line surpasses the silver and green lines, it could be a signal that investors are moving their funds into USDT, often a sign of bearish market sentiment.
BTC Bullishness: A higher green line compared to the silver and red lines implies that Bitcoin is the dominant force in the market, suggesting a bullish sentiment for BTC.
스크립트에서 "bitcoin"에 대해 찾기
BTC Supply in Profits and Losses (BTCSPL) [AlgoAlpha]Description:
🚨The BTC Supply in Profits and Losses (BTCSPL) indicator, developed by AlgoAlpha, offers traders insights into the distribution of INDEX:BTCUSD addresses between profits and losses based on INDEX:BTCUSD on-chain data.
Features:
🔶Alpha Decay Adjustment: The indicator provides the option to adjust the data against Alpha Decay, this compensates for the reduction in clarity of the signal over time.
🔶Rolling Change Display: The indicator enables the display of the rolling change in the distribution of Bitcoin addresses between profits and losses, aiding in identifying shifts in market sentiment.
🔶BTCSPL Value Score: The indicator optionally displays a value score ranging from -1 to 1, traders can use this to carry out strategic dollar cost averaging and reverse dollar cost averaging based on the implied value of bitcoin.
🔶Reversal Signals: The indicator gives long-term reversal signals denoted as "▲" and "▼" for the price of bitcoin based on oversold and overbought conditions of the BTCSPL.
🔶Moving Average Visualization: Traders can choose to display a moving average line, allowing for better trend identification.
How to Use ☝️ (summary):
Alpha Decay Adjustment: Toggle this option to enable or disable Alpha Decay adjustment for a normalized representation of the data.
Moving Average: Toggle this option to show or hide the moving average line, helping traders identify trends.
Short-Term Trend: Enable this option to display the short-term trend based on the Aroon indicator.
Rolling Change: Choose this option to visualize the rolling change in the distribution between profits and losses.
BTCSPL Value Score: Activate this option to show the BTCSPL value score, ranging from -1 to 1, 1 implies that bitcoin is extremely cheap(buy) and -1 implies bitcoin is extremely expensive(sell).
Reversal Signals: Gives binary buy and sell signals for the long term
Cumulative Volume Value (BTC)The Cumulative Volume Value (BTC) indicator is designed to visualize and analyze cumulative volume data specific to Bitcoin. This indicator provides insights into the total volume transacted over a time, aiding in understanding market activity and potential value of Bitcoin.
It considers whether the closing price is greater than the opening price over the defined length, adding or subtracting volume accordingly.
The Cumulative Volume Value (BTC) indicator offers a valuable perspective on Bitcoin's market activity by visualizing cumulative volume and providing insights into potential market tops, bottoms, and the relationship between volume and BTC value movements.
Peaks in the cumulative volume might suggest potential tops in the BTC market, indicating periods of intense trading activity.
Conversely, bottoms in cumulative volume might signal potential market bottoms, representing phases of reduced trading activity or consolidation.
This is how human psychology works. The greatest activity is close to the peak and the worst when the price of BTC has decreased to the level when people lose interest and faith in the cryptocurrency market and the volume of trades falls, then the best time to buy.
Important Considerations:
Historical patterns suggest a relationship between cumulative volume and market tops/bottoms, but this indicator should be used in conjunction with other technical analysis tools for informed trading decisions.
Past performance of cumulative volume in relation to market tops or bottoms does not guarantee future outcomes in financial markets.
Limited Growth Stock-to-Flow (LGS2F) [AlgoAlpha]Description:
The "∂ Limited Growth Stock-to-Flow (LG-S2F)" indicator, developed by AlgoAlpha, is a technical analysis tool designed to analyze the price of Bitcoin (BTC) based on the Stock-to-Flow model. The indicator calculates the expected price range of BTC by incorporating variables such as BTC supply, block height, and model parameters. It also includes error bands to indicate potential overbought and oversold conditions.
How it Works:
The LG-S2F indicator utilizes the Stock-to-Flow model, which measures the scarcity of an asset by comparing its circulating supply (stock) to its newly produced supply (flow). In this script, the BTC supply and block height data are obtained to calculate the price using the model formula. The formula includes coefficients (a, b, c) and exponentiation functions to derive the expected price.
The script incorporates error bands based on uncertainty values derived from the standard errors of the model parameters. These error bands indicate the potential range of variation in the expected price, accounting for uncertainties in the model's parameters. The upper and lower error bands visualize potential overbought and oversold conditions, respectively.
Usage:
Traders can utilize the LG-S2F indicator to gain insights into the potential price movements of Bitcoin. The indicator's main line represents the expected price, while the error bands highlight the potential range of variation. Traders may consider taking long positions when the price is near or below the lower error band and short positions when the price is close to or above the upper error band.
It's important to note that the LG-S2F indicator is specifically designed for Bitcoin and relies on the Stock-to-Flow model. Users should exercise caution and consider additional analysis and factors before making trading decisions solely based on this indicator.
Originality:
The LG-S2F indicator, developed by QuantMario and AlgoAlpha, is an original implementation that combines the Stock-to-Flow model with error bands to provide a comprehensive view of BTC's potential price range. While the concept of Stock-to-Flow analysis exists, the specific calculations, incorporation of error bands, and customization options in this script are unique to QuantMario's methodology. The script is released under Mozilla Public License 2.0, allowing users to utilize and modify it while adhering to the license terms.
Cumulative Value Coin Days DestroyedIndicator overview
CVDD stands for Cumulative Value Coin Days Destroyed.
Coin Days Destroyed is a term used for bitcoin to identify a value of sorts to UTXO’s (unspent transaction outputs). You can learn more about UTXO’s here. They can be thought of as coins moving between wallets.
When coins are sent between wallets, the transaction has:
a USD value
plus, it also destroys a time value in terms of how long the original investor held their coins
That value is Coin Days Destroyed (CDD).
CVDD tracks the cumulative sum of this value-time destruction as coins move from old hands into new hands as a ratio of the market age. It is then multiplied by 6 million, which is a somewhat arbitrary number as it is not linked to any relevant Bitcoin data.
The result is that it has historically correctly forecasted the major lows of Bitcoins price with good accuracy.
To creat a valuating of indicator was used normilized distance between price and CVDD, so the bigger distance of price from CVDD the lower will be value max -1 and vice versa the closes price to CVDD the biggest value max 1
(alert with value)
CVDD was created by @woonomic.
Net Unrealized Profit/Loss (NUPL)Indicator Overview
This indicator is derived from Market Value and Realized Value, which can be defined as:
Market Value: The current price of Bitcoin multiplied by the number of coins in circulation. This is like market cap in traditional markets i.e. share price multiplied by number of shares.
Realized Value: Rather than taking the current price of Bitcoin, Realized Value takes the price of each Bitcoin when it was last moved i.e. the last time it was sent from one wallet to another wallet. It then adds up all those individual prices and takes an average of them. It then multiplies that average price by the total number of coins in circulation.
By subtracting Realized Value from Market Value we calculate Unrealized Profit/Loss.
Unrealized Profit/Loss estimates the total paper profits/losses in Bitcoin held by investors. This is interesting to know but of greater value is identifying how this changes relatively over time.
To do this we can divide Unrealized Profit/Loss by Market Cap. This creates Net Unrealized Profit/Loss, sometimes referred to as NUPL, which is very useful to track investor sentiment over time for Bitcoin.
Relative Unrealised Profit/Loss is another name used for this analysis.
How To View The Chart
The key principle of this tool is in the ratio between market cap and Bitcoin investors taking profit.
When market cap rises much faster than profit taking we see that the market is overheating, one could say due to investor greed (red band). For the strategic investor such times have historically been favourable to take profit.
We can break down different percentages of Bitcoin Relative Unrealized Profit/Loss to determine what stage of the market we are in. This can be advantageous for the long term strategic investor.
Created By
Tamas Blummer, Tuur Demeester and Michiel Lescrauwaet
ahr999 Index█ OVERVIEW
The ahr999 index is very suitable for long-term value investors in Bitcoin.
When the index is above 1.2, it indicates that the price of Bitcoin is rising in a bull market.
When it is below 1.2, it indicates a reasonable cost averaging interval for investment.
When it is below 0.45, it indicates that the price of Bitcoin is underestimated and is a relatively high-certainty bottoming interval.
█ CONCEPTS
ahr999 is the product of two indices, one is Bitcoin's 200-day average price cost and the other is a price estimate fitted to Bitcoin's age.
The average cost is actually a geometric mean of bitcoin price in 200days.
and the estimate price was calculated by a log function based on the bitcoin price history since 2010.
finally we got the formula:
ahr999 Index = (close / GMA200) * (close / Estimate Price)
█ ACKNOWLEDGEMENT
This ahr999 index was originally created by Nine God in his book 《Bitcoin Accumulation》
Crypto Portfolio ManagementCrypto Portfolio Management
This is an indicator not like the other ones that you regularly see in tradingview. The main difference is that this indicator does not plot a value for each candle bar like you would see with RSI or MACD. Actually it is table and it just uses tradingview great database of assets to plot some valuebale information that can not be found elsewhere easily. These metrics are some basic one that is used by portfolio managers to decide what they want to hold in their portfolio. The basic idea is that you should hold assets in your basket that are less correlated to the benchmark.
Benchmark in traditional context refers to main market indices like S&P 500 of US market. But they already have a lot of tools available. My effort was for crypto investors who are trying to rebalance their portfolio every month or week to have some good metrics to make decision. Because of this I used Bitcoin as crypto market benchmark. So, everything is compared to bitcoin in this script. I’m gonna explain the terms that is used in the table’s columns below.
MAKE SURE YOU PUT YOUR CHART AT DAILY AND AT THE MAXIMUM AVAILABLE DATA EXCHANGE.
Y-Exp
This is yearly expected return of the asset. It is simply the mean of the yearly returns of the asset. (these calculations are not typical in Tradingview because mainly we calculate on each bar and give value at the same bar but here this value to change once a year). Remember that the higher this value is the better it is because historically the asset have shown good returns but there is a tip: Always check the available historical data in any asset that you are adding if you add an asset that has only 1 year of data available or you use an exchange data that recently added the coin you will get unsignificant results and the results can not be trusted. You should always selects coins and market (coins can be changed in setting) that have the largest data available.
Y-SDev
This is a little bit complicated than the previous. This is the standard deviation of the yearly returns. This is a classic measure of RISK in financial markets. The higher the value, the more risk is involved with the asset that you have added. If you added two assets that have same returns but different Standard deviations, the rational thinker should choose the asset with lower Standard deviation.
The standard deviation is a good place to start but there are some considerations to have -it is getting complicated and average user should not be involved with these terms and can ignore the next phrases- standard deviation and mean of the yearly returns are random variables, these variables have a theoretical probability density function and these functions are not gaussian normal distribution. Because of this in the professional usage these returns should be transformed to a normal distribution and have all these terms calculated there and then transform back to its own normal state and then be used for any serious investment decision. I think these calculations can be done on Tradingview but I need you support to do this in the form of like and share of my scripts and ideas.
M-Exp and M-SDev
These terms are like the previous ones but it is calculated on monthly returns. As it goes for yearly return, the monthly returns change once a monthly candle closes. So be patient to use this indicator.
I highly recommend not to make decisions on monthly data due to a lot of noise involved with this market but in long run it is ok. So go with yearly returns and wait at least for 3 years to see your results.
CorToBTC
Basically you want to buy something that is less correalted with the benchmark. this is the correlation of the asset to bitcoin.
Sharpe Ratio
This is one of the most used metric as a risk adjusted return measurment. you can google it for more information. The higher this value the better. remmeber with any invenstment it is important to understand risks associated with the assets that you are buying.
DownFromATH
This metric that I didn't see anywhere in the tradingview and is familiar in the platforms like coinmarketcap. this is a real calculation of precentage down from ATH (All Time High). it means how much percentage a coin is down from the maximum price that the asset has experienced until now.
***
Remember you can change all the asset except main asset. If you like this script to 500 I will update this continuously.
BTC HASHRATE DROP: OnchainWhy is the drop of hashrate important?
Drop of hashrate usually occurs because some miners in the mining network stop for working. There are several possible reasons for this. Such as new anti-mining regulations in some countries or a sharp drop in the price of bitcoin, which makes mining no longer affordable for some miners. So they turn off their devices
This reduces the supply of bitcoin in the market and according to the law of supply and demand can eventually lead to an increase in the price of bitcoin.
This oscillator is designed to detect hashrate drop. for this, we use the data of glassnode . Maroon color indicates decrease in hashrate and Red color indicates excessive hash rate drop. As can be seen on the chart, usually after this drop, we see an increase in the price of bitcoin
BTC NVM Ratio - Onchain AnalysisIt is an onchain oscillator and is designed to operate at weekly timeframes and is only for Bitcoin.
Network Value to Metcalfe Ratio (NVM Ratio) is defined as the ratio of the log of market capitalization divided by the log of the square of daily active addresses in the specified window.
This oscillator evaluates bitcoin price according to the Metcalfe Ratio to shows whether the current value of Bitcoin is higher or lower than the real price
I made this comparison using a moving average of 100. The areas that are red in the weekly timeframe indicate that bitcoin is Overvalued. and The areas that are blue in the weekly timeframe indicate that bitcoin is undervalued.
Anchored BTCIntroduce
When looking at altcoins and bitcoins together and seeing coupling and decoupling, we add a bitcoin chart in the "Compare" tab.
We checked where the coupling occurs in "Auto" mode, but if we move the chart, the overlapped position will change.
So I created the “Anchored BTC” indicator, which made the Bitcoin chart immovable.
How to use
First, add a bitcoin chart in the "Compare" tab and compare it with the altcoin chart.
And add the "Correlation Coefficient" built-in indicator to find the part where the correlation coefficient is 0.8 or higher.(it means finding well coupled part)
Among them, set the swing high or swing low part to Time1 and Time2.
Check if it looks the same as the existing BTC chart and you are done.
소개
알트코인과 비트코인을 함께 보며 커플링과 디커플링을 볼 때 우리는 비교 탭에서 비트코인 차트를 추가하여 봅니다.
"오토" 모드로 어느 부분에서 커플링이 일어나는지 체크했는데 차트를 옮기면 겹쳐놓아졌던 위치가 달라지게됩니다.
그래서 "Anchored BTC" 지표를 만들어, 비트코인 차트가 움직이지 못하게 만들었습니다.
사용법
우선 비교탭에서 비트코인차트를 추가하여 알트코인 차트와 비교해봅니다.
그리고 "상관계수" 빌트인 지표를 추가하여 상관계수가 0.8이상인 부분을 찾습니다.(커플링한 부분을 찾는겁니다)
이 중에서 스윙하이나 스윙로우인 부분을 Time1, Time2로 맞춰줍니다.
기존의 BTC차트와 동일하게 보여지는지 확인하면 끝납니다.
HYE Combo Market [Strategy] (Vwap Mean Reversion + Trend Hunter)In this strategy, I used a combination of trend hunter and vwap mean reversion strategies that I published before.
Trend Hunter Strategy:
Mean Reversion Vwap Strategy:
The results are quite impressive, especially for bitcoin.
While the hodl return for bitcoin was 13419%, the strategy's return in the same period was about 5 times (65000%) of this.
s3.tradingview.com
In this combo strategy, I made some changes to the original settings of the strategies used together and added some more new features.
Trend Hunter Strategy Settings: (Original / Combo)
- Slow Tenkansen Period : 9 / 9
- Slow Kijunsen Period : 26 / 13
- Fast Tenkansen Period : 5 / 3
- Fast Kijunsen Period : 13 / 7
- BB Length : 20 / 20
- BB Stdev : 2 / 2
- TSV Length : 13 / 20
- TSV Ema Length : 7 / 7
* I also added a "vidya moving average" to be used as a confirmation tool to open a long position. (Candle close must be above the vidya line.)
Vwap Mean Reversion Strategy Settings: (Original / Combo)
- Small Vwap : 2 / 8
- Big Vwap : 5 / 10
- Percent Below to Buy : 3 / 2
- RSI Period : 2 / 2
- RSI Ema Period : 5 / 5
- Maximum RSI Level for Buy : 30
* I also added a "mean vwap line" to be used for exits in this part of the strategy. In the original version, when small vwap crossovers big vwap, we close the position, but in this strategy we will wait for the close above the mean vwap.
TIPS AND WARNINGS
1-) The standard settings of this combo strategy is designed and tested with daily timeframe. For lower timeframes, you should change the strategy settings and find the best value for yourself.
2-) Only the mean vwap line is displayed on the graph. For a detailed view, you can delete the "//" marks from the plot codes in the strategy code.
3-) This is a strategy for educational and experimental purposes. It cannot be considered as investment advice. You should be careful and make your own risk assessment when opening real market trades using this strategy.
________________________________________________________
Bu stratejide, daha önce yayınladığım trend avcısı ve vwap ortalamaya geri dönüş stratejilerinin bir kombinasyonunu kullandım.
Sonuçlar özellikle bitcoin için oldukça etkileyici.
Bitcoin için hodl getirisi %13419 iken, stratejinin aynı dönemdeki getirisi bunun yaklaşık 5 katı (%65000) idi.
Bu kombo stratejide, birlikte kullanılan stratejilerin orijinal ayarlarında bazı değişiklikler yaptım ve bazı yeni özellikler ekledim.
Trend Avcısı Strateji Ayarları: (Orijinal / Combo)
- Yavaş Tenkansen Periyodu : 9 / 9
- Yavaş Kijunsen Periyodu : 26 / 13
- Hızlı Tenkansen Periyodu : 5 / 3
- Hızlı Kijunsen Periyodu : 13 / 7
- BB Uzunluğu : 20 / 20
- BB Standart Sapması : 2 / 2
- TSV Uzunluğu : 13 / 20
- TSV Ema Uzunluğu : 7 / 7
* Ayrıca long pozisyon açmak için onay aracı olarak kullanılmak üzere "vidya hareketli ortalama" ekledim. (Mum kapanışı vidya çizgisinin üzerinde olmalıdır.)
Vwap Ortalamaya Dönüş Stratejisi Ayarları: (Orijinal / Combo)
- Küçük Vwap : 2 / 8
- Büyük Vwap : 5 / 10
- Alış İçin Gerekli Fark Oranı : 3 / 2
- RSI Periyodu : 2 / 2
- RSI Ema Periyodu: 5 / 5
- Alış için gerekli maksimum RSI seviyesi : 30
* Stratejinin bu bölümünde pozisyondan çıkışlar için kullanılacak bir "ortalama vwap çizgisi" de ekledim. Orijinal versiyonda, küçük vwap, büyük vwap'ı yukarı kestiğinde pozisyonu kapatıyoruz, ancak bu stratejide, ortalama vwap'ın üzerindeki kapanışı bekleyeceğiz.
İPUÇLARI VE UYARILAR
1-) Bu birleşik stratejinin standart ayarları, günlük zaman dilimi ile tasarlanmış ve test edilmiştir. Daha düşük zaman dilimleri için strateji ayarlarını değiştirmeli ve kendiniz için en iyi değeri bulmalısınız.
2-) Grafikte sadece ortalama vwap çizgisi görüntülenir. Ayrıntılı bir görünüm için strateji kodundaki "plot" ile başlayan satırlarda grafikte görünmesini istediğiniz özelliğin önündeki "//" işaretlerini silebilirsiniz.
3-) Eğitim ve deneysel amaçlı bir stratejidir. Yatırım tavsiyesi olarak değerlendirilemez. Bu stratejiyi kullanarak gerçek piyasa işlem açarken dikkatli olmalı ve kendi risk değerlendirmenizi yapmalısınız.
888 BOT #backtest█ 888 BOT #backtest (open source)
This is an Expert Advisor 'EA' or Automated trading script for ‘longs’ and ‘shorts’, which uses only a Take Profit or, in the worst case, a Stop Loss to close the trade.
It's a much improved version of the previous ‘Repanocha’. It doesn`t use 'Trailing Stop' or 'security()' functions (although using a security function doesn`t mean that the script repaints) and all signals are confirmed, therefore the script doesn`t repaint in alert mode and is accurate in backtest mode.
Apart from the previous indicators, some more and other functions have been added for Stop-Loss, re-entry and leverage.
It uses 8 indicators, (many of you already know what they are, but in case there is someone new), these are the following:
1. Jurik Moving Average
It's a moving average created by Mark Jurik for professionals which eliminates the 'lag' or delay of the signal. It's better than other moving averages like EMA , DEMA , AMA or T3.
There are two ways to decrease noise using JMA . Increasing the 'LENGTH' parameter will cause JMA to move more slowly and therefore reduce noise at the expense of adding 'lag'
The 'JMA LENGTH', 'PHASE' and 'POWER' parameters offer a way to select the optimal balance between 'lag' and over boost.
Green: Bullish , Red: Bearish .
2. Range filter
Created by Donovan Wall, its function is to filter or eliminate noise and to better determine the price trend in the short term.
First, a uniform average price range 'SAMPLING PERIOD' is calculated for the filter base and multiplied by a specific quantity 'RANGE MULTIPLIER'.
The filter is then calculated by adjusting price movements that do not exceed the specified range.
Finally, the target ranges are plotted to show the prices that will trigger the filter movement.
Green: Bullish , Red: Bearish .
3. Average Directional Index ( ADX Classic) and ( ADX Masanakamura)
It's an indicator designed by Welles Wilder to measure the strength and direction of the market trend. The price movement is strong when the ADX has a positive slope and is above a certain minimum level 'ADX THRESHOLD' and for a given period 'ADX LENGTH'.
The green color of the bars indicates that the trend is bullish and that the ADX is above the level established by the threshold.
The red color of the bars indicates that the trend is down and that the ADX is above the threshold level.
The orange color of the bars indicates that the price is not strong and will surely lateralize.
You can choose between the classic option and the one created by a certain 'Masanakamura'. The main difference between the two is that in the first it uses RMA () and in the second SMA () in its calculation.
4. Parabolic SAR
This indicator, also created by Welles Wilder, places points that help define a trend. The Parabolic SAR can follow the price above or below, the peculiarity that it offers is that when the price touches the indicator, it jumps to the other side of the price (if the Parabolic SAR was below the price it jumps up and vice versa) to a distance predetermined by the indicator. At this time the indicator continues to follow the price, reducing the distance with each candle until it is finally touched again by the price and the process starts again. This procedure explains the name of the indicator: the Parabolic SAR follows the price generating a characteristic parabolic shape, when the price touches it, stops and turns ( SAR is the acronym for 'stop and reverse'), giving rise to a new cycle. When the points are below the price, the trend is up, while the points above the price indicate a downward trend.
5. RSI with Volume
This indicator was created by LazyBear from the popular RSI .
The RSI is an oscillator-type indicator used in technical analysis and also created by Welles Wilder that shows the strength of the price by comparing individual movements up or down in successive closing prices.
LazyBear added a volume parameter that makes it more accurate to the market movement.
A good way to use RSI is by considering the 50 'RSI CENTER LINE' centerline. When the oscillator is above, the trend is bullish and when it is below, the trend is bearish .
6. Moving Average Convergence Divergence ( MACD ) and ( MAC-Z )
It was created by Gerald Appel. Subsequently, the histogram was added to anticipate the crossing of MA. Broadly speaking, we can say that the MACD is an oscillator consisting of two moving averages that rotate around the zero line. The MACD line is the difference between a short moving average 'MACD FAST MA LENGTH' and a long moving average 'MACD SLOW MA LENGTH'. It's an indicator that allows us to have a reference on the trend of the asset on which it is operating, thus generating market entry and exit signals.
We can talk about a bull market when the MACD histogram is above the zero line, along with the signal line, while we are talking about a bear market when the MACD histogram is below the zero line.
There is the option of using the MAC-Z indicator created by LazyBear, which according to its author is more effective, by using the parameter VWAP ( volume weighted average price ) 'Z-VWAP LENGTH' together with a standard deviation 'STDEV LENGTH' in its calculation.
7. Volume Condition
Volume indicates the number of participants in this war between bulls and bears, the more volume the more likely the price will move in favor of the trend. A low trading volume indicates a lower number of participants and interest in the instrument in question. Low volumes may reveal weakness behind a price movement.
With this condition, those signals whose volume is less than the volume SMA for a period 'SMA VOLUME LENGTH' multiplied by a factor 'VOLUME FACTOR' are filtered. In addition, it determines the leverage used, the more volume , the more participants, the more probability that the price will move in our favor, that is, we can use more leverage. The leverage in this script is determined by how many times the volume is above the SMA line.
The maximum leverage is 8.
8. Bollinger Bands
This indicator was created by John Bollinger and consists of three bands that are drawn superimposed on the price evolution graph.
The central band is a moving average, normally a simple moving average calculated with 20 periods is used. ('BB LENGTH' Number of periods of the moving average)
The upper band is calculated by adding the value of the simple moving average X times the standard deviation of the moving average. ('BB MULTIPLIER' Number of times the standard deviation of the moving average)
The lower band is calculated by subtracting the simple moving average X times the standard deviation of the moving average.
the band between the upper and lower bands contains, statistically, almost 90% of the possible price variations, which means that any movement of the price outside the bands has special relevance.
In practical terms, Bollinger bands behave as if they were an elastic band so that, if the price touches them, it has a high probability of bouncing.
Sometimes, after the entry order is filled, the price is returned to the opposite side. If price touch the Bollinger band in the same previous conditions, another order is filled in the same direction of the position to improve the average entry price, (% MINIMUM BETTER PRICE ': Minimum price for the re-entry to be executed and that is better than the price of the previous position in a given %) in this way we give the trade a chance that the Take Profit is executed before. The downside is that the position is doubled in size. 'ACTIVATE DIVIDE TP': Divide the size of the TP in half. More probability of the trade closing but less profit.
█ STOP LOSS and RISK MANAGEMENT.
A good risk management is what can make your equity go up or be liquidated.
The % risk is the percentage of our capital that we are willing to lose by operation. This is recommended to be between 1-5%.
% Risk: (% Stop Loss x % Equity per trade x Leverage) / 100
First the strategy is calculated with Stop Loss, then the risk per operation is determined and from there, the amount per operation is calculated and not vice versa.
In this script you can use a normal Stop Loss or one according to the ATR. Also activate the option to trigger it earlier if the risk percentage is reached. '% RISK ALLOWED'
'STOP LOSS CONFIRMED': The Stop Loss is only activated if the closing of the previous bar is in the loss limit condition. It's useful to prevent the SL from triggering when they do a ‘pump’ to sweep Stops and then return the price to the previous state.
█ BACKTEST
The objective of the Backtest is to evaluate the effectiveness of our strategy. A good Backtest is determined by some parameters such as:
- RECOVERY FACTOR: It consists of dividing the 'net profit' by the 'drawdown’. An excellent trading system has a recovery factor of 10 or more; that is, it generates 10 times more net profit than drawdown.
- PROFIT FACTOR: The ‘Profit Factor’ is another popular measure of system performance. It's as simple as dividing what win trades earn by what loser trades lose. If the strategy is profitable then by definition the 'Profit Factor' is going to be greater than 1. Strategies that are not profitable produce profit factors less than one. A good system has a profit factor of 2 or more. The good thing about the ‘Profit Factor’ is that it tells us what we are going to earn for each dollar we lose. A profit factor of 2.5 tells us that for every dollar we lose operating we will earn 2.5.
- SHARPE: (Return system - Return without risk) / Deviation of returns.
When the variations of gains and losses are very high, the deviation is very high and that leads to a very poor ‘Sharpe’ ratio. If the operations are very close to the average (little deviation) the result is a fairly high 'Sharpe' ratio. If a strategy has a 'Sharpe' ratio greater than 1 it is a good strategy. If it has a 'Sharpe' ratio greater than 2, it is excellent. If it has a ‘Sharpe’ ratio less than 1 then we don't know if it is good or bad, we have to look at other parameters.
- MATHEMATICAL EXPECTATION: (% winning trades X average profit) + (% losing trades X average loss).
To earn money with a Trading system, it is not necessary to win all the operations, what is really important is the final result of the operation. A Trading system has to have positive mathematical expectation as is the case with this script: ME = (0.87 x 30.74$) - (0.13 x 56.16$) = (26.74 - 7.30) = 19.44$ > 0
The game of roulette, for example, has negative mathematical expectation for the player, it can have positive winning streaks, but in the long term, if you continue playing you will end up losing, and casinos know this very well.
PARAMETERS
'BACKTEST DAYS': Number of days back of historical data for the calculation of the Backtest.
'ENTRY TYPE': For '% EQUITY' if you have $ 10,000 of capital and select 7.5%, for example, your entry would be $ 750 without leverage. If you select CONTRACTS for the 'BTCUSDT' pair, for example, it would be the amount in 'Bitcoins' and if you select 'CASH' it would be the amount in $ dollars.
'QUANTITY (LEVERAGE 1X)': The amount for an entry with X1 leverage according to the previous section.
'MAXIMUM LEVERAGE': It's the maximum allowed multiplier of the quantity entered in the previous section according to the volume condition.
The settings are for Bitcoin at Binance Futures (BTC: USDTPERP) in 15 minutes.
For other pairs and other timeframes, the settings have to be adjusted again. And within a month, the settings will be different because we all know the market and the trend are changing.
BTC Volume Contango IndexBased on my previous script "BTC Contango Index" which was inspired by a Twitter post by Byzantine General:
This is a script that shows the contango between spot and futures volumes of Bitcoin to identify overbought and oversold conditions. When a market is in contango, the volume of a futures contract is higher than the spot volume. Conversely, when a market is in backwardation, the volume of the futures contract is lower than the spot volume.
The aggregate daily volumes on top exchanges are taken to obtain Total Spot Volume and Total Futures Volume. The script then plots (Total Futures Volume/Total Spot Volume) - 1 to illustrate the percent difference (contango) between spot and futures volumes of Bitcoin. This data by itself is useful, but because aggregate futures volumes are so much larger than spot volumes, no negative values are produced. To correct for this, the Z-score of contango is taken. The Z-score (z) of a data item x measures the distance (in standard deviations StdDev) and direction of the item from its mean (U):
Z-score = (x - U) / StDev
A value of zero indicates that the data item x is equal to the mean U, while positive or negative values show that the data item is above or below the mean (x Values of +2 and -2 show that the data item is two standard deviations above or below the chosen mean, respectively, and over 95.5% of all data items are contained within these two horizontal references). We substitute x with volume contango C, the mean U with simple moving average ( SMA ) of n periods (50), and StdDev with the standard deviation of closing contango for n periods (50), so the above formula becomes: Z-score = (C - SMA (50)) / StdDev(C,50).
When in contango, Bitcoin may be overbought.
When in backwardation, Bitcoin may be oversold.
The current bar calculation will always look incorrect due to TV plotting the Z-score before the bar closes.
BTC Contango IndexInspired by a Twitter post by Byzantine General:
This is a script that shows the contango between spot and futures prices of Bitcoin to identify overbought and oversold conditions. Contango and backwardation are terms used to define the structure of the forward curve. When a market is in contango, the forward price of a futures contract is higher than the spot price. Conversely, when a market is in backwardation, the forward price of the futures contract is lower than the spot price.
The aggregate prices on top exchanges are taken and then averaged to obtain a Spot Average and a Futures Average. The script then plots (Futures Average/Spot Average) - 1 to illustrate the percent difference (contango) between spot and futures prices of Bitcoin.
When in contango, Bitcoin may be overbought.
When in backwardation, Bitcoin may be oversold.
StonkBTC - autoswitch secondary series for scalpersSince the drop in March of 2020, the U.S. ETF , SPY, has been correlated with bitcoin's moves, especially during the NY session.
This tool is meant to help traders who want to take advantage of that without having to switch the secondary series between BTCUSD and (generally) SPY when changing the ticker they are viewing.
How this works:
The indicator will automatically switch between bitcoin or equity index depending on what ticker your current chart is. Ideally this tool would be very simple to use.
Options:
Show/hide a 'track price' line
Index choice of SP500, Nasdaq 100, and Russell 2000. Further selection by ETF, futures, and CFD
Varied bitcoin price sources
Notes:
You will need a separate subscription to TradingView to view realtime CME futures data (if not, it will be delayed by 10 minutes). Because of this, the default option chosen is the CFD for the most complete chart when viewing bitcoin.
NY Core Trading Session: 9:30 a.m. to 4:00 p.m. ET
www.nyse.com
Stock to Flow Model with Standard Deviation BandsThis Study takes the Stock to Flow Model for Bitcoin as presented by 100trillionUSD and smoothes it using an SMA. Then it calculates the close's standard deviation from it and displays the 2-Sigma Bands.
The stock to flow model seems to be one of the best predictions of Bitcoins price.
The standard deviation bands are supposed to show situations in which Bitcoin is significantly over- or under-bought.
COT Commercial Positions (Updated)
This script aims to look at the markets from a manufacturer's point of view.
Producers or large enterprises gradually sell their goods as the price increases.
Because both the amount of product and position in their hands is too high, otherwise they can not find buyers, and they have to make a safe profit.
Therefore, I have shown short positions in green and long positions in red.
Blue is the net position formed by subtracting long positions from short positions.
This script is created with the latest Quandl data number codes.
Please let me know if you see a missing or a code update.
I recommend using it in a weekly (1W) time frame.
CAUTION : Since Bitcoin producer positions are very sparse, speculative long positions have been preferred in Bitcoin.
If you're looking for Bitcoin,
select Bitcoin from the menu.
Regards.
Mayer MultiplerThe ‘Mayer Multiple’ is one of the most popular metrics and derives from the current price divided by the 200-day moving average (200-MA). The average value is 1.39, and historically, when it becomes equal to or greater than 2.4 it will retrace to under 1.5.
Simulations performed by Trace Mayer determined that in the past, the best long-term results were achieved by accumulating Bitcoin whenever the Mayer Multiple was below 2.4.
Since the simulations were based on historical data, they are purely educational and should not be the basis of any financial decision.
Credit:
bitcoinist.com
mayermultiple.info
10/20 MA Cross-Over with Heikin-Ashi Signals by SchobbejakThe 10/20 MA Heikin-Ashi Strategy is the best I know. It's easy, it's elegant, it's effective.
It's particularly effective in markets that trend on the daily. You may lose some money when markets are choppy, but your loss will be more than compensated when you're aboard during the big moves at the beginning of a trend or after retraces. There's that, and you nearly eliminate the risk of losing your profit in the long run.
The results are good throughout most assets, and at their best when an asset is making new all-time highs.
It uses two simple moving averages: the 10 MA (blue), and the 20 MA (red), together with heikin-ashi candles. Now here's the great thing. This script does not change your regular candles into heikin-ashi ones, which would have been annoying; instead, it subtly prints either a blue dot or a red square around your normal candles, indicating a heikin-ashi change from red to green, or from green to red, respectively. This way, you get both regular and heikin ashi "candles" on your chart.
Here's how to use it.
Go LONG in case of ALL of the below:
1) A blue dot appeared under the last daily candle (meaning the heikin-ashi is now "green").
2) The blue MA-line is above the red MA-line.
3) Price has recently breached the blue MA-line upwards, and is now above.
COVER when one or more of the above is no longer the case. This is very important. You want to keep your profit.
Go SHORT in case of ALL of the below:
1) A red square appeared above the last daily candle (meaning the heikin-ashi is now "red").
2) The red MA-line is above the blue MA-line.
3) Price has recently breached the blue MA-line downwards, and is now below.
Again, COVER when one or more of the above is no longer the case. This is what gives you your edge.
It's that easy.
Now, why did I make the signal blue, and not green? Because blue looks much better with red than green does. It's my firm believe one does not become rich using ugly charts.
Good luck trading.
--You may tip me using bitcoin: bc1q9pc95v4kxh6rdxl737jg0j02dcxu23n5z78hq9 . Much appreciated!--
[Prod] SuperTrend with Stoploss+TrendZones - 1HHere, i'm using a SuperTrend (difference of moving averages) crossover strategy hybrid with stop-loss and trend-following to look at backtesting for the BCHUSD pair on the coinbase (GDAX) exchange.
Included in this script I've got some optimized parameters that seem to make a decent profit over ~35+ trades. The one thing that's bothering me here is that I get OCCASIONAL repaint issues with back-testing, but I can't figure out why for the life of me, because i'm using V3 in the start of the script. If someone could point out the mistake I may be making here , I feel like this could be a serious strategy to use against the BCHUSD pair on coinbase or other exchanges (with tuning of course).
I based this script off of with lots of modifications.
Trend LengthScript tries to capture the length of trends. It calculates an SMA and then determines the slope of the SMA using a simple momentum function. From there it counts bars from when the slope changed directions last. The lime green line is the count from when the slope changed. The yellow line is the average time of a trend. The white line is "trying" to capture the length of a full healthy pip running trend. Pick and SMA you like and then run through many currencies. I find that trends tend to be the same length. Not surprising as the markets are extremely correlated to each other. The trick is to find the most active pair for action. To do that look up my Pairs Range script.
Comments are welcome.
TT ToniTrading Adjustable Price Fee Band [%]Simple but perfectly functional indicator with Trading fee bands.
Crypto Trading is with fees and very small trades often don't make sense due to the fees we need to pay. With this band you can visualize your fees before entering a trade and take smarter decisions for tight daytrading and scalping.
You type in the fee for just one trade, the Taker Fee for a Market Order. The bands show the fees in % times 2, so what you will pay for opening and closing the trade in reality. The band therefore shows the real break-even point, with included payed fees.
It additionally helps taking trading decisions or not with very small trades (Scalping).
You can smooth the bands if you want and you can addtionally show the true datapoints if you prefer smoothend bands. I recommend no bigger smoothing than 2, if you don't want to show the datapoints. Additionally you can fill the band, and of course adjust transperency, colour and all the general TradingView stuff.
Fee Overview in the current market for the indicator input field:
BingX with 10% fee reduction code = 0,045 %
BingX: Normal = 0,050 %
Bitget, ByBit, BitUnix, Blofin, Phemex: Normal = 0,060 %
Bitget, ByBit, BitUnix, Blofin, Phemex: with 20% fee reduction code = 0,048 %
Have fun Trading, Happy Profits!
Greetings
ToniTrading