The People's Indicator Swing TradeThe People's Indicator Swing Trade is the Longer Term Version of the People's Indicator. It will allow you to spot patterns.
스크립트에서 "bitcoin"에 대해 찾기

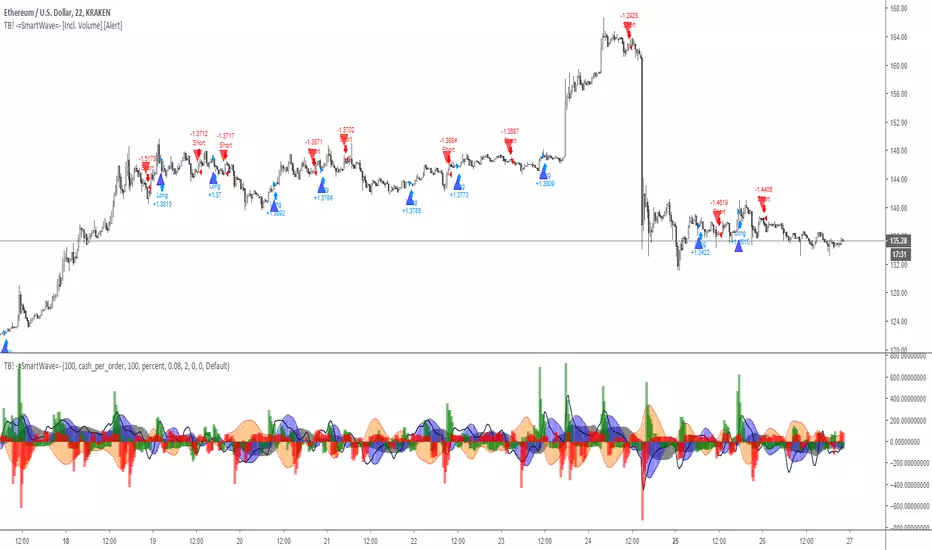
TB! -=SmartWave=- [Incl. Volume]My Precious SmartWave Formula Ready for Action.
What does it do?
It monitors buys vs sells, since the market moves because people buy n sell,i kinda thought it would be important.
It also monitors price action in relation to that volume to determine if a lot of volume is gobbled up by (over-) leveraged positions.
It provides a good insight when to take some action.
NB.
The drawback and the losses it makes can be reduced a lot with a 2.5% stoploss and fib based TP's, i just did not care to have the script deal with those,
Cryptocurrency trend following EMA Ribbon LONG only strategyThis strategy is based on EMA Ribbon and uses multiple indicators to find optimal time to enter/exit the trade and filter out false signals. The script with default setting is developed mainly for trading altcoins/stable coin pair such as ADA/USDT etc on 4h timeframe but it can be applied to any pair/any timeframe with some settings adjustments.
For plot on chart features make sure that you have both study and strategy scripts on chart with same settings.
Strategy settings description:
1. Signal EMA Length - Value for exponencial moving average (slowest from EMA Ribbon)
1a. Buy price toleration (%) - Price deviation for filtering bounces of EMA - price must close defined percents above EMA to open long trade
1b. Sell price toleration (%) - Price deviation for filtering bounces of EMA - price must close defined percents bellow EMA to close long trade
1c. EMA deelay - EMA id delayed by defined bars for smoothening
2. Filter by Fast EMA - Strategy filters signals to prevent buy while coin is dropping
2a. Fast EMA Length - Value for fast exponencial moving average
3. Filter by SMA - Strategy filters signals to confirm trend change
3a. SMA Length - Value for simple moving average
4. Filter by RSI - Strategy filters signals to prevent buing/selling overbought/oversold coins
4a. RSI Length - Length of RSI identificator
4b. RSI Source candle - What price of candle is used for RSI calculation (open, close, high, low)
4c. RSI Long condition - When buy, RSI indicator must be below this value to prevent of buying already overbought coin
4d. RSI Short condition - When sell, RSI indicator must be above this value to prevent of selling already oversold coin
5. RSI Close Trade Condition - Strategy sell coin once RSI reach defined value
5a. RSI close trade condition - Sell once RSI indicator acquires defined value
6. Close trade by Take Profit or Stop Loss Condition (STRATEGY ONLY) - Strategy sell coin once defined take profit / stoploss level is reached
6a. Take Profit (%) - Take profit value in percent
6b. Stop Loss (%) - Stop loss value in percent
6c. Plot targets on chart - defined targets will be plotted as lines on chart
7. Date range from
7a From Year - To run strategy in interval
7b From Month - To run strategy in interval
7c From Day - To run strategy in interval
8. Date range to
8a To Year - To run strategy in interval
8b To Month - To run strategy in interval
8c To Day - To run strategy in interval
9. Wait to confirm the signal
9a Wait candless to buy - strategy will wait defined candless to confirm the signal before buy
9b Wait candless to sell - strategy will wait defined candless to confirm the signal before sell
10. Plotting on chart (STUDY ONLY)
10a Plot signal line channel with bows on chart
10b Plot simple moving average on chart
10c Plot EMA Ribbon on chart
10d Plot recent support and resistance levels on chart
11. Show Every signal (STUDY ONLY) - Unchecked shows only first signal based on strategy. But if you use take profit/stoploss settings within your bot, you might want to rebuy on next signal. Checked shows signal on each candle.
Throw on chart also buld-in RSI indicator and set the same as strategy
Notice that there might be false signals, especially when the coin is not trending or is strongly manipulated. Overall strategy is profitable though. You just take some minor loses and wont miss the big move.
You may also consider to compare buy&hold return vs profit from trading this strategy. In downtrend as we have seen recently, profit may not be as high as you expect but it is still much better than just hold and hope.
You can use the strategy script for fine tunning settings and find best settings for yourself.
Study script helps you to automate trading with use of alerts perharps with 3commas bot or even trade manually based on email/sms notification setted by tradingview
Notice that study script does not handle takeprofit/stoploss order. That is why sell arrows could be plotted by study script later than strategy script. To rebuy after takeprofit/stop-loss use "11. Show Every signal (STUDY ONLY)" setting
Make sure that you keep same settings for strategy and study scripts.
If you need any help with settings do not hesitate to ask. I would also appriciate any feedback and ideas how to improve this script.
Here is backtest result from 1. Nov 2018 using constant 100USD Buy ammount:

Buy The Dip - Does It Work?Buying the dip has become a meme in crypto, but does it actually work?
Using this script you can find out.
The dip is defined here as the average true range multiplied by a number of your choosing (dipness input) and subtracted from the low.
When price crosses under the dip level, a long is initiated. The long is then closed using a timestop (default value 20 bars), no fancy exits here.
A general rule for buying the dip should be to be more passive in a bull market and aggressive in a bear market.
Same goes for all counter trend trading.
Heres a few other examples of dip buying statistics using the H4 timeframe:
50% profitable, 1.692 Profit Factor
BINANCE:PIVXBTC
56.52% profitable, 1.254 Profit Factor
BINANCE:KMDBTC
27.27% Profitable, 0.257 Profit Factor... yikes!
BINANCE:BTSBTC
73.33% Profitable, 13.627 Profit Factor... o.O
BINANCE:MANABTC

Lazy Trend System 2019latest, more powerful and applicable on FX, indices, stocks and cryptocurrencies!

STOCH MACD SAR RSI V2 STRAT 15M// Strategy based on Stochastic Oscillator ( STOCH ), Moving Average Convergence / Divergence ( MACD ), Parabolic Stop and Reverse (PSAR) and Relative Strength Index (RSI)
// In the second version RSI added
// Adapted for15M time frame
// Created and based on Binance chart
// Working with comission
// No repaints

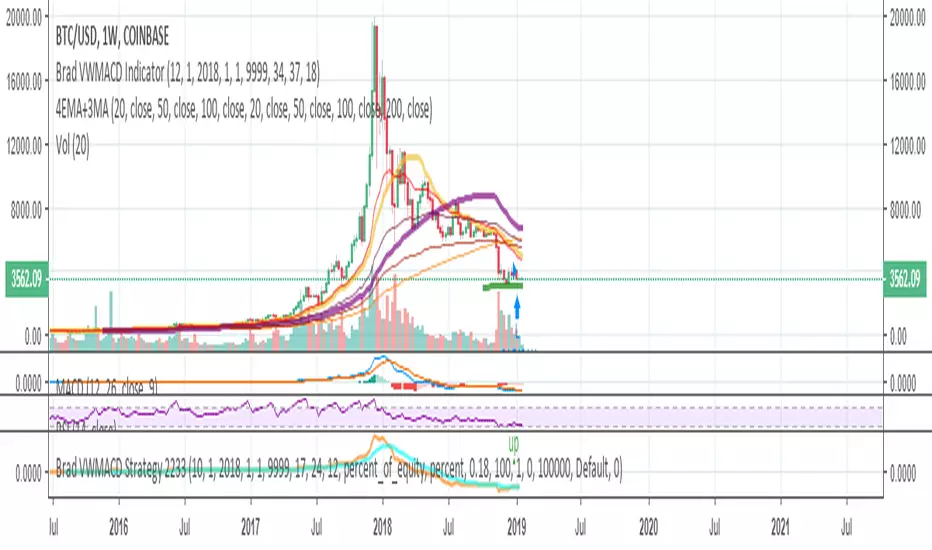
Brad VWMACD Strategy 2233Volume Weighted MACD. DO NOT USE AS STANDALONE. THEY ARE GUNNING FOR yOUR MONeY. Or if you use standalone, use only small fraction of your funds. NOT FINANCIAL ADVICE, PAST RESULTS OFTEN ARE COUNTER TO FUTURE RESULTS. What worked in the past is usually what will NOT work in future.
I tried not to overtune this and it works great some months, terrible other months. EDUCATIONAL PURPOSES ONLY!!!!!!!!!!
Current settings are for 4-hour charts, BTCUSD Coinbase.
Powerfull strategy MACD + RSI + Stoch buy on High exit on ATRMy strategy uses a combination of three indicators MACD Stochastic RSI .
The Idea is to buy when ( MACD > Signal and RSI > 50 and Stochastic > 50) occures at the same time the BUY STop we place on previous day HIGH
We exit on Take profit or Stop loss which is calculated by ATR (10) or on the opposite signal "Volatility breakout"
This strategy works well on stocks, commodities and cryptos especially during market breaking up after consolidation
The best results are on Daily charts , so its NOT a scalping strategy. But it can work also on 1H charts.
The strategy does not have any stops and profit targets, so we can take all the market can give us at the moment.
The exit point only when MACD goes under Signal
Its Preformance is significantly better with "buy stop on High.1" idea and exit on "volatility price breakout"
So, use it, trade it.
If it will help you to imprive your trading results, please donate me
BTC: 12kd1F8buWisUBdq27BBwRkUvzW7Ey3og5

BTCUSD PRO STRATEGYThese are the results calculated automatically by the tradingview system within a year. With an initial $ 5,000 investment and always reinvesting 100% of the capital. Taking in count that each open transaction has a cost of 0.2% on the total order placed on the market.
Strategy NO REPAINT.
Write me in private chat on Tradinview to my MaxZanotelli profile for a free 7-day trial period.
Best setup
dema fast 17
dema slow 9
resolution 2h

STOCH MACD SAR Strategy 15M// Strategy based on Stochastic Oscillator (STOCH), Moving Average Convergence / Divergence (MACD) and Parabolic Stop and Reverse (PSAR)
// Adapted for15M time frame
// Created and based on Binance chart
// Working with comission
// No repaints

RSI EMA Strategy 15M+// Strategy based on Relative Strength Index (RSI) and Exponential Moving Average (EMA)
// Greatest effect on 15M+ time frame
// Created and based on Binance chart
// Working with comission
// No repaints

Momentum Indicator Strategy 15m// Strategy based on Momentum Indicator
// Greatest effect on 15M time frame
// Created and based on Binance chart
// Working with comission
// No repaints

THE PHOENIX v0.1 wSMDAS requested - Version of my Phoenix Script with both LONG and SHORTS, Backtest results will not be accurate unless you use margin trading.
------------------------------------------------------------------------------------------------------------------------------------------------------------------------------------
Implementation in TradingView of modified version of the "Weis Wave".
indicatior will generate Long and Close Long signals according to market trend.
(Learned the hard way that using short instead of close long to close long orders will seriously mess backtest results and create unrealistic expectations)
Added a customizable RATE OF CHANGE indicator that I called SMD (sideways market detection) to try and avoid trading on sideways market.
References: "Trades About To Happen" David H. Weis, Division 2 of the Richard D. Wyckoff Method of Trading in Stocks.
I've had best results on 2h and 4h charts, I would not recommend to go below 1h, my general rule is to run the backtest on regular candle and make sure the backtest gives goodd result, but I use the script with autoview on heikin ashi.
Backtesting: You can change the dates of the backtest as you please, the backtest runs with 1000USD and 100% of equity orders, 3 ticks slippage and 0.1% commission.
For Autoview users: Will upload LONG ALERT and CLOSE LONG ALERT studies separately as I find it easier to see whats going on on 2 seperate indicators.
NO, IT DOES NOT REPAINT.

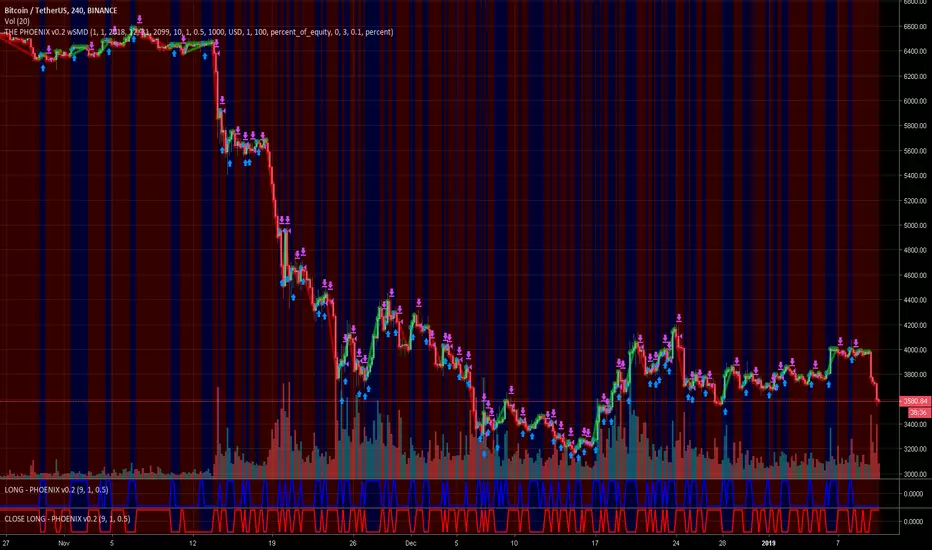
THE PHOENIX v0.2 wSMDThis is my first publication, since sept 2018 i tested/converted to strategy over 500 scripts, this is by far my most profitable script.
Implementation in TradingView of modified version of the "Weis Wave".
indicatior will generate Long and Close Long signals according to market trend.
(Learned the hard way that using short instead of close long to close long orders will seriously mess backtest results and create unrealistic expectations)
Added a customizable RATE OF CHANGE indicator that I called SMD (sideways market detection) to try and avoid trading on sideways market.
References: "Trades About To Happen" David H. Weis, Division 2 of the Richard D. Wyckoff Method of Trading in Stocks.
I've had best results on 2h and 4h charts, I would not recommend to go below 1h, my general rule is to run the backtest on regular candle and make sure the backtest gives goodd result, but I use the script with autoview on heikin ashi.
Backtesting: You can change the dates of the backtest as you please, the backtest runs with 1000USD and 100% of equity orders, 3 ticks slippage and 0.1% commission.
For Autoview users: Will upload LONG ALERT and CLOSE LONG ALERT studies separately as I find it easier to see whats going on on 2 seperate indicators.
NO, IT DOES NOT REPAINT.
-- Ultimate Crypto Trading Strategy -- Backtesting version** This is the backtesting (strategy) version of the ~ Ultimate Crypto Trading Strategy ~ script in TradingView. **
~ Ultimate Crypto Trading Strategy ~
֎ Trading system script on @tradingview that brings the easiest approach to trading with a high profitability rate
֎ Optimized for crypto markets, to catch trend movements as soon as possible and maximize profitability
֎ Sell & Buy alerts, Safeguard mode, Take Profits alerts, auto resistance-support and always adding new features!
֎ Customizable settings.
֎ Users Discord community for learning, sharing and direct support
֎ Ultimate Crypto Trading Strategy Tutorial Video: www.youtube.com www.youtube.com
֎ Safeguard feature (match multiple timeframes signals) explained: youtu.be youtu.be
If you’d like to test the trading script in TradingView, I can give you access to a 10 days trial.
Please send me a message in tradingview and I’ll activate it right away.
Thank you!


HATbot v1 Automation Script and Indicator [Backtest]This is the debut release of HATbot.
HATbot is a terrible name for a new trend following indicator and strategy script.
Backtest window: 2018-01-01 to 2019-01-01.
Initial capital: $1000
Shorting: enabled

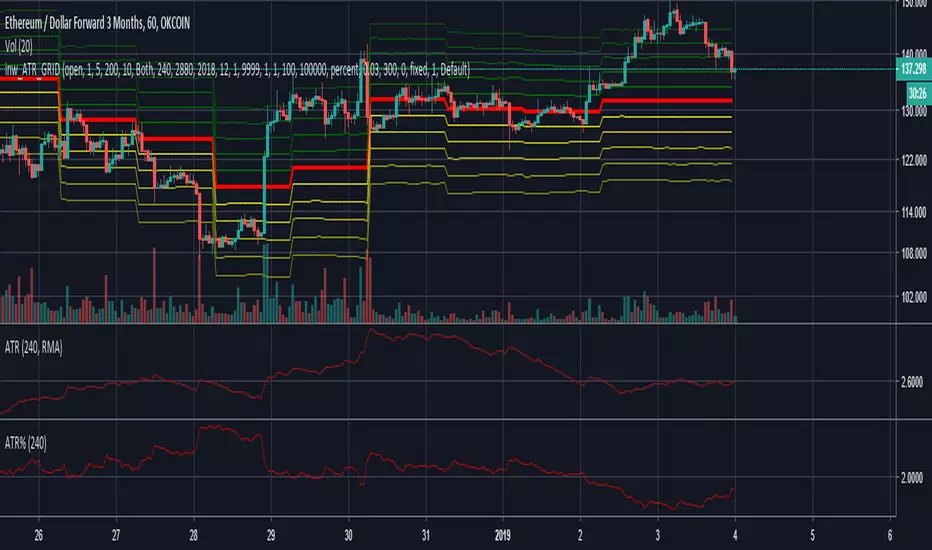
inwCoin ATR Grid Strategy ( incomplete )Due to Pine Script limitation that we cannot open both short and long order at the same time. So this GRID idea cannot backtest yet.
This strategy is for using with CTC Okex Bot grid system only.
The idea is to check how wide the grid with ATR so you can setup each grid size in CTC Bot every day ( or cut loss some grid accordingly )
Support/Resistance Algo-Tradeing StrategyThis strategy Automates Support and resistance trading and a tight trailing stop loss technique. The support and resistance levels are calculated from previous highs and lows; these levels are used to make two types of trades:
1. Break out trades, taking a trade if the market is able to push through a support or resistance level.
2. Liquidity pool rejection, also known as a stop loss hunt. When the market is brought past a key level (to take out stop losses) which traders (usually institutions) use to enter, which then reverses back through the support/resistance level where the strategy enters a trade.
An optional "volatility filter" may be used when on a suitable market. This means that trades are only entered when there is suitable volatility.
A tight stop loss is kept so most trades lose, but winning trades are left to run much further. So this is a very reliable profitable strategy on many markets.
For a limited time I will provide access to this strategy for free as it is not yet complete, there is still testing to do and I would appreciate any feedback.

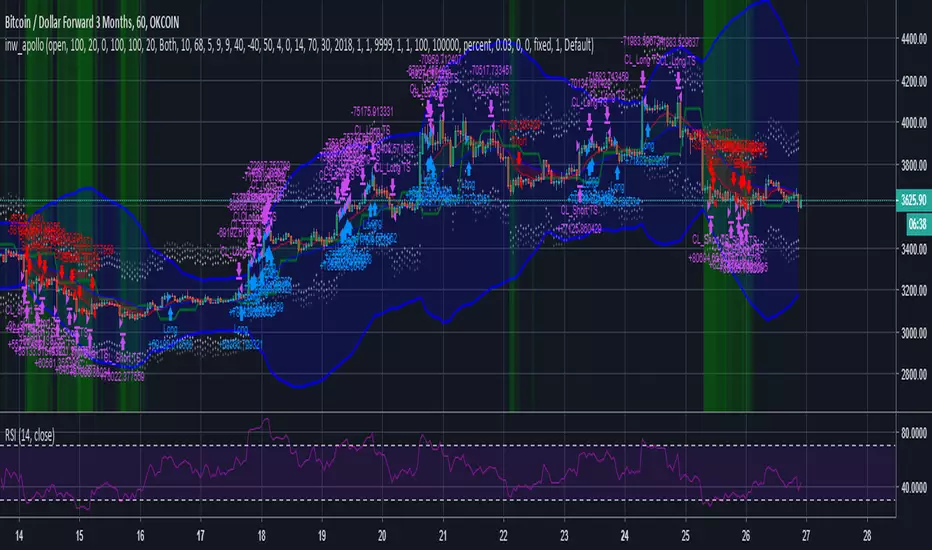
inwCoin Apollo Strategy ( Just for FUN! )Just for fun strategy.
This is very bullshit and parody strategy
*** DO NOT USE IN REAL TRADE ***
MACD + Stochastic + RSI StrategyMy strategy uses a combination of three indicators MACD Stochastic RSI.
The Idea is to buy when (MACD > Signal and RSI > 50 and Stochastic > 50) occures at the same time
This strategy works well on stocks and cryptos especially during market breaking up after consolidation
The best results are on Daily charts, so its NOT a scalping strategy. But it can work also on 1H charts.
The strategy does not have any stops and profit targets, so we can take all the market can give us at the moment.
The exit point only when MACD goes under Signal
Its Preformance is quite stable.
So, use it, trade it.
If it will help you to imprive your trading results, please donate me
BTC: 12kd1F8buWisUBdq27BBwRkUvzW7Ey3og5

inwCoin Know Sure Thing StrategyKnow Sure Thing Strategy
So far, as what I check, it can give some good entry point for each trend.
You might have to define trend yourself ( eg. downtrend = short only / uptrend = long only ) for maximized profit

RSC Trend Trading Strategy v1.0Ready Set Crypto Trend Trading Back-testing Strategy v1.0
This is a backtesting strategy for those who are familiar with Doc Severson's (Ready Set Crypto) Trend Trading Class offered at Ready Set Crypto . It is published with permission.
I highly recommend that you attend the class to understand this strategy and use this to your advantage. There is way more than just some indicators to utilise this trading strategy successfully.
Please also see the matching indicator for this strategy: Ready Set Crypto Trend Trading Indicator .
Buy and Sell Calls are based on the following:
An Upper Donchian Channel of 20 days (default) or more, used to indicate buy signals
A Lower Donchian Channel of 10 days (default) or more, used to indicate exit signals
A 50 day Simple Moving Average (for entry filtering)
A 200 day Simple Moving Average (for entry filtering)
How to do back-testing with this:
Once you add this strategy to your chart, go to the " Strategy Tester " section at the bottom of the screen to see it's performance.
You will need to configure the strategy (just like you'd configure any indicator) to tailor it to your specific scenarios.
Note following:
TradingView does not support BTC, ETH, etc as currencies, so BTC and other trading pairs are not available for back-testing; You will have to use USD pairs
The backtesting will apply to your chart's time frame (candle times) - use daily time candles as the starting point
You will need to tailor the " Input " and " Properties " options (click on the little gear icon) to adjust to suit your needs/scenarios
The default settings are as follows:
Backtest the current chart/ticker for the period of 2016 to 2020,
With a single position of US$1000 and a 0.1% commission (no pyramiding, i.e. multiple buy entries),
By entering a single position (buy) when the price is above SMA 50 and 200 and a candle high touches DC 20,
And exiting the position when a candle low touches DC 10.
Look under the " Strategy Tester " pane for the back-testing overview, performance and list of trades. Or if you are looking at the Published Idea , the back-testing results are displayed at the bottom of the page.
Please like, Share and Comment, if you like this indicator.
Warning
The Buy and Sell calls are meaningless and must not be auctioned without a thorough understanding of this trading strategy and the full consideration of the entry and exit conditions.
Please use this indicator at your own risk. The publisher does not accept any responsibility for its performance or any implications.
