Bollinger Bands Trending Reverse StrategyWelcome to yet another script. This script was a lot easier since I was stuck for so long on the Donchian Channels one and learned so much from that one that I could use in this one.
This code should be a lot cleaner compared to the Donchian Channels, but we'll leave that up to the pro's.
This strategy has two entry signals, long = when price hits lower band, while above EMA, previous candle was bearish and current candle is bullish.
Short = when price hits upper band, while below EMA, previous candle was bullish and current candle is bearish.
Take profits are the opposite side's band(lower band for long signals, upper band for short signals). This means our take profit price will change per bar.
Our stop loss doesn't change, it's the difference between entry price and the take profit target divided by the input risk reward.
스크립트에서 "bear"에 대해 찾기

PROFIT MAKER |Crypto|ETH|BTC|YFIThis is a trend-following strategy that works very well for many Crypto assets in the usd or usdt pair
It can be used for both futures and spot!
Some of the assets in which this strategy is proven are
Asset Exchange TF
BINANCE:ADAUSDT Binance 45m
BINANCE:BTCUSDT Binance 1h
BINANCE:YFIUSDT Binance 30m
BINANCE:DOTUSDT Binance 45m
BINANCE:ETHUSDT Binance 30m
BINANCE:LINKUSDT Binance 45m
BINANCE:DOGEUSDT Binance 1h
And many others..
BINANCE:BTCUSDT
BINANCE:LINKUSDT
What is this strategy based on?
It is a combination of various parameters, including
-RSI: The relative strength index (RSI) is a momentum indicator used in technical analysis that measures
the magnitude of recent price changes to evaluate overbought or oversold conditions in the price of a stock or other asset.
-MACD: Moving average convergence divergence (MACD) is a trend-following momentum indicator that shows
the relationship between two moving averages of a security’s price.
-ADX: ADX is used to quantify trend strength. ADX calculations are based on a moving average of price range expansion over a given period of time.
-DMI: DMI is a moving average of range expansion over a given period (the default is 14 days). The positive directional
movement indicator (+DMI) measures how strongly price moves upward; the negative directional movement indicator (-DMI)
measures how strongly price moves downward. The two lines reflect the respective strength of the bulls versus the bears.
Included:
Different forms of Take profit, included:
Take profit on squeeze candles
Take profit based on Risk-Benefit (RR)
Take profit a pre-determined %.
Different forms of Stop Loss, including
ATR-based stop loss
Trail stop loss (with option to use a trigger)
Stop loss a pre-determined %.
**All trades include 0.1% of fees + slippage
** The statistics displayed are for the year 01-01-2020 and the period from 2021 to the date of publication (14-01-2020)
For access you can send a message or consult in my social networks.
Links in my tradingview signature (below).

Bull Call Spread Entry StrategyThis strategy script uses the "Spread Entry Strength" overlay indicator script I designed to show entry timing optimized for an Option Bull
Call Spread.
As for this strategy...
The defaults for the strategy itself are as follows:
Period for strategy: 1/1/18 to 12/1/2021. This can be changed to a different period using the settings.
Condition for entry:
Bull Spread Entry Strength >= "Overlay Signal Strength Level"
Limit entry is used, price must be <= close when signaled
Entry occurs by next day or the order is cancelled
Condition for exit (uses a timed exit):
Bars passed since order entry >= 30 (6 weeks..~42 calendar days)
Thursday (day before "option" expiration date... assuming weekly options exist)
All of the user settings from the overlay are pulled into this for customization purposes. Details of the actual Spread Entry Strength overlay are as follows (copied from my shared indicator):
2 background shadings will occur:
The background will shade blue if the ticker is prime for a Bullish Call spread.
The background will shade purple if the the ticker is prime for a Bearish Put spread.
In theory, if the SE Strength is at one of the extremes of the Bear or Bull side, then a spread is prime for entry.
To calculate this, 8 conditions receive a 1 or zero dependent on whether the condition is true (1) or false (0), and then all of those are summed. The primary gist of the strength comes from Nishant's book, or my interpretation thereof, with some additives that limits what I need to review (such as condition 8 below.)
The 8 Bull Conditions are:
1) Bollinger Bands are outside of the Keltner Channels
2) ADX is trending up
3) RSI is trending up
4) -DI is trending down
5) RSI is under 30
6) Price is below the lower Keltner Channel
7) Price is between the lower Bollinger Band and the Bollinger basis.
8) Price at one point within the last 5 bars was below the lower Bollinger Band
The 8 Bear Conditions are the inverse conditions (except the first):
1) Bollinger Bands are outside of the Keltner Channels
2) ADX is trending down
3) RSI is trending down
4) +DI is trending up
5) RSI is over 70
6) Price is above the upper Keltner Channel
7) Price is between the upper Bollinger Band and the Bollinger basis.
8) Price at one point within the last 5 bars was above the upper Bollinger Band
There is a "market noise" filter that will filter out shading when another market move is considered, i.e. if you don't want to see the potential trade when QQQ moves more than 1% then do the following in the settings:
Check "Market Filter"
Enter QQQ in the "Market Ticker To Use"
Enter 1 in the "Market Too Hot Level"
Press Ok
Obviously, the same holds true for the "Market Too Cool Filter."
Second release notes:
Overlay Signal Strength Level - You can set your own "level" for the overlay in the settings, instead of having to change the script code itself. I have the default set to 6. A lower number shows more overlays, a higher number shows fewer (i.e. more conditions have been met.).
Provide Narrative (Troubleshooting) - Narrative label created with several outputs that will show after the last bar. This narrative needs to be turned on in the settings, as the default is "off" ... unchecked.
Remove Strength Indicator When Squeezed - when checked no overlays will be produced regardless of "scoring." Default is off.
Show Squeezes (Will Override Indicator When Concurrent) - overlays an orange background when the ticker is in a squeeze. I am still working on the accuracy here, but it's usable. This will override the strength indicator as well. This needs to be turned on, if you want it.
Short SMA Period - period used to calculate the short SMA, used in the narrative only, at this point in time.
Medium SMA Period - period used to calculate the medium SMA, used in the narrative only, at this point in time.
Long SMA Period - period used to calculate the medium SMA, used in the narrative only, at this point in time.
Outside of the settings... a few calculation adjustments here and there have occurred and some color shading adjustments to allow for the adjustable level setting.

[astropark] DMI/ADX strategy [strategy]Dear Followers,
today I'm happy to share with you my DMI / ADX Strategy .
It provides directional trend information, so if a bullish or a bearish trend is going to start. Statistically it works better on lower timeframes (from 5 minutes to 1 hour).
It is both a Swing and Scalping Strategy indicator , based on a simple trend following theory , good for trading FOREX, Indexes, Stocks, Commodities and Cryptocurrencies.
To help in Taking Profits, the strategy integrates 2 special other than bull/bear signals:
Overbought and Oversold RSI Signals , which appear both as darker background (the darker the color, the more the price is in overbought/oversold) and green "ob"-"tp" / red "os"-"tp" labels (they optionally pop up only on a configurable stronger overbought/oversold condition) (you can enable/disable it optionally)
Peak Profit Tracker , which resets every time a new trade starts and keeps track of price fluctuation during the trade: the message is don't be too greedy and take profits or lock them with a stoploss in profit (you can enable/disable it optionally)
You can edit many options in order to
have more/less bull/bear signals
enable/disable showing bull/bear signals
enable/disable showing RSI TP signals (you can edit RSI length, overbought (OB) and oversold (OS) levels)
enable/disable showing peak profits on each trade
The user who wants to use this strategy, especially via an automated bot, must always set a stoploss (example 150$ from entry on bitcoin ) or use a proper risk management strategy .
This is not the "Holy Grail", so use it with caution. It's highly suggested to use a proper money management .
This script will let you backtest performance of the indicator based on bear/bull signals.
You can find the alarms version by searching for my DMI / ADX Strategy and choosing the "alarms" named.
Here there are some examples how this DMI / ADX strategy works on many markets:
LTC/USDT 15m
BTC/USD 15m
BNB/BTC 15m
ETH/USD 15m
GOLD (XAU/USD) 15m
GOLD (XAU/USD) 1h
FB 15m
AAPL 15m
TSLA 1h
BANKNIFTY Index 5m
NIFTY 50 Index 5m
This is a premium indicator , so send me a private message in order to get access to this script .

Lagged Donchian Channel + EMAThis strategy is based on a lagged 24 periods Donchian Channel and a 200 periods EMA .
The enter positions are calculated this way :
Bull entry
1. we wait for the close of a candle below the channel and it must be below the 200 EMA
2. the following candle must be a green one and close in the lagged channel
3. we put a long order at the close of the second candle, a stop loss at the low of last 3 candles and a x3 take profit
Bear entry
1. we wait for the close of a candle above the channel and it must be above the 200 EMA
2. the following candle must be a red one and close in the lagged channel
3. we put a short order at the close of the second candle, a stop loss at the high of last 3 candles and a x3 take profit
For both long or short positions :
If the order is not filled, it's cancelled if the price reach 50% of the TP or if the price reach the stop loss level
The position is closed if a new bear/bull condition appears in the other side of the position (if a bear appears when you're long and inversement)
Features :
Position calculator's included with leverage option
Labels of position can be plotted or not
Bull/Bear channels can be plotted with red and green filled
All parameters can be changed for backtesting
Better results have been got with defaults parameters on LTCUSDTPERP in H1 timeframe => profit factor of 2.84 with almost 100 positions.
Hope this strategy will be useful and it would be cool if I could get feedback, comments or better combinations of parameters !!
Don't hesitate to like and leave a comment ;)
@Mysteriown

PineScript v4 - Forex Pin-Bar Trading StrategyPineScript v4, forex trading robot based on the commonly used bullish / bearish pin-bar piercing the moving averages strategy.
I coded this robot to stress-test the PineScript v4 language to see how advanced it is, and whether I could port a forex trading strategy from MT4 to TradingView.
In my opinion, PineScript v4 is still not a professional coding language; for example you cannot use IF-statements to modify the contents of global variables; this makes complex robot behaviour difficult to implement. In addition, it is unclear if the programmer can use nested IF-ELSE, or nested FOR within IF.
The sequence of program execution is also unclear, and although complex order entry and exit appears to function properly, I am not completely comfortable with it.
Recommended Chart Settings:
Asset Class: Forex
Time Frame: H1
Long Entry Conditions:
a) Moving Average up trend, fast crosses above slow
b) Presence of a Bullish Pin Bar
c) Pin Bar pierces either Moving Average
d) Moving Averages must be sloping up, angle threshold (optional)
Short Entry Conditions:
a) Moving Average down trend, fast crosses below slow
b) Presence of a Bearish Pin Bar
c) Pin Bar pierces either Moving Average
d) Moving Averages must be sloping down, angle threshold (optional)
Exit Conditions:
a) Stoploss level is hit
b) Takeprofit level is hit
c) Moving Averages cross-back (optional)
Default Robot Settings:
Equity Risk (%): 3 //how much account balance to risk per trade
Stop Loss (x*ATR, Float): 2.1 //stoploss = x * ATR, you can change x
Risk : Reward (1 : x*SL, Float): 3.1 //takeprofit = x * stop_loss_distance, you can change x
Fast MA (Period): 20 //fast moving average period
Slow MA (Period): 50 //slow moving average period
ATR (Period): 14 //average true range period
Use MA Slope (Boolean): true //toggle the requirement of the moving average slope
Bull Slope Angle (Deg): 1 //angle above which, moving average is considered to be sloping up
Bear Slope Angle (Deg): -1 //angle below which, moving average is considered to be sloping down
Exit When MA Re-Cross (Boolean): true //toggle, close trade if moving average crosses back
Cancel Entry After X Bars (Period): 3 //cancel the order after x bars not triggered, you can change x
Backtest Results (2019 to 2020, H1, Default Settings):
EURJPY - 111% profit, 2.631 profit factor, 16.43% drawdown
EURUSD - 103% profit, 2.899 profit factor, 14.95% drawdown
EURAUD - 76.75% profit, 1.8 profit factor, 17.99% drawdown
NZDUSD - 64.62% profit, 1.727 profit factor, 19.14% drawdown
GBPUSD - 58.73% profit, 1.663 profit factor, 15.44% downdown
AUDJPY - 48.71% profit, 1.635 profit factor, 11.81% drawdown
USDCHF - 30.72% profit, 1.36 profit factor, 22.63% drawdown
AUDUSD - 8.54% profit, 1.092 profit factor, 19.86% drawdown
EURGBP - 0.03% profit, 1.0 profit factor, 29.66% drawdown
USDJPY - 1.96% loss, 0.972 profit factor, 28.37% drawdown
USDCAD - 6.36% loss, 0.891 profit factor, 21.14% drawdown
GBPJPY - 28.27% loss, 0.461 profit factor, 39.13% drawdown
To reduce the possibility of curve-fitting, this robot was backtested on 12 popular forex currencies, as shown above. The robot was profitable on 8 out of 12 currencies, breakeven on 1, and made a loss on 3.
The default robot settings could be over-fitting for the EUR, as we can see out-sized performance for the EUR pairs, with the exception of the EURGBP. We can see that GBPJPY made the largest loss, so these two pairs could be related.
Risk Warning:
This is a forex trading strategy that involves high risk of equity loss, and backtest performance will not equal future results. You agree to use this script at your own risk.

The Lazy Trader - Index (ETF) Trend Following Robot50/150 moving average, index (ETF) trend following robot. Coded for people who cannot psychologically handle dollar-cost-averaging through bear markets and extreme drawdowns (although DCA can produce better results eventually), this robot helps you to avoid bear markets. Be a fair-weathered friend of Mr Market, and only take up his offer when the sun is shining! Designed for the lazy trader who really doesn't care...
Recommended Chart Settings:
Asset Class: ETF
Time Frame: Daily
Necessary ETF Macro Conditions:
a) Country must have healthy demographics, good ratio of young > old
b) Country population must be increasing
c) Country must be experiencing price-inflation
Default Robot Settings:
Slow Moving Average: 50 (integer) //adjust to suit your underlying index
Fast Moving Average: 150 (integer) //adjust to suit your underlying index
Bullish Slope Angle: 5 (degrees) //up angle of moving averages
Bearish Slope Angle: -5 (degrees) //down angle of moving averages
Average True Range: 14 (integer) //input for slope-angle formula
Risk: 100 (%) //100% risk means using all equity per trade
ETF Test Results (Default Settings):
SPY (1993 to 2020, 27 years), 332% profit, 20 trades, 6.4 profit factor, 7% drawdown
EWG (1996 to 2020, 24 years), 310% profit, 18 trades, 3.7 profit factor, 10% drawdown
EWH (1996 to 2020, 24 years), 4% loss, 26 trades, 0.9 profit factor, 36% drawdown
QQQ (1999 to 2020, 21 years), 232% profit, 17 trades, 3.6 profit factor, 2% drawdown
EEM (2003 to 2020, 17 years), 73% profit, 17 trades, 1.1 profit factor, 3% drawdown
GXC (2007 to 2020, 13 years), 18% profit, 14 trades, 1.3 profit factor, 26% drawdown
BKF (2009 to 2020, 11 years), 11% profit, 13 trades, 1.2 profit factor, 33% drawdown
A longer time in the markets is better, with the exception of EWH. 6 out of 7 tested ETFs were profitable, feel free to test on your favourite ETF (default settings) and comment below.
Risk Warning:
Not tested on commodities nor other financial products like currencies (code will not work), feel free to leave comments below.
Moving Average Slope Angle Formula:
Reproduced and modified from source:

Monthly MA Close Generates buy or sell signal if monthly candle closes above or below the signal MA.
Long positions only.
Inputs:
-Change timeframe MA
-Change period MA
-Use SMA or EMA
-Display MA
-Use another ticker as signal
-Select time period for backtesting
This script is not necessarily written to maximize profits, but to minimize losses.
Although it can outperform 'Buy & Hold' on some occasions when there is a multiple month bearisch trend.
You can optimise this strategy by changing the signal MA inputs.
I would suggest aiming for the best Profit Factor starting from the monthly ("M") setting.
You can always fine-tune the results at a lower timeframe.
The option to use another ticker for providing signals can give you a more stable and unified results.
For example using AMEX:SPY as signal with default parameters gives better results with NASDAQ:AAPL than if you would use NASDAQ:AAPL itself.
I used the anti-repainting function from PineCoders to prevent repainting.
This script is best used for multi-month trading positions & Daily or 4H setting of your chart.

Mioone´s TEMA100vsEMA800(Feat. ACEACEACE)Mioone´s TEMA100vsEMA800(Feat. ACEACEACE)
Inspired by CryptoAman better know as ACEACEACE
TEMA1000 vs EMA800
What does it do?
Shows the TEMA1000 in relation to EMA800.
Shows the Coin in relation to EMA800
If you look at the value of the coins, you will notice that the coin magically moves closer to the EMA800.
That's why I created the indicator with the relation of the Coin to the EMA800 as a addon, so you can see how many bucks the Coin can go up or down when it is looking for the proximity to the EMA800.
Basically:
If the TEMA1000 goes below EMA800 the signal is rather bearish.
If the TEMA1000 breaks up through the EMA800 on larger time frames, this can often produce a DIP or start a run up.
Yelloline = Null Line
Greenline = Coinvalue smoothed with EMA1 in relation to EMA800 (Means if EMA800 = 10.000$ and CoinValue = 10.200$ the Greenline shows the Difference +200 $ over EMA800
Purpleline = TEMA1000 in Relation to EMA800 (TEMA1000 over EMA800 = Bullish , Under EMA800 = Bearish)
Colorfilling
Filling Green if Coinvalue (EMA9) > EMA800 = Bullish
Filling Red if Coinvalue (ema9) < EMA800 = Bearish)
Purple Crossover Yello = Bullcross
Purple Crossunder Yello = Bearcross
Take care of your Trades....
Mioone
Trend Trader Strategy with MACDThis is plots the indicator developed by Andrew Abraham in the Trading the Trend article of TASC September 1998
The strategy I use has already been published explicitly by HPotter, you can review the core code from there.
I have converted the existing strategy codes that have been published into the strategy and the result looks great but I noticed that the indicator performed too much in short periods like 1 minute and I thought it would be healthier to get MACD approval. MACD approval will come selected by default. When the indicator reaches the buy status, if the macd histogram is positive, it enters the long process. By removing this confirmation from the settings window, you can see the normal signal frequency of the indicator.
This strategy is mainly based on trend signals. In fact, I am publishing this strategy to use in alternating trading for Bear-Bull crypto coins.
What does the bear-bull comparison mean?
You can open the same chart in the ETHBEAR / USDT symbol as opposed to the ETHBULL / USDT symbol that appears on the chart. When BUY signal comes in bull symbol, SELL will come in bear symbol. When BUY signal comes in bear symbol, SELL will come in bull symbol. In this way, very fast and very high profit can be obtained by alternating operation.

Trend StrategyThis is plots the indicator developed by Andrew Abraham in the Trading the Trend article of TASC September 1998
The strategy I use has already been published explicitly by HPotter, you can review the core code from there.
I have converted the existing strategy codes that have been published into the strategy and the result looks great.
This strategy is mainly based on trend signals. In fact, I am publishing this strategy to use in alternating trading for Bear-Bull crypto coins.
What does the bear-bull comparison mean?
You can open the same chart in the ETHBEAR / USDT symbol as opposed to the ETHBULL / USDT symbol that appears on the chart. When BUY signal comes in bull symbol, SELL will come in bear symbol. When BUY signal comes in bear symbol, SELL will come in bull symbol. In this way, very fast and very high profit can be obtained by alternating operation.

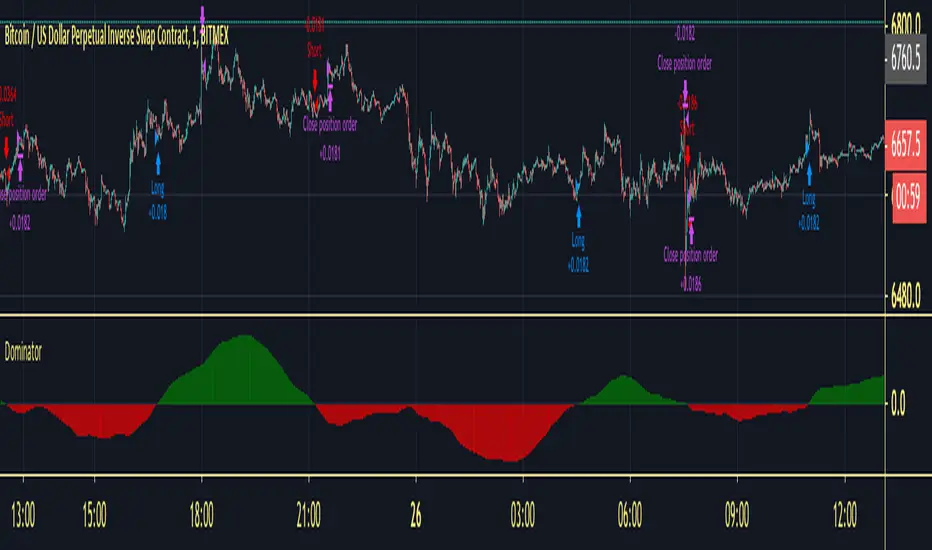
Dominator StrategyThis is the Strategy Version Of Dominator you can choose your take profit level and dates for backtesting calculates fee as well
Do investors appreciate a good animal mascot? It seems like it. Bull and bear markets are key investing lingo and symbols, capturing positive feelings (bull) or negative ones (bear). There’s no official rule, but a bull market tends to refer to a 20% increase in a market over time from its bottom, while a bear represents a 20% decrease from its top. In general, “bull” positivity or “bear” negativity can refer to upward or downward movements of almost anything, like individual stocks. And you’ll even notice investors saying they’re “bullish” on an industry with growth potential or “bearish” on a stock they think will drop .
Dominator will give you the calculation of the wave between Bull&bear
How to use :
Long Alert signal = Bull Wave on the market
Short Alert signal = Bear wave on the market
Apply these fundamentals to any time frame and you will be able to read the correction into the trend or even the trend reversals.
[VB]Chota Bulu Strategy by VivekChota Bulu Strategy is combination of moving averages,Bull/Bear Power Trend and Leading Oscillators
Strategy
Green Background
Strict Bullish Trend (Buy Favourable)
Buy Price Moves above or crosses above all moving averages
Above 200/800 EMA (Buy Sides Only)
Red background
Strict Bearish Trend (Sell OFF period)
Sell only if Price crosses below all moving averages.
Below 200/800 EMA (Sell Side Only)
Convergence Early Warning Indicators (Arrows for Price Momentum Change)
Trending Early Warning Triangles (Green Triangle Bottom means Start of Trending Market) (Red Triangle Top Means Start of Bearish Trending Market)
Moving averages can be changed to various types too.
Adjust Stop Loss and Target Points
Change Properties for Initial Capital and % of Equity or Contracts
Currency Traders need to change to Contracts

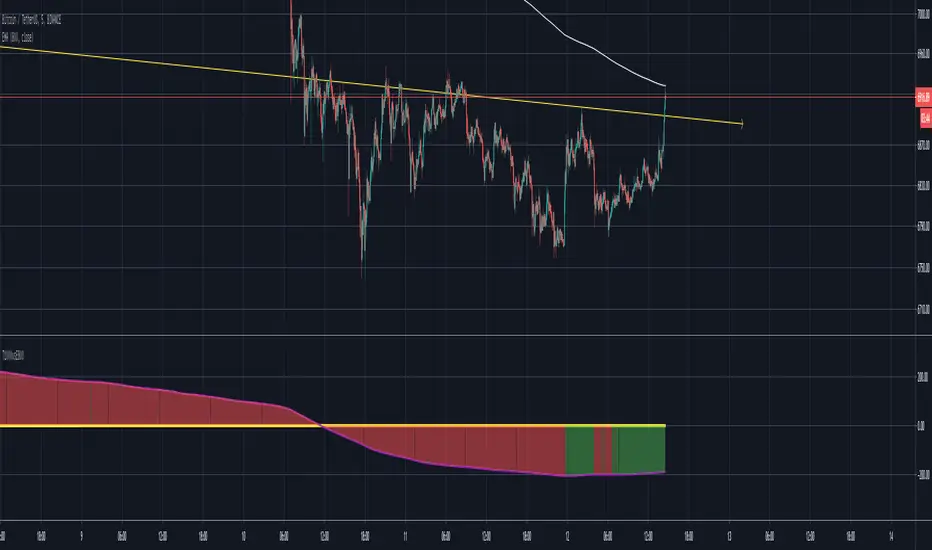
Volume Flow BFBased on code by oh92 and kiasaki.
Measures volume to indicate Bull vs Bear.
Go long when green, short when red, wait patiently when white.
BullRider [JackTz] (strategy)Taking a new approach - I have noticed how all scripts have the same pattern (or issue) when it comes to a bear trend. The majority of scripts works just fine when in a bull trend but once the bears starts to overtake the shit hits the fan and the trades will mostly become negative.
To prevent this I tried to create a script that only trades during a bull run. This strategy is initially created for coins with a big marketcap and for daily timeframe. It works well on 4H timeframes for some coins as well though.
I have tested this through Bar Replay on daily and 4H BTC and it holds out! No repaint!
I will be adding a version for alerts soon.
Please try it out and let me know your thoughts and findings!
//Jack

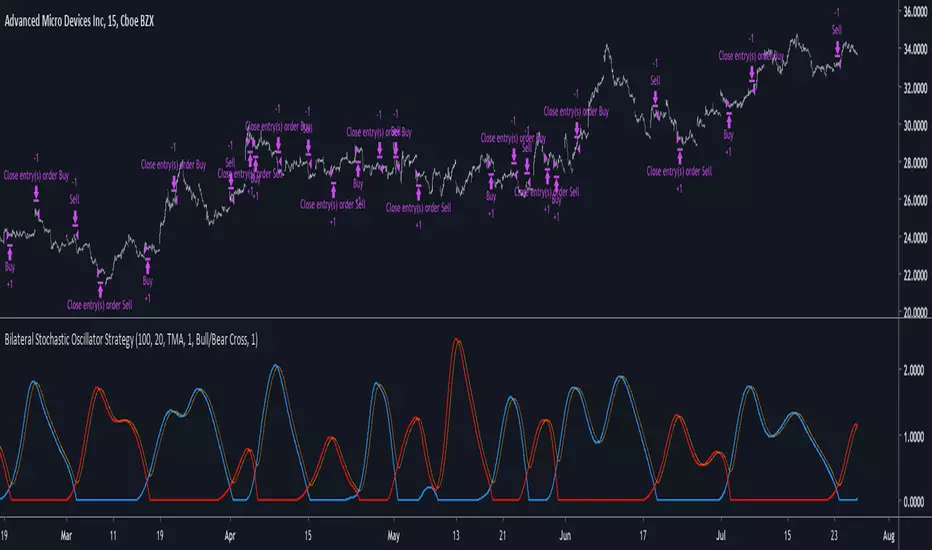
Bilateral Stochastic Oscillator StrategyIntroduction
Strategy based on the bilateral stochastic oscillator, this oscillator aim to detect trends and possible reversal points of the current trend. The oscillator is composed of 1 bull line in blue and 1 bear line in red as well as a signal line in orange, the strategy have many options such as two different strategy framework and a martingale mode. If you require more information about the indicator go check it into my uploaded indicators.
Strategy Frameworks
There are two frameworks available that can be selected from the strategy settings window. Both have the same closing conditions, the "Bull/Bear Cross" entry conditions are :
Buy : when the bull line cross over the bear line
Sell : when the bear line cross over the bull line
The "Signal Cross" entry conditions are :
Buy : when the bull line cross over the signal line
Sell : when the bear line cross over the signal line
Both have the same close conditions that is : close when bull/bear cross under the signal line.
Introduction To Martingale
The martingale money management system consist to double the order size after a loosing trade and can be described as a 2^x where x is the current number of loosing trades since the last win trade, when we win a trade the order size return to the default order size. Therefore our order size function is based on exponential growth.
This system enable the trader to win back his previous losses plus a potential profit, martingales must always be used with stops and sometimes take profits in order to get control in a strategy.
It must always be taken into account that in a series of losses the balance can exponentially decay thus ending to 0 in a matter of trades, this is why it is not recommended to use such system. The strategy allow you to select a martingale multiplier that can be inferior to 2 thus limiting risks, a multiplied of 1 disable the martingale.
Results
Those are the some statistics of the strategy applied to some forex majors by using the default settings in a time frames of 15 minutes.
//-------------------------------------------------------
EURUSD - Order Size 1000 - Spread 0.0002
Profit : $ 21.08
Trades : 19
PP : 57.89 %
Profit Factor : 3.228
Max Drawdown : -$ 3.81
Average Trade : $ 1.11
//-------------------------------------------------------
GBPUSD - Order Size 1000 - Spread 0.0002
Profit : $ 2.31
Trades : 20
PP : 55 %
Profit Factor : 0.938
Max Drawdown : -$ 20.29
Average Trade : $ 0.12
//-------------------------------------------------------
EURAUD - Order Size 1000 - Spread 0.0002
Profit : -$ 9.22
Trades : 20
PP : 40 %
Profit Factor : 0.698
Max Drawdown : -$ 23.44
Average Trade : $ 0.46
//-------------------------------------------------------
EURCHF - Order Size 1000 - Spread 0.0002
Profit : $ 1.58
Trades : 24
PP : 54.17 %
Profit Factor : 1.103
Max Drawdown : -$ 7.23
Average Trade : $ 0.07
//-------------------------------------------------------
Conclusions
Based on the results the strategy does not posses the sufficient performance in order to apply a martingale or any other growth systems as order size. Parameters might be subject to drastic changes depending on the market/time-frame in order to return long-term positive results. I let you draw your conclusions.
Combo Backtest 123 Reversal and Absolute Price Oscillator (APO) This is combo strategies for get
a cumulative signal. Result signal will return 1 if two strategies
is long, -1 if all strategies is short and 0 if signals of strategies is not equal.
First strategy
This System was created from the Book "How I Tripled My Money In The
Futures Market" by Ulf Jensen, Page 183. This is reverse type of strategies.
The strategy buys at market, if close price is higher than the previous close
during 2 days and the meaning of 9-days Stochastic Slow Oscillator is lower than 50.
The strategy sells at market, if close price is lower than the previous close price
during 2 days and the meaning of 9-days Stochastic Fast Oscillator is higher than 50.
Secon strategy
The Absolute Price Oscillator displays the difference between two exponential
moving averages of a security's price and is expressed as an absolute value.
How this indicator works
APO crossing above zero is considered bullish, while crossing below zero is bearish.
A positive indicator value indicates an upward movement, while negative readings
signal a downward trend.
Divergences form when a new high or low in price is not confirmed by the Absolute Price
Oscillator (APO). A bullish divergence forms when price make a lower low, but the APO
forms a higher low. This indicates less downward momentum that could foreshadow a bullish
reversal. A bearish divergence forms when price makes a higher high, but the APO forms a
lower high. This shows less upward momentum that could foreshadow a bearish reversal.
WARNING:
- For purpose educate only
- This script to change bars colors.

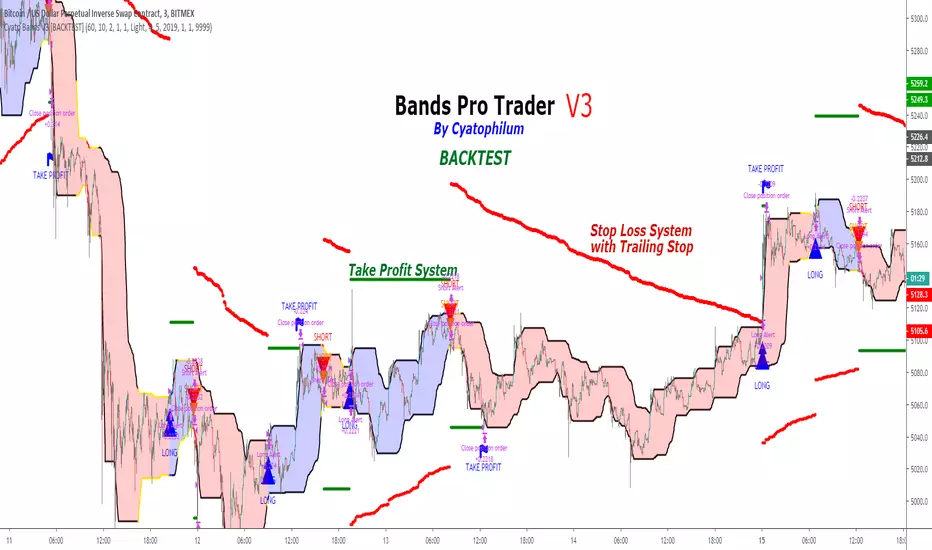
Cyatophilum Bands Pro Trader V3 [BACKTEST]An Original Automated Strategy that can be used for Manual or Bot Trading, on any timeframe and market.
>> Presentation <<
How it works
No, these are NOT Bollinger Bands..
The Cyatophilum Bands are an original formula that I created. You will probably never find it anywhere else.
Their behavior is the following:
When they are horizontal it means the trend is going sideways and they represent supports (lower band) and resistances (upper band).
When they are climbing or falling it means the trend is either bullish or bearish and they represent Trend Lines.
The strategy enters Long on a Bull Breakout and enters Short on a Bear Breakout.
The exits are triggered either on a Trend Reversal, a Stop Loss or a Take Profit.
FEATURES
Take Profit System
Stop Loss System
Show Net profit Line
More features here
Finding a profitable configuration is GUARANTEED
0. Choose your symbol and timeframe. Then add the Backtest version to your chart. If at any time you decide to change your timeframe, go back to step 1.
1. Open the strategy tester and look at the buy & hold line.
If it is mostly climbing (last value greater than 0) then it means we are in a bull market. You should then opt or a long only strategy.
If it is mostly dropping (last value lower than 0) then it means we are in a bear market. You should then opt or a short only strategy.
Note : This first step is really important. Trading against the market has very little chances to succeed.
2. Go into the Strategy Input Parameters:
check "Enable Long Results" and uncheck "Enable Short Results" if you are in a long only strategy.
check "Enable Short Results" and uncheck "Enable Long Results" if you are in a short only strategy.
3. Open the Strategy Tester and open the Strategy Properties.
We are going to find the base parameters for the Bands.
The "Bands Lookback" is the main parameter to configure for any strategy. It corresponds to how strong of a support and resistance the bands will behave. The lower the timeframe, the higher lookback you will need. It can move from 10 to 60. For example 60 is a good value for a 3 minute timeframe. Try different values, and look at the "net profit" value in the Overview tab of the Strategy Tester. Keep the Lookback value that shows the best net profit value.
Then play with the "Bands Smoothing" from 2 to 20 and keep the best net profit value.
The "Band Smoothing" is used to reduce noise.
Usually, the default value (10) is what gives the best results.
From this point you should already be able to have a profitable strategy (net profit>0), but we can improve it using the Stop Loss and the Take Profit feature.
4. To activate the Stop Loss feature, click on the "SECURITY" checkbox
You should see horizontal red lines appear.
A Long/short exit alert will be triggered if the price were to cross this line. (A red Xcross will appear)
Choose the Stop Loss percentage.
On top of that, you can enable the feature "Trailing Stop". It will make the red line follow the price, at a speed that you can configure with the "Trailing Speed" parameter.
Now, sometimes a stop is triggered and it was just a fakeout. You can enable "Re-entries after a stop" to avoid missing additional opportunities.
5. To activate the Take Profit feature, click on the "TAKE PROFIT" checkbox
You should see horizontal green lines appear.
A Long/short exit alert will be triggered if the price were to cross this line. (A flag will appear)
Choose the Take Profit percentage.
A low takeprofit will provide a safer strategy but can reduce potential profits.
A higher takeprofit will increase risk but can provide higher potential profits.
6. Money Management
You can configure the backtest according to your own money management.
Let's say you have 10 000 $ as initial capital and want to trade only 5%, set the Order Size to 5% of Equity.
You can increase net profit by increasing the order size but this is at your own risk.
How to create alerts explained here
Sample Uses Cases
Use it literally anywhere
This indicator can be used on any timeframe and market (not only cryptocurrencies).
About the Backtest below
The Net Profit (Gross profit - Gross loss) is calculated with a commission of 0.05% on each order.
No leverage used. This is a long strategy.
Each trade is made with 10 % of equity from an inital capital of 10 000$. The net profit can be bigger by increasing the % of equity but this a trader's rule to minimise the risk.
I am selling access to all my indicators on my website : blockchainfiesta.com
To get a 2 days free trial, just leave a comment , thanks !
Join my Discord for help, configurations, requests, etc. discord.gg
Death & Golden Cross IndicatorThis script will plot three EMAs and give alerts for death cross and golden cross buy & sell strategy.
The death cross signals a possible shift in trend sentiment from bullish to bearish. Golden Cross signals a shift in a bearish trend to a bullish trend.
Death Cross = 50 Day EMA crosses under 100 Day EMA
Double Death Cross = 50 Day EMA crosses under 200 Day EMA
Golden Cross = 50 Day EMA crosses over 200 Day EMA
Moving Average Cross = 50 Day EMA crosses over 100 Day EMA
Entry Points:
Entry on Golden Cross & VWMA
Entry on 50 EMA Cross 100 EMA
Exit Points:
Exit on Death Cross, Double Death Cross, 200 Day EMA crosses under VWMA
Early Entry and Exit Points:
Uses 50 Day VWMA crossing with 200 Day EMA
As always, trade at your own risk. Best to confirm entry and exits with other strategies and oscillators.

Investing - Weekly EMA's mapped to Daily ChartWhen there isn't enough time in your day to day-trade, yet you want to utilise all the technical analysis skills you have... why not make a long term investing or swing trading indicator set to help you along the way!
So I did....
When it comes to long term investing and swing trading, I often find the weekly 12/26/52 EMA's do a great job in capturing the main market swings from bull to bear.
However, I like to use the Daily chart to see the candle patterns and shapes with more detail and divergences often show up better on the daily chart.
So I have decided to combine the two!
I have basically taken the EMA 12/26/52 from the weekly and transferred them over to the daily (mathematically they are not exact, but for me they are close enough).
I have also developed a simple scale in / scale out strategy for using these exponential moving averages. It isn't as simple as buying in on each signal, however I use my own special strategy to take advantage of the alerts.
Enjoy!

Contender 4Directional movement indicator for assessing price direction and strength. DMI tells you when to be long or short, differentiating between strong &weak trends. DMI works on all time frames and applicable to any asset.
DMI is a moving average of range expansion over an input period. The positive directional movement indicator ( +DMI ) measures how strongly price moves upward; the negative directional movement indicator ( -DMI ) measures how strongly price moves downward. The two lines reflect the respective strength of the bulls versus the bears. Which DMI lines is on top is the dominant DMI. The dominant DMI is stronger and more likely to predict the direction of price. For the buyers and sellers to change dominance, the lines must cross over.

Contender 2
Directional movement indicator for assessing price direction and strength. DMI tells you when to be long or short, differentiating between strong &weak trends. DMI works on all time frames and applicable to any asset.
DMI is a moving average of range expansion over an input period. The positive directional movement indicator ( +DMI ) measures how strongly price moves upward; the negative directional movement indicator ( -DMI ) measures how strongly price moves downward. The two lines reflect the respective strength of the bulls versus the bears. Which DMI lines is on top is the dominant DMI. The dominant DMI is stronger and more likely to predict the direction of price. For the buyers and sellers to change dominance, the lines must cross over.
Added feature is Bollinger Bands to moderate signals.

Contender 1Directional movement indicator for assessing price direction and strength. DMI tells you when to be long or short, differentiating between strong &weak trends. DMI works on all time frames and applicable to any asset.
DMI is a moving average of range expansion over an input period. The positive directional movement indicator ( +DMI ) measures how strongly price moves upward; the negative directional movement indicator ( -DMI ) measures how strongly price moves downward. The two lines reflect the respective strength of the bulls versus the bears. Which DMI lines is on top is the dominant DMI. The dominant DMI is stronger and more likely to predict the direction of price. For the buyers and sellers to change dominance, the lines must cross over.
Added feature is Bollinger Bands to moderate signals.
