Market Structure Targets Model [LuxAlgo]The Market Structure Targets Model indicator provides an algorithmic approach to setting targets from market structure shifts (MSS) and market structure breaks (MSB), two popular Smart Money Concept (SMC) concepts. Depending on the target % settings, they can be used as take profit, confirmation levels, or potential reversal points.
🔶 USAGE
Our Market Structure Targets Model scripts provide automated and customizable targets from MSS and MSB. Each displayed target can be used in several ways described in the sub-sections below:
🔹 Take Profit
The targets can be used as take profit levels, where the target distance can be set separately for bullish/bearish MSS/MSB respectively.
🔹 Confirmation Levels
Alternatively, targets can be used as an additional confirmation level of a trend reversal when set at a lower percentage, filtering out fake signals that might be given from market structures. In this way, targets can be used as potential entry levels.
🔹 Potential Reversal Points
In some circumstances, targets being reached can be indicative of trend reversals. The percentage of the targets would be typically set higher to allow for trend exhaustion.
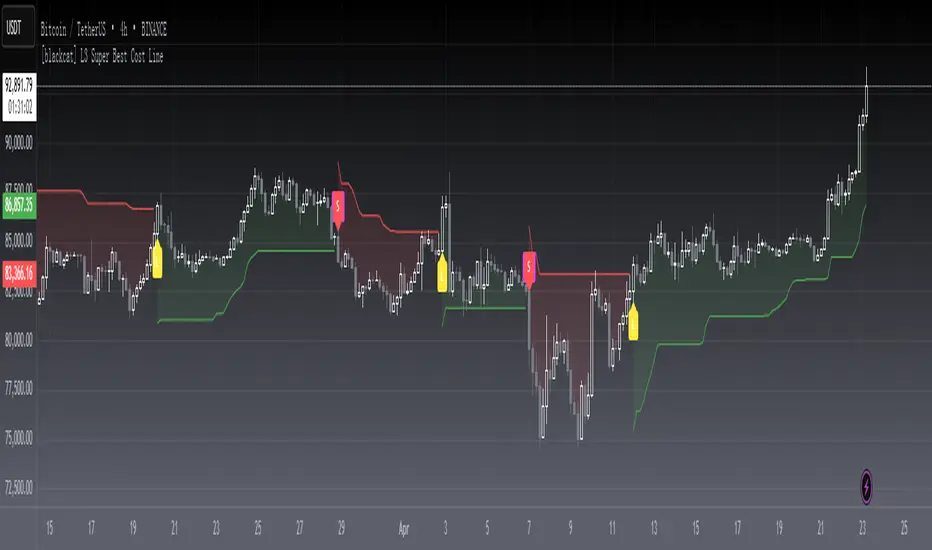
The above examples highlight this usage for bearish reversal scenarios, while the image below highlights it for bullish reversal scenarios.
🔹 Support/Resistance Levels
The targets, being horizontal levels, can also serve as potential support/resistances, with breakouts potentially confirming new trends. It is important to remain observant of the market structure. An MSS or MSB in the opposite direction provides essential information to be included in future decisions.
Using multiple timeframes can help detect longer-term trends. Depending on the user's preference, they can choose the appropriate timeframe for their needs.
Note that Target lines will only be drawn when the Target Level exceeds the close value when it is drawn.
🔹 Maximum Target Duration
The Maximum Target Duration setting removes unreached target levels when the amount of bars since the associated market structure of that target exceeds the user set limit. This effectively allows the removal of any target that might no longer be relevant to newer trends.
🔹 Type: Switch/Hold
This setting is another way to control unreached target levels.
Switch: When a new MSS/MSB is found, the previous target level associated with a market structure with the same direction (bullish/bearish) is deleted if it hasn't been reached.
Hold: Target levels are retained and continuously evaluated when a new MSS/MSB is formed.
The target level will be removed in both cases when the Maximum Target Duration condition is applied.
The above example shows the case when the Type setting is set to Switch , while in the example below, it is set to Hold .
🔶 DETAILS
🔹 Market Structure
Market structures are commonly classified as follows:
Market Structure Shift (MSS), also referred to as Change of Character (CHoCH)
Market Structure Break (MSB), also referred to as Break of Structure (BOS)
MSS indicates a shift in the market trend, confirming trend reversals. Conversely, MSB occurs once a trend is already determined, confirming new higher highs/lower lows.
🔹 Targets
A: Highest/lowest between the extremities of the MSS/MSB line
B: Price value of the MSS/MSB line
The distance between A and B is projected on the opposite side of the MSS/MSB line, adjusted with a percentage that can be set by the user. The above example used 100% of the distance between A and B.
The Target Percentage of MSS and MSB can be set separately for bullish or bearish market structures.
🔶 SETTINGS
Swings: Period used for the swing detection, with higher values returning longer-term Swing Levels.
Type: the Switch/Hold setting controls unattained target levels
Maximum Target Duration: removes the target lines when the amount of bars since the drawing of the target exceeds the limit and the target has not been reached
🔹 Market Structure Shift (MSS)
Bullish: Toggle, color setting, % Target
Bearish: Toggle, color setting, % Target
🔹 Market Structure Break (MSB)
Bullish: Toggle, color setting, % Target
Bearish: Toggle, color setting, % Target
Pine Script® 인디케이터