RSI Divergence AlertRSI Divergence Alert
Input: range
Bullish RSI Divergence
yellow
Bearish RSI Divergence
red
스크립트에서 "bear"에 대해 찾기

08-2018 Stochastic 5m [ALERT SETUP] [INDICATOR]This is an accumulation of small buy orders and a complete sell order strategy, that can be used for manual trading or for a trading bot. The strategy is based on stockastic divergences ( an indicator that I made myself and is published on my profile earlier ), and I added my personnal touch of course. Note that the bullish and bearish stochastic divergences are calculated separately and can be configured in the inputs.
To be used with a 5m timeframe, and on a flat or bullish pair.
Everyone can favorite the script, apply it to the chart, but only I can see or modify the code. If you need anything, leave a comment, thanks :D
More info about the script, such as inputs description, how to configure the script, strategy explanation, alert configuration can be found here : blockchainfiesta.com
--------------------------------------------------------------------------------------------------------------
I do commission work: TradingView Pine Script development & Reverse Engineering.
contact@blockchainfiesta.com.
You can also send me a message in TradingView or Discord (discord.gg)
Bitcoin address: 19sVQvCDmVfEACq7BiMnWSMqFPZ8qfSQ2K
ETH address: 0xc8a5d3a63a05db0c2363ea1c08b37a01cce9ebfb

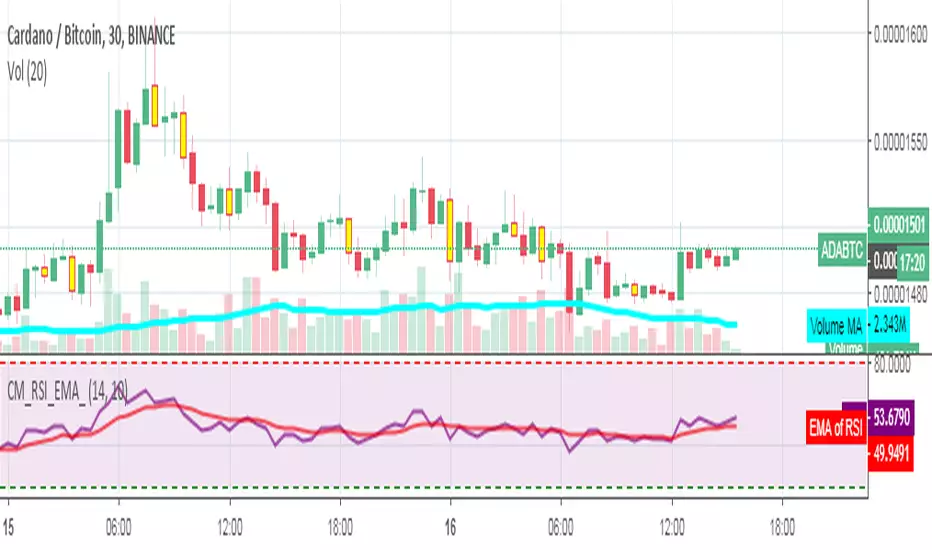
RSI_EMA & Bearish EngulfingThis is a RSI-RSI of EMA and bearish candlestick reversal pattern formed by two candlesticks. Following an uptrend, the first candlestick is a up candlestick which is followed by a down candlestick which has a long real body that engulfs or contains the real body of the prior bar. following an uptrend, if RSI and EMA line cross then Sell and for downtrend if RSI and EMA line cross then Buy.
Spicytrader [BUY and SELL signals + Breakouts + Trendline]
BUY and SELL signals (with alerts)
Support and resistant breakout (with alerts)
Auto trendlines : Bullish and bearish market (with alerts)
100% Compatible with Autoview bot (Buy, Sell, Takeprofit, Stop loss)
TRY IT FOR FREE : spicytrader.com

Stochastique Divergences IndicatorHello,
I made a custom indicator.
Divergences with stochastique and price are really strong signals.
About the indicator
A bullish divergence happens when the stoch K makes a higher low and is depicted by a green triangle up.
A bearish divergence happens when the stoch K makes a lower high and is depicted by a red triangle down.
This script is the base for my next strategy that I should upload soon.
I will grant access (to this script and my others) to people willing to make a small donation.
Here is my BTC address : 19sVQvCDmVfEACq7BiMnWSMqFPZ8qfSQ2K
If you prefer ETH : 0xc8a5d3a63a05db0c2363ea1c08b37a01cce9ebfb
Send me a Private Message with the ID of the transaction
If you want to do some forward testing first, send me a message.
Also check blockchainfiesta.com

wTF50This is a customized trend filter that has several uses:
It helps identify trend direction, either bullish or bearish
It distinguishes between a pullback and a trend reversal
It helps identify areas where traders should stand aside
It highlights areas of consolidation
dTF50This is a customized trend filter that has several uses:
It helps identify trend direction, either bullish or bearish
It distinguishes between a pullback and a trend reversal
It helps identify areas where traders should stand aside
It highlights areas of consolidation
OBV divergence hidden and regular on both bearish and bullish.OBV (on balance volume) divergence indicator with hidden and regular signal on both bearish and bullish.

CMYK VRMI◊ Introduction
This script indicates the relative movement of price x volume.
◊ Origin
Based on 'The Relative Momentum Index' by Roger Altman : February, 1993 issue of Technical Analysis of Stocks & Commodities magazine.
While RSI counts up and down days from close to close, the Relative Momentum Index counts up and down days from the close relative to a close x number of days ago.
This results in an RSI that is smoother. The input has been changed to the change of a smoothed close multiplied by a smoothed volume.
The polarity of VRMI indicates bearish/bullish movement.
◊ Adjustments
CMYK color theme applied.
◊ Usage
VRMI indicates the force the market moves with.
◊ Future Prospects
-
◊ ◊ ◊ ◊ ◊ ◊ ◊ ◊ ◊ ◊ ◊ ◊ ◊ ◊ ◊ ◊ ◊ ◊ ◊ ◊ ◊ ◊ ◊ ◊ ◊ ◊ ◊ ◊ ◊ ◊ ◊ ◊ ◊ ◊ ◊ ◊ ◊ ◊ ◊ ◊ ◊ ◊ ◊ ◊ ◊ ◊ ◊ ◊ ◊ ◊ ◊ ◊ ◊ ◊ ◊ ◊ ◊ ◊ ◊ ◊ ◊ ◊ ◊ ◊ ◊ ◊ ◊ ◊ ◊ ◊ ◊ ◊ ◊ ◊ ◊ ◊ ◊ ◊ ◊ ◊ ◊ ◊ ◊ ◊ ◊ ◊ ◊ ◊ ◊ ◊ ◊ ◊ ◊ ◊ ◊ ◊ ◊ ◊ ◊ ◊ ◊ ◊ ◊ ◊ ◊ ◊

CMYK VRMI RAYS ◊ Introduction
Introducing VRMI in this script, an RMI based on price movement and volume, to indicate bullish and bearish trends.
This script marks the background depending on RMI <> VRMI , VRMI polarity and large buy/sell sprees.
◊ Origin
Based on 'The Relative Momentum Index' by Roger Altman : February, 1993 issue of Technical Analysis of Stocks & Commodities magazine.
While RSI counts up and down days from close to close, the Relative Momentum Index counts up and down days from the close relative to a close x number of days ago.
This results in an RSI that is smoother.
In addition VRMI reacts quick, it is used to cut off latency from RMI, and it's polarity indicates the beginning and end of a trend.
Large buy sell sprees and detected in their proportion with an sma on the volume
◊ Adjustments
CMYK color theme applied.
◊ Usage
This indicator can be used to detect trends and mark reversals.
◊ Prospects
◊ ◊ ◊ ◊ ◊ ◊ ◊ ◊ ◊ ◊ ◊ ◊ ◊ ◊ ◊ ◊ ◊ ◊ ◊ ◊ ◊ ◊ ◊ ◊ ◊ ◊ ◊ ◊ ◊ ◊ ◊ ◊ ◊ ◊ ◊ ◊ ◊ ◊ ◊ ◊ ◊ ◊ ◊ ◊ ◊ ◊ ◊ ◊ ◊ ◊ ◊ ◊ ◊ ◊ ◊ ◊ ◊ ◊ ◊ ◊ ◊ ◊ ◊ ◊ ◊ ◊ ◊ ◊ ◊ ◊ ◊ ◊ ◊ ◊ ◊ ◊ ◊ ◊ ◊ ◊ ◊ ◊ ◊ ◊ ◊ ◊ ◊ ◊ ◊ ◊ ◊ ◊ ◊ ◊ ◊ ◊ ◊ ◊ ◊ ◊ ◊ ◊ ◊ ◊ ◊ ◊


Bullish and Bearish Engulfing Patterns auto detectionThis simple indicator detects automatically most important bullish and bearish candlestick patterns formations. Used to locate potential supply and demand imbalances.
Copyright 2017 Alfonso Moreno www.set-and-forget.com


Super Envolvente (Bullish y Bearish)Identificador de Super-envolventes (SE), se encarga de darle un color verde a la SE alzista (Bullish) verde y rojo a la bajista (Bearish).

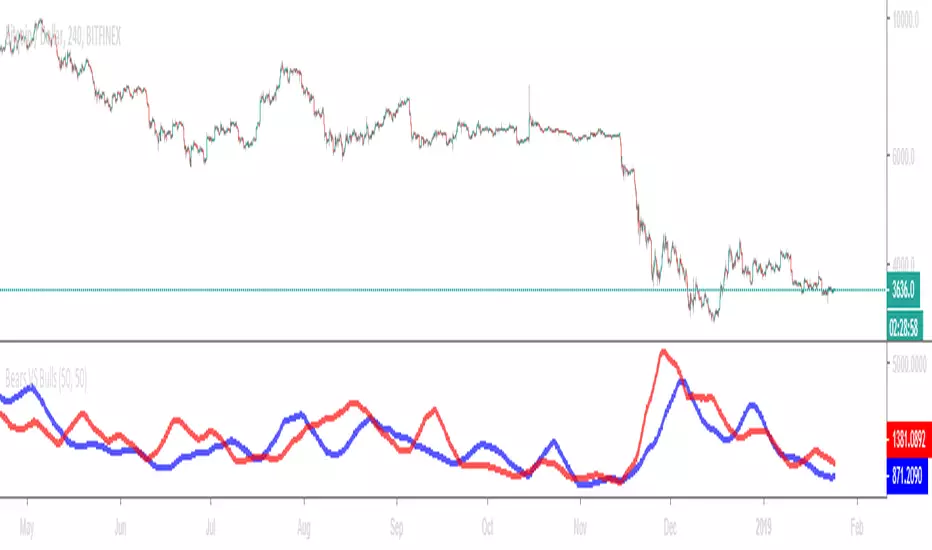
Bears VS BullsThis indicator will work on ANY instrument.
The red line is a moving average of ONLY sellers in the market.
The blue line is a moving average of ONLY buyers in the market.
The period or "length" of the individual moving averages can be adjusted in the indicator settings.
The default, it is set to 50.
Buying and selling trends often provide indications of market moves such as the most recent bottom in Cryptocurrencies.
Feel free to comment and share any indicator concepts or ideas for content you would like to see added to the Technical Indicator Bundle on www.kenzing.com
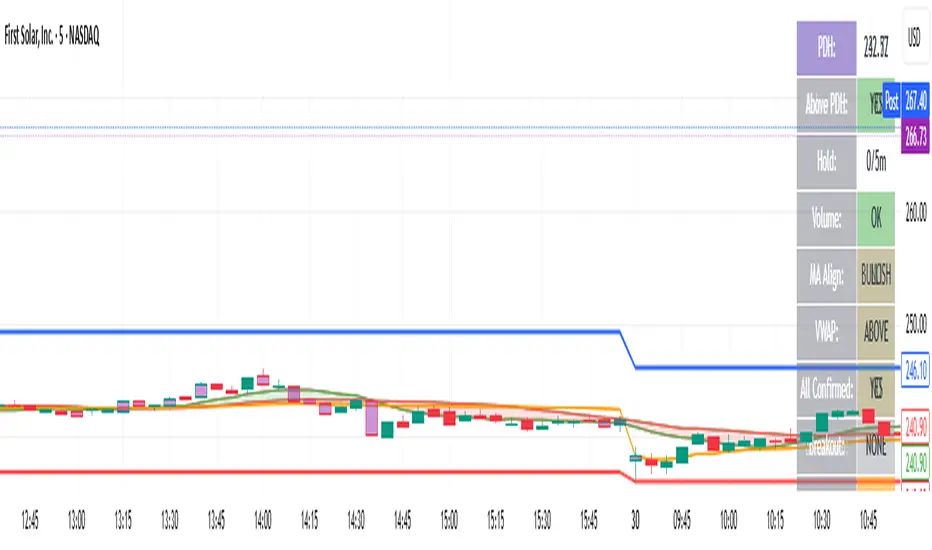
bearish Price Below PDL - Complete Multi-Confirmation Alert🎯 KEY IMPROVEMENTS:
1. Enhanced Alert Visibility:$jmoskyhigh
✅ HUGE triangle down marker with "SELL" text
✅ Alert title: "SELL SIGNAL - PDL BREAKDOWN CONFIRMED"
✅ Prominent info panel with red theme
✅ Clear "SELL ALERT: TRIGGERED" status
2. Better Visual Feedback:
Red frame around info panel
Larger shapes and markers
Color-coded confirmations (green = OK, red = FAIL)
Progress percentage displayed
Breakdown price label
3. Complete Alert System:
Main Alert: "SELL SIGNAL - PDL BREAKDOWN CONFIRMED"
Early Warning: "PDL Breakdown Started - Monitoring"
Reset Alert: "Confirmation Lost - Breakdown Reset"

Bearish signal using Point of Control (POC) with PAC by guruThis indicator code helps traders identify potential sell opportunities using several important technical indicators:
Point of Control (POC) – This is the price level where the most volume was traded over the past several days.
Previous Day's Low – This shows the lowest price reached during the previous day.
PAC (Price Action Channel) EMA – These are two moving averages (one based on the low price and one based on the close price) that help determine if the price is trending within a certain range.
Volume SMA – This is a 3-day simple moving average (SMA) of volume, which helps filter out signals based on market activity.
What the Script Does:
Point of Control (POC):
The script looks at the last 50 days (configurable) and calculates which price level had the highest trading volume.
It then plots a red line on the chart at the POC level. This is important because it helps identify areas where there was strong market interest in the past.
Volume Moving Average:
The script calculates a 3-day SMA of volume, but it excludes the current day to avoid premature signals based on today’s trading.
The volume SMA is used to ensure there’s enough market activity (with a threshold set to 25 units) before triggering a sell signal.
Price Action Channel (PAC) EMA:
The PAC consists of two exponential moving averages (EMAs):
The PAC Low EMA: This is based on the low prices over the last 34 periods (configurable).
The PAC Close EMA: This is based on the closing prices over the last 34 periods.
These EMAs help determine if the price is trending above or below certain price levels.
Sell Signal Logic: The script checks three conditions before displaying a "Sell" signal:
Price Below POC and Previous Day’s Low:
The close price must be below both the Point of Control (POC) and the previous day's low.
Volume SMA Above 25:
The 3-day volume SMA must be greater than 25. This ensures the signal only triggers when there’s enough trading volume in the market.
Today’s Low is Above PAC EMAs:
Today's low price must be above both the PAC low EMA and the PAC close EMA. This prevents sell signals when prices are already significantly below the PAC, indicating possible exhaustion in the downtrend.
If all three conditions are met, the script will display a red "Sell" label on the chart, signaling a potential selling opportunity.
No Sell Signal if Price Reverses:
If the price crosses back above the POC or the previous day's low, the script will remove the sell signal and reset for a new opportunity.
Summary of Conditions:
For the script to display a "Sell" label:
The close price must be below the Point of Control (POC) and the previous day’s low.
The 3-day volume SMA (excluding today) must be greater than 25 units.
The low price of the current day must be above both the PAC low EMA and the PAC close EMA.
If these conditions are met, a red sell label appears on the chart as a potential signal for a short (sell) trade.

Guneet-ScalperBearish trend candle color change to red with sell print
Bullish trend candle color change to green with buy print
thanks
jas toor

Mawhoob (OBs & FVGs) - v1.1Mawhoob (OBs & FVGs) - v1.1
Professional Market Structure Indicator
----------------------------------------------------
🎯 Overview
----------------------------------------------------
Mawhoob (OBs & FVGs) - v1.1 is a comprehensive technical analysis indicator designed to identify and track two of the most powerful concepts in modern price action trading: Order Blocks (OBs) and Fair Value Gaps (FVGs). This indicator provides traders with automated detection, visualization, and real-time alerts for these key market structure elements, helping you identify high-probability trading zones and potential reversal areas.
----------------------------------------------------
🔍 What Are Order Blocks and Fair Value Gaps?
----------------------------------------------------
✅ Order Blocks (OBs)
Order Blocks represent areas where institutional players have placed significant orders, creating imbalances in supply and demand. These zones often act as strong support or resistance levels where price tends to react when revisited.
* Bullish Order Block (OB+): Forms when a bearish candle is immediately followed by a strong bullish candle that closes above the previous candle's high, indicating institutional buying interest.
* Bearish Order Block (OB-): Forms when a bullish candle is immediately followed by a strong bearish candle that closes below the previous candle's low, indicating institutional selling pressure.
✅ Fair Value Gaps (FVGs)
Fair Value Gaps are price inefficiencies that occur when the market moves too quickly, leaving unfilled price ranges. These gaps often get "filled" or "mitigated" as price returns to seek liquidity and balance.
* Bullish Fair Value Gap (FVG+): Forms when there's a gap between the high of two candles ago and the low of the current candle in an upward move.
* Bearish Fair Value Gap (FVG-): Forms when there's a gap between the low of two candles ago and the high of the current candle in a downward move.
----------------------------------------------------
✨ Key Features ✨
----------------------------------------------------
✅ Order Blocks (OBs) Module:
Detection & Visualization
Automatic OB Detection: Identifies both bullish and bearish order blocks in real-time.
Customizable Display: Show up to 50 order blocks simultaneously.
Visual Distinction: Separate color schemes for bullish and bearish order blocks.
Smart Labeling: Optional OB+/OB- labels for easy identification.
Advanced Filtering Options
Strong OBs Filter: Option to display only "super/strong" order blocks.
FVG Confirmation Filter: Show only order blocks that are immediately followed by fair value gaps for higher confluence.
Flexible Filtering: Use filters independently or combine them for maximum selectivity
Mitigation Tracking
Real-time Monitoring: Automatically tracks when order blocks are "filled" or mitigated by price.
Display Control: Choose whether to show or hide filled order blocks.
Customization Options
Color Settings: Fully customizable colors for bullish/bearish order block zones.
Transparency Control: Adjustable box background transparency.
Border Styles: Choose between Solid, Dashed, or Dotted borders.
Extension Options: Extend boxes to the right or stop at mitigation point.
Label Size: Select from Auto, Tiny, Small, Normal, or Large label sizes.
✅ Fair Value Gaps (FVGs) Module:
Detection & Visualization
Automatic FVG Detection: Identifies both bullish and bearish fair value gaps.
Customizable Display: Show up to 50 FVGs simultaneously.
Visual Distinction: Separate color schemes for bullish and bearish gaps.
Smart Labeling: Optional FVG+/FVG- labels for clarity.
Advanced Filtering Options
Strong FVGs Filter: Display only significant gaps formed by strong candles.
OB Confirmation Filter: Show only FVGs that follow order blocks for enhanced reliability.
Independent Settings: Completely separate filtering from order block module.
Mitigation Tracking
Gap Fill Detection: Automatically detects when price fills the fair value gap.
Visual Updates: Filled gaps change appearance to indicate completion.
Display Options: Control visibility of filled versus unfilled gaps.
Customization Options
Full Color Control: Independent color settings for bullish/bearish FVGs.
Transparency Management: Adjustable transparency levels.
Border Customization: Multiple border style options.
Extension Control: Choose how gaps extend on the chart.
Label Customization: Adjustable label sizes and colors.
----------------------------------------------------
🔔 Alerts & Signals
----------------------------------------------------
Alerts System
Real-time Notifications: Receive instant alerts when new OBs or FVGs are detected.
Separate Alert Channels: Independent alerts for order blocks and fair value gaps.
Price Information: Each alert includes the current price level.
Frequency Control: Alerts trigger once per bar to avoid spam.
Visual Signals
On-Chart Markers: Optional visual signals (circles/diamonds) at detection points.
Color-Coded: Bullish signals below bars, bearish signals above bars.
Toggle Control: Enable/disable signals independently from alerts.
----------------------------------------------------
📋 How to Use This Indicator?
----------------------------------------------------
For Trend Following
Look for Bullish OBs and FVGs in uptrends as potential entry zones.
Look for Bearish OBs and FVGs in downtrends as potential entry zones.
Use unmitigated zones as key support/resistance levels.
For Reversal Trading
Watch for price reactions when approaching order blocks.
Combine multiple timeframe analysis for higher probability setups.
Use the "Strong" filters to focus on the most significant zones.
For Confluence Trading
Enable "Show Only (OBs) that Followed by (FVGs)" filter.
Enable "Show Only (FVGs) that Follow (OBs)" filter.
Trade only when both structures align for maximum confluence.
Risk Management
Monitor when zones become mitigated (filled).
Use multiple timeframes to identify nested zones.
Combine with your existing trading strategy for confirmation.
----------------------------------------------------
⚙️ Recommended Settings
----------------------------------------------------
For Scalping (1m - 5m timeframes)
Display: 15-20 boxes.
Enable: Strong filters.
Disable: Show mitigated zones.
For Day Trading (15m - 1H timeframes)
Display: 20-30 boxes.
Enable: Confluence filters when needed.
Enable: Show mitigated zones for context.
For Swing Trading (4H - Daily timeframes)
Display: 30-50 boxes.
Enable: All zones for comprehensive analysis.
Enable: Confluence filters when needed.
Enable: Show mitigated zones for context.
----------------------------------------------------
💡 Pro Tips
----------------------------------------------------
Multiple Timeframe Analysis: Use the indicator on multiple timeframes to identify nested order blocks and FVGs for stronger setups.
Confluence Zones: Areas where OBs and FVGs overlap often provide the highest probability trades.
Mitigation Matters: Pay attention to how quickly and cleanly zones are mitigated - clean mitigations often indicate institutional interest.
Filter Combinations: Experiment with different filter combinations to find what works best for your trading style.
Alert Management: Set up alerts for both OBs and FVGs to never miss potential setups.
----------------------------------------------------
⚠️ Important Notes
----------------------------------------------------
This indicator is for educational and informational purposes only.
Always confirm signals with your own analysis before trading.
Use proper risk management and position sizing.
The indicator works on all timeframes and instruments.
Past performance does not guarantee future results.
----------------------------------------------------
🔄 Updates & Support
----------------------------------------------------
Current Version: v1.1
This indicator is actively maintained and updated. Future versions may include additional features and improvements based on user feedback.
----------------------------------------------------
🙏 Acknowledgments
----------------------------------------------------
Created by @mawhoobx - Designed to help traders identify institutional footprints and market inefficiencies for better trading decisions.

Order Flow Signals - Alphaomega18═══════════════════════════════════════════════════════════════════════════════
ORDER FLOW SIGNALS - TRADINGVIEW PUBLICATION (ENGLISH)
Created by Alphaomega18
═══════════════════════════════════════════════════════════════════════════════
📌 PUBLICATION TITLE
═══════════════════════════════════════════════════════════════════════════════
Order Flow Signals - Absorptions & CVD Divergences - Alphaomega18
📝 COMPLETE DESCRIPTION
═══════════════════════════════════════════════════════════════════════════════
🎯 DETECT INSTITUTIONAL MOVES IN REAL-TIME
Order Flow Signals is an advanced order flow analysis indicator that displays institutional absorption signals, hidden CVD divergences, and extreme buy/sell pressure directly on your chart.
Fully customizable with 9 configurable colors, adjustable label sizes, and extreme absorption detection (300%+), this indicator allows you to trade WITH institutions, not against them.
🔥 THE PROBLEM IT SOLVES
Have you ever:
✗ Taken a technically perfect setup but got stopped out?
✗ Seen price reject a support/resistance but go the other way?
✗ Entered counter-trend without knowing institutions were accumulating?
✗ Missed big moves due to lack of confirmation?
Order Flow Signals solves these problems by revealing what smart money is REALLY doing behind each candle.
📊 SIGNALS DISPLAYED ON CHART
🔷 ABSORPTIONS (💎 Diamonds)
Institutions absorb order flow when volume is high BUT price doesn't move in the expected direction.
💎 BULLISH ABSORPTION (Cyan)
→ Volume spike + bearish candle + positive delta
→ Institutions are BUYING despite selling pressure
→ Strong accumulation signal
💎 BEARISH ABSORPTION (Orange)
→ Volume spike + bullish candle + negative delta
→ Institutions are SELLING despite buying pressure
→ Strong distribution signal
🔥 EXTREME ABSORPTIONS (Fuchsia Fire)
→ Volume > 300% of average (customizable)
→ MASSIVE institutional activity
→ Ultra-rare and ultra-strong signals
→ Indicates major moves in preparation
🔺 DIVERGENCES (▲ Green Triangles)
Price makes lower lows BUT CVD makes higher lows
→ Hidden accumulation in progress
→ Bullish reversal signal likely
→ Confirms your BUY entries
🔻 DIVERGENCES (▼ Red Triangles)
Price makes higher highs BUT CVD makes lower highs
→ Hidden distribution in progress
→ Bearish reversal signal likely
→ Confirms your SELL entries
🚀 EXTREME BUY PRESSURE (Rockets)
Delta > 2x average
→ Massive aggressive buying
→ Strong bullish momentum
→ Continuation likely
💥 EXTREME SELL PRESSURE (Explosions)
Delta < -2x average
→ Massive aggressive selling
→ Strong bearish momentum
→ Capitulation or panic
📈 DELTA PER CANDLE DISPLAY (NEW)
Option to display numerical delta on each candle:
• ✅ GREEN when delta positive (+250, +180, etc.)
• ❌ RED when delta negative (-320, -150, etc.)
• Tiny size to avoid clutter
• Perfect for tracking flow in real-time
🎯 REAL USE CASES
📌 Example 1: Avoid the Classic Trap
Technical setup:
→ Price rejects VWAP Weekly (resistance)
→ FVG below attracting
→ Single Prints above
→ You think: "Perfect SELL setup!"
WITHOUT Order Flow Signals:
❌ You enter SELL
❌ Price goes up and stops you out
❌ Frustration and loss
WITH Order Flow Signals:
✅ You see 💎 CYAN DIAMOND (Bullish absorption)
✅ Institutions are BUYING despite rejection
✅ You DON'T ENTER SELL
✅ Trade saved, loss avoided!
📌 Example 2: Confirm a Breakout
Setup:
→ Price breaks major resistance
→ But is it a real breakout or fakeout?
Check Order Flow Signals:
→ 🚀 ROCKET appears (extreme buy pressure)
→ 💎 CYAN DIAMOND (bullish absorption)
→ Massive positive delta visible
Clear signal: It's a REAL breakout!
→ Enter BUY with confidence
→ Institutions pushing price
📌 Example 3: Detect Hidden Accumulation
Situation:
→ Price consolidating in range
→ Apparently neutral
→ No clear technical signal
Order Flow Signals reveals:
→ ▲ GREEN TRIANGLE (bullish divergence)
→ Price flat BUT CVD rising progressively
→ Institutional accumulation in progress
Action: Prepare LONG position
→ When price breaks, it will be violent!
⚙️ COMPLETE CUSTOMIZATION
🎨 COLORS (9 configurable colors)
• Bullish Absorption (default: cyan)
• Bearish Absorption (default: orange)
• EXTREME Absorption (default: fuchsia)
• Bullish Divergence (default: green)
• Bearish Divergence (default: red)
• Buy Pressure (default: lime)
• Sell Pressure (default: fuchsia)
• Positive Delta (default: green)
• Negative Delta (default: red)
Adapt the indicator to your chart style!
📏 LABEL SIZES
5 sizes available: Tiny / Small / Normal / Large / Huge
→ Perfect for all screen types
→ Large 4K screen? → Large or Huge
→ Small laptop? → Small or Normal
🔍 CUSTOMIZABLE DETECTION
• Normal Absorption Threshold: 1.5x (default)
• EXTREME Absorption Threshold: 3.0x (default)
• Divergence Periods: 14 (default)
• All thresholds adjustable to your style
👁️ ON/OFF DISPLAY
• Absorptions 💎 (On/Off)
• Divergences ▲▼ (On/Off)
• Extreme Pressure 🚀💥 (On/Off)
• Delta per Candle (On/Off)
Display only what you need!
🔔 COMPLETE ALERT SYSTEM
8 independently configurable alert types:
1. 🔵 Bullish Absorption
2. 🔴 Bearish Absorption
3. 🔥🔵 EXTREME Bullish Absorption
4. 🔥🔴 EXTREME Bearish Absorption
5. 📈 Bullish Divergence
6. 📉 Bearish Divergence
7. 🚀 Extreme Buy Pressure
8. 💥 Extreme Sell Pressure
Receive push, email or SMS notifications when institutions act!
💡 MARKETS AND TIMEFRAMES
✅ ALL markets compatible:
• Futures (ES, NQ, YM, RTY, MNQ, MES, etc.)
• Forex (EUR/USD, GBP/USD, USD/JPY, etc.)
• Crypto (BTC, ETH, altcoins)
• Stocks (Tesla, Apple, Nvidia, etc.)
• Indices (S&P 500, Nasdaq, Dow Jones)
• Commodities (Gold, Oil, etc.)
✅ All timeframes:
• Scalping: 1min, 5min
• Day Trading: 15min, 30min, 1H ⭐ (optimal!)
• Swing Trading: 4H, Daily
Note: More reliable signals with real volume data
→ TradingView Premium recommended for tick data
🏆 UNIQUE ADVANTAGES
✅ Automatic institutional absorption detection
✅ EXTREME absorptions (300%+) for ultra-strong signals
✅ Integrated CVD (Cumulative Volume Delta)
✅ Optional per-candle delta display (green/red)
✅ 9 customizable colors - adapt to your style
✅ 5 label sizes - perfect for all screens
✅ Clear visual signals directly on chart
✅ Detailed tooltips on each signal
✅ 8 independent configurable alerts
✅ Clean, optimized code, no repaint
✅ Compatible all markets and timeframes
📊 RECOMMENDED CONFIGURATION
For MNQ / ES / NQ (15min):
```
Detection:
├─ Normal Absorption Threshold: 1.5x
└─ EXTREME Absorption Threshold: 3.0x
Display:
├─ Absorptions: ✅ ON
├─ Divergences: ✅ ON
├─ Extreme Pressure: ✅ ON
└─ Delta per Candle: ❌ OFF (or ON if preferred)
Customization:
└─ Label Size: Normal (or Large for big screen)
Colors:
└─ Default (or customize!)
Alerts:
└─ All ✅ ON
```
For Scalping (1-5min):
```
└─ Label Size: Small
└─ Delta per Candle: ✅ ON (useful in scalping)
└─ Absorption Threshold: 2.0x (stricter)
```
🎓 SUPPORT AND TOOLTIPS
Each signal includes detailed tooltip on hover:
• Exact volume and multiplier (e.g. 2.3x)
• Precise delta
• Signal explanation
• Suggested action
Hover over 💎▲🚀 to understand each signal!
🔗 PERFECT COMPLEMENT
This indicator works perfectly with:
• Order Flow Dashboard (to see CVD and pressures)
• VWAP Multi-Timeframe
• Fair Value Gaps (FVG)
• Market Profile (POC/VPOC)
• Support/Resistance
Combine Order Flow signals with your technical analysis!
⚠️ DISCLAIMER
Technical indicators are decision support tools. No indicator guarantees profits. Always use:
• Appropriate risk management
• Stop loss on every trade
• Proper position sizing
• Demo account testing first
Order Flow Signals improves your analysis but doesn't replace a complete strategy.
📞 CONTACT AND SUPPORT
Created by Alphaomega18
For questions, bugs or suggestions:
Find my other indicators:
• Order Flow Dashboard (CVD and pressures)
• VWAP Multi-Timeframe Pro
• Fair Value Gap Detector
• Volume & Volatility Crisis Detector

CVD Oscillator - Alphaomega18ORDER FLOW DASHBOARD OSCILLATOR - TRADINGVIEW PUBLICATION (ENGLISH)
Created by Alphaomega18
═══════════════════════════════════════════════════════════════════════════════
📌 PUBLICATION TITLE
═══════════════════════════════════════════════════════════════════════════════
Order Flow Dashboard - CVD Oscillator & Pressures - Alphaomega18
📝 COMPLETE DESCRIPTION
═══════════════════════════════════════════════════════════════════════════════
🎯 TRACK INSTITUTIONAL FLOW IN REAL-TIME
Order Flow Dashboard Oscillator is an advanced indicator that displays CVD (Cumulative Volume Delta) as a percentage oscillator, combined with real-time buy/sell pressures.
Unlike traditional CVD indicators where raw CVD reaches millions and crushes other data, this oscillator displays CVD deviation from its average in %, allowing clear reading on the SAME scale as pressures.
🔥 THE PROBLEM SOLVED
Classic CVD indicator problem:
✗ Raw CVD climbs to 1,000,000+ → Unreadable
✗ Pressures stay small (0-500) → Invisible
✗ Impossible to see both simultaneously
✗ Cluttered and confusing chart
Solution with CVD Oscillator:
✅ CVD displayed as % deviation (oscillates around 0)
✅ Pressures normalized on same scale
✅ EVERYTHING visible simultaneously
✅ Clear and intuitive reading
📊 INDICATOR COMPONENTS
🔷 CVD OSCILLATOR (Thick white line)
Traditional CVD accumulates infinitely:
→ Raw CVD = 50,000 ... 100,000 ... 500,000 ... 1,000,000+
→ Hard to interpret
CVD Oscillator shows DEVIATION:
→ CVD Oscillator = +5% ... +12% ... -3% ... -8%
→ Easy to interpret!
**How it works:**
• Calculates distance between CVD and its moving average (20 periods default)
• Converts to percentage
• Oscillates around 0 (gray center line)
**Interpretation:**
• **Above 0** → CVD > Average = BULLISH trend
• **Below 0** → CVD < Average = BEARISH trend
• **+10% zone** (green dotted line) → Buyer strength
• **-10% zone** (red dotted line) → Seller strength
🔷 BUY/SELL PRESSURES (Green/Red zones)
**Buy Pressure (Green zone)**
→ Calculated on bullish candles
→ Proportional to candle size
→ Normalized for optimal visibility
**Sell Pressure (Red zone)**
→ Calculated on bearish candles
→ Proportional to candle size
→ Normalized for optimal visibility
**Extreme Pressures** (Background)
→ 🟢 Light green background = EXTREME buy pressure (delta > 2x average)
→ 🔴 Light red background = EXTREME sell pressure (delta < -2x average)
🔷 REAL-TIME DASHBOARD (Top right corner)
Displays 6 key metrics:
1. **CVD Osc**: Oscillator value in %
2. **CVD Raw**: Raw CVD value (reference)
3. **Trend**: 🟢 Bullish or 🔴 Bearish
4. **Delta**: Current candle delta
5. **Volume**: HIGH (spike) or Normal
6. **Pressure**: 🚀 BUY / 💥 SELL / Neutral
🎯 HOW TO USE IT
📌 CASE 1: HOLD TRADES LONGER
**Classic problem:**
→ You're in a LONG
→ Price pulls back slightly, you panic
→ You exit... then price resumes up
→ Frustration: "I was right but exited too early!"
**Solution with CVD Oscillator:**
Example LONG trade:
1. You enter LONG on breakout
2. You watch CVD Oscillator
3. **As long as it stays ABOVE 0** → Keep the trade
4. Institutions continue accumulating
5. Trend remains intact
Exit:
→ CVD Oscillator **crosses below 0**
→ Signal: Institutions now selling
→ You exit or take profits
**Result:**
✅ You maximize your gains
✅ You exit at right time (when flow changes)
✅ You don't panic on small corrections
📌 CASE 2: CONFIRM TREND STRENGTH
**Setup:**
→ Price in uptrend
→ But is it real trend or just noise?
**Check CVD Oscillator:**
STRONG trend:
→ CVD Oscillator **stays positive** (+5%, +8%, +12%)
→ Dominant buy pressures (green zones)
→ Few or no red backgrounds
WEAK trend:
→ CVD Oscillator **oscillates around 0** (+2%, -1%, +3%)
→ Mixed pressures (green and red alternate)
→ Lack of conviction
**Action:**
✅ Strong trend → Trade with confidence
⚠️ Weak trend → Be cautious or avoid
📌 CASE 3: DETECT TREND CHANGE
**CVD Oscillator Divergence:**
Price makes higher highs BUT:
→ CVD Oscillator makes lower highs
→ +15% ... +12% ... +8% (progressive decline)
→ Sell pressures increasing
Signal: Distribution in progress
→ Institutions selling into rally
→ Reversal likely
→ Prepare SHORT or exit LONG
📌 CASE 4: OPTIMAL ENTRY TIMING
**Situation:**
→ Price consolidating
→ You wait for signal to enter
**LONG entry signal:**
→ CVD Oscillator **crosses above 0**
→ Green background (extreme buy pressure) appears
→ Dashboard: 🚀 BUY
Action: Enter LONG immediately
**SHORT entry signal:**
→ CVD Oscillator **crosses below 0**
→ Red background (extreme sell pressure) appears
→ Dashboard: 💥 SELL
Action: Enter SHORT immediately
⚙️ CUSTOMIZABLE PARAMETERS
🔧 **CVD Moving Average Length** (default: 20)
→ Moving average period for oscillator
→ Shorter (10-15) = More reactive, more signals
→ Longer (30-50) = Smoother, fewer false signals
👁️ **Show CVD Oscillator** (On/Off)
→ Show/hide CVD Oscillator line
👁️ **Show Buy/Sell Pressure** (On/Off)
→ Show/hide pressure zones
👁️ **Show Info Dashboard** (On/Off)
→ Show/hide information table
📊 RECOMMENDED CONFIGURATIONS
**For Day Trading (15min-1H):**
```
CVD MA Length: 20
Show CVD Oscillator: ✅ ON
Show Buy/Sell Pressure: ✅ ON
Show Info Dashboard: ✅ ON
```
**For Scalping (1-5min):**
```
CVD MA Length: 10 (more reactive)
Show CVD Oscillator: ✅ ON
Show Buy/Sell Pressure: ✅ ON
Show Info Dashboard: ✅ ON
```
**For Swing Trading (4H-Daily):**
```
CVD MA Length: 30 (smoother)
Show CVD Oscillator: ✅ ON
Show Buy/Sell Pressure: ✅ ON
Show Info Dashboard: ✅ ON
```
💡 MARKETS AND TIMEFRAMES
✅ **ALL markets compatible:**
• Futures (ES, NQ, YM, RTY, MNQ, MES, etc.)
• Forex (EUR/USD, GBP/USD, USD/JPY, etc.)
• Crypto (BTC, ETH, altcoins)
• Stocks (Tesla, Apple, Nvidia, etc.)
• Indices (S&P 500, Nasdaq, Dow Jones)
✅ **All timeframes:**
• Scalping: 1min, 5min
• Day Trading: 15min, 30min, 1H ⭐ (optimal!)
• Swing Trading: 4H, Daily
Note: More reliable with real volume data
→ TradingView Premium recommended
🏆 UNIQUE ADVANTAGES
✅ **CVD Oscillator**: % deviation instead of raw value
✅ **Same scale**: CVD and pressures visible together
✅ **Intuitive reading**: Above/below 0
✅ **Normalized pressures**: Always visible
✅ **Real-time dashboard**: 6 key metrics
✅ **Strength zones**: +10% and -10% marked
✅ **Background alerts**: Visual extreme pressures
✅ **Optimized code**: Light and fast
✅ **No repaint**: Reliable signals
🔗 PERFECT COMPLEMENT
Use with **Order Flow Signals** for complete system:
• **Order Flow Signals** (overlay=true) → Signals on chart
→ 💎 Absorptions, ▲ Divergences, 🚀 Pressures
• **Order Flow Dashboard** (overlay=false) → CVD and metrics
→ CVD Oscillator, Pressures, Live dashboard
**Complete system = 360° order flow vision!**
🎓 QUICK INTERPRETATION
**CVD Oscillator:**
• +5% to +10% = Moderate bullish
• +10% and above = STRONG bullish
• -5% to -10% = Moderate bearish
• -10% and below = STRONG bearish
• Near 0 = Neutral / Consolidation
**Pressures:**
• Large green zones = Dominant buying
• Large red zones = Dominant selling
• Balanced = Indecision
**Dashboard:**
• 🟢 Bullish + 🚀 BUY = Strong LONG signal
• 🔴 Bearish + 💥 SELL = Strong SHORT signal
• Massive positive delta = Bullish momentum
• Massive negative delta = Bearish momentum
⚠️ DISCLAIMER
Technical indicators are decision support tools. No indicator guarantees profits. Always use:
• Appropriate risk management
• Stop loss on every trade
• Proper position sizing
• Demo account testing first
Order Flow Dashboard improves your analysis but doesn't replace a complete strategy.
🚀 INSTALLATION
1. Copy the Pine Script code
2. Open Pine Editor in TradingView
3. Paste the code
4. Click "Add to Chart"
5. Indicator displays in separate pane (below)
6. Configure parameters to your preferences
7. Combine with Order Flow Signals for complete system!
💡 USAGE TIPS
**Golden Rule for Holding Trades:**
→ LONG: Keep as long as CVD Osc > 0
→ SHORT: Keep as long as CVD Osc < 0
**Strength Signals:**
→ CVD Osc > +10% = Very bullish
→ CVD Osc < -10% = Very bearish
**Trend Change:**
→ CVD Osc crosses 0 = Potential change
→ + Extreme background = Strong confirmation
📞 CONTACT AND SUPPORT
Created by Alphaomega18
For questions, bugs or suggestions:
Find my other indicators:
• Order Flow Signals (signals on chart)
• VWAP Multi-Timeframe Pro
• Fair Value Gap Detector
• Volume & Volatility Crisis Detector

Breakout PRO (B:Pro)Breakout PRO (B:Pro) is an invite-only, multi-filter breakout and trend suite for discretionary trading on any symbol and timeframe. It combines a custom EMA cloud, volatility and momentum filters, higher-timeframe bias, and signal quality scoring into a single framework, so there is no need to stack multiple separate indicators.
Core concept
The script builds a three-layer EMA cloud around price. The relative position of fast, mid, and slow EMAs, plus an ATR-based outer padding, defines:
Bull regime: EMAs bullishly stacked, cloud acting as dynamic support
Bear regime: EMAs bearishly stacked, cloud acting as dynamic resistance
Neutral regime: mixed or crossing EMAs, cloud fades to a neutral color
The cloud defines both the primary trend context and the breakout zones (cloud upper / cloud lower).
A higher-timeframe 200 EMA (user-defined timeframe) adds a long-term directional bias on top.
Support, resistance and structure
Last confirmed swing high and swing low are detected via pivot logic and drawn as dotted support / resistance lines.
These levels are invalidated with a small ATR buffer once price clearly breaks through.
Optional long-term EMA targets (T1 and T2, default 233 and 377) are plotted as future target lines, which can act as potential mean-reversion or trend-continuation objectives.
Filters used in entries
Long and short breakout signals are only shown when multiple, independent conditions align. Each filter can be turned on or off:
Volume: current volume vs volume SMA
MACD: line direction and histogram momentum
RSI: classic OB/OS behavior with sentiment-adjusted thresholds
Stoch RSI: K vs D direction inside valid zones
Bollinger Bands + Keltner Channels: squeeze state and BB breakouts
VWAP: price relative to intraday VWAP
ADX: minimum trend strength threshold
OBV & Ichimoku: optional extra trend confirmation layers
A dedicated Market Sentiment input (Standard, Bullish, Bearish, Consolidation) shifts RSI bands, ADX threshold, and volume requirements so the same logic adapts to different market conditions.
Signals and exits
Entry logic
Long signal: bullish EMA stack, breakout above the last pivot resistance and above the upper cloud, with all enabled long filters confirming.
Short signal: mirrored conditions below the last support pivot and below the lower cloud, with all enabled short filters confirming.
The script internally tracks trade state:
Sets an ATR-based stop level at entry, with mode-dependent ATR multipliers (Short / Mid / Long).
Applies an optional maximum trade duration (different per trade mode).
Plots exit markers when:
the ATR stop is hit
the cloud / EMA structure flips against the trade
MACD or RSI move against the position
or the time limit for the trade is exceeded
Additional icons highlight:
Strong breakouts / breakdowns with large ATR range and high volume
Squeeze releases after low-volatility phases
EMA cross events
Continuation and potential reversal zones around the cloud
Optional RSI divergence arrows based on a separate, mode-tuned RSI.
Quality and safety scoring
Every entry is evaluated on two simple scales (1–3):
Safety score (1–3): driven mainly by volume confirmation, ADX trend strength, distance from the cloud / structure, and overall trend alignment.
Quality score (1–3): reflects BB and MACD confirmation, RSI position, rough reward-to-risk context, and alignment with the selected Market Sentiment.
You can:
Show compact S/Q labels directly next to entry and exit signals.
Use the fixed signal history panel in the bottom-left corner to see the last 5 trade events (opens, closes, crosses, continuation) with their safety and quality scores.
Inputs and layout options
Key configurable inputs include:
Trade Mode: Short (e.g., 30m), Mid (e.g., 4h), Long (e.g., 1D+). This adjusts all core lengths (EMAs, ATR, divergence RSI).
Market Sentiment: Standard, Bullish, Bearish, Consolidation (dynamically retunes filters).
Per-filter toggles for Volume, MACD, RSI, Stoch RSI, BB, Ichimoku, ADX, OBV, VWAP, and HTF levels.
Panel size: Desktop, Phone, or None for the signal history panel.
Side labels: Desktop (full text labels on the price scale) or Phone (compact labels) for better chart space on smaller screens.
Usage notes
Breakout PRO is a technical analysis tool, not an automated trading system or financial advice.
Signals are calculated on closed data without intentional repainting, but values on the current bar can still evolve until the bar closes. Use this indicator as a structured way to read trend, breakout, and confluence – and combine it with your own trade plan, risk management, and testing.
