chrono_utilsLibrary "chrono_utils"
Collection of objects and common functions that are related to datetime windows session days and time
ranges. The main purpose of this library is to handle time-related functionality and make it easy to reason about a
future bar checking if it will be part of a predefined session and/or inside a datetime window. All existing session
functionality I found in the documentation e.g. "not na(time(timeframe, session, timezone))" are not suitable for
strategy scripts, since the execution of the orders is delayed by one bar, due to the script execution happening at
the bar close. Moreover, a history operator with a negative value that looks forward is not allowed in any pinescript
expression. So, a prediction for the next bar using the bars_back argument of "time()"" and "time_close()" was
necessary. Thus, I created this library to overcome this small but very important limitation. In the meantime, I
added useful functionality to handle session-based behavior. An interesting utility that emerged from this
development is the data anomaly detection where a comparison between the prediction and the actual value is happening.
If those two values are different then a data inconsistency happened between the prediction bar and the actual bar
(probably due to a holiday, half session day, a timezone change etc..)
exTimezone(timezone)
exTimezone - Convert extended timezone to timezone string
Parameters:
timezone (simple string) : - The timezone or a special string
Returns: string representing the timezone
nameOfDay(day)
nameOfDay - Convert the day id into a short nameOfDay
Parameters:
day (int) : - The day id to convert
Returns: - The short name of the day
today()
today - Get the day id of this day
Returns: - The day id
nthDayAfter(day, n)
nthDayAfter - Get the day id of n days after the given day
Parameters:
day (int) : - The day id of the reference day
n (int) : - The number of days to go forward
Returns: - The day id of the day that is n days after the reference day
nextDayAfter(day)
nextDayAfter - Get the day id of next day after the given day
Parameters:
day (int) : - The day id of the reference day
Returns: - The day id of the next day after the reference day
nthDayBefore(day, n)
nthDayBefore - Get the day id of n days before the given day
Parameters:
day (int) : - The day id of the reference day
n (int) : - The number of days to go forward
Returns: - The day id of the day that is n days before the reference day
prevDayBefore(day)
prevDayBefore - Get the day id of previous day before the given day
Parameters:
day (int) : - The day id of the reference day
Returns: - The day id of the previous day before the reference day
tomorrow()
tomorrow - Get the day id of the next day
Returns: - The next day day id
normalize(num, min, max)
normalizeHour - Check if number is inthe range of
Parameters:
num (int)
min (int)
max (int)
Returns: - The normalized number
normalizeHour(hourInDay)
normalizeHour - Check if hour is valid and return a noralized hour range from
Parameters:
hourInDay (int)
Returns: - The normalized hour
normalizeMinute(minuteInHour)
normalizeMinute - Check if minute is valid and return a noralized minute from
Parameters:
minuteInHour (int)
Returns: - The normalized minute
monthInMilliseconds(mon)
monthInMilliseconds - Calculate the miliseconds in one bar of the timeframe
Parameters:
mon (int) : - The month of reference to get the miliseconds
Returns: - The number of milliseconds of the month
barInMilliseconds()
barInMilliseconds - Calculate the miliseconds in one bar of the timeframe
Returns: - The number of milliseconds in one bar
method to_string(this)
to_string - Formats the time window into a human-readable string
Namespace types: DateTimeWindow
Parameters:
this (DateTimeWindow) : - The time window object with the from and to datetimes
Returns: - The string of the time window
method to_string(this)
to_string - Formats the session days into a human-readable string with short day names
Namespace types: SessionDays
Parameters:
this (SessionDays) : - The session days object with the day selection
Returns: - The string of the session day short names
method to_string(this)
to_string - Formats the session time into a human-readable string
Namespace types: SessionTime
Parameters:
this (SessionTime) : - The session time object with the hour and minute of the time of the day
Returns: - The string of the session time
method to_string(this)
to_string - Formats the session time into a human-readable string
Namespace types: SessionTimeRange
Parameters:
this (SessionTimeRange) : - The session time range object with the start and end time of the daily session
Returns: - The string of the session time
method to_string(this)
to_string - Formats the session into a human-readable string
Namespace types: Session
Parameters:
this (Session) : - The session object with the day and the time range selection
Returns: - The string of the session
method init(this, fromDateTime, toDateTime)
init - Initialize the time window object from boolean values of each session day
Namespace types: DateTimeWindow
Parameters:
this (DateTimeWindow) : - The time window object that will hold the from and to datetimes
fromDateTime (int) : - The starting datetime of the time window
toDateTime (int) : - The ending datetime of the time window
Returns: - The time window object
method init(this, refTimezone, chTimezone, fromDateTime, toDateTime)
init - Initialize the time window object from boolean values of each session day
Namespace types: DateTimeWindow
Parameters:
this (DateTimeWindow) : - The time window object that will hold the from and to datetimes
refTimezone (simple string) : - The timezone of reference of the 'from' and 'to' dates
chTimezone (simple string) : - The target timezone to convert the 'from' and 'to' dates
fromDateTime (int) : - The starting datetime of the time window
toDateTime (int) : - The ending datetime of the time window
Returns: - The time window object
method init(this, sun, mon, tue, wed, thu, fri, sat)
init - Initialize the session days object from boolean values of each session day
Namespace types: SessionDays
Parameters:
this (SessionDays) : - The session days object that will hold the day selection
sun (bool) : - Is Sunday a trading day?
mon (bool) : - Is Monday a trading day?
tue (bool) : - Is Tuesday a trading day?
wed (bool) : - Is Wednesday a trading day?
thu (bool) : - Is Thursday a trading day?
fri (bool) : - Is Friday a trading day?
sat (bool) : - Is Saturday a trading day?
Returns: - The session days object
method init(this, unixTime)
init - Initialize the object from the hour and minute of the session time in exchange timezone (syminfo.timezone)
Namespace types: SessionTime
Parameters:
this (SessionTime) : - The session time object with the hour and minute of the time of the day
unixTime (int) : - The unix time
Returns: - The session time object
method init(this, hourInDay, minuteInHour)
init - Initialize the object from the hour and minute of the session time in exchange timezone (syminfo.timezone)
Namespace types: SessionTime
Parameters:
this (SessionTime) : - The session time object with the hour and minute of the time of the day
hourInDay (int) : - The hour of the time
minuteInHour (int) : - The minute of the time
Returns: - The session time object
method init(this, hourInDay, minuteInHour, refTimezone)
init - Initialize the object from the hour and minute of the session time
Namespace types: SessionTime
Parameters:
this (SessionTime) : - The session time object with the hour and minute of the time of the day
hourInDay (int) : - The hour of the time
minuteInHour (int) : - The minute of the time
refTimezone (string) : - The timezone of reference of the 'hour' and 'minute'
Returns: - The session time object
method init(this, startTime, endTime)
init - Initialize the object from the start and end session time in exchange timezone (syminfo.timezone)
Namespace types: SessionTimeRange
Parameters:
this (SessionTimeRange) : - The session time range object that will hold the start and end time of the daily session
startTime (SessionTime) : - The time the session begins
endTime (SessionTime) : - The time the session ends
Returns: - The session time range object
method init(this, startTimeHour, startTimeMinute, endTimeHour, endTimeMinute, refTimezone)
init - Initialize the object from the start and end session time
Namespace types: SessionTimeRange
Parameters:
this (SessionTimeRange) : - The session time range object that will hold the start and end time of the daily session
startTimeHour (int) : - The time hour the session begins
startTimeMinute (int) : - The time minute the session begins
endTimeHour (int) : - The time hour the session ends
endTimeMinute (int) : - The time minute the session ends
refTimezone (string)
Returns: - The session time range object
method init(this, days, timeRanges)
init - Initialize the session object from session days and time range
Namespace types: Session
Parameters:
this (Session) : - The session object that will hold the day and the time range selection
days (SessionDays) : - The session days object that defines the days the session is happening
timeRanges (array) : - The array of all the session time ranges during a session day
Returns: - The session object
method init(this, days, timeRanges, names, colors)
init - Initialize the session object from session days and time range
Namespace types: SessionView
Parameters:
this (SessionView) : - The session view object that will hold the session, the names and the color selections
days (SessionDays) : - The session days object that defines the days the session is happening
timeRanges (array) : - The array of all the session time ranges during a session day
names (array) : - The array of the names of the sessions
colors (array) : - The array of the colors of the sessions
Returns: - The session object
method get_size_in_secs(this)
get_size_in_secs - Count the seconds from start to end in the given timeframe
Namespace types: DateTimeWindow
Parameters:
this (DateTimeWindow) : - The time window object with the from and to datetimes
Returns: - The number of seconds inside the time widow for the given timeframe
method get_size_in_secs(this)
get_size_in_secs - Calculate the seconds inside the session
Namespace types: SessionTimeRange
Parameters:
this (SessionTimeRange) : - The session time range object with the start and end time of the daily session
Returns: - The number of seconds inside the session
method get_size_in_bars(this)
get_size_in_bars - Count the bars from start to end in the given timeframe
Namespace types: DateTimeWindow
Parameters:
this (DateTimeWindow) : - The time window object with the from and to datetimes
Returns: - The number of bars inside the time widow for the given timeframe
method get_size_in_bars(this)
get_size_in_bars - Calculate the bars inside the session
Namespace types: SessionTimeRange
Parameters:
this (SessionTimeRange) : - The session time range object with the start and end time of the daily session
Returns: - The number of bars inside the session for the given timeframe
method is_bar_included(this, offset_forward)
is_bar_included - Check if the given bar is between the start and end dates of the window
Namespace types: DateTimeWindow
Parameters:
this (DateTimeWindow) : - The time window object with the from and to datetimes
offset_forward (simple int) : - The number of bars forward. Default is 1
Returns: - Whether the current bar is inside the datetime window
method is_bar_included(this, offset_forward)
is_bar_included - Check if the given bar is inside the session as defined by the input params (what "not na(time(timeframe.period, this.to_sess_string()) )" should return if you could write it
Namespace types: Session
Parameters:
this (Session) : - The session with the day and the time range selection
offset_forward (simple int) : - The bar forward to check if it is between the from and to datetimes. Default is 1
Returns: - Whether the current time is inside the session
method to_sess_string(this)
to_sess_string - Formats the session days into a session string with day ids
Namespace types: SessionDays
Parameters:
this (SessionDays) : - The session days object
Returns: - The string of the session day ids
method to_sess_string(this)
to_sess_string - Formats the session time into a session string
Namespace types: SessionTime
Parameters:
this (SessionTime) : - The session time object with the hour and minute of the time of the day
Returns: - The string of the session time
method to_sess_string(this)
to_sess_string - Formats the session time into a session string
Namespace types: SessionTimeRange
Parameters:
this (SessionTimeRange) : - The session time range object with the start and end time of the daily session
Returns: - The string of the session time
method to_sess_string(this)
to_sess_string - Formats the session into a session string
Namespace types: Session
Parameters:
this (Session) : - The session object with the day and the time range selection
Returns: - The string of the session
method from_sess_string(this, sess)
from_sess_string - Initialize the session days object from the session string
Namespace types: SessionDays
Parameters:
this (SessionDays) : - The session days object that will hold the day selection
sess (string) : - The session string part that represents the days
Returns: - The session days object
method from_sess_string(this, sess)
from_sess_string - Initialize the session time object from the session string in exchange timezone (syminfo.timezone)
Namespace types: SessionTime
Parameters:
this (SessionTime) : - The session time object that will hold the hour and minute of the time
sess (string) : - The session string part that represents the time HHmm
Returns: - The session time object
method from_sess_string(this, sess, refTimezone)
from_sess_string - Initialize the session time object from the session string
Namespace types: SessionTime
Parameters:
this (SessionTime) : - The session time object that will hold the hour and minute of the time
sess (string) : - The session string part that represents the time HHmm
refTimezone (simple string) : - The timezone of reference of the 'hour' and 'minute'
Returns: - The session time object
method from_sess_string(this, sess)
from_sess_string - Initialize the session time range object from the session string in exchange timezone (syminfo.timezone)
Namespace types: SessionTimeRange
Parameters:
this (SessionTimeRange) : - The session time range object that will hold the start and end time of the daily session
sess (string) : - The session string part that represents the time range HHmm-HHmm
Returns: - The session time range object
method from_sess_string(this, sess, refTimezone)
from_sess_string - Initialize the session time range object from the session string
Namespace types: SessionTimeRange
Parameters:
this (SessionTimeRange) : - The session time range object that will hold the start and end time of the daily session
sess (string) : - The session string part that represents the time range HHmm-HHmm
refTimezone (simple string) : - The timezone of reference of the time ranges
Returns: - The session time range object
method from_sess_string(this, sess)
from_sess_string - Initialize the session object from the session string in exchange timezone (syminfo.timezone)
Namespace types: Session
Parameters:
this (Session) : - The session object that will hold the day and the time range selection
sess (string) : - The session string that represents the session HHmm-HHmm,HHmm-HHmm:ddddddd
Returns: - The session time range object
method from_sess_string(this, sess, refTimezone)
from_sess_string - Initialize the session object from the session string
Namespace types: Session
Parameters:
this (Session) : - The session object that will hold the day and the time range selection
sess (string) : - The session string that represents the session HHmm-HHmm,HHmm-HHmm:ddddddd
refTimezone (simple string) : - The timezone of reference of the time ranges
Returns: - The session time range object
method nth_day_after(this, day, n)
nth_day_after - The nth day after the given day that is a session day (true) in the object
Namespace types: SessionDays
Parameters:
this (SessionDays) : - The session days object with the day selection
day (int) : - The day id of the reference day
n (int) : - The number of days after
Returns: - The day id of the nth session day of the week after the given day
method nth_day_before(this, day, n)
nth_day_before - The nth day before the given day that is a session day (true) in the object
Namespace types: SessionDays
Parameters:
this (SessionDays) : - The session days object with the day selection
day (int) : - The day id of the reference day
n (int) : - The number of days after
Returns: - The day id of the nth session day of the week before the given day
method next_day(this)
next_day - The next day that is a session day (true) in the object
Namespace types: SessionDays
Parameters:
this (SessionDays) : - The session days object with the day selection
Returns: - The day id of the next session day of the week
method previous_day(this)
previous_day - The previous day that is session day (true) in the object
Namespace types: SessionDays
Parameters:
this (SessionDays) : - The session days object with the day selection
Returns: - The day id of the previous session day of the week
method get_sec_in_day(this)
get_sec_in_day - Count the seconds since the start of the day this session time represents
Namespace types: SessionTime
Parameters:
this (SessionTime) : - The session time object with the hour and minute of the time of the day
Returns: - The number of seconds passed from the start of the day until that session time
method get_ms_in_day(this)
get_ms_in_day - Count the milliseconds since the start of the day this session time represents
Namespace types: SessionTime
Parameters:
this (SessionTime) : - The session time object with the hour and minute of the time of the day
Returns: - The number of milliseconds passed from the start of the day until that session time
method is_day_included(this, day)
is_day_included - Check if the given day is inside the session days
Namespace types: SessionDays
Parameters:
this (SessionDays) : - The session days object with the day selection
day (int) : - The day to check if it is a trading day
Returns: - Whether the current day is included in the session days
DateTimeWindow
DateTimeWindow - Object that represents a datetime window with a beginning and an end
Fields:
fromDateTime (series int) : - The beginning of the datetime window
toDateTime (series int) : - The end of the datetime window
SessionDays
SessionDays - Object that represent the trading days of the week
Fields:
days (map) : - The map that contains all days of the week and their session flag
SessionTime
SessionTime - Object that represents the time (hour and minutes)
Fields:
hourInDay (series int) : - The hour of the day that ranges from 0 to 24
minuteInHour (series int) : - The minute of the hour that ranges from 0 to 59
minuteInDay (series int) : - The minute of the day that ranges from 0 to 1440. They will be calculated based on hourInDay and minuteInHour when method is called
SessionTimeRange
SessionTimeRange - Object that represents a range that extends from the start to the end time
Fields:
startTime (SessionTime) : - The beginning of the time range
endTime (SessionTime) : - The end of the time range
isOvernight (series bool) : - Whether or not this is an overnight time range
Session
Session - Object that represents a session
Fields:
days (SessionDays) : - The map of the trading days
timeRanges (array) : - The array with all time ranges of the session during the trading days
SessionView
SessionView - Object that visualize a session
Fields:
sess (Session) : - The Session object to be visualized
names (array) : - The names of the session time ranges
colors (array) : - The colors of the session time ranges
스크립트에서 "bar"에 대해 찾기

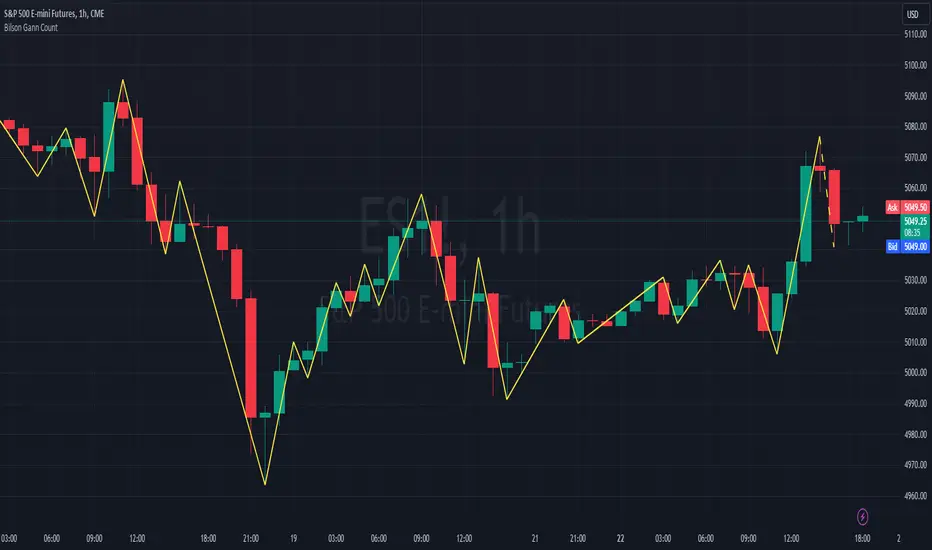
Bilson Gann CountGann counting is a method for identifying swing points,trends, and overall market structure. It simplifies price action by drawing short trend lines that summarize moves.
There's essentially 4 types of bar/candle.
Up bar - Higher high and higher low than previous bar
Down bar - Lower high and lower low than previous bar
Inside bar - Lower high and higher low than previous bar
Outside bar - Higher high and lower low than previous bar
We use these determinations to decide how the trendline moves through the candles.
Up bars we join to the high, down bars we join to the low, inside bars are ignored.
There are other indicators that already exist which do this, the difference here is how we handle outside bars.
Other gann counting methods skip outside bars, this method determines how to handle the outside bar after the outside bar is broken.
examples
UP -> OUTSIDE -> UP = Outside bar treated as swing low
UP -> OUTSIDE -> DOWN = Outside bar treated as swing high
DOWN -> OUTSIDE -> UP = Outside bar treated as swing low
DOWN -> OUTSIDE -> DOWN = Outside bar treated as swing high
[TTI] High Volume Close (HVC) Setup📜 ––––HISTORY & CREDITS––––
The High Volume Close (HVC) Setup is a specialised indicator designed for the TradingView platform used to identify specific bar. This tool was developed with the objective of identifying a technical pattern that trades have claimed is significant trading opportunities through a unique blend of volume analysis and price action strategies. It is based on the premise that high-volume bars, when combined with specific price action criteria, can signal key market movements.
The HVC is applicable both for swing and longer term trading and as a technical tool it can be used by traders of any asset type (stocks, ETF, crypto, forex etc).
🦄 –––UNIQUENESS–––
The uniqueness of the HVC Setup lies in its flexibility to determine an important price level based on historically important bar. The idea is to identify significant bars (e.g. those who have created the HIGHEST VOLUME: Ever, Yearly, Quarterly and meet additional criteria from the settings) and plot on the chart the close on that day as a significant level as well as theoretical stop loss and target levels. This approach allows traders to discern high volume bars that are contextually significant — a method not commonly found in standard trading tools.
🎯 ––––WHAT IT DOES––––
The HVC Setup indicator performs a series of calculations to identify high volume close bars/bar (HVC bars) based on the user requirements.
These bars are determined based on the highest volume recorded within a user-inputs:
👉 Period (Ever, Yearly, Quarterly) and must meet additional criteria such as:
👉 a minimum percentage Price Change (change is calculated based on a close/close) and
👉 specific Closing Range requirements for the HVC da.
The theory is that this is a significant bar that is important to know where it is on the chart.
The script includes a comparative analysis of the HVC bar's price against historical price highs (all-time, yearly, quarterly), which provides further context and significance to the identified bars. All of these USER input requirement are then taken into account as a condition to identity the High Volume Close Bar (HVC).
The visual representation includes color-coded bar (default is yellow) and lines to delineate these key trading signals. It then draws a blue line for the place where the close ofthe bar is, a red line that would signify a stop loss and 2 target profit levels equal to 2R and 3R of the risked level (close-stop loss). Additional lines can be turned on/off with their coresponding checkboxes in the settings.
If the user chooses "Ever" for Period - the script will look at the first available bar ever in Tradingview - this is generally the IPO bar;
If the users chooses "Yearly" - the script would look at the highest available bar for a completed year;
If the users chooses "Quarterly" - it would do the same for the quarter. (works on daily timeframe only);
While we have not backtested the performance of the script, this methodology has been widely publicised.
🛠️ ––––HOW TO USE IT––––
To utilize the HVC Setup effectively:
👉Customize Input Settings: Choose the HVC period, percentage change threshold, closing range, stop loss distance, and target multiples according to your trading strategy. Use the tick boxes to enable and disable if a given condition is used within the calculation.
👉Identify HVC Bars: The script highlights HVC bars, indicating potential opportunities based on volume and price action analysis.
👉Interpret Targets and Stop Losses: Use the color-coded lines (green for targets, red for stop losses) to guide your trade entries and exits.
👉Contextual Analysis: Always consider the HVC bar signals in conjunction with overall market trends and additional technical indicators for comprehensive trading decisions.
This script is designed to assist traders in identifying high-potential trading setups by using a combination of volume and price analysis, enhancing traditional methods with a unique, algorithmically driven approach.

Volume Delta Trailing Stop [LuxAlgo]The ' Volume Delta Trailing Stop ' indicator uses Lower Time Frame (LTF) volume delta data which can provide potential entries together with a Volume-Delta based Trailing Stop-line .
🔶 USAGE
Our 'Volume Delta Trailing Stop' script can show potential entries/Stop Loss lines
A trigger line needs to be broken before a position is taken, after which a Volume Delta-controlled Trailing Stop-line is created:
🔶 DETAILS
🔹 Volume rises when bought or sold
🔹 When the opening price appears on the chart, a buy/sell order has been executed.
If that order is less than the available supply of that particular price, volume will rise, without moving the price.
🔹 When the opening price is the same as the closing price, the volume of that bar can be seen as "neutral volume" (nV); nor "up", nor "down" volume.
Example
A buy order doesn't fill the first available supply in the order book. This price will be the opening price with a certain volume.
When at closing time, price still hasn't moved (the first available supply in the order book isn't filled, or no movement downwards),
the closing price will be equal to the opening price, but with volume. This can be seen as "neutral volume (nV)".
🔹 Delta Volume (ΔV): this is "up volume" minus "down volume"
🔹 Standard volume is colored red when closing price is lower than opening price ( = "down volume").
🔹 Standard volume is colored green when closing price is higher OR equal (nV) than opening price ( = "up volume").
🔹 Neutral Volume
The "Neutral-Volume" is considered "Up-Volume" - setting will dictate whether nV is considered as green 'buy' volume or not.
🔶 EXAMPLE
29 July 10:00 -> 10:05, chart timeframe 5 minutes, open 29311.28, close 29313.89
close > open, so the volume (39.55) is colored green ("up volume").
(The Volume script used in the following examples is the open-source publication Volume Columns w. Alerts (V) from LucF )
Let's zoom to the 1-minute TF:
The same period is now divided into more bars, volume direction (color) is dependable on the difference between open and close.
Counting up and down volume gives a more detailed result, it remains in an upward direction though):
(ΔV = +15.51)
Let's further zoom in to the 1-second TF:
The same period is now divided into even more bars (more possibility for changing direction on each bar)
Here we see several bars that haven't moved in price, but they have volume ("neutral" volume).
(neutral volume is coloured light green here, while up volume is coloured darker green)
When we count all green and red volume bars, the result is quite different:
(ΔV = -0.35)
In total more volume is found when price went downwards, yet price went up in these 5 minutes.
-> This is the heart of our publication, when this divergence occurs, you can see a barcolor changement:
• orange: when price went up, but LTF Volume was mainly in a downward direction.
• blue: when price went down, but LTF Volume was mainly in an upwards direction.
When we split the green "up volume" into "up" and "neutral", the difference is even higher
(here "neutral volume" is colored grey):
(ΔV = -12.76; "up" - "down")
🔶 CONCEPTS
bullishBear = current bar is red but LTF volume is in upward direction -> blue bar
bearishBull = current bar is green but LTF volume is in downward direction -> orange bar
🔹 Potential positioning - forming of Trigger-line
When not in position, the script will wait for a divergence between price and volume direction. When found, a Trigger-line will appear:
• at high when a blue bar appears ( bullishBear ).
• at low when an orange bar appears ( bearishBull ).
Next step is when the Trigger-line is broken by close or high/low (settings: Trigger )
Here, the closing price went under the grey Trigger-line -> bearish position:
🔹 Trailing Stop-line
When the Trigger-line is broken, the Trailing Stop-line (TS-line) will start:
• low when bullish position
• high when bearish position
You can choose (settings -> Trigger -> Close or H/L ) whether close price or high/low should break the Trigger-line
When alerts are enabled ("Any alert() function call"), you'll get the following message:
• ' signal up ' when bullish position
• ' signal down' when bearish position
After that, the TS-line will be adjusted when:
• a blue bullishBear bar appears when in bullish position -> lowest of {low , previous blue bar's high or orange bar's low}
• an orange bearishBull bar appears when in bearish position -> highest of {high, previous blue bar's high or orange bar's low}
When alerts are enabled ("Any alert() function call"), and the TS-line is broken, you'll get the following message:
• ' TS-line broken down ' when out bullish position
• ' TS-line broken up ' when out bearish position
🔹 Reference Point
Default the direction of price will be evaluated by comparing closing price with opening price.
When open and close are the same, you'll get "neutral volume".
You can use "previous close" instead (as in built-in volume indicator) to include gaps.
If close equals open , but close is lower than previous close , it will be regarded as " down volume ",
similar, when close is higher than previous close , it will be regarded as " up volume "
Note, the setting applies for the current timeframe AND Lower timeframe:
Based on: " open " (close - open)
Based on: " previous close " (close - previous close)
🔹 Adjustment
When the TS-line changes, this can be adjusted with a percentage of price , or a multiple of " True Range "
Default (Δ line -> Adjustment - 0)
Δ line -> Adjustment 0.03% (of price)
Δ line -> Mult of TR (10)
🔶 SETTINGS
🔹 LTF: choose your Lower TimeFrame: 1S (seconds), 5S, 10S, 15S, 30S, 1 minute)
🔹 Trigger: Choose the trigger for breaking the Trigger-line ; close or H/L (high when bullish position, low when bearish position)
🔹 Δ line ( Trailing Stop-line ): add/subtract an adjustment when the TS-line changes ( default: Adjustment ):
• Adjustment ( default: 0 ): add/subtract an extra % of price
• Mult of TR : add/subtract a multiple of True Range
🔹 Based on: compare closing price against:
• open
• previous close
🔹 "Neutral-Volume" is considered "Up-Volume" : this setting will dictate whether nV is considered as green 'buy' volume or not.
🔶 CONSIDERATIONS
🔹 The lowest LTF (1S) will give you more detail and will get data close to tick data.
However, a maximum of 100,000 intrabars can be used in calculations .
This means on the daily chart you won't see anything since 1 day ~ 86400 seconds. (just over 1 bar)
-> choose a lower chart timeframe, or choose a higher LTF (5S, 10S, ... 1 minute)
🔹 Always choose a LTF lower than the current chart timeframe.
🔹 Pine Script™ code using this request.security_lower_tf() may calculate differently on historical and real-time bars, leading to repainting .

Volume Profile (Maps) [LuxAlgo]The Pine Script® developers have unleashed "maps"!
Volume Profile (Maps) displays volume, associated with price, above and below the latest price, by using maps
The largest and second-largest volume is highlighted.
🔶 USAGE
The proposed script can highlight more frequent closing prices/prices with the highest volume, potentially highlighting more liquid areas. The prices with the highest associated volume (in red and orange in the indicator) can eventually be used as support/resistance levels.
Voids within the volume profile can highlight large price displacements (volatile variations).
🔶 CONCEPTS
🔹 Maps
A map object is a collection that consists of key - value pairs
Each key is unique and can only appear once. When adding a new value with a key that the map already contains, that value replaces the old value associated with the key .
You can change the value of a particular key though, for example adding volume (value) at the same price (key), the latter technique is used in this script.
Volume is added to the map, associated with a particular price (default close, can be set at high, low, open,...)
When the map already contains the same price (key), the value (volume) is added to the existing volume at the associated price.
A map can contain maximum 50K values, which is more than enough to hold 20K bars (Basic 5K - Premium plan 20K), so the whole history can be put into a map.
🔹 Visible line/box limit
We can only display maximum 500 line.new() though.
The code locates the current (last) close, and displays volume values around this price, using lines, for example 250 lines above and 250 lines below current price.
If one side contains fewer values, the other side can show more lines, taking the maximum out of the 500 visible line limitation.
Example (max. 500 lines visible)
• 100 values below close
• 2000 values above close
-> 100 values will be displayed below close
-> 400 remaining -> 400 values will be displayed above close
Pushing the limits even further, when ' Amount of bars ' is set higher than 500, boxes - box.new() - will be used as well.
These have a limit of 500 as well, bringing the total limit to 1000.
Note that there are visual differences when boxes overlap against lines.
If this is confusing, please keep ' Amount of bars ' at max. 500 (then only lines will be used).
🔹 Rounding function
This publication contains 2 round functions, which can be used to widen the Volume Profile
Round
• "Round" set at zero -> nothing changes to the source number
• "Round" set below zero -> x digit(s) after the decimal point, starting from the right side, and rounded.
• "Round" set above zero -> x digit(s) before the decimal point, starting from the right side, and rounded.
Example: 123456.789
0->123456.789
1->123456.79
2->123456.8
3->123457
-1->123460
-2->123500
Step
Another option is custom steps.
After setting "Round" to "Step", choose the desired steps in price,
Examples
• 2 -> 1234.00, 1236.00, 1238.00, 1240.00
• 5 -> 1230.00, 1235.00, 1240.00, 1245.00
• 100 -> 1200.00, 1300.00, 1400.00, 1500.00
• 0.05 -> 1234.00, 1234.05, 1234.10, 1234.15
•••
🔶 FEATURES
🔹 Adjust position & width
🔹 Table
The table shows the details:
• Size originalMap : amount of elements in original map
• # higher: amount of elements, higher than last "close" (source)
• index "close" : index of last "close" (source), or # element, lower than source
• Size newMap : amount of elements in new map (used for display lines)
• # higher : amount of elements in newMap, higher than last "close" (source)
• # lower : amount of elements in newMap, lower than last "close" (source)
🔹 Volume * currency
Let's take as example BTCUSD, relative to USD, 10 volume at a price of 100 BTCUSD will be very different than 10 volume at a price of 30000 (1K vs. 300K)
If you want volume to be associated with USD, enable Volume * currency . Volume will then be multiplied by the price:
• 10 volume, 1 BTC = 100 -> 1000
• 10 volume, 1 BTC = 30K -> 300K
Disabled
Enabled
🔶 DETAILS
🔹 Put
When the map doesn't contain a price, it will be added, using map.put(id, key, value)
In our code:
map.put(originalMap, price, volume)
or
originalMap.put(price, volume)
A key (price) is now associated with a value (volume) -> key : value
Since all keys are unique, we don't have to know its position to extract the value, we just need to know the key -> map.get(id, key)
We use map.get() when a certain key already exists in the map, and we want to add volume with that value.
if originalMap.contains(price)
originalMap.put(price, originalMap.get(price) + volume)
-> At the last bar, all prices (source) are now associated with volume.
🔹 Copy & sort
Next, every key of the map is copied and sorted (array of keys), after which the index (idx) is retrieved of last (current) price.
copyK = originalMap.keys().copy()
copyK.sort()
idx = copyK.binary_search_leftmost(src)
Then left and right side of idx is investigated to show a maximum amount of lines at both sides of last price.
🔹 New map & display
The keys (from sorted array of copied keys) that will be displayed are put in a new map, with the associated volume values from the original map.
newMap = map.new()
🔹 Re-cap
• put in original amp (price key, volume value)
• copy & sort
• find index of last price
• fetch relevant keys left/right from that index
• put keys in new map and fetch volume associated with these keys (from original map)
Simple example (only show 5 lines)
bar 0, price = 2, volume = 23
bar 1, price = 4, volume = 3
bar 2, price = 8, volume = 21
bar 3, price = 6, volume = 7
bar 4, price = 9, volume = 13
bar 5, price = 5, volume = 85
bar 6, price = 3, volume = 13
bar 7, price = 1, volume = 4
bar 8, price = 7, volume = 9
Original map:
Copied keys array:
Sorted:
-> 5 keys around last price (7) are fetched (5, 6, 7, 8, 9)
-> keys are placed into new map + volume values from original map
Lastly, these values are displayed.
🔶 SETTINGS
Source : Set source of choice; default close , can be set as high , low , open , ...
Volume & currency : Enable to multiply volume with price (see Features )
Amount of bars : Set amount of bars which you want to include in the Volume Profile
Max lines : maximum 1000 (if you want to use only lines, and no boxes -> max. 500, see Concepts )
🔹 Round -> ' Round/Step '
Round -> see Concepts
Step -> see Concepts
🔹 Display Volume Profile
Offset: shifts the Volume Profile (max. 500 bars to the right of last bar, see Features )
Max width Volume Profile: largest volume will be x bars wide, the rest is displayed as a ratio against largest volume (see Features )
Show table : Show details (see Features )
🔶 LIMITATIONS
• Lines won't go further than first bar (coded).
• The Volume Profile can be placed maximum 500 bar to the right of last price.
• Maximum 500 lines/boxes can be displayed

MW Volume ImpulseMW Volume Impulse
Settings
* Moving Average Period: The moving average period used to generate the moving average line for the bar chart. Default=14
* Dot Size: The size of the dot that indicates when the moving average of the CVD is breached. Default=10
* Dot Transparency: The transparency of the dot that indicates when the moving average of the CVD is breached. Default=50
* EMA: The exponential moving average that the price must break through, in addition to the CVD moving
* Accumulation Length: Period used to generate the Cumulative Volume Delta (CVD) for the bar chart. Default=14
Introduction
Velocity = Change in Position over time
Acceleration = Change in Velocity over time
For this indicator, Position is synonymous with the Cumulative Volume Delta (CVD) value. What the indicator attempts to do is to determine when the rate of acceleration of buying or selling volume is changing in either or buying or selling direction in a meaningful way.
Calculations
The CVD, upon which these changes is calculated using candle bodies and wicks. For a red candle, buying volume is calculated by multiplying the volume by the spread percentage of the average of the top and bottom wicks, while Selling Volume is calculated multiplying the volume by the spread percentage of the average of the top and bottom wicks - in addition to the spread percentage of the candle body.
For a green candle, buying volume is calculated by multiplying the volume by the spread percentage of the average of the top and bottom wicks - plus the spread percentage of the candle body - while Selling Volume is calculated using only the spread percentage average of the top and bottom wicks.
How to Interpret
The difference between the buying volume and selling volume is the source of what generates the red and green bars on the indicator. But, more specifically, this indicator uses an exponential moving average of these volumes (14 EMA by default) to determine that actual bar size. The change in this value indicates the velocity of volume and, ultimately, the red and green bars on the indicator.
- When the bar height is zero, that means that there is no velocity, which indicates either a balance between buyers and sellers, or very little volume.
- When the bar height remains largely unchanged from period to period - and not zero - it means that the velocity of volume is constant in one direction. That direction is indicated by the color of the bar. Buyers are dominating when the bars are green, and sellers are dominating when the bars are red.
- When the bar height increases, regardless of bar color, it means that volume is accelerating in a buying direction.
- When the bar height decreases, regardless of bar color, it means that volume is accelerating in a selling direction.
The white line represents the moving average of the bar values, while the red and white - and green and white - dots show when the moving average has been breached by the Cumulative Volume Delta value AND the price has broken the 7 EMA (which is user editable). As with most moving averages, a breach can indicate a move in a bearish or bullish direction, and the sensitivity can be adjusted for differing market conditions
Other Usage Notes and Limitations
For better use of the signal, consider the following,
1. Volume moving below the moving average can indicate that the volume may be ready to exit an overbought condition, especially if the bars were making lower highs prior to the signal - regardless of bar color.
3. Volume moving above the moving average can indicate that the volume may be ready to exit an oversold condition, especially if the bars were making higher lows prior to the signal - regardless of bar color.
Additionally, a green dot that occurs with a positive (green) Cumulative Volume Delta can indicate a buying condition, while a red dot that occurs with a negative (red) Cumulative Volume Delta can indicate a selling condition. What this means is that buying or selling momentum briefly went against the direction of buying or selling Cumulative Volume Delta , but was not strong enough to change the buying or selling direction. In cases like this, once the volume begins to accelerate again in the direction of the buying or selling volume - indicated by a red or green dot - then the price is more likely to favor the direction of the Cumulative Volume Delta and its corresponding acceleration.
Although a red or green signal can indicate a change in direction, this script cannot predict the magnitude or duration of the change. It is best used with accompanying indicators that can be used to confirm a direction change, such as a moving average, or a supply or demand range.

Developing Market Profile / TPO [Honestcowboy]The Developing Market Profile Indicator aims to broaden the horizon of Market Profile / TPO research and trading. While standard Market Profiles aim is to show where PRICE is in relation to TIME on a previous session (usually a day). Developing Market Profile will change bar by bar and display PRICE in relation to TIME for a user specified number of past bars.
What is a market profile?
"Market Profile is an intra-day charting technique (price vertical, time/activity horizontal) devised by J. Peter Steidlmayer. Steidlmayer was seeking a way to determine and to evaluate market value as it developed in the day time frame. The concept was to display price on a vertical axis against time on the horizontal, and the ensuing graphic generally is a bell shape--fatter at the middle prices, with activity trailing off and volume diminished at the extreme higher and lower prices."
For education on market profiles I recommend you search the net and study some profitable traders who use it.
Key Differences
Does not have a value area but distinguishes each column in relation to the biggest column in percentage terms.
Updates bar by bar
Does not take sessions into account
Shows historical values for each bar
While there is an entire education system build around Market Profiles they usually focus on a daily profile and in some cases how the value area develops during the day (there are indicators showing the developing value area).
The idea of trading based on a developing value area is what inspired me to build the Developing Market Profile.
🟦 CALCULATION
Think of this Developing Market Profile the same way as you would think of a moving average. On each bar it will lookback 200 bars (or as user specified) and calculate a Market Profile from those bars (range).
🔹Market Profile gets calculated using these steps:
Get the highest high and lowest low of the price range.
Separate that range into user specified amount of price zones (all spaced evenly)
Loop through the ranges bars and on each bar check in which price zones price was, then add +1 to the zones price was in (we do this using the OccurenceArray)
After it looped through all bars in the range it will draw columns for each price zone (using boxes) and make them as wide as the OccurenceArray dictates in number of bars
🔹Coloring each column:
The script will find the biggest column in the Profile and use that as a reference for all other columns. It will then decide for each column individually how big it is in % compared to the biggest column. It will use that percentage to decide which color to give it, top 20% will be red, top 40% purple, top 60% blue, top 80% green and all the rest yellow. The user is able to adjust these numbers for further customisation.
The historical display of the profiles uses plotchar() and will not only use the color of the column at that time but the % rating will also decide transparancy for further detail when analysing how the profiles developed over time. Each of those historical profiles is calculated using its own 200 past bars. This makes the script very heavy and that is why it includes optimisation settings, more info below.
🟦 USAGE
My general idea of the markets is that they are ever changing and that in studying that changing behaviour a good trader is able to distinguish new behaviour from old behaviour and adapt his approach before losing traders "weak hands" do.
A Market Profile can visually show a trader what kind of market environment we currently are in. In training this visual feedback helps traders remember past market environments and how the market behaved during these times.
Use the history shown using plotchars in colors to get an idea of how the Market Profile looked at each bar of the chart.
This history will help in studying how price moves at different stages of the Market Profile development.
I'm in no way an expert in trading Market Profiles so take this information with a grain of salt. Below an idea of how I would trade using this indicator:
🟦 SETTINGS
🔹MARKET PROFILING
Lookback: The amount of bars the Market Profile will look in the past to calculate where price has been the most in that range
Resolution: This is the amount of columns the Market Profile will have. These columns are calculated using the highest and lowest point price has been for the lookback period
Resolution is limited to a maximum of 32 because of pinescript plotting limits (64). Each plotchar() because of using variable colors takes up 2 of these slots
🔹VISUAL SETTINGS
Profile Distance From Chart: The amount of bars the market profile will be offset from the current bar
Border width (MP): The line thickness of the Market Profile column borders
Character: This is the character the history will use to show past profiles, default is a square.
Color theme: You can pick 5 colors from biggest column of the Profile to smallest column of the profile.
Numbers: these are for % to decide column color. So on default top 20% will be red, top 40% purple... Always use these in descending order
Show Market Profile: This setting will enable/disable the current Market Profile (columns on right side of current bar)
Show Profile History: This setting will enable/disable the Profile History which are the colored characters you see on each bar
🔹OPTIMISATION AND DEBUGGING
Calculate from here: The Market Profile will only start to calculate bar by bar from this point. Setting is needed to optimise loading time and quite frankly without it the script would probably exceed tradingview loading time limits.
Min Size: This setting is there to avoid visual bugs in the script. Scaling the chart there can be issues where the Market Profile extends all the way to 0. To avoid this use a minimum size bigger than the bugged bottom box

LNL Scalper ArrowsLNL Scalper Arrows
The indicator consist of various different types of candlestick patterns that are truly time tested by multiple veteran traders. These arrows are a combination of short-term scalping strategies taught by Linda Raschke & a trader that goes by name Quant Trade Edge. These strategies/patterns occur regularly within the markets. They offer high probability quick moves during the trending days. These four patterns are based on pure price action, no oscillators, no trend, no momentum indicators involved. Trend (ema) is there just as a simple trend gauge.
LNL Scalper Arrows were designed specifically for intra-day trading. Mostly useful for the futures but also stocks as well. These arrows can work anywhere between the fast-moving 512 or 1600 tick charts to a 1min, 2min and up to 5min or 10min charts.
Trend Gauge (Exponential Moving Average)
Nothing fancy just a classic EMA that can guide the direction of the short-term trend. I have added a custom coloring of the EMA that is based on a simple RSI filter. That should help to visualize the non-directional moments within the trend. Although the length is adjustable, for scalping it is better to focus on smaller periods such as 9, 13 or 20 or 34 but anything above 50 loses its purpose as a short-term trend gauge. Again, this is a scalping tool not a trend tool, you are not going to get rid of the fakeouts by increasing the period of the trend.
Tail Arrows (Eat the Tail Pattern)
Tail is a candlestick that is either a price rejection spike, or a flag continuation pattern on a lower time frame. A failed action. It is basically a candle with much bigger wick (shadow) of the candle than the actual body. Such candles are usually telling us about strong participation from the other side of the market. Eat the tail pattern occurs whenever the low of the Tail candle is immediately broken on a following candle "the tail is eaten alive". Such a breaks occurs in a most aggressive types of markets with a strong momentum. DO NOT try to trade this in a low volume or a ranging market. Tail Arrows are the most aggressive arrows & should be only used on the highest volume or a parabolic momentum markets.
Scalp Arrows (Scallop Pattern)
Known as Scallops or minor lows or highs, these patterns are the most common within the all scalper arrows. They occur regularly on 1min & 5min charts - basically everyday. Scallops provide the best possible risk to reward entry within the trend without the need of any indicators or oscillators. The Scallop Up 3 bar pattern consist of a high that is lower that the previous high but also low that is lower than the previous low. Scallop Up or a minor low triggers when the last high is broken, creating a three bar mountain or a peak within the 5 bar span.
Hoagie Arrows (Hoagie Pattern)
Hoagies occur way less often than any other scalping patterns. Hoagies represent two (or more) inside candles within the shadow of a first candle. Such a formation is creating a small compression or a range that sooner or later breaks out. The hoagie is triggered whenever the high or low of the shadow (first) candle is broken. The great thing about the hoagies is that they can work either way despite the trend direction. Although this indicator is coded for the 2 bar hoagies, there are no limitations on how much inside bars can hoagie include.
Umbrella Arrows (Umbrella Pattern)
Another really awesome 3 bar pattern that is really fun to trade. Umbrella occurs when the candle before the previous candle is a pin bar or a tail bar and the body of the previous candle is within the shadow or a wick of the candle before. The umbrella is triggered once the high or low of the previous bar is broken. Umbrellas are more frequent than Hoagies but occur much less than the Scallops.
Outside Bar Wedges (Outside Bar Pattern)
Pretty much self-explanatory candlestick pattern. Outside Bar is basically any bar that peaks outside of the both ends of the previous candle. So the range of the candle is higher & it looked beyond the high and beyond the low of the previous candle. These candles are signalizing the potenial momentum change. Ouside Bars usually occur at the tops or bottoms of the moves. I decided to add them because they can serve as a great addition to these scalping patterns.
Signal vs. SignalBreak Mode
The trigger can be viewed in two different ways:
1. Signal: Plots the trigger before the trigger bar, basically right when the pattern is formed but NOT YET triggered. The signal is triggered once the next candle break the high or low of the current candle.
2. SignalBrake: Plots the trigger after the break of the high or low of the actual pattern. It is basically a candle after the signal candle. (Signal is better for trading because it gives you time to prepare for the actual break of the high or low = the actual signal. SignalBrake is great for looking back in history only for the patterns that actually traded).
Pin Bar BTW Ratio
Pin Bar (Body-To-Wick) Ratio represents the size of the body of a pin bar candle for Eat the Tail and Umbrella patterns. Pin Bar BTW Ratio measures the ratio between the wick & the body of the candle. Ref. interval is 2.0 - 5.0 (ideal pin bar is 2.0 - 3.0 = the wick or a shadow is 2x - 3x bigger than the body of the candle)
ATR Stop & Target Labels
I also created three simple labels (tables) that can show you the ideal target & stop as well as the current ATR. Since LNL Scalper Arrows consist of high probability scalping patterns, a good rule of thumb to follow is to use a half of the current ATR as a target and a current ATR as a stop (or two times the target). So if the current 7 period ATR is 30 the target would be 15 pts. and a stop around 30 pts. With such a risk management you should aim for a win rate 70% or higher. Obviously you can adjust the risk management in the settings to your personal preference.
Low Range vs. High Range Markets
There are two major downsides with the Scalper Arrows:
1. You need volume and a volatility. These patterns really do struggle in ranging "boring" sideways action. It is absolutely crucial to recognize the current market environment and really stay cautions and (or completely out) in case the chop continues. Adding something like DMI can help you recognize the potential flat markets.
2. Not only do you need volume & momentum, you also need a decent range. This indicator works better on a rangy market such as NQ futures or YM. But are much tougher to trade on lower range markets such as some stocks or ZB futures or basically any other lower range market.
Hope it helps.

libhs.log.DEMO◼ Overview
This is a demonstration of dual logging library I have ported from my personal use for public use. Please start bar replay from Bar#4, and progress automatically slowly or manually.You would need to go through 450+ bars to see the full capability.
Logger=A dual logging library for developers. Tradingview lacks logging capability. This library provided logging while developing your scripts and is to be used by developers when developing and debugging their scripts.
Using this library would potentially slow down you scripts. Hence, use this for debugging only. Once your code is as you would like it to be, remove the logging code.
◼︎ Usage (Console):
Console = A sleek single cell logging with a limit of 4096 characters. When you dont need a large logging capability.
//@version=5
indicator("demo.Console", overlay=true)
plot(na)
import GETpacman/log/2 as logger
var console = logger.log.new()
console.init() // init() should be called as first line after variable declaration
console.FrameColor:=color.green
console.log('\n')
console.log('\n')
console.log('Hello World')
console.log('\n')
console.log('\n')
console.ShowStatusBar:=true
console.StatusBarAtBottom:=true
console.FrameColor:=color.blue //settings can be changed anytime before show method is called. Even twice. The last call will set the final value
console.ShowHeader:=false //this wont throw error but is not used for console
console.show(position=position.bottom_right) //this should be the last line of your code, after all methods and settings have been dealt with.
◼︎ Usage (Logx):
Logx = Multiple columns logging with a limit of 4096 characters each message. When you need to log large number of messages.
//@version=5
indicator("demo.Logx", overlay=true)
plot(na)
import GETpacman/log/2 as logger
var logx = logger.log.new()
logx.init() // init() should be called as first line after variable declaration
logx.FrameColor:=color.green
logx.log('\n')
logx.log('\n')
logx.log('Hello World')
logx.log('\n')
logx.log('\n')
logx.ShowStatusBar:=true
logx.StatusBarAtBottom:=true
logx.ShowQ3:=false
logx.ShowQ4:=false
logx.ShowQ5:=false
logx.ShowQ6:=false
logx.FrameColor:=color.olive //settings can be changed anytime before show method is called. Even twice. The last call will set the final value
logx.show(position=position.top_right) //this should be the last line of your code, after all methods and settings have been dealt with.
◼︎ Fields (with default settings)
▶︎ IsConsole = True Log will act as Console if true, otherwise it will act as Logx
▶︎ ShowHeader = True (Log only) Will show a header at top or bottom of logx.
▶︎ HeaderAtTop = True (Log only) Will show the header at the top, or bottom if false, if ShowHeader is true.
▶︎ ShowStatusBar = True Will show a status bar at the bottom
▶︎ StatusBarAtBottom = True Will show the status bar at the bottom, or top if false, if ShowHeader is true.
▶︎ ShowMetaStatus = True Will show the meta info within status bar (Current Bar, characters left in console, Paging On Every Bar, Console dumped data etc)
▶︎ ShowBarIndex = True Logx will show column for Bar Index when the message was logged. Console will add Bar index at the front of logged messages
▶︎ ShowDateTime = True Logx will show column for Date/Time passed with the logged message logged. Console will add Date/Time at the front of logged messages
▶︎ ShowLogLevels = True Logx will show column for Log levels corresponding to error codes. Console will log levels in the status bar
▶︎ ReplaceWithErrorCodes = True (Log only) Logx will show error codes instead of log levels, if ShowLogLevels is switched on
▶︎ RestrictLevelsToKey7 = True Log levels will be restricted to Ley 7 codes - TRACE, DEBUG, INFO, WARNING, ERROR, CRITICAL, FATAL
▶︎ ShowQ1 = True (Log only) Show the column for Q1
▶︎ ShowQ2 = True (Log only) Show the column for Q2
▶︎ ShowQ3 = True (Log only) Show the column for Q3
▶︎ ShowQ4 = True (Log only) Show the column for Q4
▶︎ ShowQ5 = True (Log only) Show the column for Q5
▶︎ ShowQ6 = True (Log only) Show the column for Q6
▶︎ ColorText = True Log/Console will color text as per error codes
▶︎ HighlightText = True Log/Console will highlight text (like denoting) as per error codes
▶︎ AutoMerge = True (Log only) Merge the queues towards the right if there is no data in those queues.
▶︎ PageOnEveryBar = True Clear data from previous bars on each new bar, in conjuction with PageHistory setting.
▶︎ MoveLogUp = True Move log in up direction. Setting to false will push logs down.
▶︎ MarkNewBar = True On each change of bar, add a marker to show the bar has changed
▶︎ PrefixLogLevel = True (Console only) Prefix all messages with the log level corresponding to error code.
▶︎ MinWidth = 40 Set the minimum width needed to be seen. Prevents logx/console shrinking below these number of characters.
▶︎ TabSizeQ1 = 0 If set to more than one, the messages on Q1 or Console messages will indent by this size based on error code (Max 4 used)
▶︎ TabSizeQ2 = 0 If set to more than one, the messages on Q2 will indent by this size based on error code (Max 4 used)
▶︎ TabSizeQ3 = 0 If set to more than one, the messages on Q2 will indent by this size based on error code (Max 4 used)
▶︎ TabSizeQ4 = 0 If set to more than one, the messages on Q2 will indent by this size based on error code (Max 4 used)
▶︎ TabSizeQ5 = 0 If set to more than one, the messages on Q2 will indent by this size based on error code (Max 4 used)
▶︎ TabSizeQ6 = 0 If set to more than one, the messages on Q2 will indent by this size based on error code (Max 4 used)
▶︎ PageHistory = 0 Used with PageOnEveryBar. Determines how many historial pages to keep.
▶︎ HeaderQbarIndex = 'Bar#' (Logx only) The header to show for Bar Index
▶︎ HeaderQdateTime = 'Date' (Logx only) The header to show for Date/Time
▶︎ HeaderQerrorCode = 'eCode' (Logx only) The header to show for Error Codes
▶︎ HeaderQlogLevel = 'State' (Logx only) The header to show for Log Level
▶︎ HeaderQ1 = 'h.Q1' (Logx only) The header to show for Q1
▶︎ HeaderQ2 = 'h.Q2' (Logx only) The header to show for Q2
▶︎ HeaderQ3 = 'h.Q3' (Logx only) The header to show for Q3
▶︎ HeaderQ4 = 'h.Q4' (Logx only) The header to show for Q4
▶︎ HeaderQ5 = 'h.Q5' (Logx only) The header to show for Q5
▶︎ HeaderQ6 = 'h.Q6' (Logx only) The header to show for Q6
▶︎ Status = '' Set the status to this text.
▶︎ HeaderColor Set the color for the header
▶︎ HeaderColorBG Set the background color for the header
▶︎ StatusColor Set the color for the status bar
▶︎ StatusColorBG Set the background color for the status bar
▶︎ TextColor Set the color for the text used without error code or code 0.
▶︎ TextColorBG Set the background color for the text used without error code or code 0.
▶︎ FrameColor Set the color for the frame around Logx/Console
▶︎ FrameSize = 1 Set the size of the frame around Logx/Console
▶︎ CellBorderSize = 0 Set the size of the border around cells.
▶︎ CellBorderColor Set the color for the border around cells within Logx/Console
▶︎ SeparatorColor = gray Set the color of separate in between Console/Logx Attachment
◼︎ Methods (summary)
● init ▶︎ Initialise the log
● log ▶︎ Log the messages. Use method show to display the messages
● page ▶︎ Clear messages from previous bar while logging messages on this bar.
● show ▶︎ Shows a table displaying the logged messages
● clear ▶︎ Clears the log of all messages
● resize ▶︎ Resizes the log. If size is for reduction then oldest messages are lost first.
● turnPage ▶︎ When called, all messages marked with previous page, or from start are cleared
● dateTimeFormat ▶︎ Sets the date time format to be used when displaying date/time info.
● resetTextColor ▶︎ Reset Text Color to library default
● resetTextBGcolor ▶︎ Reset Text BG Color to library default
● resetHeaderColor ▶︎ Reset Header Color to library default
● resetHeaderBGcolor ▶︎ Reset Header BG Color to library default
● resetStatusColor ▶︎ Reset Status Color to library default
● resetStatusBGcolor ▶︎ Reset Status BG Color to library default
● setColors ▶︎ Sets the colors to be used for corresponding error codes
● setColorsBG ▶︎ Sets the background colors to be used for corresponding error codes. If not match of error code, then text color used.
● setColorsHC ▶︎ Sets the highlight colors to be used for corresponding error codes.If not match of error code, then text bg color used.
● resetColors ▶︎ Reset the colors to library default (Total 36, not including error code 0)
● resetColorsBG ▶︎ Reset the background colors to library default
● resetColorsHC ▶︎ Reset the highlight colors to library default
● setLevelNames ▶︎ Set the log level names to be used for corresponding error codes. If not match of error code, then empty string used.
● resetLevelNames ▶︎ Reset the log level names to library default. (Total 36) 1=TRACE, 2=DEBUG, 3=INFO, 4=WARNING, 5=ERROR, 6=CRITICAL, 7=FATAL
● attach ▶︎ Attaches a console to an existing Logx, allowing to have dual logging system independent of each other
● detach ▶︎ Detaches an already attached console from Logx

loggerLibrary "logger"
◼ Overview
A dual logging library for developers. Tradingview lacks logging capability. This library provides logging while developing your scripts and is to be used by developers when developing and debugging their scripts.
Using this library would potentially slow down you scripts. Hence, use this for debugging only. Once your code is as you would like it to be, remove the logging code.
◼︎ Usage (Console):
Console = A sleek single cell logging with a limit of 4096 characters. When you dont need a large logging capability.
//@version=5
indicator("demo.Console", overlay=true)
plot(na)
import GETpacman/logger/1 as logger
var console = logger.log.new()
console.init() // init() should be called as first line after variable declaration
console.FrameColor:=color.green
console.log('\n')
console.log('\n')
console.log('Hello World')
console.log('\n')
console.log('\n')
console.ShowStatusBar:=true
console.StatusBarAtBottom:=true
console.FrameColor:=color.blue //settings can be changed anytime before show method is called. Even twice. The last call will set the final value
console.ShowHeader:=false //this wont throw error but is not used for console
console.show(position=position.bottom_right) //this should be the last line of your code, after all methods and settings have been dealt with.
◼︎ Usage (Logx):
Logx = Multiple columns logging with a limit of 4096 characters each message. When you need to log large number of messages.
//@version=5
indicator("demo.Logx", overlay=true)
plot(na)
import GETpacman/logger/1 as logger
var logx = logger.log.new()
logx.init() // init() should be called as first line after variable declaration
logx.FrameColor:=color.green
logx.log('\n')
logx.log('\n')
logx.log('Hello World')
logx.log('\n')
logx.log('\n')
logx.ShowStatusBar:=true
logx.StatusBarAtBottom:=true
logx.ShowQ3:=false
logx.ShowQ4:=false
logx.ShowQ5:=false
logx.ShowQ6:=false
logx.FrameColor:=color.olive //settings can be changed anytime before show method is called. Even twice. The last call will set the final value
logx.show(position=position.top_right) //this should be the last line of your code, after all methods and settings have been dealt with.
◼︎ Fields (with default settings)
▶︎ IsConsole = True Log will act as Console if true, otherwise it will act as Logx
▶︎ ShowHeader = True (Log only) Will show a header at top or bottom of logx.
▶︎ HeaderAtTop = True (Log only) Will show the header at the top, or bottom if false, if ShowHeader is true.
▶︎ ShowStatusBar = True Will show a status bar at the bottom
▶︎ StatusBarAtBottom = True Will show the status bar at the bottom, or top if false, if ShowHeader is true.
▶︎ ShowMetaStatus = True Will show the meta info within status bar (Current Bar, characters left in console, Paging On Every Bar, Console dumped data etc)
▶︎ ShowBarIndex = True Logx will show column for Bar Index when the message was logged. Console will add Bar index at the front of logged messages
▶︎ ShowDateTime = True Logx will show column for Date/Time passed with the logged message logged. Console will add Date/Time at the front of logged messages
▶︎ ShowLogLevels = True Logx will show column for Log levels corresponding to error codes. Console will log levels in the status bar
▶︎ ReplaceWithErrorCodes = True (Log only) Logx will show error codes instead of log levels, if ShowLogLevels is switched on
▶︎ RestrictLevelsToKey7 = True Log levels will be restricted to Ley 7 codes - TRACE, DEBUG, INFO, WARNING, ERROR, CRITICAL, FATAL
▶︎ ShowQ1 = True (Log only) Show the column for Q1
▶︎ ShowQ2 = True (Log only) Show the column for Q2
▶︎ ShowQ3 = True (Log only) Show the column for Q3
▶︎ ShowQ4 = True (Log only) Show the column for Q4
▶︎ ShowQ5 = True (Log only) Show the column for Q5
▶︎ ShowQ6 = True (Log only) Show the column for Q6
▶︎ ColorText = True Log/Console will color text as per error codes
▶︎ HighlightText = True Log/Console will highlight text (like denoting) as per error codes
▶︎ AutoMerge = True (Log only) Merge the queues towards the right if there is no data in those queues.
▶︎ PageOnEveryBar = True Clear data from previous bars on each new bar, in conjuction with PageHistory setting.
▶︎ MoveLogUp = True Move log in up direction. Setting to false will push logs down.
▶︎ MarkNewBar = True On each change of bar, add a marker to show the bar has changed
▶︎ PrefixLogLevel = True (Console only) Prefix all messages with the log level corresponding to error code.
▶︎ MinWidth = 40 Set the minimum width needed to be seen. Prevents logx/console shrinking below these number of characters.
▶︎ TabSizeQ1 = 0 If set to more than one, the messages on Q1 or Console messages will indent by this size based on error code (Max 4 used)
▶︎ TabSizeQ2 = 0 If set to more than one, the messages on Q2 will indent by this size based on error code (Max 4 used)
▶︎ TabSizeQ3 = 0 If set to more than one, the messages on Q2 will indent by this size based on error code (Max 4 used)
▶︎ TabSizeQ4 = 0 If set to more than one, the messages on Q2 will indent by this size based on error code (Max 4 used)
▶︎ TabSizeQ5 = 0 If set to more than one, the messages on Q2 will indent by this size based on error code (Max 4 used)
▶︎ TabSizeQ6 = 0 If set to more than one, the messages on Q2 will indent by this size based on error code (Max 4 used)
▶︎ PageHistory = 0 Used with PageOnEveryBar. Determines how many historial pages to keep.
▶︎ HeaderQbarIndex = 'Bar#' (Logx only) The header to show for Bar Index
▶︎ HeaderQdateTime = 'Date' (Logx only) The header to show for Date/Time
▶︎ HeaderQerrorCode = 'eCode' (Logx only) The header to show for Error Codes
▶︎ HeaderQlogLevel = 'State' (Logx only) The header to show for Log Level
▶︎ HeaderQ1 = 'h.Q1' (Logx only) The header to show for Q1
▶︎ HeaderQ2 = 'h.Q2' (Logx only) The header to show for Q2
▶︎ HeaderQ3 = 'h.Q3' (Logx only) The header to show for Q3
▶︎ HeaderQ4 = 'h.Q4' (Logx only) The header to show for Q4
▶︎ HeaderQ5 = 'h.Q5' (Logx only) The header to show for Q5
▶︎ HeaderQ6 = 'h.Q6' (Logx only) The header to show for Q6
▶︎ Status = '' Set the status to this text.
▶︎ HeaderColor Set the color for the header
▶︎ HeaderColorBG Set the background color for the header
▶︎ StatusColor Set the color for the status bar
▶︎ StatusColorBG Set the background color for the status bar
▶︎ TextColor Set the color for the text used without error code or code 0.
▶︎ TextColorBG Set the background color for the text used without error code or code 0.
▶︎ FrameColor Set the color for the frame around Logx/Console
▶︎ FrameSize = 1 Set the size of the frame around Logx/Console
▶︎ CellBorderSize = 0 Set the size of the border around cells.
▶︎ CellBorderColor Set the color for the border around cells within Logx/Console
▶︎ SeparatorColor = gray Set the color of separate in between Console/Logx Attachment
◼︎ Methods (summary)
● init ▶︎ Initialise the log
● log ▶︎ Log the messages. Use method show to display the messages
● page ▶︎ Clear messages from previous bar while logging messages on this bar.
● show ▶︎ Shows a table displaying the logged messages
● clear ▶︎ Clears the log of all messages
● resize ▶︎ Resizes the log. If size is for reduction then oldest messages are lost first.
● turnPage ▶︎ When called, all messages marked with previous page, or from start are cleared
● dateTimeFormat ▶︎ Sets the date time format to be used when displaying date/time info.
● resetTextColor ▶︎ Reset Text Color to library default
● resetTextBGcolor ▶︎ Reset Text BG Color to library default
● resetHeaderColor ▶︎ Reset Header Color to library default
● resetHeaderBGcolor ▶︎ Reset Header BG Color to library default
● resetStatusColor ▶︎ Reset Status Color to library default
● resetStatusBGcolor ▶︎ Reset Status BG Color to library default
● setColors ▶︎ Sets the colors to be used for corresponding error codes
● setColorsBG ▶︎ Sets the background colors to be used for corresponding error codes. If not match of error code, then text color used.
● setColorsHC ▶︎ Sets the highlight colors to be used for corresponding error codes.If not match of error code, then text bg color used.
● resetColors ▶︎ Reset the colors to library default (Total 36, not including error code 0)
● resetColorsBG ▶︎ Reset the background colors to library default
● resetColorsHC ▶︎ Reset the highlight colors to library default
● setLevelNames ▶︎ Set the log level names to be used for corresponding error codes. If not match of error code, then empty string used.
● resetLevelNames ▶︎ Reset the log level names to library default. (Total 36) 1=TRACE, 2=DEBUG, 3=INFO, 4=WARNING, 5=ERROR, 6=CRITICAL, 7=FATAL
● attach ▶︎ Attaches a console to an existing Logx, allowing to have dual logging system independent of each other
● detach ▶︎ Detaches an already attached console from Logx
method clear(this)
Clears all the queue, including bar_index and time queues, of existing messages
Namespace types: log
Parameters:
this (log)
method resize(this, rows)
Resizes the message queues. If size is decreased then removes the oldest messages
Namespace types: log
Parameters:
this (log)
rows (int) : The new size needed for the queues. Default value is 40.
method dateTimeFormat(this, format)
Re/set the date time format used for displaying date and time. Default resets to dd.MMM.yy HH:mm
Namespace types: log
Parameters:
this (log)
format (string)
method resetTextColor(this)
Resets the text color of the log to library default.
Namespace types: log
Parameters:
this (log)
method resetTextColorBG(this)
Resets the background color of the log to library default.
Namespace types: log
Parameters:
this (log)
method resetHeaderColor(this)
Resets the color used for Headers, to library default.
Namespace types: log
Parameters:
this (log)
method resetHeaderColorBG(this)
Resets the background color used for Headers, to library default.
Namespace types: log
Parameters:
this (log)
method resetStatusColor(this)
Resets the text color of the status row, to library default.
Namespace types: log
Parameters:
this (log)
method resetStatusColorBG(this)
Resets the background color of the status row, to library default.
Namespace types: log
Parameters:
this (log)
method resetFrameColor(this)
Resets the color used for the frame around the log table, to library default.
Namespace types: log
Parameters:
this (log)
method resetColorsHC(this)
Resets the color used for the highlighting when Highlight Text option is used, to library default
Namespace types: log
Parameters:
this (log)
method resetColorsBG(this)
Resets the background color used for setting the background color, when the Color Text option is used, to library default
Namespace types: log
Parameters:
this (log)
method resetColors(this)
Resets the color used for respective error codes, when the Color Text option is used, to library default
Namespace types: log
Parameters:
this (log)
method setColors(this, c)
Sets the colors corresponding to error codes
Index 0 of input array c is color is reserved for future use.
Index 1 of input array c is color for debug code 1.
Index 2 of input array c is color for debug code 2.
There are 2 modes of coloring
1 . Using the Foreground color
2 . Using the Foreground color as background color and a white/black/gray color as foreground color
This is denoting or highlighting. Which effectively puts the foreground color as background color
Namespace types: log
Parameters:
this (log)
c (color ) : Array of colors to be used for corresponding error codes. If the corresponding code is not found, then text color is used
method setColorsHC(this, c)
Sets the highlight colors corresponding to error codes
Index 0 of input array c is color is reserved for future use.
Index 1 of input array c is color for debug code 1.
Index 2 of input array c is color for debug code 2.
There are 2 modes of coloring
1 . Using the Foreground color
2 . Using the Foreground color as background color and a white/black/gray color as foreground color
This is denoting or highlighting. Which effectively puts the foreground color as background color
Namespace types: log
Parameters:
this (log)
c (color ) : Array of highlight colors to be used for corresponding error codes. If the corresponding code is not found, then text color BG is used
method setColorsBG(this, c)
Sets the highlight colors corresponding to debug codes
Index 0 of input array c is color is reserved for future use.
Index 1 of input array c is color for debug code 1.
Index 2 of input array c is color for debug code 2.
There are 2 modes of coloring
1 . Using the Foreground color
2 . Using the Foreground color as background color and a white/black/gray color as foreground color
This is denoting or highlighting. Which effectively puts the foreground color as background color
Namespace types: log
Parameters:
this (log)
c (color ) : Array of background colors to be used for corresponding error codes. If the corresponding code is not found, then text color BG is used
method resetLevelNames(this, prefix, suffix)
Resets the log level names used for corresponding error codes
With prefix/suffix, the default Level name will be like => prefix + Code + suffix
Namespace types: log
Parameters:
this (log)
prefix (string) : Prefix to use when resetting level names
suffix (string) : Suffix to use when resetting level names
method setLevelNames(this, names)
Resets the log level names used for corresponding error codes
Index 0 of input array names is reserved for future use.
Index 1 of input array names is name used for error code 1.
Index 2 of input array names is name used for error code 2.
Namespace types: log
Parameters:
this (log)
names (string ) : Array of log level names be used for corresponding error codes. If the corresponding code is not found, then an empty string is used
method init(this, rows, isConsole)
Sets up data for logging. It consists of 6 separate message queues, and 3 additional queues for bar index, time and log level/error code. Do not directly alter the contents, as library could break.
Namespace types: log
Parameters:
this (log)
rows (int) : Log size, excluding the header/status. Default value is 50.
isConsole (bool) : Whether to init the log as console or logx. True= as console, False = as Logx. Default is true, hence init as console.
method log(this, ec, m1, m2, m3, m4, m5, m6, tv, log)
Logs messages to the queues , including, time/date, bar_index, and error code
Namespace types: log
Parameters:
this (log)
ec (int) : Error/Code to be assigned.
m1 (string) : Message needed to be logged to Q1, or for console.
m2 (string) : Message needed to be logged to Q2. Not used/ignored when in console mode
m3 (string) : Message needed to be logged to Q3. Not used/ignored when in console mode
m4 (string) : Message needed to be logged to Q4. Not used/ignored when in console mode
m5 (string) : Message needed to be logged to Q5. Not used/ignored when in console mode
m6 (string) : Message needed to be logged to Q6. Not used/ignored when in console mode
tv (int) : Time to be used. Default value is time, which logs the start time of bar.
log (bool) : Whether to log the message or not. Default is true.
method page(this, ec, m1, m2, m3, m4, m5, m6, tv, page)
Logs messages to the queues , including, time/date, bar_index, and error code. All messages from previous bars are cleared
Namespace types: log
Parameters:
this (log)
ec (int) : Error/Code to be assigned.
m1 (string) : Message needed to be logged to Q1, or for console.
m2 (string) : Message needed to be logged to Q2. Not used/ignored when in console mode
m3 (string) : Message needed to be logged to Q3. Not used/ignored when in console mode
m4 (string) : Message needed to be logged to Q4. Not used/ignored when in console mode
m5 (string) : Message needed to be logged to Q5. Not used/ignored when in console mode
m6 (string) : Message needed to be logged to Q6. Not used/ignored when in console mode
tv (int) : Time to be used. Default value is time, which logs the start time of bar.
page (bool) : Whether to log the message or not. Default is true.
method turnPage(this, turn)
Set the messages to be on a new page, clearing messages from previous page.
This is not dependent on PageHisotry option, as this method simply just clears all the messages, like turning old pages to a new page.
Namespace types: log
Parameters:
this (log)
turn (bool)
method show(this, position, hhalign, hvalign, hsize, thalign, tvalign, tsize, show, attach)
Display Message Q, Index Q, Time Q, and Log Levels
All options for postion/alignment accept TV values, such as position.bottom_right, text.align_left, size.auto etc.
Namespace types: log
Parameters:
this (log)
position (string) : Position of the table used for displaying the messages. Default is Bottom Right.
hhalign (string) : Horizontal alignment of Header columns
hvalign (string) : Vertical alignment of Header columns
hsize (string) : Size of Header text Options
thalign (string) : Horizontal alignment of all messages
tvalign (string) : Vertical alignment of all messages
tsize (string) : Size of text across the table
show (bool) : Whether to display the logs or not. Default is true.
attach (log) : Console that has been attached via attach method. If na then console will not be shown
method attach(this, attach, position)
Attaches a console to Logx, or moves already attached console around Logx
All options for position/alignment accept TV values, such as position.bottom_right, text.align_left, size.auto etc.
Namespace types: log
Parameters:
this (log)
attach (log) : Console object that has been previously attached.
position (string) : Position of Console in relation to Logx. Can be Top, Right, Bottom, Left. Default is Bottom. If unknown specified then defaults to bottom.
method detach(this, attach)
Detaches the attached console from Logx.
All options for position/alignment accept TV values, such as position.bottom_right, text.align_left, size.auto etc.
Namespace types: log
Parameters:
this (log)
attach (log) : Console object that has been previously attached.

Weis V5 zigzag jayySomehow, I deleted version 5 of the zigzag script. Same name. I have added some older notes describing how the Weis Wave works.
I have also changed the date restriction that stopped the script from working after Dec 31, 2022.
What you see here is the Weis zigzag wave plotted directly on the price chart. This script is the companion to the Weis cumulative wave volume script.
What is a Weis wave? David Weis has been recognized as a Wyckoff method analyst he has written two books one of which, Trades About to Happen, describes the evolution of the now-popular Weis wave. The method employed by Weis is to identify waves of price action and to compare the strength of the waves on characteristics of wave strength. Chief among the characteristics of strength is the cumulative volume of the wave. There are other markers that Weis uses as well for example how the actual price difference between the start of the Weis wave from start to finish. Weis also uses time, particularly when using a Renko chart
David Weis did a futures io video which is a popular source of information about his method. (Search David Weis and futures.io. I strongly suggest you also read “Trades About to Happen” by David Weis.
This will get you up and running more quickly when studying charts. However, you should choose the Traditional method to be true to David Weis technique as described in his book "Trades About to Happen" and in the Futures IO Webcast featuring David Weis
. The Weis pip zigzag wave shows how far in terms of bar close price a Weis wave has traveled through the duration of a Weis wave. The Weis zigzag wave is used in combination with the Weis cumulative volume wave. The two waves should be set to the same "wave size".
To use this script, you must set the wave size: Using the traditional Weis method simply enter the desired wave size in the box "How should wave size be calculated", in this example I am using a traditional wave size of .25. Each wave for each security and each timeframe requires its own wave size. Although not the traditional method devised by David Weis a more automatic way to set wave size would be to use Average True Range (ATR). Using ATR is not the true Weis method but it does give you similar waves and, importantly, without the hassle described above. Once the Weis wave size is set then the zigzag wave will be shown with volume. Because Weis used the closing price of a wave to define waves a line Bar highs and bar lows are not captured by the Weis Wave. The default script setting is now cumulative volume waves using an ATR of 7 and a multiplication factor of .5.
To display volume in a way that does not crowd out neighbouring volumes Weis displayed volume as a maximum of 3 digits (usually). Consider two Weis Wave volumes 176,895,570 and 2,654,763,889. To display wave volume as three digits it is necessary to take a number such as 176,895,570 and truncate it. 176,895,570 can be represented as 177 X 10 to the power of 6. The number displayed must also be relative to other numbers in the field. If the highest volume on the page is: 2,654,763,889 and with only three numbers available to display the result the value shown must be 265 (265 X 10 to the power of 7). Since 176,895,570 is an order of magnitude smaller than 2,654,763,889 therefore 175,895,570 must be shown as 18 instead of 177. In this way, the relative magnitudes of the two volumes can be understood. All numbers in the field of view must be truncated by the same order of magnitude to make the relative volumes understandable. The script attempts to calculate the order of magnitude value automatically. If you see a red number in the field of view it means the script has failed to do the calculation automatically and you should use the manual method – use the dialogue box “Calculate truncated wave value automatically or manually”. Scroll down from the automatic method and select manual. Once "manual" is selected the values displayed become the power values or multipliers for each wave.
Using the manual method you will select a “Multiplier” in the next dialogue box. Scan the field and select the largest value in the field of view (visible chart) is the multiplier of interest. If you select a lower number than the maximum value will see at least one red “up”. If you are too high you will see at least one red “down”. Scroll in the direction recommended or the values on the screen will be totally incorrect. With volume truncated to the highest order values, the eye can quickly get a feel for relative volumes. It also reduces the crowding and overlapping of values on the screen. You can opt to show the full volume to help get a sense of the magnitude of the true volumes.
How does the script determine if a Weis wave is continuing to grow or not?
The script evaluates the closing price of each new bar relative to the "Weis wave size". Suppose the current bar closes at a new low close, within the current down wave, at $30.00. If the Weis wave size is $0.10 then the algorithm will remember the $30.00 close and compare it to the close of the next bar. If the bar close price does not close equal to or lower than $30.00 or close equal to or higher than $30.10 then the wave is still a down wave with a current low of $30.00. This is true even if the bar low is less than $30.00 or the bar high is greater than 30.10 – only the bar’s closing price matters. If a bar's closing price climbs back up to a close of $30.11 then because the closing price has moved more than $0.10 (the Weis wave size) then that is a wave reversal with a new up-trending wave. In the above example if there was currently a downward trending wave and the bar closes were as follows $30.00, $30.09, $30.01, $30.05, $30.10 The wave direction would continue to stay downward trending until the close of $30.10 was achieved. As such $30.00 would be the low and the following closes $30.09, $30.01, $30.05 would be allocated to the new upward-trending wave. If however There was a series of bar closes like this $30.00, $30.09, $30.01, $30.05, $29.99 since none of the closes was equal to above the 10-cent reversal target of $30.10 but instead, a new Weis wave low was achieved ($29.99). As such the closes of $30.09, $30.01, $30.05 would all be attributed to the continued down-trending wave with a current low of $29.99, even though the closing price for the interim bars was above $30.00. Now that the Weis Wave low is now 429.99 then, in order to reverse this continued downtrend price will need to close at or above $30.09 on subsequent bar closes assuming now new low bar close is achieved. With large wave sizes, wave direction can be in limbo for many bars before a close either renews wave direction or reverses it and confirms wave direction as either a reversal or a continuation. On the zig-zag, a wave line and its volume will not be "printed" until a wave reversal is confirmed.
The wave attribution is similar when using other methods to define wave size. If ATR is used for wave size instead of a traditional wave constant size such as $0.10 or $2 or 2000 pips or ... then the wave size is calculated based on current ATR instead of the Weis wave constant (Traditional selected value).
I have the option to display pseudo-Ord volume. In truth, Ord used more traditional zig-zag pivots of bar highs and lows. Waves using closes as pivots can have some significant differences. This difference can be lessened by using smaller time frames and larger wave sizes.
There are other options such to display the delta price or pip size of a Weis Wave, the number of bars in a wave, and a few other options.

Candlestick Pattern Criteria and Analysis Indicator█ OVERVIEW
Define, then locate the presence of a candle that fits a specific criteria. Run a basic calculation on what happens after such a candle occurs.
Here, I’m not giving you an edge, but I’m giving you a clear way to find one.
IMPORTANT NOTE: PLEASE READ:
THE INDICATOR WILL ALWAYS INITIALLY LOAD WITH A RUNTIME ERROR. WHEN INITIALLY LOADED THERE NO CRITERIA SELECTED.
If you do not select a criteria or run a search for a criteria that doesn’t exist, you will get a runtime error. If you want to force the chart to load anyway, enable the debug panel at the bottom of the settings menu.
Who this is for:
- People who want to engage in TradingView for tedious and challenging data analysis related to candlestick measurement and occurrence rate and signal bar relationships with subsequent bars. People who don’t know but want to figure out what a strong bullish bar or a strong bearish bar is.
Who this is not for:
- People who want to be told by an indicator what is good or bad or buy or sell. Also, not for people that don’t have any clear idea on what they think is a strong bullish bar or a strong bearish bar and aren’t willing to put in the work.
Recommendation: Use on the candle resolution that accurately reflects your typical holding period. If you typically hold a trade for 3 weeks, use 3W candles. If you hold a trade for 3 minutes, use 3m candles.
Tldr; Read the tool tips and everything above this line. Let me know any issues that arise or questions you have.
█ CONCEPTS
Many trading styles indicate that a certain candle construct implies a bearish or bullish future for price. That said, it is also common to add to that idea that the context matters. Of course, this is how you end up with all manner of candlestick patterns accounting for thousands of pages of literature. No matter the context though, we can distill a discretionary trader's decision to take a trade based on one very basic premise: “A trader decides to take a trade on the basis of the rightmost candle's construction and what he/she believes that candle construct implies about the future price.” This indicator vets that trader’s theory in the most basic way possible. It finds the instances of any candle construction and takes a look at what happens on the next bar. This current bar is our “Signal Bar.”
█ GUIDE
I said that we vet the theory in the most basic way possible. But, in truth, this indicator is very complex as a result of there being thousands of ways to define a ‘strong’ candle. And you get to define things on a very granular level with this indicator.
Features:
1. Candle Highlighting
When the user’s criteria is met, the candle is highlighted on the chart.
The following candle is highlighted based on whether it breaks out, breaks down, or is an inside bar.
2. User-Defined Criteria
Criteria that you define include:
Candle Type: Bull bars, Bear bars, or both
Candle Attributes
Average Size based on Standard Deviation or Average of all potential bars in price history
Search within a specific price range
Search within a specific time range
Clarify time range using defined sessions and with or without weekends
3. Strike Lines on Candle
Often you want to know how price reacts when it gets back to a certain candle. Also it might be true that candle types cluster in a price region. This can be identified visually by adding lines that extend right on candles that fit the criteria.
4. User-Defined Context
Labeled “Alternative Criteria,” this facet of the script allows the user to take the context provided from another indicator and import it into the indicator to use as a overriding criteria. To account for the fact that the external indicator must be imported as a float value, true (criteria of external indicator is met) must be imported as 1 and false (criteria of external indicator is not met) as 0. Basically a binary Boolean. This can be used to create context, such as in the case of a traditional fractal, or can be used to pair with other signals.
If you know how to code in Pinescript, you can save a copy and simply add your own code to the section indicated in the code and set your bull and bear variables accordingly and the code should compile just fine with no further editing needed.
Included with the script to maximize out-of-the-box functionality, there is preloaded as alternative criteria a code snippet. The criteria is met on the bull side when the current candle close breaks out above the prior candle high. The bear criteria is met when the close breaks below the prior candle. When Alternate Criteria is run by itself, this is the only criteria set and bars are highlighted when it is true. You can qualify these candles by adding additional attributes that you think would fit well.
Using Alternative Criteria, you are essentially setting a filter for the rest of the criteria.
5. Extensive Read Out in the Data Window (right side bar pop out window).
As you can see in the thumbnail, there is pasted a copy of the Data Window Dialogue. I am doubtful I can get the thumbnail to load up perfectly aligned. Its hard to get all these data points in here. It may be better suited for a table at this point. Let me know what you think.
The primary, but not exclusive, purpose of what is in the Data Window is to talk about how often your criteria happens and what happens on the next bar. There are a lot of pieces to this.
Red = Values pertaining to the size of the current bar only
Blue = Values pertaining or related to the total number of signals
Green = Values pertaining to the signal bars themselves, including their measurements
Purple = Values pertaining to bullish bars that happen after the signal bar
Fuchsia = Values pertaining to bearish bars that happen after the signal bar
Lime = Last four rows which are your percentage occurrence vs total signals percentages
The best way I can explain how to understand parts you don’t understand otherwise in the data window is search the title of the row in the code using ‘ctrl+f’ and look at it and see if it makes more sense.
█ [b}Available Candle Attributes
Candle attributes can be used in any combination. They include:
[*}Bodies
[*}High/Low Range
[*}Upper Wick
[*}Lower Wick
[*}Average Size
[*}Alternative Criteria
Criteria will evaluate each attribute independently. If none is set for a particular attribute it is bypassed.
Criteria Quantity can be in Ticks, Points, or Percentage. For percentage keep in mind if using anything involving the candle range will not work well with percentage.
Criteria Operators are “Greater Than,” “Less Than,” and “Threshold.” Threshold means within a range of two numbers.
█ Problems with this methodology and opportunities for future development:
#1 This kind of work is hard.
If you know what you’re doing you might be able to find success changing out the inputs for loops and logging results in arrays or matrices, but to manually go through and test various criteria is a lot of work. However, it is rewarding. At the time of publication in early Oct 2022, you will quickly find that you get MUCH more follow through on bear bars than bull bars. That should be obvious because we’re in the middle of a bear market, but you can still work with the parameters and contextual inputs to determine what maximizes your probability. I’ve found configurations that yield 70% probability across the full series of bars. That’s an edge. That means that 70% of the time, when this criteria is met, the next bar puts you in profit.
#2 The script is VERY heavy.
Takes an eternity to load. But, give it a break, it’s doing a heck of a lot! There is 10 unique arrays in here and a loop that is a bit heavy but gives us the debug window.
#3 If you don’t have a clear idea its hard to know where to start.
There are a lot of levers to pull on in this script. Knowing which ones are useful and meaningful is very challenging. Combine that with long load times… its not great.
#4 Your brain is the only thing that can optimize your results because the criteria come from your mind.
Machine learning would be much more useful here, but for now, you are the machine. Learn.
#5 You can’t save your settings.
So, when you find a good combo, you’ll have to write it down elsewhere for future reference. It would be nice if we could save templates on custom indicators like we can on some of the built in drawing tools, but I’ve had no success in that. So, I recommend screenshotting your settings and saving them in Notion.so or some other solid record keeping database. Then you can go back and retrieve those settings.
#6 no way to export these results into conditions that can be copy/pasted into another script.
Copy/Paste of labels or tables would be the best feature ever at this point. Because you could take the criteria and put it in a label, copy it and drop it into another strategy script or something. But… men can dream.
█ Opportunities to PineCoders Learn:
1. In this script I’m importing libraries, showing some of my libraries functionality. Hopefully that gives you some ideas on how to use them too.
The price displacement library (which I love!)
Creative and conventional ways of using debug()
how to display arrays and matrices on charts
I didn’t call in the library that holds the backtesting function. But, also demonstrating, you can always pull the library up and just copy/paste the function out of there and into your script. That’s fine to do a lot of the time.
2. I am using REALLY complicated logic in this script (at least for me). I included extensive descriptions of this ? : logic in the text of the script. I also did my best to bracket () my logic groups to demonstrate how they fit together, both for you and my future self.
3. The breakout, built-in, “alternative criteria” is actually a small bit of genius built in there if you want to take the time to understand that block of code and think about some of the larger implications of the method deployed.
As always, a big thank you to TradingView and the Pinescript community, the Pinescript pros who have mentored me, and all of you who I am privileged to help in their Pinescripting journey.
"Those who stay will become champions" - Bo Schembechler

Impactful pattern and candles pattern AlertThe Alertion indicator!
impactful pattern:
pattern that happen near the zone or in the zone at lower timeframe and give us entry and stop limit price.
It is helpful for price action traders and those who want to decrease their risk.
There are 3 IP patterns:
Quasimodo
Head and shoulder
whipsaw engulfing
These patterns may occur near the zone or may not occur but by them, you can decrease your trading risk for example you can
trade with half lot before IP pattern and enter with other half after pattern.
how to use?
for example:
you find zone at 1h timeframe for short position
when price enter to your zone
you run this indicator and choose your lower timeframe, for example 15m and click on short position.
Then make the alert by right-click on your chart and choose the add alert and at condition box choose the impactful pattern and then click on create
now wait for message :)
Candles pattern:
like reversal bar, key reversal bar, exhaustion bar, pin bar, two-bar reversal, tree-bar reversal, inside bar, outside bar
these occur when the trend turn, so it is usable when the price enter to your zone or near your zone.
This pattern can decrease your risk.
Inside bar and outside bar:
if this pattern engulf up, it is bullish pattern and if engulf down, it is bearish pattern.
what does this indicator do?
this indicator is for making alert
it helps you to decrease your risk and failure.
You optimize it to alert you when IP pattern happen or candle pattern happen or inside bar or outside bar engulfing or all of them.
For IP pattern, it will message you entry and stop limit price.
It works at 2 different timeframes, so you can make alert for example in 1h TF for candles pattern and 15m TF for IP pattern.
Indicator will alert you for candles pattern at your chart timeframe and for IP pattern at timeframe you've chosen when you run the indicator, and it is changeable
in setting.
setting options
TIMEFRAME
IP: select the timeframe for IP patterns it means when IP pattern happen at that timeframe the indicator will alert you
example = your TF is 1h, you found the supply zone and want to trade, note that IP pattern happen in lower TF, so you select 15m TF or TF lower than 1h.
Short position: select it if you want to make short position.
BUFFERING
indicator send you entry and stop limit price
you can change it by amount of percent
it is your strategy to change your entry and stop loss or not
example= in head and shoulder pattern at short position, the stop limit is high price of head in pattern
so the indicator will message you the exact price but if you want to put
your stop limit 5 percent upper than exact price you can enter 5 in front of stop loss
or you want to enter 5 percent lower than exact high price of shoulder, you can optimize it.
ALERTION
you choose what alert you want
IP alert or candle alert or inside and outside bar alert
type your text for alert
you can write additional text for your message
ADVANCE
IP alert frequency option:
1. Once per bar : indicator will alert you for IP pattern once at your chat timeframe bar, and you should wait til next bar for next alert.
2. Once per bar close : alert you when your chart timeframe bar closed and next alert will happen when next bar is closed.
3. All: alert you all the times IP pattern happen
pivot left and right bars: lower will find smaller pattern
at the END:
this indicator is not strategy
it is part of your strategy that help you to increase your winning rate.
It is helpful for scalping and candle patterns finding.
After you make an alert, you can delete the indicator or change your timeframe or make another alert, your previous alert won’t change.
Thank you all.

Real Woodies CCIAs always, this is not financial advice and use at your own risk. Trading is risky and can cost you significant sums of money if you are not careful. Make sure you always have a proper entry and exit plan that includes defining your risk before you enter a trade.
Ken Wood is a semi-famous trader that grew in popularity in the 1990s and early 2000s due to the establishment of one of the earliest trading forums online. This forum grew into "Woodie's CCI Club" due to Wood's love of his modified Commodity Channel Index (CCI) that he used extensively. From what I can tell, the website is still active and still follows the same core principles it did in the early days, the CCI is used for entries, range bars are used to help trader's cut down on the noise, and the optional addition of Woodie's Pivot Points can be used as further confirmation of support and resistance. This is my take on his famous "Woodie's CCI" that has become standard on many charting packages through the years, including a TradingView sponsored version as one of the many stock indicators provided by TradingView. Woodie has updated his CCI through the years to include several very cool additions outside of the standard CCI. I will have to say, I am a bit biased, but I think this is hands down one of the best indicators I have ever used, and I am far too young to have been part of the original CCI Club. Being a daytrader primarily, this fits right in my timeframe wheel house. Woodie designed this indicator to work on a day-trading time scale and he frequently uses this to trade futures and commodity contracts on the 30 minute, often even down to the one minute timeframe. This makes it unique in that it is probably one of the only daytrading-designed indicators out there that I am aware of that was not a popular indicator, like the MACD or RSI, that was just adopted by daytraders.
The CCI was originally created by Donald Lambert in 1980. Over time, it has become an extremely popular house-hold indicator, like the Stochastics, RSI, or MACD. However, like the RSI and Stochastics, there are extensive debates on how the CCI is actually meant to be used. Some trade it like a reversal indicator, where values greater than 100 or less than -100 are considered overbought or oversold, respectively. Others trade it like a typical zero-line cross indicator, where once the value goes above or below the zero-line, a trade should be considered in that direction. Lastly, some treat it as strictly a momentum indicator, where values greater than 100 or less than -100 are seen as strong momentum moves and when these values are reached, a new strong trend is establishing in the direction of the move. The CCI itself is nothing fancy, it just visualizes the distance of the closing price away from a user-defined SMA value and plots it as a line. However, Woodie's CCI takes this simple concept and adds to it with an indicator with 5 pieces to it designed to help the trader enter into the highest probability setups. Bear with me, it initially looks super complicated, but I promise it is pretty straight-forward and a fun indicator to use.
1) The CCI Histogram. This is your standard CCI value that you would find on the normal CCI. Woodie's CCI uses a value of 14 for most trades and a value of 20 when the timeframe is equal to or greater than 30minutes. I personally use this as a 20-period CCI on all time frames, simply for the fact that the 20 SMA is a very popular moving average and I want to know what the crowd is doing. This is your coloured histogram with 4 colours. A gray colouring is for any bars above or below the zero line for 1-4 bars. A yellow bar is a "trend bar", where the long period CCI has been above/below the zero line for 5 consecutive bars, indicating that a trend in the current direction has been established. Blue bars above and red bars below are simply 6+n number of bars above or below the zero line confirming trend. These are used for the Zero-Line Reject Trade (explained below). The CCI Histogram has a matching long-period CCI line that is painted the same colour as the histogram, it is the same thing but is used just to outline the Histogram a bit better.
2) The CCI Turbo line. This is a sped-up 6 period CCI. This is to be used for the Zero-Line Reject trades, trendline breaks, and to identify shorter term overbought/oversold conditions against the main trend. This is coloured as the white line.
3) The Least Squares Moving Average Baseline (LSMA) Zero Line. You will notice that the Zero Line of the indicator is either green or red. This is based on when price is above or below the 25-period LSMA on the chart. The LSMA is a 25 period linear regression moving average and is one of the best moving averages out there because it is more immune to noise than a typical MA. Statistically, an LSMA is designed to find the line of best fit across the lookback periods and identify whether price is advancing, declining, or flat, without the whipsaw that other MAs can be privy to. The zero line of the indicator will turn green when the close candle is over the LSMA or red when it is below the LSMA. This is meant to be a confirmation tool only and the CCI Histogram and Turbo Histogram can cross this zero line without any corresponding change in the colour of the zero line on that immediate candle.
4) The +100 and -100 lines are used in two ways. First, they can be used by the CCI Histogram and CCI Turbo as a sort of minor price resistance and if the CCI values cannot get through these, it is considered weakness in that trade direction until they do so. You will notice that both of these lines are multi-coloured. They have been plotted with the ChopZone Indicator, another TradingView built-in indicator. The ChopZone is a trend identification tool that uses the slope and the direction of a 34-period EMA to identify when price is trending or range bound. While there are ~10 different colours, the main two a trader needs to pay attention to are the turquoise/cyan blue, which indicates price is in an uptrend, and dark red, which indicates price is in a downtrend based on the slope and direction of the 34 EMA. All other colours indicate "chop". These colours are used solely for the Zero-Line Reject and pattern trades discussed below. They are plotted both above and below so you can easily see the colouring no matter what side of the zero line the CCI is on.
5) The +200 and -200 lines are also used in two ways. First, they are considered overbought/oversold levels where if price exceeds these lines then it has moved an extreme amount away from the average and is likely to experience a pullback shortly. This is more useful for the CCI Histogram than the Turbo CCI, in all honesty. You will also notice that these are coloured either red, green, or yellow. This is the Sidewinder indicator portion. The documentation on this is extremely sparse, only pointing to a "relationship between the LSMA and the 34 EMA" (see here: tlc.thinkorswim.com). Since I am not a member of Woodie's CCI Club and never intend to be I took some liberty here and decided that the most likely relationship here was the slope of both moving averages. Therefore, the Sidewinder will be green when both the LSMA and the 34 EMA are rising, red when both are falling, and yellow when they are not in agreement with one another (i.e. one rising/flat while the other is flat/falling). I am a big fan of Dr. Alexander Elder as those who follow me know, so consider this like Woodie's version of the Elder Impulse System. I will fully admit that this version of the Sidewinder is a guess and may not represent the real Sidewinder indicator, but it is next to impossible to find any information on this, so I apologize, but my version does do something useful anyways. This is also to be used only with the Zero-Line Reject trades. They are plotted both above and below so you can easily see the colouring no matter what side of the zero line the CCI is on.
How to Trade It According to Woodie's CCI Club:
Now that I have all of my components and history out of the way, this is what you all care about. I will only provide a brief overview of the trades in this system, but there are quite a few more detailed descriptions listed in the Woodie's CCI Club pamphlet. I have had little success trading the "patterns" but they do exist and do work on occasion. I just prefer to trade with the flow of the markets rather than getting overly scalpy. If you are interested in these patterns, see the pamphlet here (www.trading-attitude.com), hop into the forums and see for yourself, or check out a couple of the YouTube videos.
1) Zero line cross. As simple as any other momentum oscillator out there. When the long period CCI crosses above or below the zero line open a trade in that direction. Extra confirmation can be had when the CCI Turbo has already broken the +100/-100 line "resistance or support". Trend traders may wish to wait until the yellow "trend confirmation bar" has been printed.
2) Zero Line Reject. This is when the CCI Turbo heads back down to the zero line and then bounces back in the same direction of the prevailing trend. These are fantastic continuation trades if you missed the initial entry either on the zero line cross or on the trend bar establishment. ZLR trades are only viable when you have the ChopZone indicator showing a trend (turquoise/cyan for uptrend, dark red for downtrend), the LSMA line is green for an uptrend or red for a downtrend, and the SideWinder is either green confirming the uptrend or red confirming the downtrend.
3) Hook From Extreme. This is the exact same as the Zero Line Reject trade, however, the CCI Turbo now goes to the +100/-100 line (whichever is opposite the currently established trend) and then hooks back into the established trend direction. Ideally the HFE trade needs to have the Long CCI Histogram above/below the corresponding 100 level and the CCI Turbo both breaks the 100 level on the trend side and when it does break it has increased ~20 points from the previous value (i.e. CCI Histogram = +150 with LSMA, CZ, and SW all matching up and trend bars printed on CCI Histogram, CCI Turbo went to -120 and bounced to +80 on last 2 bars, current bar closes with CCI Turbo closing at +110).
4) Trend Line Break. Either the CCI Turbo or CCI Histogram, whichever you prefer (I find the Turbo a bit more accurate since its a faster value) creates a series of higher highs/lows you can draw a trend line linking them. When the line breaks the trendline that is your signal to take a counter trade position. For example, if the CCI Turbo is making consistently higher lows and then breaks the trendline through the zero line, you can then go short. This is a good continuation trade.
5) The Tony Trade. Consider this like a combination zero line reject, trend line break, and weak zero line cross all in one. The idea is that the SW, CZ, and LSMA values are all established in one direction. The CCI Histogram should be in an established trend and then cross the zero line but never break the 100 level on the new side as long as it has not printed more than 9 bars on the new side. If the CCI Histogram prints 9 or less bars on the new side and then breaks the trendline and crosses back to the original trend side, that is your signal to take a reversal trade. This is best used in the Elder Triple Screen method (discussed in final section) as a failed dip or rip.
6) The GB100 Trade. This is a similar trade as the Tony Trade, however, the CCI Histogram can break the 100 level on the new side but has to have made less than 6 bars on the new side. A trendline break is not necessary here either, it is more of a "pop and drop" or "momentum failure" trade trying in the new direction.
7) The Famir Trade. This is a failed CCI Long Histogram ZLR trade and is quite complicated. I have never traded this but it is in the pamphlet. Essentially you have a typical ZLR reject (i.e. all components saying it is likely a long/short continuation trade), but the ZLR only stays around the 50 level, goes back to the trend side, fails there as well immediately after 1 bar and then rebreaks to the new side. This is important to be considered with the LSMA value matching the side of the trade, so if the Famir says to go long, you need the LSMA indicator to also say to go long.
8) The Vegas Trade. This is essentially a trend-reversal trade that takes into account the LSMA and a cup and handle formation on the CCI Long Histogram after it has reached an extreme value (+200/-200). You will see the CCI Histogram hit the extreme value, head towards the zero line, and then sort of round out back in the direction of the extreme price. The low point where it reversed back in the direction of the extreme can be considered support or resistance on the CCI and once the CCI Long Histogram breaks this level again, with LSMA confirmation, you can take a counter trend trade with a stop under/over the highest/lowest point of the last 2 bars as you want to be out quickly if you are wrong without much damage but can get a huge win if you are right and add later to the position once a new trade has formed.
9) The Ghost Trade. This is nothing more than a(n) (inverse) head and shoulders pattern created on the CCI. Draw a trend line connecting the head and shoulders and trade a reversal trade once the CCI Long Histogram breaks the trend line. Same deal as the Vegas Trade, stop over/under the most recent 2 bar high/low and add later if it is a winner but cut quickly if it is a loser.
Like I said, this is a complicated system and could quite literally take years to master if you wanted to go into the patterns and master them. I prefer to trade it in a much simpler format, using the Elder Triple Screen System. First, since I am a day trader, I look to use the 20 period Woodie's on the hourly and look at the CZ, SW, and LSMA values to make sure they all match the direction of the CCI Long Histogram (a trend establishment is not necessary here). It shows you the hourly trend as your "tide". I then drill down to the 15 minute time frame and use the Turbo CCI break in the opposite direction of the trend as my "wave" and to indicate when there is a dip or rip against the main trend. Lastly, I drill down to a 3 minute time frame and enter when the CCI Long Histogram turns back to match the main trend ("ripple") as long as the CCI Turbo has broken the 100 level in the matched direction.
Enjoy, and please read the pamphlet if you have any questions about the patterns as they are not how I use these and will not be able to answer those questions.

tunnel trading betaThe original author of the tunnel trading system: youtuber:Teacher Jin
This is a set of indicators system that trades completely based on the moving average. It belongs to the right trading. The idea is as follows:
(1) Basic trend (major trend)
When the short-term moving average is higher than the long-term moving average, it is an upward trend; otherwise, it is a downward trend.
The tentative short-term moving average is ema12, and the long-term moving average is ema169.
(2) The first type of buying point (or short point): trend establishment
Starting from the bar where the uptrend is established, the first outgoing bar is the first buying point. (Outgoing means that the closing price is higher than the opening price and higher than the high point of the previous bar)
Starting from the bar where the downtrend is established, the first bar to fall is the first shorting point. (Fall means that the closing price is lower than the opening price and lower than the low point of the previous bar)
(3) The second type of buying point (or short point): the buying point when pulling back (or the short point when rebounding)
The buying point at the time of pullback (callback) means that the general trend is up, but the small trend is down. You can buy when it is clear that the down trend is over.
Two concepts need to be defined here: "pullback (callback)" and "end of down trend". The definition of pullback is that when the general trend is rising, bar falls below the long-term moving average, and at this time the short-term moving average is still higher than the long-term moving average; The definition of the end of a down trend is that it is outgoing and ema12 is on the rise.
In the same way, we can know what is the "short point when rebounding":
The big trend is down, but the small trend is up. When it is clear that the rise is over, you can go short.
(4) Setting of Stop Loss and Take Profit
When going long:
Stop Loss Price: The low point of a bar before the buying point.
Stop-profit price: After the stop-loss price is determined, the profit-loss ratio is 3:1 to determine the stop-profit price. (The default value is 3, the user can modify it)
When shorting:
Stop Loss Price: The high point of a bar before the purchase point.
Stop-profit price: After the stop-loss price is determined, the profit-loss ratio is 3:1 to determine the stop-profit level. (The default value is 3, the user can modify it)
Chinese introduction:
隧道交易体系的原作者:油管金老师看盘室
这是一套完全根据均线进行交易的指标体系,属于右侧交易,思路如下:
(1) 基本趋势(大趋势)
短期均线高于长期均线时,是上涨趋势;反之,是下降趋势。
暂定短期均线为ema12,长期均线为ema169。
(2) 第一种买入点(或做空点):趋势确立
从上涨趋势确立的那根bar开始,第一个出头的bar,是第一买入点。(出头,是指收盘价高于开盘价,且高于前一根bar的高点)
从下降趋势确立的那根bar开始,第一个落尾的bar,是第一做空点。(落尾,是指收盘价低于开盘价,且低于前一根bar的低点)
(3) 第二种买入点(或做空点):拉回时的买入点(或反弹时的做空点)
拉回时(回调时)的买入点,是指大趋势是上涨,但小趋势是下跌,当明确下跌结束时,可以买入。
这里需要定义2个概念:“拉回(回调)”和“下跌结束”。拉回的定义是,大趋势是上涨时,bar跌破长期均线,此时短期均线仍高于长期均线;下跌结束的定义是,出头且ema12在上升。
同理可知什么是“反弹时的做空点”:
大趋势是下跌,但小趋势是上涨,当明确上涨结束时,可以做空。
(4) 止损位和止盈位的设置
做多时:
止损位:买入点前一根bar的低点。
止盈位:止损位确定后,按盈亏比3:1确定止盈位。(默认值为3,用户可以修改)
做空时:
止损位:买入点前一根bar的高点。
止盈位:止损位确定后,按盈亏比3:1确定止盈位。(默认值为3,用户可以修改)

MAFIA CANDLESMafia Candles is a Exhaustion bar count and candle count indicator, Using the Leledc Candles and 1-3 counting candle play gives you a pretty good idea where a so called "top" will be or a so called "bottom" will be!
In this example, getting the transparent round circles ( either lime or red ) would mean that the move will be a good size move!
EXAMPLE=1 You see a down trend and then the Mafia Candles Flashes a Green Dot on the forming new red candle. This is where in theory you might want to consider going long on the market!
EXAMPLE=2 If you see a RED $ symbol, after a uptrend, this means in theory, there might be room for a short play or room for a small pullback in the price!
THE CIRCLES(RED OR LIME COLORED) ARE INDICATING BIGGER MOVES!
THE $ SYMBOLS (RED OR LIME COLORED) ARE INDICATING SMALLER PULLBACKS OR SMALLER PUMPS IN PRICE!
RED IS CONSIDERED TO BE A SELL!
LIME COLOR IS CONSIDERED TO BE A BUY!
AS MUCH IS BASED OF THE 1-3 CANDLE COUNT AND THE LEDLEC CANDLE DEVIATION STRATEGY, LET ME EXPLAIN THE THEORY ON BOTH THE 1-3 CANDLE COUNT AND THE LELEDC STRATEGY I COMBINE TO BRING YOU THIS ADDITION OF THE INDICATOR....
LELEDC THEORY USAGE...
An Exhaustion Bar is a bar which signals
the exhaustion of the trend in the current direction. In other words an
exhaustion bar is “A bar of last seller” in case of a downtrend and “A bar of
last buyer”in case of an uptrend.
Having said that when a party cannot take the price further in their direction,naturally the other party comes in , takes charge and reverses the direction of the trend.
TO EASIER UNDERSTAND I GIVE YOU A EASY EXAMPLE OF WHAT AN LELEDC EXHAUSTION BAR IS...
1. A wide range bar ( a bar with
long body!!!).
2. A long wick at the bottom of
the bar and no or negligible wick at the top of the bar in case of “Bear exhaustion bar” and
a long wick at the top and no or
negligible wick at the bottom of the bar in case of
“Bull exhuation bar”!!!
3. Extreme volume and.....
4. Bar forming at a key support or resistance
area including a Round Number (RN) and Big Round Number ( BRN ).THE PSYCHOLOGY BEHIND THIS!!!
Now let's assume that we have a group
of people,say 100 people who decides to go for a casual running. After running for few KM's few of
them will say “I am exhausted. I cannot run further”. They will quit running.
After running further, another bunch of runners will say “I am exhausted. I can’t run
further” and they also will quit running.
This goes on and on and then there will be a stage where only few will be left in the running. Now a stage will come where the last person left in the running will say “I
am exhausted” and he stops running. That means no one is left now in the
running.This means all are exhausted in the running.
The same way an exhaustion bar works and if we can figure out that
exhaustion bar with all the tools available on hand, we will be in a big trade
for sure!!.The reason is an exhaustion bar is formed at exact tops and bottoms most of the times.In forex with wide variety of pairs available at the counter ,one can trade this technique to make lifetime gains.
NOW LET ME EXPLAIN THE 1-3 CANDLE CORRECTION COUNT THEORY WHICH IS USED TO GET THE SUM UP SIGNALS FROM THIS INDICATOR FROM ITS INPUT LEVELS!!!
1-3 CANDLES....
The 1-3 Candlestick pattern is basically like sequential, aka a candle counting system!
1-3 CANDLE COUNT means you count the number of bullish=green candles or the bearish=red candles!
3 BULL/GREEN CANDLES in a row, each closing its close higher than the previous one before it is the 1-3 candle top count idea!
lets say you get 3 red bear candles, each candle after the first closes its body below the previous red candle before it, then you see 3 red candles with each closing lower bodies lower than the previous candle, THATS A POSSIBLE SIGN OF BEARISH EXHAUSTION, AND YOU MIGHT HAVE SOME BULLS STEP IN TO TAKE THE PRICE UP AFTER THE IMMEDIATE DOWNFALL OF THOSE 3 RED CANDLES!!
PLEASE IF ANYONE HAS QUESTIONS OR NEEDS ANY FURTHER EXPLANATION, DONT HESISITATE TO MESSAGE ME! CHALRES KNIGHT IS THE ORIGINAL AUTHOR OF THE 1-3 CANDLE COUNT AND THE LELEDC EXHAUSTION BAR INDICATOR ON METE-TRADER! R.IP CHARLES F KNIGHT!!! WE LOVE YOU AND MISS YOU BROTHER!
CHARLES KNIGHT PASSED DOWN ALL OF HIS INDICATORS AND SCRIPTS IN ORIGINAL CODE TO MYSELF WHEN HE PASSED AWAY AND I WILL CONTINUE TO HONOR HIS MEMORY BY ENHANCING HIS ORIGINAL SOURCE CODED SCRIPTS TO ENHANCE THE LIFE FOR ALL TRADERS!
CHARLIE LOVED WHEN I WOULD PUT MY OWN SWING ON HIS INDICATORS! HE TAUGHT ME EVERYTHING I KNOW AND I KNOW ONE DAY I WILL SEE HIM AGAIN!
TRADE IN PARADISE CHARLIE!!!
THE BEST TRADER IN THE WORLD!!!

How to avoid repainting when NOT using security()Even when your code does not use security() calls, repainting dynamics still come into play in the realtime bar. Script coders and users must understand them and, if they choose to avoid repainting, need to know how to do so. This script demonstrates three methods to avoid repainting when NOT using the security() function.
Note that repainting dynamics when not using security() usually only come into play in the realtime bar, as historical data is fixed and thus cannot cause repainting, except in situations related to stock splits or dividend adjustments.
For those who don’t want to read
Configure your alerts to trigger “Once Per Bar Close” and you’re done.
For those who want to understand
Put this indicator on a 1 minute or seconds chart with a live symbol. As price changes you will see four of this script’s MAs (all except the two orange ones) move in the realtime bar. You are seeing repainting in action. When the current realtime bar closes and becomes a historical bar, the lines on the historical bars will no longer move, as the bar’s OHLC values are fixed. Note that you may need to refresh your chart to see the correct historical OHLC values, as exchange feeds sometimes produce very slight variations between the end values of the realtime bar and those of the same bar once it becomes a historical bar.
Some traders do not use signals generated by a script but simply want to avoid seeing the lines plotted by their scripts move during the realtime bar. They are concerned with repainting of the lines .
Other traders use their scripts to evaluate conditions, which they use to either plot markers on the chart, trigger alerts, or both. They may not care about the script’s plotted lines repainting, but do not want their markers to appear/disappear on the chart, nor their alerts to trigger for a condition that becomes true during the realtime bar but is no longer true once it closes. Those traders are more concerned with repainting of signals .
For each of the three methods shown in this script’s code, comments explain if its lines, markers and alerts will repaint or not. Through the Settings/Inputs you will be able to control plotting of lines and markers corresponding to each method, as well as experiment with the option, for method 2, of disabling only the lines plotting in the realtime bar while still allowing the markers and alerts to be generated.
An unavoidable fact is that non-repainting lines, markers or alerts are always late compared to repainting ones. The good news is that how late they are will in many cases be insignificant, so that the added reliability of the information they provide will largely offset the disadvantages of waiting.
Method 1 illustrates the usual way of going about things in a script. Its gray lines and markers will always repaint but repainting of the alerts the marker conditions generate can be avoided by configuring alerts to trigger “Once Per Bar Close”. Because this gray marker repaints, you will occasionally see it appear/disappear during the realtime bar when the gray MAs cross/un-cross.
Method 2 plots the same MAs as method 1, but in green. The difference is that it delays its marker condition by one bar to ensure it does not repaint. Its lines will normally repaint but its markers will not, as they pop up after the condition has been confirmed on the bar preceding the realtime bar. Its markers appear at the beginning of the realtime bar and will never disappear. When using this method alerts can be configured to trigger “Once Per Bar” so they fire the moment the marker appears on the chart at the beginning of the realtime bar. Note that the delay incurred between methods 1 and 2 is merely the instant between the close of a realtime bar and the beginning of the next one—a delay measured in milliseconds. Method 2 also allows its lines to be hidden in the realtime bar with the corresponding option in the script’s Settings/Inputs . This will be useful to those wishing to eliminate unreliable lines from the realtime bar. Commented lines in method 2 provide for a 2b option, which is to delay the calculation of the MAs rather than the cross condition. It has the obvious inconvenient of plotting delayed MAs, but may come in handy in some situations.
Method 3 is not the best solution when using MAs because it uses the open of bars rather than their close to calculate the MAs. While this provides a way of avoiding repainting, it is not ideal in the case of MA calcs but may come in handy in other cases. The orange lines and markers of method 3 will not repaint because the value of open cannot change in the realtime bar. Because its markers do not repaint, alerts may be configured using “Once Per Bar”.
Spend some time playing with the different options and looking at how this indicator’s lines plot and behave when you refresh you chart. We hope everything you need to understand and prevent repainting when not using security() is there.
Look first. Then leap.
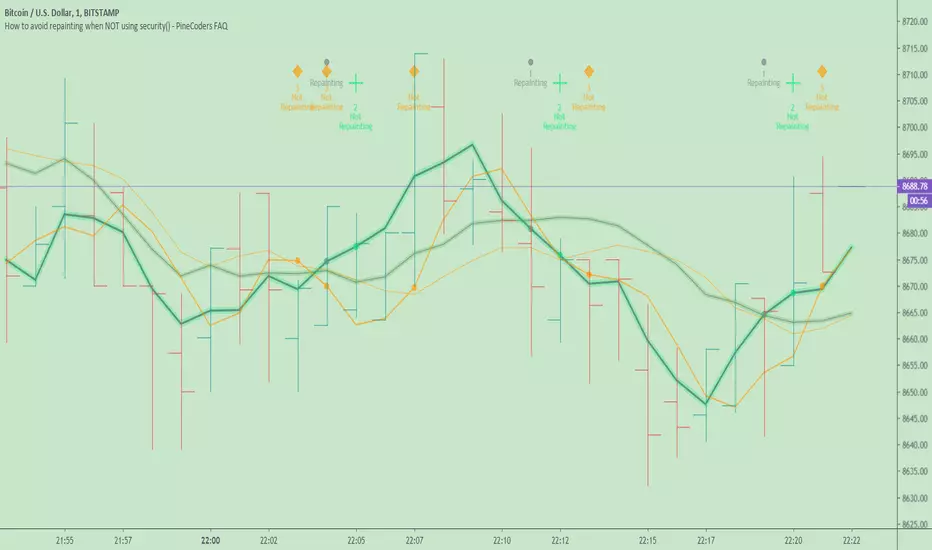
Delta Volume Columns [LucF]Displays delta volume columns using intrabar volume information. Each volume column is divided into three sections: buying, selling and neutral volume. Volume for each section is determined from the volume and price movement of each intrabar at a user-selected lower resolution.
Features include:
- Choice of color themes for either dark or light chart backgrounds
- Delta volume columns
- Volume Balance displayed as the difference between the MAs of buying and selling volume
- Display of divergences between a bar’s volume balance and the bar’s price movement (example: buying volume > selling volume but close < open). Divergences can be shown in 2 different color schemes (including green/red showing a tentative direction), on volume columns and/or on chart bars
- Display of bar by bar volume balance with highlighting of above average volume
- Display of the usual total volume MA
- Choice of the lower resolution used to retrieve intrabar information
- Alerts configurable on any combination of the markers, with control over long/short direction
- Choice of 3 different markers:
1. Double bumps: two consecutive bars where buying or selling volume is in the same direction and where volume > volume MA
2. Divergence confirmations: direction of the price bar following a price/volume balance divergence
3. Volume balance shifts: zero level crossings of the volume balance MA delta
The chart shows the two main modes of display:
- Top pane : shows the stacked volume columns with divergences in orange and the flattened volume balance MAs delta at the bottom of the volume columns. This volume balance is the same shown in the bottom pane. The top pane also shows the instant volume balance strip above the volume columns. The strip’s colors show which of the buying or selling volume was greater, and colors are brighter if the total volume was above the total volume MA.
- Bottom pane : shows the volume balance MAs delta with markers 1 and 2. Given that this graphic has no price momentum component, I find quite eerie how it often looks like a momentum-based signal.
The default 5 minute intrabar resolution is used in combination with the weekly chart, which is excessive.
This script uses a special characteristic of the security() function’s behavior when it is sent to a resolution lower than the chart’s resolution. Details are given in the script’s comments. This method has the advantage of working under more circumstances than some of the other loop-based methods, but it also has its limits.
IMPORTANT
This is what you need to know:
- The method used does not work on the realtime bar—only on historical bars. Consequently, the volume column shown on the realtime bar is a normal volume column plotted in green or red, following price movement. The column will only show delta volume information after it closes and becomes a historical bar.
- The indicator only works on some chart resolutions: 5, 10, 15 and 30 minutes, 1, 2, 4, 6, and 12 hours, 1 day, 1 week and 1 month. The script’s code can be modified to run on other resolutions, but chart resolutions must be divisible by the lower resolution used for intrabars.
- Intrabar resolutions can be selected from 1, 5, 15, 30, 45 minutes, 1, 2, 3, 4 hours, 1 day, 1 week and 1 month. The intrabar resolution must of course be smaller than the chart’s resolution.
- Contrary to my other indicators where alerts must be configured to trigger “Once Per Bar Close” in order to avoid false triggers (or repainting), all this indicator’s alerts are designed to trigger using previous bar information since the indicator’s calculations in the realtime bar are not exact. Markers are not plotted with a negative offset; they appear at the beginning of the realtime bar following confirmation of the marker’s condition on the previous bar. Alerts for this indicator should thus be configured to trigger “Once Per Bar” so they trigger at the beginning of the realtime bar. Note that the penalty is not that great, as it is simply the instant between the close of the previous realtime bar and the opening of the next. The advantage of using this technique is that the indicator does not repaint; a marker that appears at the beginning of the realtime bar will never disappear.
- The script only plots information that is reliable in the realtime bar, i.e., total volume and markers. All other plots are set to n/a to prevent misleading traders.
- When the difference between the chart’s resolution and the lower resolution is too important, volume columns will not calculate for all bars in the dataset.
On Delta Volume
Buying or selling volume are misnomers, as every unit of volume transacted is both bought and sold by 2 different traders. There is no such thing as “buy only” or “sell only” volume, but trader lingo is riddled with original fabulations.
Without access to order book information, traders work with the assumption that when price moves up during a bar, there was more buying pressure than selling pressure. The built-in volume indicator available on TradingView uses this logic to color the volume columns green or red. While this script’s numbers are more precise because it analyses a number of intrabars to calculate its information, it uses the exact same imperfect logic to calculate its buying/selling/neutral sections.
Until Pine scripts can have access to how much volume was transacted at the bid/ask prices, our so-called buying/selling volume information will always be a mere proxy.
Divergences
You may wonder how there can be divergences between buying/selling volume information and price movement. This will sometimes be due to the methodology’s shortcomings we have just discussed, but divergences may also occur in instances where because of order book structure, it takes less volume to increase the price of an asset than it takes to decrease it.
As usual, divergences are points of interest because they reveal imbalances, which may or may not become turning points. I do not share the overwhelming enthusiasm traders have for divergences. To your pattern-hungry brain, the orange bars this indicator shows on chart will—as divergences on other indicators do–appear to often indicate turnarounds. My opinion is that reality is generally quite sobering, as many who have tried building automated rules based on divergences will tell you. I do not have hard numbers on the lack of performance of divergences—only many failed attempts to make them perform, which a few experienced strategy modelers I know share with me. Please don’t try to read too much into them. While they look great on past data, I find they are often difficult to use in realtime to make bets with good odds.
Thanks to:
- A guy called Kuan who commented on a Backtest Rookies presentation of an intrabar delta volume indicator using a for loop. The heart of “my” indicator is code borrowed from Kuan; I just built a hopefully useful wrapper around it.
- @theheirophant, my partner in the exploration of the sometimes weird abysses of security() ’s behavior at lower resolutions.

Mine Shaft + Drift + Ore Pocket Detector (Gap+Touch)Mine Shaft + Drift + Ore Pocket Detector (Gap+Touch) — Full Description (v1.6.1, Pine v6)
*Experimental - *Test Phase*
1) What this indicator is intended to do
This indicator attempts to algorithmically discover “mine shaft” price structure on a chart by:
Collecting structural anchor points (gaps and optionally pivots),
Generating candidate trend “rails” (centerline + parallel upper/lower borders) from pairs of anchors,
Fitting an optimal channel width around each candidate centerline,
Scoring candidates based on how well price action conforms to the channel (touches + containment),
Selecting and rendering:
the main shaft channel (primary),
additional drifts (secondary shafts per direction),
And then detecting Ore Pockets: time locations where multiple selected lines intersect (time confluence / intersection clustering).
The conceptual model is:
A shaft = a best-fit channel that price respects over time (the “main tunnel”).
Drifts = alternate channels close in quality to the main shaft (secondary tunnels).
Ore pockets = future/past time coordinates where multiple channels’ centerlines intersect densely (confluence in time, not necessarily in price).
2) What it is doing right now (current behavior)
In its current form, the script does a bounded, performance-limited scan:
It stores a limited number of anchor points in arrays.
It only considers a bounded number of recent anchors per direction.
It constructs candidate lines from anchor pairs and evaluates channel fitness using sampled bars.
On the last bar, it selects top candidates per direction and draws:
a “main” channel per mode (single best overall, or separate up/down),
plus optional drift channels,
plus ore pocket markers.
It is producing meaningful channels and drifts, but it is currently more likely to lock onto a strong “local” shaft than the one macro shaft spanning the entire market structure.
3) Core mechanics (how the script finds shafts)
3.1 Anchor generation (what points it uses)
Anchors are the “support points” used to build candidate shaft centerlines.
Two anchor families are supported:
A) Gap anchors (from your selected gap mode)
These attempt to capture “displacement events” and their boundaries/mids.
B) Pivot anchors (optional structural anchors)
These use pivots to inject macro structure points that are not strictly gap-based.
All anchors are stored as:
anchorX: bar_index of anchor
anchorY: price of anchor
anchorD: direction flag (+1 for up, -1 for down)
Anchors are capped by maxAnchors with FIFO trimming.
3.2 Candidate generation (how it produces centerlines)
For each direction (+1 and -1):
Collect “recent” anchors of that direction within lookbackBars (bounded to maxDirAnchors).
For each pair of anchors (x1,y1) and (x2,y2) that satisfy:
spacing within ,
slope sign consistent with direction,
Construct the line equation:
slope m and intercept b
Fit a channel width w around that line (via width mode).
Score it (touches + inside count minus width penalty).
Keep the top K rails (K = driftCount+1 typically).
3.3 Scoring model (what “best” means right now)
For a candidate centerline:
At sampled bars (stride sampling), compute:
channel top = y(x) + w
channel bot = y(x) - w
Evaluate:
Inside: candle range fits within the channel ± tolerance
Touches: high near top border, low near bottom border (within tolerance)
Score formula:
score = insideCount * insideWeight
+ touchCount * touchWeight
- (w / ATR) * widthPenalty
So:
Higher inside and touch counts increase score
Wider channels are penalized (in ATR units) to avoid “cheating” via enormous width
3.4 Width fitting (how the channel thickness is chosen)
Width is either:
Fit (scan widths): scans widths between a min width and a max deviation cap and selects the best scoring width.
Fixed ATR Envelope: uses a fixed width derived from ATR (currently hard-coded to a 2.0 ATR envelope in your present draft).
Fixed Max Deviation: width is max observed deviation from line in sampled window.
This matters because “macro shaft” detection is strongly influenced by whether the width-fitting is allowed to expand enough to contain large historical moves, without being penalized into losing to a smaller local shaft.
3.5 Rendering (what gets drawn)
For any selected rail, it draws:
Upper border line (top rail)
Lower border line (bottom rail)
Optional centerline (main only)
Optional fill between borders (main only)
Label at current bar with touches and inside count
Drifts render similarly but without main-only features (depending on flags).
3.6 Ore Pocket detection (time confluence)
Ore pockets are not “price zones” directly.
They are computed as follows:
Collect selected centerlines (m,b) for:
the main selected shaft(s),
and all drift centerlines (both directions if present)
For each pair of selected lines, compute intersection x-coordinate:
x* = (b2 - b1) / (m1 - m2)
Only keep intersections within:
Cluster intersections by time proximity (clusterBars)
Mark the strongest clusters (highest counts) as “Ore Pocket” vertical dotted lines with labels.
Interpretation:
A dense cluster indicates many selected rails converge around a similar time coordinate.
It is a “time confluence” hypothesis point.
4) Full settings reference (what each setting is for)
01) Gap Anchors
Gap Mode
FVG (3-candle)
Uses a classic 3-candle fair value gap pattern:
Up gap if low > high
Down gap if high < low
Anchors are derived from the gap boundaries.
Candle Gap (open-close)
Gap based on open vs close of the same bar with a tick threshold.
Candle Gap (open-prev close)
Gap based on open vs close with a tick threshold.
Gap Threshold (ticks)
Only used for the candle gap modes.
Controls the minimum gap size required to register an anchor.
Anchor Price
Boundary: anchors at one gap boundary (more “structural edge”)
Mid: anchors at midpoint of the gap (more “center of displacement”)
Include Pivot Anchors (structure)
When enabled, adds pivots as additional anchors to stabilize macro detection.
Pivot Length
Pivot sensitivity (how many bars left/right define a pivot).
Larger values = fewer, more structural pivots.
02) Channel Fit + Touch Scoring
Lookback Bars
The historical window used to:
filter which anchors are considered “recent enough”
evaluate channel fitness (sampled evaluation)
Larger lookback tends to favor macro shafts, but also increases computational risk (mitigated by evalBars and stride).
ATR Length
ATR period used for tolerance and width penalty scaling.
Tolerance (ATR mult)
Defines how close price must be to a rail to count as “touch” and how strict the “inside channel” containment is.
Higher tolerance = easier to score high on touch/inside.
Min Border Touches (keep rail)
Minimum number of border touches required before a candidate is even eligible.
Score: Inside Weight
Weight of inside count in score.
Score: Border Touch Weight
Weight of border touches in score.
This is a strong driver of “shaft-like” behavior.
Score: Width Penalty (in ATRs)
Penalizes wide channels relative to ATR.
Higher penalty biases toward narrow/local shafts.
03) Performance Controls
Max Stored Anchors (global)
Maximum anchor points kept in memory arrays.
Too low can cause loss of macro structure; too high increases candidate noise.
Max Anchors / Direction (scan)
Hard cap on how many anchors are used in candidate generation per direction.
Critical: this strongly influences whether macro shaft can be found, because if you only keep the most recent anchors, you lose the early-structure anchor points.
Eval Bars (max)
Maximum historical bars actually evaluated for scoring.
Even if lookbackBars is large, evaluation is capped here.
Eval Stride (sample every N bars)
Sampling step for evaluation.
Larger stride = faster but less accurate scoring.
04) Candidate Generation
Min Anchor Spacing (bars)
Minimum distance between the two anchors used to define a candidate line.
Prevents micro-noise lines from being evaluated.
Max Anchor Spacing (bars)
Maximum distance between the two anchors used to define a candidate line.
If this is too low, you cannot generate truly macro candidate lines.
05) Shaft + Drift Display
Main Shaft Mode
Best Overall (Single Shaft): chooses one best rail among Up/Down and draws it as main.
Up Only: show only the best upward rail.
Down Only: show only the best downward rail.
Up + Down: show both main up rail and main down rail simultaneously.
Show Ascending Shaft
Toggles rendering for the “up” main shaft (when mode allows it).
Show Descending Shaft
Toggles rendering for the “down” main shaft (when mode allows it).
Drifts per Direction
Number of additional top-ranked rails to draw per direction (after the best one).
Extend Lines
Right: extend lines to the right only.
Both: extend both left and right.
Fill Main Shaft Channel
Fill between upper and lower borders for main shaft.
Main Shaft Fill Transparency
Transparency level for main fill.
Show Main Shaft Centerline
Draw the dashed centerline for the main shaft.
06) Ore Pocket (Intersection-Time Confluence)
Show Ore Pockets (Time Confluence)
Enables ore pocket discovery and rendering.
Intersection Window Forward (bars)
How far into the future intersections are considered.
Intersection Window Backward (bars)
How far into the past intersections are considered.
Cluster Radius (bars)
How close in time intersections must be to merge into a cluster.
Min Intersections per Cluster
Minimum cluster count required before a pocket is shown.
Max Pocket Markers
Limit how many pocket clusters are drawn.
07) Visual Controls
Show Gap Anchors
Displays the gap anchor dots for debugging.
Show Pivot Anchors
Displays pivot anchor dots for debugging.
5) How to use it (practical workflow)
Step A — Confirm anchor behavior
Turn on Show Gap Anchors.
Choose your Gap Mode.
Verify you are seeing anchors where you expect (displacement boundaries).
If anchors are sparse:
Reduce gap threshold (ticks) for candle-gap modes
Enable pivots to inject structure
Increase lookbackBars and maxAnchors so early anchors are not dropped
Step B — Get stable main shaft candidate discovery
Enable Include Pivot Anchors with a medium pivotLen.
Use Fit (scan widths) initially.
Increase Max Anchors / Direction (scan) so you’re not only using recent anchors.
Increase Max Anchor Spacing so macro pairs are eligible.
If you keep getting only local shafts:
That is usually because the candidate pool does not include enough old anchors, or the maxSpacing prevents long-span lines.
Step C — Tune scoring so the “whole-structure” shaft wins
If the script picks a small local channel instead of the macro channel:
Increase insideWeight relative to touchWeight (macro channels tend to contain longer structure even with fewer perfect “touches”)
Reduce widthPenalty, because macro channels may need to be wider to accommodate historical volatility
Increase lookbackBars and evalBars to make “whole-structure fit” matter
Step D — Drifts as secondary shafts
Once main shaft is good:
Increase Drifts per Direction
Validate that drifts represent meaningful alternate sub-shafts rather than noisy duplicates.
If drifts look too similar:
This is expected if many candidates differ only slightly; future refinements should diversify drift selection (see “what still needs done”).
Step E — Ore pockets interpretation
Ore pockets indicate time confluence of multiple rails.
Use them as:
“Time windows to watch”
Not as deterministic price levels
Tune:
clusterBars (cluster tightness)
minClusterSize (signal strength)
6) What still needs done (explicit backlog)
The macro “main mining shaft channel” spanning the entire market structure, and
Smaller shafts/drifts nested inside the macro structure.
To accomplish that, the current algorithm needs additional architecture. Concretely:
A) True multi-scale / hierarchical discovery (primary missing feature)
Right now: one pass, one lookback, one score objective.
Still Needed:
Macro pass: discover a primary shaft using a very long evaluation window and anchor set.
Micro pass(es): discover drifts/secondary shafts using:
residuals (distance from macro centerline),
or segmented time windows (regime partitions),
or anchor subsets constrained to local regions.
This is the single biggest reason we are not consistently getting the full-structure shaft.
B) Anchor retention strategy for macro detection
Right now:
anchors are FIFO capped and direction scanning uses “recent anchors only.”
To reliably find 10-year shafts we need:
an option to store/retain representative anchors across the entire history, not only the most recent ones.
Examples of necessary improvements:
“Stratified anchor sampling” across time (keep some old anchors even when maxAnchors is hit)
“Macro anchor bank” (separate storage for pivots or major gaps)
C) Candidate generation constraints must support macro lines
If we want a shaft spanning the whole structure:
maxSpacing must allow it
the candidate pool must contain anchors far apart in time
So the algorithm needs:
better selection of anchor pairs for long-span candidates (e.g., include earliest/oldest anchors + newest anchors deliberately, not accidentally)
D) Drift diversification
Right now drifts are “next best by score,” which often yields near-duplicates.
We want:
“diverse” secondary shafts:
enforce minimum angular difference,
enforce minimum offset difference,
or penalize candidates too similar to the already-selected shaft.
E) Width fitting logic for macro channels
Macro channels often require:
either a higher width cap,
or a different penalty profile.
Current width penalty is simple and can bias against macro channels.
Needed:
width penalty that scales by timescale or by total evaluated bars,
or separate macro/micro scoring.
F) Ore pocket semantics enhancement (optional but aligned)
Currently pockets are time intersections only.
If you want “pocket zones,” improvements could include:
projecting intersection price and drawing a zone box,
clustering in (time, price) space instead of only time,
adding “importance” weighting based on which lines intersect (macro line intersections weighted higher).
7) Known limitations (current version)
Heavy compute only runs on last bar (good for performance), but means:
changes in anchors/parameters can reselect rails abruptly
Candidate set is bounded; macro shaft can be missed if not in pool
Drift selection can be redundant
Ore pockets are time clusters, not price clusters

Volume Weighted CorrelationThis indicator analyzes the structural relationship between two
assets by decomposing the Total Correlation into two distinct,
interpretable components: "Between-Bar" (Inter-Bar) and
"Within-Bar" (Intra-Bar) correlation.
Key Features:
1. **Hybrid Copula Estimator:** Unlike standard correlation, which
often fails on High/Low range data, this indicator fuses two
metrics to ensure mathematical rigor:
- **Magnitude:** Derived from Rogers-Satchell Volatility.
- **Direction:** Derived from Log-Returns.
This allows for precise correlation estimates even on intra-bar data.
2. **Two-Component Correlation Decomposition:** The indicator
separates correlation based on the 'Estimate Bar Statistics' option.
- **Standard Mode (`Estimate Bar Statistics` = OFF):** Calculates
correlation based on the selected `Source` (Close-to-Close).
- **Decomposition Mode (`Estimate Bar Statistics` = ON):** The
indicator uses a statistical model ('Estimator') to
calculate *within-bar* correlation.
This separates the relationship into:
- **Between-Bar Correlation (Green/Red):** Correlation of the
price paths (means). Indicates if the macro movements of the
assets are aligned (Inter-Bar correlation).
- **Within-Bar Correlation (Blue):** Correlation of the
microstructure (Intra-Bar volatility/noise).
3. **Visual Decomposition Logic:** Total Correlation is the
primary metric displayed. Since Correlation Coefficients are not
linearly additive, this indicator calculates the *exact* Total
Correlation and partitions the area/ratios based on the additive
Covariance Decomposition (`CovTot = CovBtw + CovWtn`). This
ensures the displayed total correlation remains mathematically accurate.
4. **Dual Display Modes:** The indicator offers two modes to
visualize this decomposition:
- **Absolute Mode:** Displays the *Total Correlation* as the main
line, with the background filled by the stacked components
(Between vs. Within). Shows the *magnitude* of the relationship.
- **Relative Mode:** Displays the **Energy Ratios** (-1.0 to 1.0)
of each component using L1-Normalization. This isolates the
*structure/quality* of the relationship (e.g., "Is the correlation
driven by price movement or just by volatility coupling?").
5. **Calculation Options:**
- **Normalization:** An optional 'Normalize' setting
calculates an **Exponential Regression Curve** (log-space),
creating a constant percentage variance environment. Essential
for comparing assets with different scales (e.g., BTC vs EURUSD).
- **Volume Weighting:** An option (`Volume weighted`) applies
volume weighting to all mean and covariance calculations.
6. **Correlation Cycle Analysis:**
- **Pivot Detection:** Includes a built-in pivot detector
that identifies significant turning points (highs and lows) in
the *Total Correlation* line. (Note: This is only visible
in 'Absolute Mode').
- **Flexible Pivot Algorithms:** Supports various underlying
mathematical models for pivot detection provided by the
core library.
7. **Note on Confirmation (Lag):** Pivot signals are confirmed
using a lookback method. A pivot is only plotted *after*
the `Pivot Right Bars` input has passed, which introduces
an inherent lag.
8. **Multi-Timeframe (MTF) Capability:**
- **MTF Correlation Lines:** The correlation lines can be
calculated on a higher timeframe, with standard options
to handle gaps (`Fill Gaps`) and prevent repainting
(`Wait for...`).
- **Limitation:** The Pivot detection (`Calculate Pivots`) is
**disabled** if a Higher Timeframe (HTF) is selected.
9. **Integrated Alerts:** Includes comprehensive alerts for:
- Correlation magnitude (High Positive / High Inverse).
- Character changes (Inter-Bar vs. Intra-Bar dominance).
- Total Correlation pivot (High/Low) detection.
---
**DISCLAIMER**
1. **For Informational/Educational Use Only:** This indicator is
provided for informational and educational purposes only. It does
not constitute financial, investment, or trading advice, nor is
it a recommendation to buy or sell any asset.
2. **Use at Your Own Risk:** All trading decisions you make based on
the information or signals generated by this indicator are made
solely at your own risk.
3. **No Guarantee of Performance:** Past performance is not an
indicator of future results. The author makes no guarantee
regarding the accuracy of the signals or future profitability.
4. **No Liability:** The author shall not be held liable for any
financial losses or damages incurred directly or indirectly from
the use of this indicator.
5. **Signals Are Not Recommendations:** The alerts and visual signals
(e.g., crossovers) generated by this tool are not direct
recommendations to buy or sell. They are technical observations
for your own analysis and consideration.

Consolidation zones + BreakoutThis Pine Script v6 indicator is designed to detect consolidation zones and mark breakout entries (long or short) when price exits those zones.
Indicator purpose
Identify periods where price moves in a tight range for several consecutive bars (consolidation).
Highlight those zones on the chart with a yellow shaded area between the local high and low.
Mark potential LONG and SHORT entries when price breaks out of a consolidation zone.
Core consolidation logic
The indicator measures whether the market is “compressed” by comparing the price range of recent bars with volatility measured via ATR:
It computes the highest high and lowest low of the last lookback bars:
rangeHigh = ta.highest(high, lookback)
rangeLow = ta.lowest(low, lookback)
It calculates the current range:
rng = rangeHigh - rangeLow
It calculates ATR over atrLen bars as a volatility benchmark:
atrVal = ta.atr(atrLen)
It defines a compressed range (base consolidation) when the range is smaller than a multiple of ATR:
baseConso = rng < atrVal * atrMult
Here, atrMult controls how tight the range must be. Lower values (0.8–1.0) require strong compression; higher values (1.5–2.0) are more permissive.
Minimum bars in consolidation
To avoid calling a very short pause a consolidation, the script enforces a minimum duration:
It uses ta.barssince(not baseConso) to count how many bars have passed since the last time the consolidation condition was false.
If that count is greater than or equal to minBars, the market is considered to be in consolidation:
text
isConsolidating = ta.barssince(not baseConso) >= minBars
This prevents 2–3 sideways bars from being treated as a full consolidation zone. The minBars input lets you adapt the duration to your timeframe and trading style.
Plotting the consolidation zone
When isConsolidating is true, the script shades the consolidation area:
It plots two invisible series for the zone’s high and low:
text
pHigh = plot(rangeHigh, display = display.none)
pLow = plot(rangeLow, display = display.none)
It creates a yellow semi‑transparent fill between those lines only while in consolidation:
text
fillColor = isConsolidating ? color.new(#ffeb3b, 80) : color.new(#ffeb3b, 100)
fill(pHigh, pLow, color = fillColor, title = "Consolidation Zone")
Outside consolidation, the color becomes almost fully transparent so the shaded zone disappears. This keeps the chart clean and focuses attention on the actual ranges.
Breakout detection (LONG / SHORT)
The script then looks for breakouts when price leaves a consolidation zone:
It checks if the previous bar was inside consolidation:
wasConso = isConsolidating
A bullish breakout (LONG) occurs when:
The current bar is no longer in consolidation (not isConsolidating).
The previous bar was in consolidation (wasConso).
The close breaks above the previous consolidation high (close > rangeHigh ):
text
breakLong = not isConsolidating and wasConso and close > rangeHigh
A bearish breakout (SHORT) occurs when:
The current bar is no longer in consolidation.
The previous bar was in consolidation.
The close breaks below the previous consolidation low (close < rangeLow ):
text
breakShort = not isConsolidating and wasConso and close < rangeLow
On each breakout, a label is drawn at the breakout bar:
text
if breakLong
label.new(bar_index, low, "LONG",
style = label.style_label_up,
textcolor = color.white,
color = color.new(color.teal, 0),
size = size.tiny)
if breakShort
label.new(bar_index, high, "SHORT",
style = label.style_label_down,
textcolor = color.white,
color = color.new(color.red, 0),
size = size.tiny)
These labels highlight where price transitions from sideways action to a potential directional move.
User inputs and tuning
lookback (Bars for range)
Number of bars used to compute the consolidation high/low. Higher values produce wider, less frequent zones; lower values detect shorter consolidations.
minBars (Minimum bars in consolidation)
Minimum number of consecutive bars that must meet the compression condition. On 15‑minute charts, values between 6 and 12 often work, but this depends on the asset.
atrLen and atrMult
Control how strict the compression rule is.
atrLen: ATR period.
atrMult: maximum allowed range as a multiple of ATR.
Increasing atrMult finds more zones; decreasing it makes the filter stricter.
showText
Optional helper label with a short description, useful when sharing the script with other users on the TradingView community.
Practical usage
Apply the indicator to your preferred timeframe (for example, 15‑minute crypto charts).
Tweak lookback, minBars, and atrMult until the yellow zones match the consolidations you would mark manually.
Use the LONG and SHORT labels as areas of interest for studying range breakouts and building your own entry/exit rules, always combining them with risk management and a complete trading strategy.
This way, the script turns a visual concept—sideways consolidation followed by breakout—into a systematic, testable signal in Pine Script v6.

Gold Profit Target SystemGOLD PROFIT TARGET SYSTEM
Track Real Profits, Exit With Confidence
Best on Daily or Weekly - copy and mod as you see fit. Have fun!
WHAT THIS INDICATOR DOES:
This indicator tracks your gold position from entry and shows color-coded profit targets as the price rises. Instead of guessing when to exit, you see exact profit levels in real-time: 1%, 2%, 3%, 4%, 5%, 10%, 15%, 20%, 25%, and 25%+.
Simple concept: BUY on the signal, SELL at YOUR chosen profit level.
HOW IT WORKS - 3 SIMPLE STEPS:
STEP 1: Wait for BUY Signal
• Green triangle (▲) appears below the composite line
• Triggered when inverse assets (DXY, rates, etc.) show strong correlation and are falling
• Entry price is automatically recorded
• Position tracking begins
STEP 2: Watch Profit Targets Appear
• As gold rises, color-coded symbols appear above the composite line
• Each symbol represents a profit milestone
• The info table shows your current profit
• You decide when to exit based on YOUR target
STEP 3: Exit at Your Chosen Level
• Conservative? Exit at 5-10%
• Moderate? Exit at 10-15%
• Aggressive? Hold for 20%+
• The indicator just shows the levels - YOU make the call
THE COMPOSITE LINE - WHAT IT MEANS:
The main line is a weighted composite of inverse-correlated assets:
• DXY (US Dollar Index)
• Real Interest Rates (10Y TIPS)
• US 10-Year Treasury Yield
• US 2-Year Treasury Yield
• Bitcoin (optional)
• Copper (optional)
Line Position:
• Below -30 (Bright Green): Very strong inverse correlation - excellent BUY conditions
• Below 0 (Green): Inverse correlation present - moderate BUY conditions
• Above 0 (Red): Inverse assets rising - neutral to bearish
• Above 30 (Bright Red): Strong inverse rally - bearish for gold
What Causes BUY Signals:
When the composite line is negative (inverse assets falling) AND shows strong correlation (>0.3), this suggests gold is likely to rise. The indicator records your entry and begins tracking profits.
COLOR-CODED PROFIT TARGETS:
EARLY PROFITS (Green Circles):
• 1% - Very Light Green (#c8e6c9) - First confirmation
• 2% - Light Green (#a5d6a7) - Building profit
• 3% - Green (#81c784) - Good profit
• 4% - Medium Green (#66bb6a) - Strong profit
• 5% - Dark Green (#4caf50) - Solid profit!
EXCELLENT PROFIT (Yellow Diamond):
• 10% - Yellow (#ffd54f) - Double digits, excellent trade!
OUTSTANDING PROFIT (Orange Diamonds):
• 15% - Orange (#ffb74d) - Exceptional profit, consider partial exit
EXCEPTIONAL PROFIT (Red Diamonds):
• 20% - Light Red (#ff8a65) - Rare territory, strong exit consideration
• 25% - Red (#f44336) - Extraordinary profit, very rare!
PEAK PROFIT (Purple Star):
• 25%+ - Purple (#9c27b0) - Once in a blue moon! The home run trade!
STOP LOSS (Red X):
• Default -5% - Protection against losses
• Position auto-resets if stop is hit
THE PROFIT BAR (Histogram):
Below the composite line, you'll see a colored histogram when in position:
Bar Color = Your Current Profit Tier
• Light green bar = 1-2% profit
• Green bar = 3-5% profit
• Yellow bar = 10% profit
• Orange bar = 15% profit
• Red bar = 20-25% profit
• Purple bar = 25%+ profit
• Red negative bar = Currently at a loss
Bar Height = Current Profit %
The taller the bar, the larger your profit. Negative bars extend downward when you're at a loss.
THE INFORMATION TABLE:
The table (top-right by default) shows everything at a glance:
Position: ✓ IN (green) or ✗ OUT (gray)
Shows whether you're currently holding a position
Entry Price: Your recorded buy price
Example: 2,100.50
Current Price: Gold's current price
Example: 2,142.75
Current P/L: YOUR PROFIT %
This is the most important metric - shows exactly how much you're up (or down)
Color matches your current profit tier
Example: +2.01% in light green
Profit Tier: Current milestone reached
Shows which profit level you've hit: "1%", "2%", "5%", "10%", etc.
Next Target: The next profit level to watch
Tells you what milestone is coming up next
Bars Held: How long you've been in the trade
Helps track holding time
Composite: Current correlation strength
Shows the underlying composite correlation value
REFERENCE LINES:
Zero Line (Gray):
The center line. Above = bearish for gold, Below = bullish for gold
Strong Bull Line (Green dashed at -30):
When composite crosses below -30, very strong BUY conditions
Strong Bear Line (Red dashed at +30):
When composite crosses above +30, strong bearish conditions
BACKGROUND SHADING:
Very Light Green Background:
You're in profit (position open and above entry price)
Very Light Red Background:
You're at a loss (position open and below entry price)
No Background:
No position currently open
SYMBOLS ON CHART:
▲ Green Triangle Below Line: BUY SIGNAL
Enter long position here. Entry price recorded.
● Small Green Circles Above Line: 1-5% Profits
Early profit targets. Light green to dark green progression.
◆ Diamonds Above Line: 10-25% Profits
Major profit milestones. Yellow → Orange → Red progression.
★ Purple Star Above Line: 25%+ Profit
The holy grail! Peak profit achieved.
✖ Red X Below Line: STOP LOSS HIT
Trade went against you. Position resets (if auto-reset enabled).
PROFIT-TAKING STRATEGIES:
Strategy 1: Fixed Target (Simple)
Pick one target (e.g., 10%) and always exit there.
Best for: Beginners, disciplined traders
Strategy 2: Scaled Exit (Advanced)
Exit in portions:
• 5% profit → Sell 25%
• 10% profit → Sell 25% (50% total out)
• 15% profit → Sell 25% (75% total out)
• 20%+ profit → Let final 25% ride
Best for: Risk management, maximizing upside
Strategy 3: Trailing Stop
• Hit 10%? Set stop at 5%
• Hit 15%? Set stop at 10%
• Lock in profits while letting winners run
Best for: Trend followers, bull markets
Strategy 4: Adaptive
• Strong uptrend → wait for 15-20%
• Choppy market → exit at 5-10%
• Weakening trend → exit at any profit
Best for: Experienced traders
SETTINGS YOU CAN CUSTOMIZE:
Profit Target Levels:
Change any profit % to match your strategy
• Conservative: Lower targets (0.5%, 1%, 2%, 3%, 5%)
• Aggressive: Higher targets (2%, 5%, 10%, 20%, 30%)
Assets to Include:
• Enable/disable Bitcoin
• Enable/disable Copper
• Toggle which inverse assets to track
Display Options:
• Show all targets or just current tier
• Show/hide profit bar
• Show/hide composite line
• Move table position
Stop Loss:
• Set your risk tolerance (default 5%)
• Enable/disable auto-reset on stop loss
Correlation Periods:
• Adjust for your timeframe
• Hourly: 14/30/60
• Daily: 20/50/100
• Weekly: 10/20/50
ALERTS AVAILABLE:
Set alerts for any profit milestone:
Critical Alerts:
• "BUY Signal" - Entry notification
• "5% Profit Target" - First major milestone
• "10% Profit Target" - Decision point
• "Stop Loss Hit" - Risk protection
Optional Alerts:
• 1%, 2%, 3%, 4% - Early confirmations
• 15%, 20%, 25% - Major milestones
• Individual levels for your strategy
BEST TIMEFRAMES:
Daily Chart (Recommended):
Best for swing traders holding 3-10 days
Use default settings (20/50/100 periods)
Target 5-15% profits
4-Hour Chart:
Good for active swing traders
Adjust periods to 14/30/60
Target 3-10% profits
Hourly Chart:
For day traders and scalpers
Use shorter periods (14/30/60)
Target 1-5% profits
Adjust profit levels lower (0.5%, 1%, 2%, 3%)
WHY THIS INDICATOR IS DIFFERENT:
Most indicators tell you WHEN to enter.
This one tells you WHEN TO EXIT with profit.
Most indicators use vague signals.
This one shows EXACT profit percentages.
Most indicators leave exit decisions to you.
This one gives CLEAR, COLOR-CODED milestones.
Most indicators don't track your P/L.
This one shows your profit in text you can't miss.
QUICK START GUIDE:
1. Add indicator to gold chart (XAUUSD, GLD, GC1!)
2. Wait for green triangle (▲) BUY signal
3. Watch your profit grow in the table
4. Exit when you hit YOUR target (5%, 10%, 15%, etc.)
5. Repeat
That's it. Simple. Effective. Profitable.
IMPORTANT NOTES:
• This is for LONG positions only - not for shorting gold
• Position tracking begins only after a BUY signal
• The indicator shows levels - YOU decide when to exit
• Always use stop losses (default 5% is reasonable)
• Past performance doesn't guarantee future results
• Not financial advice - use for educational purposes
PRO TIPS:
Tip 1: Don't get greedy - 10-15% is an excellent profit for most trades
Tip 2: Purple stars (25%+) are RARE - don't wait for them on every trade
Tip 3: The profit bar color change is your visual cue - green→yellow→orange→red
Tip 4: Combine with resistance levels - "10% profit + resistance = exit"
Tip 5: Set alerts for YOUR target level so you never miss it
Tip 6: The giant P/L number in the table removes emotion from decisions
EXAMPLE TRADE:
Day 1: ▲ BUY signal at $2,100
Table shows: Position ✓ IN | Entry: 2,100
Day 2: Current P/L: +1.8%
First green circle appears (1% target hit)
Table tier: "1%"
Day 4: Current P/L: +5.2%
Dark green circle appears (5% target hit)
Profit bar is dark green
Decision point: Exit 50% here?
Day 7: Current P/L: +10.5%
Yellow diamond appears (10% target hit!)
Table shows: +10.5% in yellow text
Decision point: Exit remaining 50%?
Result: Average exit ~7.5% over 7 days. Excellent swing trade!
WORKS ON:
• Gold Spot (XAUUSD)
• Gold Futures (GC1!)
• Gold ETFs (GLD, IAU)
• Any gold instrument
Inverse Assets Tracked:
• DXY (US Dollar Index)
• Real Interest Rates (TIPS)
• US Treasury Yields (2Y, 10Y)
• Bitcoin (optional)
• Copper (optional)
THE BOTTOM LINE:
Stop guessing when to take profits.
Start SEEING your profit levels in real-time.
The indicator shows you the targets.
YOU choose when to cash out.
That's YOUR edge.
Developed for traders who want clear, actionable profit targets instead of vague signals.

Adaptive Market Wave TheoryAdaptive Market Wave Theory
🌊 CORE INNOVATION: PROBABILISTIC PHASE DETECTION WITH MULTI-AGENT CONSENSUS
Adaptive Market Wave Theory (AMWT) represents a fundamental paradigm shift in how traders approach market phase identification. Rather than counting waves subjectively or drawing static breakout levels, AMWT treats the market as a hidden state machine —using Hidden Markov Models, multi-agent consensus systems, and reinforcement learning algorithms to quantify what traditional methods leave to interpretation.
The Wave Analysis Problem:
Traditional wave counting methodologies (Elliott Wave, harmonic patterns, ABC corrections) share fatal weaknesses that AMWT directly addresses:
1. Non-Falsifiability : Invalid wave counts can always be "recounted" or "adjusted." If your Wave 3 fails, it becomes "Wave 3 of a larger degree" or "actually Wave C." There's no objective failure condition.
2. Observer Bias : Two expert wave analysts examining the same chart routinely reach different conclusions. This isn't a feature—it's a fundamental methodology flaw.
3. No Confidence Measure : Traditional analysis says "This IS Wave 3." But with what probability? 51%? 95%? The binary nature prevents proper position sizing and risk management.
4. Static Rules : Fixed Fibonacci ratios and wave guidelines cannot adapt to changing market regimes. What worked in 2019 may fail in 2024.
5. No Accountability : Wave methodologies rarely track their own performance. There's no feedback loop to improve.
The AMWT Solution:
AMWT addresses each limitation through rigorous mathematical frameworks borrowed from speech recognition, machine learning, and reinforcement learning:
• Non-Falsifiability → Hard Invalidation : Wave hypotheses die permanently when price violates calculated invalidation levels. No recounting allowed.
• Observer Bias → Multi-Agent Consensus : Three independent analytical agents must agree. Single-methodology bias is eliminated.
• No Confidence → Probabilistic States : Every market state has a calculated probability from Hidden Markov Model inference. "72% probability of impulse state" replaces "This is Wave 3."
• Static Rules → Adaptive Learning : Thompson Sampling multi-armed bandits learn which agents perform best in current conditions. The system adapts in real-time.
• No Accountability → Performance Tracking : Comprehensive statistics track every signal's outcome. The system knows its own performance.
The Core Insight:
"Traditional wave analysis asks 'What count is this?' AMWT asks 'What is the probability we are in an impulsive state, with what confidence, confirmed by how many independent methodologies, and anchored to what liquidity event?'"
🔬 THEORETICAL FOUNDATION: HIDDEN MARKOV MODELS
Why Hidden Markov Models?
Markets exist in hidden states that we cannot directly observe—only their effects on price are visible. When the market is in an "impulse up" state, we see rising prices, expanding volume, and trending indicators. But we don't observe the state itself—we infer it from observables.
This is precisely the problem Hidden Markov Models (HMMs) solve. Originally developed for speech recognition (inferring words from sound waves), HMMs excel at estimating hidden states from noisy observations.
HMM Components:
1. Hidden States (S) : The unobservable market conditions
2. Observations (O) : What we can measure (price, volume, indicators)
3. Transition Matrix (A) : Probability of moving between states
4. Emission Matrix (B) : Probability of observations given each state
5. Initial Distribution (π) : Starting state probabilities
AMWT's Six Market States:
State 0: IMPULSE_UP
• Definition: Strong bullish momentum with high participation
• Observable Signatures: Rising prices, expanding volume, RSI >60, price above upper Bollinger Band, MACD histogram positive and rising
• Typical Duration: 5-20 bars depending on timeframe
• What It Means: Institutional buying pressure, trend acceleration phase
State 1: IMPULSE_DN
• Definition: Strong bearish momentum with high participation
• Observable Signatures: Falling prices, expanding volume, RSI <40, price below lower Bollinger Band, MACD histogram negative and falling
• Typical Duration: 5-20 bars (often shorter than bullish impulses—markets fall faster)
• What It Means: Institutional selling pressure, panic or distribution acceleration
State 2: CORRECTION
• Definition: Counter-trend consolidation with declining momentum
• Observable Signatures: Sideways or mild counter-trend movement, contracting volume, RSI returning toward 50, Bollinger Bands narrowing
• Typical Duration: 8-30 bars
• What It Means: Profit-taking, digestion of prior move, potential accumulation for next leg
State 3: ACCUMULATION
• Definition: Base-building near lows where informed participants absorb supply
• Observable Signatures: Price near recent lows but not making new lows, volume spikes on up bars, RSI showing positive divergence, tight range
• Typical Duration: 15-50 bars
• What It Means: Smart money buying from weak hands, preparing for markup phase
State 4: DISTRIBUTION
• Definition: Top-forming near highs where informed participants distribute holdings
• Observable Signatures: Price near recent highs but struggling to advance, volume spikes on down bars, RSI showing negative divergence, widening range
• Typical Duration: 15-50 bars
• What It Means: Smart money selling to late buyers, preparing for markdown phase
State 5: TRANSITION
• Definition: Regime change period with mixed signals and elevated uncertainty
• Observable Signatures: Conflicting indicators, whipsaw price action, no clear momentum, high volatility without direction
• Typical Duration: 5-15 bars
• What It Means: Market deciding next direction, dangerous for directional trades
The Transition Matrix:
The transition matrix A captures the probability of moving from one state to another. AMWT initializes with empirically-derived values then updates online:
From/To IMP_UP IMP_DN CORR ACCUM DIST TRANS
IMP_UP 0.70 0.02 0.20 0.02 0.04 0.02
IMP_DN 0.02 0.70 0.20 0.04 0.02 0.02
CORR 0.15 0.15 0.50 0.10 0.10 0.00
ACCUM 0.30 0.05 0.15 0.40 0.05 0.05
DIST 0.05 0.30 0.15 0.05 0.40 0.05
TRANS 0.20 0.20 0.20 0.15 0.15 0.10
Key Insights from Transition Probabilities:
• Impulse states are sticky (70% self-transition): Once trending, markets tend to continue
• Corrections can transition to either impulse direction (15% each): The next move after correction is uncertain
• Accumulation strongly favors IMP_UP transition (30%): Base-building leads to rallies
• Distribution strongly favors IMP_DN transition (30%): Topping leads to declines
The Viterbi Algorithm:
Given a sequence of observations, how do we find the most likely state sequence? This is the Viterbi algorithm—dynamic programming to find the optimal path through the state space.
Mathematical Formulation:
δ_t(j) = max_i × B_j(O_t)
Where:
δ_t(j) = probability of most likely path ending in state j at time t
A_ij = transition probability from state i to state j
B_j(O_t) = emission probability of observation O_t given state j
AMWT Implementation:
AMWT runs Viterbi over a rolling window (default 50 bars), computing the most likely state sequence and extracting:
• Current state estimate
• State confidence (probability of current state vs alternatives)
• State sequence for pattern detection
Online Learning (Baum-Welch Adaptation):
Unlike static HMMs, AMWT continuously updates its transition and emission matrices based on observed market behavior:
f_onlineUpdateHMM(prev_state, curr_state, observation, decay) =>
// Update transition matrix
A *= decay
A += (1.0 - decay)
// Renormalize row
// Update emission matrix
B *= decay
B += (1.0 - decay)
// Renormalize row
The decay parameter (default 0.85) controls adaptation speed:
• Higher decay (0.95): Slower adaptation, more stable, better for consistent markets
• Lower decay (0.80): Faster adaptation, more reactive, better for regime changes
Why This Matters for Trading:
Traditional indicators give you a number (RSI = 72). AMWT gives you a probabilistic state assessment :
"There is a 78% probability we are in IMPULSE_UP state, with 15% probability of CORRECTION and 7% distributed among other states. The transition matrix suggests 70% chance of remaining in IMPULSE_UP next bar, 20% chance of transitioning to CORRECTION."
This enables:
• Position sizing by confidence : 90% confidence = full size; 60% confidence = half size
• Risk management by transition probability : High correction probability = tighten stops
• Strategy selection by state : IMPULSE = trend-follow; CORRECTION = wait; ACCUMULATION = scale in
🎰 THE 3-BANDIT CONSENSUS SYSTEM
The Multi-Agent Philosophy:
No single analytical methodology works in all market conditions. Trend-following excels in trending markets but gets chopped in ranges. Mean-reversion excels in ranges but gets crushed in trends. Structure-based analysis works when structure is clear but fails in chaotic markets.
AMWT's solution: employ three independent agents , each analyzing the market from a different perspective, then use Thompson Sampling to learn which agents perform best in current conditions.
Agent 1: TREND AGENT
Philosophy : Markets trend. Follow the trend until it ends.
Analytical Components:
• EMA Alignment: EMA8 > EMA21 > EMA50 (bullish) or inverse (bearish)
• MACD Histogram: Direction and rate of change
• Price Momentum: Close relative to ATR-normalized movement
• VWAP Position: Price above/below volume-weighted average price
Signal Generation:
Strong Bull: EMA aligned bull AND MACD histogram > 0 AND momentum > 0.3 AND close > VWAP
→ Signal: +1 (Long), Confidence: 0.75 + |momentum| × 0.4
Moderate Bull: EMA stack bull AND MACD rising AND momentum > 0.1
→ Signal: +1 (Long), Confidence: 0.65 + |momentum| × 0.3
Strong Bear: EMA aligned bear AND MACD histogram < 0 AND momentum < -0.3 AND close < VWAP
→ Signal: -1 (Short), Confidence: 0.75 + |momentum| × 0.4
Moderate Bear: EMA stack bear AND MACD falling AND momentum < -0.1
→ Signal: -1 (Short), Confidence: 0.65 + |momentum| × 0.3
When Trend Agent Excels:
• Trend days (IB extension >1.5x)
• Post-breakout continuation
• Institutional accumulation/distribution phases
When Trend Agent Fails:
• Range-bound markets (ADX <20)
• Chop zones after volatility spikes
• Reversal days at major levels
Agent 2: REVERSION AGENT
Philosophy: Markets revert to mean. Extreme readings reverse.
Analytical Components:
• Bollinger Band Position: Distance from bands, percent B
• RSI Extremes: Overbought (>70) and oversold (<30)
• Stochastic: %K/%D crossovers at extremes
• Band Squeeze: Bollinger Band width contraction
Signal Generation:
Oversold Bounce: BB %B < 0.20 AND RSI < 35 AND Stochastic < 25
→ Signal: +1 (Long), Confidence: 0.70 + (30 - RSI) × 0.01
Overbought Fade: BB %B > 0.80 AND RSI > 65 AND Stochastic > 75
→ Signal: -1 (Short), Confidence: 0.70 + (RSI - 70) × 0.01
Squeeze Fire Bull: Band squeeze ending AND close > upper band
→ Signal: +1 (Long), Confidence: 0.65
Squeeze Fire Bear: Band squeeze ending AND close < lower band
→ Signal: -1 (Short), Confidence: 0.65
When Reversion Agent Excels:
• Rotation days (price stays within IB)
• Range-bound consolidation
• After extended moves without pullback
When Reversion Agent Fails:
• Strong trend days (RSI can stay overbought for days)
• Breakout moves
• News-driven directional moves
Agent 3: STRUCTURE AGENT
Philosophy: Market structure reveals institutional intent. Follow the smart money.
Analytical Components:
• Break of Structure (BOS): Price breaks prior swing high/low
• Change of Character (CHOCH): First break against prevailing trend
• Higher Highs/Higher Lows: Bullish structure
• Lower Highs/Lower Lows: Bearish structure
• Liquidity Sweeps: Stop runs that reverse
Signal Generation:
BOS Bull: Price breaks above prior swing high with momentum
→ Signal: +1 (Long), Confidence: 0.70 + structure_strength × 0.2
CHOCH Bull: First higher low after downtrend, breaking structure
→ Signal: +1 (Long), Confidence: 0.75
BOS Bear: Price breaks below prior swing low with momentum
→ Signal: -1 (Short), Confidence: 0.70 + structure_strength × 0.2
CHOCH Bear: First lower high after uptrend, breaking structure
→ Signal: -1 (Short), Confidence: 0.75
Liquidity Sweep Long: Price sweeps below swing low then reverses strongly
→ Signal: +1 (Long), Confidence: 0.80
Liquidity Sweep Short: Price sweeps above swing high then reverses strongly
→ Signal: -1 (Short), Confidence: 0.80
When Structure Agent Excels:
• After liquidity grabs (stop runs)
• At major swing points
• During institutional accumulation/distribution
When Structure Agent Fails:
• Choppy, structureless markets
• During news events (structure becomes noise)
• Very low timeframes (noise overwhelms structure)
Thompson Sampling: The Bandit Algorithm
With three agents giving potentially different signals, how do we decide which to trust? This is the multi-armed bandit problem —balancing exploitation (using what works) with exploration (testing alternatives).
Thompson Sampling Solution:
Each agent maintains a Beta distribution representing its success/failure history:
Agent success rate modeled as Beta(α, β)
Where:
α = number of successful signals + 1
β = number of failed signals + 1
On Each Bar:
1. Sample from each agent's Beta distribution
2. Weight agent signals by sampled probabilities
3. Combine weighted signals into consensus
4. Update α/β based on trade outcomes
Mathematical Implementation:
// Beta sampling via Gamma ratio method
f_beta_sample(alpha, beta) =>
g1 = f_gamma_sample(alpha)
g2 = f_gamma_sample(beta)
g1 / (g1 + g2)
// Thompson Sampling selection
for each agent:
sampled_prob = f_beta_sample(agent.alpha, agent.beta)
weight = sampled_prob / sum(all_sampled_probs)
consensus += agent.signal × agent.confidence × weight
Why Thompson Sampling?
• Automatic Exploration : Agents with few samples get occasional chances (high variance in Beta distribution)
• Bayesian Optimal : Mathematically proven optimal solution to exploration-exploitation tradeoff
• Uncertainty-Aware : Small sample size = more exploration; large sample size = more exploitation
• Self-Correcting : Poor performers naturally get lower weights over time
Example Evolution:
Day 1 (Initial):
Trend Agent: Beta(1,1) → samples ~0.50 (high uncertainty)
Reversion Agent: Beta(1,1) → samples ~0.50 (high uncertainty)
Structure Agent: Beta(1,1) → samples ~0.50 (high uncertainty)
After 50 Signals:
Trend Agent: Beta(28,23) → samples ~0.55 (moderate confidence)
Reversion Agent: Beta(18,33) → samples ~0.35 (underperforming)
Structure Agent: Beta(32,19) → samples ~0.63 (outperforming)
Result: Structure Agent now receives highest weight in consensus
Consensus Requirements by Mode:
Aggressive Mode:
• Minimum 1/3 agents agreeing
• Consensus threshold: 45%
• Use case: More signals, higher risk tolerance
Balanced Mode:
• Minimum 2/3 agents agreeing
• Consensus threshold: 55%
• Use case: Standard trading
Conservative Mode:
• Minimum 2/3 agents agreeing
• Consensus threshold: 65%
• Use case: Higher quality, fewer signals
Institutional Mode:
• Minimum 2/3 agents agreeing
• Consensus threshold: 75%
• Additional: Session quality >0.65, mode adjustment +0.10
• Use case: Highest quality signals only
🌀 INTELLIGENT CHOP DETECTION ENGINE
The Chop Problem:
Most trading losses occur not from being wrong about direction, but from trading in conditions where direction doesn't exist . Choppy, range-bound markets generate false signals from every methodology—trend-following, mean-reversion, and structure-based alike.
AMWT's chop detection engine identifies these low-probability environments before signals fire, preventing the most damaging trades.
Five-Factor Chop Analysis:
Factor 1: ADX Component (25% weight)
ADX (Average Directional Index) measures trend strength regardless of direction.
ADX < 15: Very weak trend (high chop score)
ADX 15-20: Weak trend (moderate chop score)
ADX 20-25: Developing trend (low chop score)
ADX > 25: Strong trend (minimal chop score)
adx_chop = (i_adxThreshold - adx_val) / i_adxThreshold × 100
Why ADX Works: ADX synthesizes +DI and -DI movements. Low ADX means price is moving but not directionally—the definition of chop.
Factor 2: Choppiness Index (25% weight)
The Choppiness Index measures price efficiency using the ratio of ATR sum to price range:
CI = 100 × LOG10(SUM(ATR, n) / (Highest - Lowest)) / LOG10(n)
CI > 61.8: Choppy (range-bound, inefficient movement)
CI < 38.2: Trending (directional, efficient movement)
CI 38.2-61.8: Transitional
chop_idx_score = (ci_val - 38.2) / (61.8 - 38.2) × 100
Why Choppiness Index Works: In trending markets, price covers distance efficiently (low ATR sum relative to range). In choppy markets, price oscillates wildly but goes nowhere (high ATR sum relative to range).
Factor 3: Range Compression (20% weight)
Compares recent range to longer-term range, detecting volatility squeezes:
recent_range = Highest(20) - Lowest(20)
longer_range = Highest(50) - Lowest(50)
compression = 1 - (recent_range / longer_range)
compression > 0.5: Strong squeeze (potential breakout imminent)
compression < 0.2: No compression (normal volatility)
range_compression_score = compression × 100
Why Range Compression Matters: Compression precedes expansion. High compression = market coiling, preparing for move. Signals during compression often fail because the breakout hasn't occurred yet.
Factor 4: Channel Position (15% weight)
Tracks price position within the macro channel:
channel_position = (close - channel_low) / (channel_high - channel_low)
position 0.4-0.6: Center of channel (indecision zone)
position <0.2 or >0.8: Near extremes (potential reversal or breakout)
channel_chop = abs(0.5 - channel_position) < 0.15 ? high_score : low_score
Why Channel Position Matters: Price in the middle of a range is in "no man's land"—equally likely to go either direction. Signals in the channel center have lower probability.
Factor 5: Volume Quality (15% weight)
Assesses volume relative to average:
vol_ratio = volume / SMA(volume, 20)
vol_ratio < 0.7: Low volume (lack of conviction)
vol_ratio 0.7-1.3: Normal volume
vol_ratio > 1.3: High volume (conviction present)
volume_chop = vol_ratio < 0.8 ? (1 - vol_ratio) × 100 : 0
Why Volume Quality Matters: Low volume moves lack institutional participation. These moves are more likely to reverse or stall.
Combined Chop Intensity:
chopIntensity = (adx_chop × 0.25) + (chop_idx_score × 0.25) +
(range_compression_score × 0.20) + (channel_chop × 0.15) +
(volume_chop × i_volumeChopWeight × 0.15)
Regime Classifications:
Based on chop intensity and component analysis:
• Strong Trend (0-20%): ADX >30, clear directional momentum, trade aggressively
• Trending (20-35%): ADX >20, moderate directional bias, trade normally
• Transitioning (35-50%): Mixed signals, regime change possible, reduce size
• Mid-Range (50-60%): Price trapped in channel center, avoid new positions
• Ranging (60-70%): Low ADX, price oscillating within bounds, fade extremes only
• Compression (70-80%): Volatility squeeze, expansion imminent, wait for breakout
• Strong Chop (80-100%): Multiple chop factors aligned, avoid trading entirely
Signal Suppression:
When chop intensity exceeds the configurable threshold (default 80%), signals are suppressed entirely. The dashboard displays "⚠️ CHOP ZONE" with the current regime classification.
Chop Box Visualization:
When chop is detected, AMWT draws a semi-transparent box on the chart showing the chop zone. This visual reminder helps traders avoid entering positions during unfavorable conditions.
💧 LIQUIDITY ANCHORING SYSTEM
The Liquidity Concept:
Markets move from liquidity pool to liquidity pool. Stop losses cluster at predictable locations—below swing lows (buy stops become sell orders when triggered) and above swing highs (sell stops become buy orders when triggered). Institutions know where these clusters are and often engineer moves to trigger them before reversing.
AMWT identifies and tracks these liquidity events, using them as anchors for signal confidence.
Liquidity Event Types:
Type 1: Volume Spikes
Definition: Volume > SMA(volume, 20) × i_volThreshold (default 2.8x)
Interpretation: Sudden volume surge indicates institutional activity
• Near swing low + reversal: Likely accumulation
• Near swing high + reversal: Likely distribution
• With continuation: Institutional conviction in direction
Type 2: Stop Runs (Liquidity Sweeps)
Definition: Price briefly exceeds swing high/low then reverses within N bars
Detection:
• Price breaks above recent swing high (triggering buy stops)
• Then closes back below that high within 3 bars
• Signal: Bullish stop run complete, reversal likely
Or inverse for bearish:
• Price breaks below recent swing low (triggering sell stops)
• Then closes back above that low within 3 bars
• Signal: Bearish stop run complete, reversal likely
Type 3: Absorption Events
Definition: High volume with small candle body
Detection:
• Volume > 2x average
• Candle body < 30% of candle range
• Interpretation: Large orders being filled without moving price
• Implication: Accumulation (at lows) or distribution (at highs)
Type 4: BSL/SSL Pools (Buy-Side/Sell-Side Liquidity)
BSL (Buy-Side Liquidity):
• Cluster of swing highs within ATR proximity
• Stop losses from shorts sit above these highs
• Breaking BSL triggers short covering (fuel for rally)
SSL (Sell-Side Liquidity):
• Cluster of swing lows within ATR proximity
• Stop losses from longs sit below these lows
• Breaking SSL triggers long liquidation (fuel for decline)
Liquidity Pool Mapping:
AMWT continuously scans for and maps liquidity pools:
// Detect swing highs/lows using pivot function
swing_high = ta.pivothigh(high, 5, 5)
swing_low = ta.pivotlow(low, 5, 5)
// Track recent swing points
if not na(swing_high)
bsl_levels.push(swing_high)
if not na(swing_low)
ssl_levels.push(swing_low)
// Display on chart with labels
Confluence Scoring Integration:
When signals fire near identified liquidity events, confluence scoring increases:
• Signal near volume spike: +10% confidence
• Signal after liquidity sweep: +15% confidence
• Signal at BSL/SSL pool: +10% confidence
• Signal aligned with absorption zone: +10% confidence
Why Liquidity Anchoring Matters:
Signals "in a vacuum" have lower probability than signals anchored to institutional activity. A long signal after a liquidity sweep below swing lows has trapped shorts providing fuel. A long signal in the middle of nowhere has no such catalyst.
📊 SIGNAL GRADING SYSTEM
The Quality Problem:
Not all signals are created equal. A signal with 6/6 factors aligned is fundamentally different from a signal with 3/6 factors aligned. Traditional indicators treat them the same. AMWT grades every signal based on confluence.
Confluence Components (100 points total):
1. Bandit Consensus Strength (25 points)
consensus_str = weighted average of agent confidences
score = consensus_str × 25
Example:
Trend Agent: +1 signal, 0.80 confidence, 0.35 weight
Reversion Agent: 0 signal, 0.50 confidence, 0.25 weight
Structure Agent: +1 signal, 0.75 confidence, 0.40 weight
Weighted consensus = (0.80×0.35 + 0×0.25 + 0.75×0.40) / (0.35 + 0.40) = 0.77
Score = 0.77 × 25 = 19.25 points
2. HMM State Confidence (15 points)
score = hmm_confidence × 15
Example:
HMM reports 82% probability of IMPULSE_UP
Score = 0.82 × 15 = 12.3 points
3. Session Quality (15 points)
Session quality varies by time:
• London/NY Overlap: 1.0 (15 points)
• New York Session: 0.95 (14.25 points)
• London Session: 0.70 (10.5 points)
• Asian Session: 0.40 (6 points)
• Off-Hours: 0.30 (4.5 points)
• Weekend: 0.10 (1.5 points)
4. Energy/Participation (10 points)
energy = (realized_vol / avg_vol) × 0.4 + (range / ATR) × 0.35 + (volume / avg_volume) × 0.25
score = min(energy, 1.0) × 10
5. Volume Confirmation (10 points)
if volume > SMA(volume, 20) × 1.5:
score = 10
else if volume > SMA(volume, 20):
score = 5
else:
score = 0
6. Structure Alignment (10 points)
For long signals:
• Bullish structure (HH + HL): 10 points
• Higher low only: 6 points
• Neutral structure: 3 points
• Bearish structure: 0 points
Inverse for short signals
7. Trend Alignment (10 points)
For long signals:
• Price > EMA21 > EMA50: 10 points
• Price > EMA21: 6 points
• Neutral: 3 points
• Against trend: 0 points
8. Entry Trigger Quality (5 points)
• Strong trigger (multiple confirmations): 5 points
• Moderate trigger (single confirmation): 3 points
• Weak trigger (marginal): 1 point
Grade Scale:
Total Score → Grade
85-100 → A+ (Exceptional—all factors aligned)
70-84 → A (Strong—high probability)
55-69 → B (Acceptable—proceed with caution)
Below 55 → C (Marginal—filtered by default)
Grade-Based Signal Brightness:
Signal arrows on the chart have transparency based on grade:
• A+: Full brightness (alpha = 0)
• A: Slight fade (alpha = 15)
• B: Moderate fade (alpha = 35)
• C: Significant fade (alpha = 55)
This visual hierarchy helps traders instantly identify signal quality.
Minimum Grade Filter:
Configurable filter (default: C) sets the minimum grade for signal display:
• Set to "A" for only highest-quality signals
• Set to "B" for moderate selectivity
• Set to "C" for all signals (maximum quantity)
🕐 SESSION INTELLIGENCE
Why Sessions Matter:
Markets behave differently at different times. The London open is fundamentally different from the Asian lunch hour. AMWT incorporates session-aware logic to optimize signal quality.
Session Definitions:
Asian Session (18:00-03:00 ET)
• Characteristics: Lower volatility, range-bound tendency, fewer institutional participants
• Quality Score: 0.40 (40% of peak quality)
• Strategy Implications: Fade extremes, expect ranges, smaller position sizes
• Best For: Mean-reversion setups, accumulation/distribution identification
London Session (03:00-12:00 ET)
• Characteristics: European institutional activity, volatility pickup, trend initiation
• Quality Score: 0.70 (70% of peak quality)
• Strategy Implications: Watch for trend development, breakouts more reliable
• Best For: Initial trend identification, structure breaks
New York Session (08:00-17:00 ET)
• Characteristics: Highest liquidity, US institutional activity, major moves
• Quality Score: 0.95 (95% of peak quality)
• Strategy Implications: Best environment for directional trades
• Best For: Trend continuation, momentum plays
London/NY Overlap (08:00-12:00 ET)
• Characteristics: Peak liquidity, both European and US participants active
• Quality Score: 1.0 (100%—maximum quality)
• Strategy Implications: Highest probability for successful breakouts and trends
• Best For: All signal types—this is prime time
Off-Hours
• Characteristics: Thin liquidity, erratic price action, gaps possible
• Quality Score: 0.30 (30% of peak quality)
• Strategy Implications: Avoid new positions, wider stops if holding
• Best For: Waiting
Smart Weekend Detection:
AMWT properly handles the Sunday evening futures open:
// Traditional (broken):
isWeekend = dayofweek == saturday OR dayofweek == sunday
// AMWT (correct):
anySessionActive = not na(asianTime) or not na(londonTime) or not na(nyTime)
isWeekend = calendarWeekend AND NOT anySessionActive
This ensures Sunday 6pm ET (when futures open) correctly shows "Asian Session" rather than "Weekend."
Session Transition Boosts:
Certain session transitions create trading opportunities:
• Asian → London transition: +15% confidence boost (volatility expansion likely)
• London → Overlap transition: +20% confidence boost (peak liquidity approaching)
• Overlap → NY-only transition: -10% confidence adjustment (liquidity declining)
• Any → Off-Hours transition: Signal suppression recommended
📈 TRADE MANAGEMENT SYSTEM
The Signal Spam Problem:
Many indicators generate signal after signal, creating confusion and overtrading. AMWT implements a complete trade lifecycle management system that prevents signal spam and tracks performance.
Trade Lock Mechanism:
Once a signal fires, the system enters a "trade lock" state:
Trade Lock Duration: Configurable (default 30 bars)
Early Exit Conditions:
• TP3 hit (full target reached)
• Stop Loss hit (trade failed)
• Lock expiration (time-based exit)
During lock:
• No new signals of same type displayed
• Opposite signals can override (reversal)
• Trade status tracked in dashboard
Target Levels:
Each signal generates three profit targets based on ATR:
TP1 (Conservative Target)
• Default: 1.0 × ATR
• Purpose: Quick partial profit, reduce risk
• Action: Take 30-40% off position, move stop to breakeven
TP2 (Standard Target)
• Default: 2.5 × ATR
• Purpose: Main profit target
• Action: Take 40-50% off position, trail stop
TP3 (Extended Target)
• Default: 5.0 × ATR
• Purpose: Runner target for trend days
• Action: Close remaining position or continue trailing
Stop Loss:
• Default: 1.9 × ATR from entry
• Purpose: Define maximum risk
• Placement: Below recent swing low (longs) or above recent swing high (shorts)
Invalidation Level:
Beyond stop loss, AMWT calculates an "invalidation" level where the wave hypothesis dies:
invalidation = entry - (ATR × INVALIDATION_MULT × 1.5)
If price reaches invalidation, the current market interpretation is wrong—not just the trade.
Visual Trade Management:
During active trades, AMWT displays:
• Entry arrow with grade label (▲A+, ▼B, etc.)
• TP1, TP2, TP3 horizontal lines in green
• Stop Loss line in red
• Invalidation line in orange (dashed)
• Progress indicator in dashboard
Persistent Execution Markers:
When targets or stops are hit, permanent markers appear:
• TP hit: Green dot with "TP1"/"TP2"/"TP3" label
• SL hit: Red dot with "SL" label
These persist on the chart for review and statistics.
💰 PERFORMANCE TRACKING & STATISTICS
Tracked Metrics:
• Total Trades: Count of all signals that entered trade lock
• Winning Trades: Signals where at least TP1 was reached before SL
• Losing Trades: Signals where SL was hit before any TP
• Win Rate: Winning / Total × 100%
• Total R Profit: Sum of R-multiples from winning trades
• Total R Loss: Sum of R-multiples from losing trades
• Net R: Total R Profit - Total R Loss
Currency Conversion System:
AMWT can display P&L in multiple formats:
R-Multiple (Default)
• Shows risk-normalized returns
• "Net P&L: +4.2R | 78 trades" means 4.2 times initial risk gained over 78 trades
• Best for comparing across different position sizes
Currency Conversion (USD/EUR/GBP/JPY/INR)
• Converts R-multiples to currency based on:
- Dollar Risk Per Trade (user input)
- Tick Value (user input)
- Selected currency
Example Configuration:
Dollar Risk Per Trade: $100
Display Currency: USD
If Net R = +4.2R
Display: Net P&L: +$420.00 | 78 trades
Ticks
• For futures traders who think in ticks
• Converts based on tick value input
Statistics Reset:
Two reset methods:
1. Toggle Reset
• Turn "Reset Statistics" toggle ON then OFF
• Clears all statistics immediately
2. Date-Based Reset
• Set "Reset After Date" (YYYY-MM-DD format)
• Only trades after this date are counted
• Useful for isolating recent performance
🎨 VISUAL FEATURES
Macro Channel:
Dynamic regression-based channel showing market boundaries:
• Upper/lower bounds calculated from swing pivot linear regression
• Adapts to current market structure
• Shows overall trend direction and potential reversal zones
Chop Boxes:
Semi-transparent overlay during high-chop periods:
• Purple/orange coloring indicates dangerous conditions
• Visual reminder to avoid new positions
Confluence Heat Zones:
Background shading indicating setup quality:
• Darker shading = higher confluence
• Lighter shading = lower confluence
• Helps identify optimal entry timing
EMA Ribbon:
Trend visualization via moving average fill:
• EMA 8/21/50 with gradient fill between
• Green fill when bullish aligned
• Red fill when bearish aligned
• Gray when neutral
Absorption Zone Boxes:
Marks potential accumulation/distribution areas:
• High volume + small body = absorption
• Boxes drawn at these levels
• Often act as support/resistance
Liquidity Pool Lines:
BSL/SSL levels with labels:
• Dashed lines at liquidity clusters
• "BSL" label above swing high clusters
• "SSL" label below swing low clusters
Six Professional Themes:
• Quantum: Deep purples and cyans (default)
• Cyberpunk: Neon pinks and blues
• Professional: Muted grays and greens
• Ocean: Blues and teals
• Matrix: Greens and blacks
• Ember: Oranges and reds
🎓 PROFESSIONAL USAGE PROTOCOL
Phase 1: Learning the System (Week 1)
Goal: Understand AMWT concepts and dashboard interpretation
Setup:
• Signal Mode: Balanced
• Display: All features enabled
• Grade Filter: C (see all signals)
Actions:
• Paper trade ONLY—no real money
• Observe HMM state transitions throughout the day
• Note when agents agree vs disagree
• Watch chop detection engage and disengage
• Track which grades produce winners vs losers
Key Learning Questions:
• How often do A+ signals win vs B signals? (Should see clear difference)
• Which agent tends to be right in current market? (Check dashboard)
• When does chop detection save you from bad trades?
• How do signals near liquidity events perform vs signals in vacuum?
Phase 2: Parameter Optimization (Week 2)
Goal: Tune system to your instrument and timeframe
Signal Mode Testing:
• Run 5 days on Aggressive mode (more signals)
• Run 5 days on Conservative mode (fewer signals)
• Compare: Which produces better risk-adjusted returns?
Grade Filter Testing:
• Track A+ only for 20 signals
• Track A and above for 20 signals
• Track B and above for 20 signals
• Compare win rates and expectancy
Chop Threshold Testing:
• Default (80%): Standard filtering
• Try 70%: More aggressive filtering
• Try 90%: Less filtering
• Which produces best results for your instrument?
Phase 3: Strategy Development (Weeks 3-4)
Goal: Develop personal trading rules based on system signals
Position Sizing by Grade:
• A+ grade: 100% position size
• A grade: 75% position size
• B grade: 50% position size
• C grade: 25% position size (or skip)
Session-Based Rules:
• London/NY Overlap: Take all A/A+ signals
• NY Session: Take all A+ signals, selective on A
• Asian Session: Only A+ signals with extra confirmation
• Off-Hours: No new positions
Chop Zone Rules:
• Chop >70%: Reduce position size 50%
• Chop >80%: No new positions
• Chop <50%: Full position size allowed
Phase 4: Live Micro-Sizing (Month 2)
Goal: Validate paper trading results with minimal risk
Setup:
• 10-20% of intended full position size
• Take ONLY A+ signals initially
• Follow trade management religiously
Tracking:
• Log every trade: Entry, Exit, Grade, HMM State, Chop Level, Agent Consensus
• Calculate: Win rate by grade, by session, by chop level
• Compare to paper trading (should be within 15%)
Red Flags:
• Win rate diverges significantly from paper trading: Execution issues
• Consistent losses during certain sessions: Adjust session rules
• Losses cluster when specific agent dominates: Review that agent's logic
Phase 5: Scaling Up (Months 3-6)
Goal: Gradually increase to full position size
Progression:
• Month 3: 25-40% size (if micro-sizing profitable)
• Month 4: 40-60% size
• Month 5: 60-80% size
• Month 6: 80-100% size
Scale-Up Requirements:
• Minimum 30 trades at current size
• Win rate ≥50%
• Net R positive
• No revenge trading incidents
• Emotional control maintained
💡 DEVELOPMENT INSIGHTS
Why HMM Over Simple Indicators:
Early versions used standard indicators (RSI >70 = overbought, etc.). Win rates hovered at 52-55%. The problem: indicators don't capture state. RSI can stay "overbought" for weeks in a strong trend.
The insight: markets exist in states, and state persistence matters more than indicator levels. Implementing HMM with state transition probabilities increased signal quality significantly. The system now knows not just "RSI is high" but "we're in IMPULSE_UP state with 70% probability of staying in IMPULSE_UP."
The Multi-Agent Evolution:
Original version used a single analytical methodology—trend-following. Performance was inconsistent: great in trends, destroyed in ranges. Added mean-reversion agent: now it was inconsistent the other way.
The breakthrough: use multiple agents and let the system learn which works . Thompson Sampling wasn't the first attempt—tried simple averaging, voting, even hard-coded regime switching. Thompson Sampling won because it's mathematically optimal and automatically adapts without manual regime detection.
Chop Detection Revelation:
Chop detection was added almost as an afterthought. "Let's filter out obviously bad conditions." Testing revealed it was the most impactful single feature. Filtering chop zones reduced losing trades by 35% while only reducing total signals by 20%. The insight: avoiding bad trades matters more than finding good ones.
Liquidity Anchoring Discovery:
Watched hundreds of trades. Noticed pattern: signals that fired after liquidity events (stop runs, volume spikes) had significantly higher win rates than signals in quiet markets. Implemented liquidity detection and anchoring. Win rate on liquidity-anchored signals: 68% vs 52% on non-anchored signals.
The Grade System Impact:
Early system had binary signals (fire or don't fire). Adding grading transformed it. Traders could finally match position size to signal quality. A+ signals deserved full size; C signals deserved caution. Just implementing grade-based sizing improved portfolio Sharpe ratio by 0.3.
🚨 LIMITATIONS & CRITICAL ASSUMPTIONS
What AMWT Is NOT:
• NOT a Holy Grail : No system wins every trade. AMWT improves probability, not certainty.
• NOT Fully Automated : AMWT provides signals and analysis; execution requires human judgment.
• NOT News-Proof : Exogenous shocks (FOMC surprises, geopolitical events) invalidate all technical analysis.
• NOT for Scalping : HMM state estimation needs time to develop. Sub-minute timeframes are not appropriate.
Core Assumptions:
1. Markets Have States : Assumes markets transition between identifiable regimes. Violation: Random walk markets with no regime structure.
2. States Are Inferable : Assumes observable indicators reveal hidden states. Violation: Market manipulation creating false signals.
3. History Informs Future : Assumes past agent performance predicts future performance. Violation: Regime changes that invalidate historical patterns.
4. Liquidity Events Matter : Assumes institutional activity creates predictable patterns. Violation: Markets with no institutional participation.
Performs Best On:
• Liquid Futures : ES, NQ, MNQ, MES, CL, GC
• Major Forex Pairs : EUR/USD, GBP/USD, USD/JPY
• Large-Cap Stocks : AAPL, MSFT, TSLA, NVDA (>$5B market cap)
• Liquid Crypto : BTC, ETH on major exchanges
Performs Poorly On:
• Illiquid Instruments : Low volume stocks, exotic pairs
• Very Low Timeframes : Sub-5-minute charts (noise overwhelms signal)
• Binary Event Days : Earnings, FDA approvals, court rulings
• Manipulated Markets : Penny stocks, low-cap altcoins
Known Weaknesses:
• Warmup Period : HMM needs ~50 bars to initialize properly. Early signals may be unreliable.
• Regime Change Lag : Thompson Sampling adapts over time, not instantly. Sudden regime changes may cause short-term underperformance.
• Complexity : More parameters than simple indicators. Requires understanding to use effectively.
⚠️ RISK DISCLOSURE
Trading futures, stocks, options, forex, and cryptocurrencies involves substantial risk of loss and is not suitable for all investors. Adaptive Market Wave Theory, while based on rigorous mathematical frameworks including Hidden Markov Models and multi-armed bandit algorithms, does not guarantee profits and can result in significant losses.
AMWT's methodologies—HMM state estimation, Thompson Sampling agent selection, and confluence-based grading—have theoretical foundations but past performance is not indicative of future results.
Hidden Markov Model assumptions may not hold during:
• Major news events disrupting normal market behavior
• Flash crashes or circuit breaker events
• Low liquidity periods with erratic price action
• Algorithmic manipulation or spoofing
Multi-agent consensus assumes independent analytical perspectives provide edge. Market conditions change. Edges that existed historically can diminish or disappear.
Users must independently validate system performance on their specific instruments, timeframes, and broker execution environment. Paper trade extensively before risking capital. Start with micro position sizing.
Never risk more than you can afford to lose completely. Use proper position sizing. Implement stop losses without exception.
By using this indicator, you acknowledge these risks and accept full responsibility for all trading decisions and outcomes.
"Elliott Wave was a first-order approximation of market phase behavior. AMWT is the second—probabilistic, adaptive, and accountable."
Initial Public Release
Core Engine:
• True Hidden Markov Model with online Baum-Welch learning
• Viterbi algorithm for optimal state sequence decoding
• 6-state market regime classification
Agent System:
• 3-Bandit consensus (Trend, Reversion, Structure)
• Thompson Sampling with true Beta distribution sampling
• Adaptive weight learning based on performance
Signal Generation:
• Quality-based confluence grading (A+/A/B/C)
• Four signal modes (Aggressive/Balanced/Conservative/Institutional)
• Grade-based visual brightness
Chop Detection:
• 5-factor analysis (ADX, Choppiness Index, Range Compression, Channel Position, Volume)
• 7 regime classifications
• Configurable signal suppression threshold
Liquidity:
• Volume spike detection
• Stop run (liquidity sweep) identification
• BSL/SSL pool mapping
• Absorption zone detection
Trade Management:
• Trade lock with configurable duration
• TP1/TP2/TP3 targets
• ATR-based stop loss
• Persistent execution markers
Session Intelligence:
• Asian/London/NY/Overlap detection
• Smart weekend handling (Sunday futures open)
• Session quality scoring
Performance:
• Statistics tracking with reset functionality
• 7 currency display modes
• Win rate and Net R calculation
Visuals:
• Macro channel with linear regression
• Chop boxes
• EMA ribbon
• Liquidity pool lines
• 6 professional themes
Dashboards:
• Main Dashboard: Market State, Consensus, Trade Status, Statistics
📋 AMWT vs AMWT-PRO:
This version includes all core AMWT functionality:
✓ Full Hidden Markov Model state estimation
✓ 3-Bandit Thompson Sampling consensus system
✓ Complete 5-factor chop detection engine
✓ All four signal modes
✓ Full trade management with TP/SL tracking
✓ Main dashboard with complete statistics
✓ All visual features (channels, zones, pools)
✓ Identical signal generation to PRO
✓ Six professional themes
✓ Full alert system
The PRO version adds the AMWT Advisor panel—a secondary dashboard providing:
• Real-time Market Pulse situation assessment
• Agent Matrix visualization (individual agent votes)
• Structure analysis breakdown
• "Watch For" upcoming setups
• Action Command coaching
Both versions generate identical signals . The Advisor provides additional guidance for interpreting those signals.
Taking you to school. - Dskyz, Trade with probability. Trade with consensus. Trade with AMWT.
