inwCoin ActionZone - Ignore first red StrategyinwCoin Action Zone Ignore 1st Red Candle Strategy.
Description : Action Zone is easier version of painting MACD on the chart.
If MACD signal line above zero = bar will become Green = buy signal
If MACD signal line under zero = bar will become Red = sell signal
This alteration is just a proof of concept to answer these questions;
* What will happen if we just ignore the first red bar after we just enter position?
* If red bar is between entry price and stop loss price, we'll not sell the position.
* We'll sell when red bar is above entry price and stop loss price only.
* We'll also stop loss if price drop below previous high
* We can avoid the false signal by just holding position until we get stop out... is it worth? ( Compare with regular Action Zone strategy )
The Result ;
* Some assets gave better backtest result with this tweak strategy.
* But some assets perform worse than original action zone...
* After tried with Thai Stock, this strategy is no match with the original action zone.
Conclusion;
* You can try this strategy to see the result by yourself.
========================
inwCoin Action Zone Ignore 1st Red Candle Strategy ( ชื่อยาวไปไหน )
ก็ไม่มีอะไรมากครับ เอา Action Zone ตัวธรรมดามาทดสอบคอนเซ็ปที่ลุงโฉลกได้สอนไว้ ว่า
" ถ้า Action Zone เขียว แล้วแดงแรก ให้เราไม่สนมันไปก่อน"
ผมก็เลยลองเขียน backtest ขึ้นมาดู เพราะอยากรู้ว่า วิธีนี้มันจะเวิร์คหรือไม่เวิร์ค
หลังจากลองทดสอบกับ หุ้นไทย จำนวน 200 กว่าตัว ก็พบว่า...
วิธีนี้ ยังไงก็ยังได้ผลกำไรแพ้ Action Zone Quick Exit ครับ
คือมันจะมีบางตัวนะ ที่ได้กำไร ชนะ Action Zone ธรรมดา แต่หลายๆ ตัว และส่วนใหญ่ด้วย ที่ขาดทุนแล้ว ขาดทุนหนัก
ตอนนี้ ถ้าให้พูดตรงๆ ตัวกลยุทธ inwCoin Break Previous High ยังให้ผลโดยรวม ที่ค่อนข้างดีอยู่ครับ
ใครอยากเอาไปลองเล่น ก็ลองไปใส่กราฟดูได้ครับ
스크립트에서 "bar"에 대해 찾기

Liquidity Maxing [JOAT]Liquidity Maxing - Institutional Liquidity Matrix
Introduction
Liquidity Maxing is an open-source strategy for TradingView built around institutional market structure concepts. It identifies structural shifts, evaluates trades through multi-factor confluence, and implements layered risk controls.
The strategy is designed for swing trading on 4-hour timeframes, focusing on how institutional order flow manifests in price action through structure breaks, inducements, and liquidity sweeps.
Core Functionality
Liquidity Maxing performs three primary functions:
Tracks market structure to identify when control shifts between buyers and sellers
Scores potential trades using an eight-factor confluence system
Manages position sizing and risk exposure dynamically based on volatility and user-defined limits
The goal is selective trading when multiple conditions align, rather than frequent entries.
Market Structure Engine
The structure engine tracks three key events:
Break of Structure (BOS): Price pushes beyond a prior pivot in the direction of trend
Change of Character (CHoCH): Control flips from bullish to bearish or vice versa
Inducement Sweeps (IDM): Market briefly runs stops against trend before moving in the real direction
The structure module continuously updates strong highs and lows, labeling structural shifts visually. IDM markers are optional and disabled by default to maintain chart clarity.
The trade engine requires valid structure alignment before considering entries. No structure, no trade.
Eight-Factor Confluence System
Instead of relying on a single indicator, Liquidity Maxing uses an eight-factor scoring system:
Structure alignment with current trend
RSI within healthy bands (different ranges for up and down trends)
MACD momentum agreement with direction
Volume above adaptive baseline
Price relative to main trend EMA
Session and weekend filter (configurable)
Volatility expansion/contraction via ATR shifts
Higher-timeframe EMA confirmation
Each factor contributes one point to the confluence score. The default minimum confluence threshold is 6 out of 8, but you can adjust this from 1-8 based on your preference for trade frequency versus selectivity.
Only when structure and confluence agree does the strategy proceed to risk evaluation.
Dynamic Risk Management
Risk controls are implemented in multiple layers:
ATR-based stops and targets with configurable risk-to-reward ratio (default 2:1)
Volatility-adjusted position sizing to maintain consistent risk per trade as ranges expand or compress
Daily and weekly risk budgets that halt new entries once thresholds are reached
Correlation cooldown to prevent clustered trades in the same direction
Global circuit breaker with maximum drawdown limit and emergency kill switch
If any guardrail is breached, the strategy will not open new positions. The dashboard clearly displays risk state for transparency.
Market Presets
The strategy includes configuration presets optimized for different market types:
Crypto (BTC/ETH): RSI bands 70/30, volume multiplier 1.2, enhanced ATR scaling
Forex Majors: RSI bands 75/25, volume multiplier 1.5
Indices (SPY/QQQ): RSI bands 70/30, volume multiplier 1.3
Custom: Default values for user customization
For crypto assets, the strategy automatically applies ATR volatility scaling to account for higher volatility characteristics.
Monitoring and Dashboards
The strategy includes optional monitoring layers:
Risk Operations Dashboard (top-right):
Trend state
Confluence score
ATR value
Current position size percentage
Global drawdown
Daily and weekly risk consumption
Correlation guard state
Alert mode status
Performance Console (top-left):
Net profit
Current equity
Win rate percentage
Average trade value
Sharpe-style ratio (rolling 50-bar window)
Profit factor
Open trade count
Optional risk tint on chart background provides visual indication of "safe to trade" versus "halted" state.
All visualization elements can be toggled on/off from the inputs for clean chart viewing or full telemetry during parameter tuning.
Alerts and Automation
The strategy supports alert integration with two formats:
Standard alerts: Human-readable messages for long, short, and risk-halt conditions
Webhook format: JSON-formatted payloads ready for external execution systems (optional)
Alert messages are predictable and unambiguous, suitable for manual review or automated forwarding to execution engines.
Built-in Validation Suite
The strategy includes an optional validation layer that can be enabled from inputs. It checks:
Internal consistency of structure and confluence metrics
Sanity and ordering of risk parameters
Position sizing compliance with user-defined floors and caps
This validation is optional and not required for trading, but provides transparency into system operation during development or troubleshooting.
Strategy Parameters
Market Presets:
Configuration Preset: Choose between Crypto (BTC/ETH), Forex Majors, Indices (SPY/QQQ), or Custom
Market Structure Architecture:
Pivot Length: Default 5 bars
Filter by Inducement (IDM): Default enabled
Visualize Structure: Default enabled
Structure Lookback: Default 50 bars
Risk & Capital Preservation:
Risk:Reward Ratio: Default 2.0
ATR Period: Default 14
ATR Multiplier (Stop): Default 2.0
Max Drawdown Circuit Breaker: Default 10%
Risk per Trade (% Equity): Default 1.5%
Daily Risk Limit: Default 6%
Weekly Risk Limit: Default 12%
Min Position Size (% Equity): Default 0.25%
Max Position Size (% Equity): Default 5%
Correlation Cooldown (bars): Default 3
Emergency Kill Switch: Default disabled
Signal Confluence:
RSI Length: Default 14
Trend EMA: Default 200
HTF Confirmation TF: Default Daily
Allow Weekend Trading: Default enabled
Minimum Confluence Score (0-8): Default 6
Backtesting Considerations
When backtesting this strategy, consider the following:
Commission: Default 0.05% (adjustable in strategy settings)
Initial Capital: Default $100,000 (adjustable)
Position Sizing: Uses percentage of equity (default 2% per trade)
Timeframe: Optimized for 4-hour charts, though can be tested on other timeframes
Results will vary significantly based on:
Market conditions and volatility regimes
Parameter settings, especially confluence threshold
Risk limit configuration
Symbol characteristics (crypto vs forex vs equities)
Past performance does not guarantee future results. Win rate, profit factor, and other metrics should be evaluated in context of drawdown periods, trade frequency, and market conditions.
How to Use This Strategy
This is a framework that requires understanding and parameter tuning, not a one-size-fits-all solution.
Recommended workflow:
Start on 4-hour timeframe with default parameters and appropriate market preset
Run backtests and study performance console metrics: focus on drawdown behavior, win rate, profit factor, and trade frequency
Adjust confluence threshold to match your risk appetite—higher thresholds mean fewer but more selective trades
Set realistic daily and weekly risk budgets appropriate for your account size and risk tolerance
Consider ATR multiplier adjustments based on market volatility characteristics
Only connect alerts or automation after thorough testing and parameter validation
Treat this as a risk framework with an integrated entry engine, not merely an entry signal generator. The risk controls are as important as the trade signals.
Strategy Limitations
Designed for swing trading timeframes; may not perform optimally on very short timeframes
Requires sufficient market structure to identify pivots; may struggle in choppy or low-volatility environments
Crypto markets require different parameter tuning than traditional markets
Risk limits may prevent entries during favorable setups if daily/weekly budgets are exhausted
Correlation cooldown may delay entries that would otherwise be valid
Backtesting results depend on data quality and may not reflect live trading with slippage
Design Philosophy
Many indicators tell you when price crossed a moving average or RSI left oversold. This strategy addresses questions institutional traders ask:
Who is in control of the market right now?
Is this move structurally significant or just noise?
Do I want to add more risk given what I've already done today/week?
If I'm wrong, exactly how painful can this be?
The strategy provides disciplined, repeatable answers to these questions through systematic structure analysis, confluence filtering, and multi-layer risk management.
Technical Implementation
The strategy uses Pine Script v6 with:
Custom types for structure, confluence, and risk state management
Functional programming approach for reusable calculations
State management through persistent variables
Optional visual elements that can be toggled independently
The code is open-source and can be modified to suit individual needs. All important logic is visible in the source code.
Disclaimer
This script is provided for educational and informational purposes only. It is not intended as financial, investment, trading, or any other type of advice or recommendation. Trading involves substantial risk of loss and is not suitable for all investors. Past performance, whether real or indicated by historical tests of strategies, is not indicative of future results.
No representation is being made that any account will or is likely to achieve profits or losses similar to those shown. In fact, there are frequently sharp differences between backtested results and actual results subsequently achieved by any particular trading strategy.
The user should be aware of the risks involved in trading and should trade only with risk capital. The authors and publishers of this script are not responsible for any losses or damages, including without limitation, any loss of profit, which may arise directly or indirectly from use of or reliance on this script.
This strategy uses technical analysis methods and indicators that are not guaranteed to be accurate or profitable. Market conditions change, and strategies that worked in the past may not work in the future. Users should thoroughly test any strategy in a paper trading environment before risking real capital.
Commission and slippage settings in backtests may not accurately reflect live trading conditions. Real trading results will vary based on execution quality, market liquidity, and other factors not captured in backtesting.
The user assumes full responsibility for all trading decisions made using this script. Always consult with a qualified financial advisor before making investment decisions.
Enjoy - officialjackofalltrades

ChronoPulse MS-MACD Resonance StrategyChronoPulse MS-MACD Resonance Strategy
A systematic trading strategy that combines higher-timeframe market structure analysis with dual MACD momentum confirmation, ATR-based risk management, and real-time quality assurance monitoring.
Core Principles
The strategy operates on the principle of multi-timeframe confluence, requiring agreement between:
Market structure breaks (CHOCH/BOS) on a higher timeframe
Dual MACD momentum confirmation (classic and crypto-tuned profiles)
Trend alignment via directional EMAs
Volatility and volume filters
Quality score composite threshold
Strategy Components
Market Structure Engine : Detects Break of Structure (BOS) and Change of Character (CHOCH) events using confirmed pivots on a configurable higher timeframe. Default structure timeframe is 240 minutes (4H).
Dual MACD Fusion : Requires agreement between two MACD configurations:
Classic MACD: 12/26/9 (default)
Fusion MACD: 8/21/5 (default, optimized for crypto volatility)
Both must agree on direction before trade execution. This can be disabled to use single MACD confirmation.
Trend Alignment : Uses two EMAs for directional bias:
Directional EMA: 55 periods (default)
Execution Trend Guide: 34 periods (default)
Both must align with trade direction.
ATR Risk Management : All risk parameters are expressed in ATR multiples:
Stop Loss: 1.5 × ATR (default)
Take Profit: 3.0 × ATR (default)
Trail Activation: 1.0 × ATR profit required (default)
Trail Distance: 1.5 × ATR behind price (default)
Volume Surge Filter : Optional gate requiring current volume to exceed a multiple of the volume SMA. Default threshold is 1.4× the 20-period volume SMA.
Quality Score Gate : Composite score (0-1) combining:
Structure alignment (0.0-1.0)
Momentum strength (0.0-1.0)
Trend alignment (0.0-1.0)
ATR volatility score (0.0-1.0)
Volume intensity (0.0-1.0)
Default threshold: 0.62. Trades only execute when quality score exceeds this threshold.
Execution Discipline : Trade budgeting system:
Maximum trades per session: 6 (default)
Cooldown bars between entries: 5 (default)
Quality Assurance Console : Real-time monitoring panel displaying:
Structure status (pass/fail)
Momentum confirmation (pass/fail)
Volatility readiness (pass/fail)
Quality score (pass/fail)
Discipline compliance (pass/fail)
Performance metrics (win rate, profit factor)
Net PnL
Certification requires: Win Rate ≥ 40%, Profit Factor ≥ 1.4, Minimum 25 closed trades, and positive net profit.
Integrity Suite : Optional validation panel that audits:
Configuration sanity checks
ATR data readiness
EMA hierarchy validity
Performance realism checks
Strategy Settings
strategy(
title="ChronoPulse MS-MACD Resonance Strategy",
shorttitle="ChronPulse",
overlay=true,
max_labels_count=500,
max_lines_count=500,
initial_capital=100000,
currency=currency.USD,
pyramiding=0,
commission_type=strategy.commission.percent,
commission_value=0.015,
slippage=2,
default_qty_type=strategy.percent_of_equity,
default_qty_value=2.0,
calc_on_order_fills=true,
calc_on_every_tick=true,
process_orders_on_close=true
)
Key Input Parameters
Structure Timeframe : 240 (4H) - Higher timeframe for structure analysis
Structure Pivot Left/Right : 3/3 - Pivot confirmation periods
Structure Break Buffer : 0.15% - Buffer for structure break confirmation
MACD Fast/Slow/Signal : 12/26/9 - Classic MACD parameters
Fusion MACD Fast/Slow/Signal : 8/21/5 - Crypto-tuned MACD parameters
Directional EMA Length : 55 - Primary trend filter
Execution Trend Guide : 34 - Secondary trend filter
ATR Length : 14 - ATR calculation period
ATR Stop Multiplier : 1.5 - Stop loss in ATR units
ATR Target Multiplier : 3.0 - Take profit in ATR units
Trail Activation : 1.0 ATR - Profit required before trailing
Trail Distance : 1.5 ATR - Distance behind price
Volume Threshold : 1.4× - Volume surge multiplier
Quality Threshold : 0.62 - Minimum quality score (0-1)
Max Trades Per Session : 6 - Daily trade limit
Cooldown Bars : 5 - Bars between entries
Win-Rate Target : 40% - Minimum for QA certification
Profit Factor Target : 1.4 - Minimum for QA certification
Minimum Trades for QA : 25 - Required closed trades
Signal Generation Logic
A trade signal is generated when ALL of the following conditions are met:
Higher timeframe structure shows bullish (CHOCH/BOS) or bearish structure break
Both MACD profiles agree on direction (if fusion enabled)
Price is above both EMAs for longs (below for shorts)
ATR data is ready and above minimum threshold
Volume exceeds threshold × SMA (if volume gate enabled)
Quality score ≥ quality threshold
Trade budget available (under max trades per day)
Cooldown period satisfied
Risk Management
Stop loss and take profit are set immediately on entry
Trailing stop activates after 1.0 ATR of profit
Trailing stop maintains 1.5 ATR distance behind highest profit point
Position sizing uses 2% of equity per trade (default)
No pyramiding (single position per direction)
Limitations and Considerations
The strategy requires sufficient historical data for higher timeframe structure analysis
Quality gate may filter out many potential trades, reducing trade frequency
Performance metrics are based on historical backtesting and do not guarantee future results
Commission and slippage assumptions (0.015% + 2 ticks) may vary by broker
The strategy is optimized for trending markets with clear structure breaks
Choppy or ranging markets may produce false signals
Crypto markets may require different parameter tuning than traditional assets
Optimization Notes
The strategy includes several parameters that can be tuned for different market conditions:
Quality Threshold : Lower values (0.50-0.60) allow more trades but may reduce average quality. Higher values (0.70+) are more selective but may miss opportunities.
Structure Timeframe : Use 240 (4H) for intraday trading, Daily for swing trading, Weekly for position trading
Volume Gate : Disable for low-liquidity pairs or when volume data is unreliable
Dual MACD Fusion : Disable for mean-reverting markets where single MACD may be more responsive
Trade Discipline : Adjust max trades and cooldown based on your risk tolerance and market volatility
Non-Repainting Guarantee
All higher timeframe data requests use lookahead=barmerge.lookahead_off to prevent repainting. Pivot detection waits for full confirmation before registering structure breaks. All visual elements (tables, labels) update only on closed bars.
Alerts
Three alert conditions are available:
ChronoPulse Long Setup : Fires when all long entry conditions are met
ChronoPulse Short Setup : Fires when all short entry conditions are met
ChronoPulse QA Certification : Fires when Quality Assurance console reaches CERTIFIED status
Configure alerts with "Once Per Bar Close" delivery to match the non-repainting design.
Visual Elements
Structure Labels : CHOCH↑, CHOCH↓, BOS↑, BOS↓ markers on structure breaks
Directional EMA : Orange line showing trend bias
Trailing Stop Lines : Green (long) and red (short) trailing stop levels
Dashboard Panel : Real-time status display (structure, MACD, ATR, quality, PnL)
QA Console : Quality assurance monitoring panel
Integrity Suite Panel : Optional validation status display
Recommended Usage
Forward test with paper trading before live deployment
Monitor the QA console until it reaches CERTIFIED status
Adjust parameters based on your specific market and timeframe
Respect the trade discipline limits to avoid over-trading
Review quality scores and adjust threshold if needed
Use appropriate commission and slippage settings for your broker
Technical Implementation
The strategy uses Pine Script v6 with the following key features:
Multi-timeframe data requests with lookahead protection
Confirmed pivot detection for structure analysis
Dynamic trailing stop management
Real-time quality score calculation
Trade budgeting and cooldown enforcement
Comprehensive dashboard and monitoring panels
All source code is open and available for review and modification.
Disclaimer
This script is for educational and informational purposes only. It is not intended as financial, investment, or trading advice. Past performance does not guarantee future results. Trading involves substantial risk of loss and is not suitable for all investors. Always conduct your own research and consult with a qualified financial advisor before making any trading decisions. The author and TradingView are not responsible for any losses incurred from using this strategy.

US Market Long Horizon Momentum Summary in one paragraph
US Market Long Horizon Momentum is a trend following strategy for US index ETFs and futures built around a single eighteen month time series momentum measure. It helps you stay long during persistent bull regimes and step aside or flip short when long term momentum turns negative.
Scope and intent
• Markets. Large cap US equity indices, liquid US index ETFs, index futures
• Timeframes. 4h/ Daily charts
• Default demo used in the publication. SPY on 4h timeframe chart
• Purpose. Provide a minimal long bias index timing model that can reduce deep drawdowns and capture major cycles without parameter mining
• Limits. This is a strategy. Orders are simulated on standard candles only
Originality and usefulness
• Unique concept or fusion. One unscaled multiple month log return of an external benchmark symbol drives all entries and exits, with optional volatility targeting as a single risk control switch.
• Failure mode addressed. Fully passive buy and hold ignores the sign of long horizon momentum and can sit through multi year drawdowns. This script offers a way to step down risk in prolonged negative momentum without chasing short term noise.
• Testability. All parameters are visible in Inputs and the momentum series is plotted so users can verify every regime change in the Tester and on price history.
• Portable yardstick. The log return over a fixed window is a unit that can be applied to any liquid symbol with daily data.
Method overview in plain language
The method looks at how far the benchmark symbol has moved in log return terms over an eighteen month window in our example. If that long horizon return is positive the strategy allows a long stance on the traded symbol. If it is negative and shorts are enabled the strategy can flip short, otherwise it goes flat. There is an optional realised volatility estimate on the traded symbol that can scale position size toward a target annual volatility, but in the default configuration the model uses unit leverage and only the sign of momentum matters.
Base measures
Return basis. The core yardstick is the natural log of close divided by the close eighteen months ago on the benchmark symbol. Daily log returns of the traded symbol feed the realised volatility estimate when volatility targeting is enabled.
Components
• Component one Momentum eighteen months. Log of benchmark close divided by its close mom_lookback bars ago. Its sign defines the trend regime. No extra smoothing is applied beyond the long window itself.
• Component two Realised volatility optional. Standard deviation of daily log returns on the traded symbol over sixty three days. Annualised by the square root of 252. Used only when volatility targeting is enabled.
• Optional component Volatility targeting. Converts target annual volatility and realised volatility into a leverage factor clipped by a maximum leverage setting.
Fusion rule
The model uses a simple gate. First compute the sign of eighteen month log momentum on the benchmark symbol. Optionally compute leverage from volatility. The sign decides whether the strategy wants to be long, short, or flat. Leverage only rescales position size when enabled and does not change direction.
Signal rule
• Long suggestion. When eighteen month log momentum on the benchmark symbol is greater than zero, the strategy wants to be long.
• Short suggestion. When that log momentum is less than zero and shorts are allowed, the strategy wants to be short. If shorts are disabled it stays flat instead.
• Wait state. When the log momentum is exactly zero or history is not long enough the strategy stays flat.
• In position. In practice the strategy sits IN LONG while the sign stays positive and flips to IN SHORT or flat only when the sign changes.
Inputs with guidance
Setup
• Momentum Lookback (months). Controls the horizon of the log return on the benchmark symbol. Typical range 6 to 24 months. Raising it makes the model slower and more selective. Lowering it makes it more reactive and sensitive to medium term noise.
• Symbol. External symbol used for the momentum calculation, SPY by default. Changing it lets you time other indices or run signals from a benchmark while trading a correlated instrument.
Logic
• Allow Shorts. When true the strategy will open short positions during negative momentum regimes. When false it will stay flat whenever momentum is negative. Practical setting is tied to whether you use a margin account or an ETF that supports shorting.
Internal risk parameters (not exposed as inputs in this version) are:
• Target Vol (annual). Target annual volatility for volatility targeting, default 0.2.
• Vol Lookback (days). Window for realised volatility, default 63 trading days.
• Max Leverage. Cap on leverage when volatility targeting is enabled, default 2.
Usage recipes
Swing continuation
• Signal timeframe. Use the daily chart.
• Benchmark symbol. Leave at SPY for US equity index exposure.
• Momentum lookback. Eighteen months as a default, with twelve months as an alternative preset for a faster swing bias.
Properties visible in this publication
• Initial capital. 100000
• Base currency. USD
• Default order size method. 5% of the total capital in this example
• Pyramiding. 0
• Commission. 0.03 percent
• Slippage. 3 ticks
• Process orders on close. On
• Bar magnifier. Off
• Recalculate after order is filled. Off
• Calc on every tick. Off
• All request.security calls use lookahead = barmerge.lookahead_off
Realism and responsible publication
The strategy is for education and research only. It does not claim any guaranteed edge or future performance. All results in Strategy Tester are hypothetical and depend on the data vendor, costs, and slippage assumptions. Intrabar motion is not modeled inside daily bars so extreme moves and gaps can lead to fills that differ from live trading. The logic is built for standard candles and should not be used on synthetic chart types for execution decisions.
Performance is sensitive to regime structure in the US equity market, which may change over time. The strategy does not protect against single day crash risk inside bars and does not model gap risk explicitly. Past behavior of SPY and the momentum effect does not guarantee future persistence.
Honest limitations and failure modes
• Long sideways regimes with small net change over eighteen months can lead to whipsaw around the zero line.
• Very sharp V shaped reversals after deep declines will often be missed because the model waits for momentum to turn positive again.
• The sample size in a full SPY history is small because regime changes are infrequent, so any test must be interpreted as indicative rather than statistically precise.
• The model is highly dependent on the chosen lookback. Users should test nearby values and validate that behavior is qualitatively stable.
Legal
Education and research only. Not investment advice. You are responsible for your own decisions. Always test on historical data and in simulation with realistic costs before any live use.

Inyerneck Quiet Bottom Hunter v36 — Last Sorta-Working VersionQuiet Bottom Hunter v36 — Accurate Description (the sorta-working version that fires signals)
Overview
A mean-reversion bottom-hunting strategy for small-cap stocks (<$2B market cap). Designed to catch slow-bleed stocks that quietly bottom out and rebound 20–60%+. Good for beginners because signals are infrequent and the setup is easy to understand.
Timeframe
Daily (D) — best results on 1-day charts. Works on weekly too, but signals are rarer.
Triggers / Conditions (all must be true at bar close)
Drop from high ≥ 25% from the highest high in the last 100 bars (previous bars only — no repainting)
Volume ≤ 80% of the 50-day average (quiet accumulation, no panic selling left)
RSI(14) ≤ 38 (oversold territory)
Green/flat streak ≥ 2 consecutive days where close ≥ open (shows sellers are exhausted)
When all four line up → tiny green “QB” triangle below the bar
Firing Frequency
1–4 signals per month on an average small-cap stock (depends on market conditions). Some months zero, some months a handful. Not spammy, but not ultra-rare either.
Usage Parameters
Position size: 10% of equity per trade (default — change to 5–20% depending on risk tolerance)
Profit target: 40%
Stop loss: 12%
Hold time: usually 2–8 weeks
Best on low-float, high-volatility small caps (TLRY, SNDL, MVIS, SOUN, INHD, etc.)
Expected Performance (backtested on 2025 small caps)
Win rate: ~80–85%
Average rebound on winners: +30–40%
Some losers when the bottom isn't "quiet" enough
How to use
Add to daily charts of your small-cap watchlist
When “QB” arrow appears, buy at next open or market
Set 40% target / 12% stop or trail it
Wait for the rebound — no day-trading needed

Mean Reversion — BB + Z-Score + RSI + EMA200 (TP at Opposite Z)This is a systematic mean-reversion framework for index futures and other liquid assets.
This strategy combines Bollinger Bands, Z-Score dislocation, RSI extremes, and a trend-filtering EMA200 to capture short-term mean-reversion inefficiencies in NQ1!. It is designed for high-volatility conditions and uses a precise exit model based on opposite-side Z-Score targets and dynamic mid-band failure detection.
🔍 Entry Logic (Mean Reversion) :
The strategy enters trades only when multiple confluence signals align:
Long Setup
Price at or below the lower Bollinger Band
Z-Score ≤ –Threshold (deep statistical deviation)
RSI ≤ oversold level
Price below the EMA-200 (countertrend mean-reversion only)
Cooldown must be completed
No open position
Short Setup
Price at or above the upper Bollinger Band
Z-Score ≥ Threshold
RSI ≥ overbought level
Price above the EMA-200
Cooldown complete
No open position
This multi-signal gate filters out weak reversions and focuses on mature dislocations.
🎯 Take-Profit Model: Opposite-Side Z-Score Target :
Once in a trade, take-profit is set by solving for the price where the Z-Score reaches the opposite side:
Long TP = Z = +Threshold
Short TP = Z = –Threshold
This creates a symmetric statistical exit based on reverting to equilibrium plus overshoot.
🛡️ Stop-Loss System (Volatility-Aware) :
Stop losses combine:
A fixed base stop (points)
A standard-deviation volatility component
This adapts the SL to regime changes and avoids being shaken out during rare volatility spikes.
⏳ Half-Life Exit :
If a trade has not reverted within a fixed number of bars, it automatically closes.
This prevents “mean-reversion traps” during trending periods.
📉 Advanced Mid-Band Exit Logic (BB Basis Failure) :
This is the unique feature of the system.
After entry:
Wait for price to cross the Bollinger Basis (middle band) in the direction of the mean.
Start a 5-bar delay timer.
After 5 bars, the strategy becomes “armed.”
Once armed:
If price fails back through the mean, exit immediately.
Intrabar exits trigger precisely (with tick-level precision if Bar Magnifier is enabled).
This protects profits and exits trades at the first sign of mean-failure.
⏱️ Cooldown System :
After each closed trade, a cooldown period prevents immediate re-entry.
This avoids clustering and improves statistical independence of trades.
🖥️ What This Strategy Is Best For :
High-volatility intraday NQ conditions
Statistical mean reversion with structured confluence
Traders who want clean, rule-based entries
Avoiding trend-day traps using EMA and half-life logic
📊 Included Visual Elements :
Bollinger Bands (Upper, Basis, Lower)
BUY/SELL markers at signal generation
Optional alerts for automated monitoring
🚀 Summary :
This is a precision mean-reversion system built around volatility bands, statistical dislocation, and price-behavior confirmation. By combining Z-Score, RSI, EMA200 filtering, and a sophisticated mid-band failure exit, this model captures high-probability reversions while avoiding the common pitfalls of naive band-touch systems.

EVS BTC V1Overview
The "EVS BTC V1" is a momentum-based trading strategy designed for Bitcoin (BTC) or similar volatile assets on TradingView. It combines Exponential Moving Averages (EMAs) for trend direction, volume confirmation to filter for strong moves, and an optional Relative Strength Index (RSI) filter to avoid overextended entries. The strategy uses a trailing stop for exits to lock in profits dynamically. It's set up for backtesting with an initial capital of $10,000, risking 10% of equity per trade, and accounting for 0.1% commissions.This is a crossover strategy: it goes long on bullish EMA crossovers with high volume (and RSI not overbought) and short on bearish crossunders (with high volume and RSI not oversold). It's overlayed on the main price chart for easy visualization.Key Parameters (User-Adjustable)Fast EMA Period: 9 (default) – Shorter-term trend line.
Slow EMA Period: 21 (default) – Longer-term trend line.
Volume Multiplier: 1.5 (default) – Requires volume to be 1.5x the 20-period average for signal validation.
Use RSI Filter?: Enabled (default) – Optional toggle to apply RSI conditions.
RSI Period: 14 (default), with overbought threshold at 70 and oversold at 30.
Trailing Stop Profit: 50 points (default) – Activates trailing once this profit level is hit.
Trailing Stop Offset: 20 points (default) – Distance from the high/low to trail the stop-loss.
Indicators UsedEMAs: 9-period (fast, blue line) and 21-period (slow, red line) on close prices.
Volume Filter: Compares current volume to a 20-period SMA; signals only trigger if volume exceeds the average by the multiplier (highlighted in yellow bars).
RSI: 14-period on close; plotted in purple on a sub-panel if enabled, with dashed horizontal lines at 70 (overbought) and 30 (oversold).
Entry RulesEntries are triggered only when all conditions align on a bar close:Direction
Conditions
Long (Buy)
- Fast EMA crosses over Slow EMA (bullish trend shift).
- Volume is "high" (> 1.5x 20-period avg).
- RSI < 70 (not overbought; skipped if filter disabled).
Short (Sell)
- Fast EMA crosses under Slow EMA (bearish trend shift).
- Volume is "high" (> 1.5x 20-period avg).
- RSI > 30 (not oversold; skipped if filter disabled).
On entry: Places a market order using 10% of current equity.
Alerts: Fires a one-time alert per bar (e.g., "Long Signal: EMA Crossover + High Volume!").
Exit RulesNo fixed take-profit or stop-loss on entry.
Uses a trailing stop for both long and short positions:Trails the stop-loss 20 points below the highest high (for longs) or 20 points above the lowest low (for shorts), but only activates after 50 points of unrealized profit.
This allows winners to run while protecting gains dynamically.
Positions close automatically on opposite signals or trailing stop hits (no pyramiding; only one position per direction at a time).
VisualizationMain Chart: Blue fast EMA and red slow EMA lines. Green background tint on long signals, red on short signals.
Volume Sub-Panel: Gray columns for normal volume, yellow for high-volume bars; zero line for reference.
RSI Sub-Panel (if enabled): Purple RSI line with overbought/oversold dashed lines.
Strengths and ConsiderationsStrengths: Simple, trend-following with volume to avoid weak signals; RSI adds mean-reversion protection; trailing stops suit trending markets like BTC.
Risks: Whipsaws in sideways markets (EMA crossovers can false-signal); volume filter may miss low-volume breakouts; trailing parameters (50/20 points) assume a specific price scale (e.g., BTC/USD in dollars—adjust for other pairs).
Best For: Higher timeframes (e.g., 1H or 4H) on volatile crypto pairs. Backtest on historical data to tune parameters.

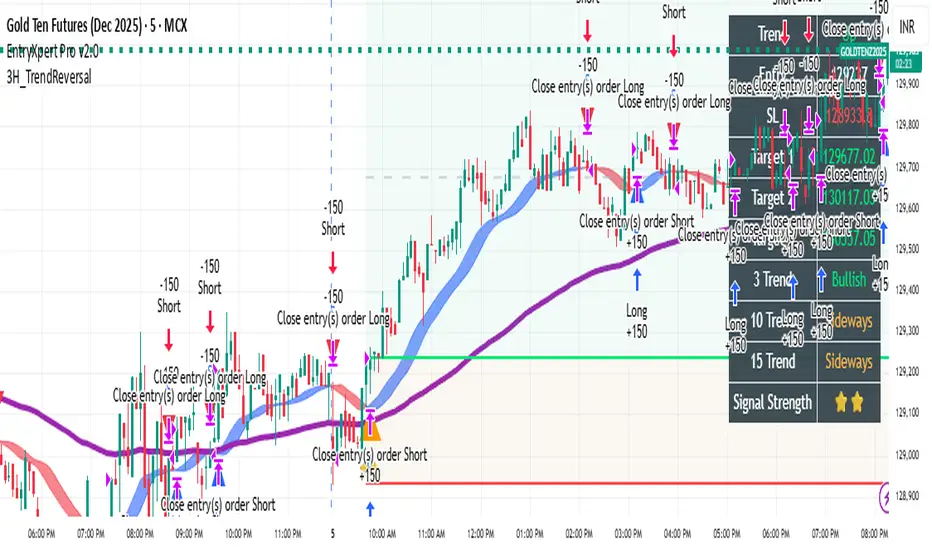
TrendReversalStrategy Description
This is a noise-filtered, intraday reversal strategy that uses advanced Hull Moving Average (HULL) crossovers to generate fast and reliable trade signals with minimal false breakouts.
Key Features:
Core Logic: The strategy employs a Hull Moving Average (HULL) calculated using three selectable MA modes—HMA, EHMA, or THMA. It generates buy signals when the signal line (SHULL) crosses below the main HULL line, and sell signals when SHULL crosses above HULL. This crossover approach identifies momentum reversals with reduced repainting.
Noise Filtering: Built-in cooldown mechanism prevents consecutive same-side signals, reducing whipsaws. Users can adjust the minimum bars between same-side signals (default: 2 bars) to customize signal frequency and filter noise.
Trend Filter (Optional): An optional EMA(100) trend filter allows traders to only take long trades above the 100-period EMA and short trades below it, adding directional bias and improving win rate on trending days.
Customizable Inputs:
MA Mode: Choose between HMA, EHMA, or THMA
Length: Default 16 (adjustable 1+)
Length Multiplier: Fine-tune HULL sensitivity
Cooldown Bars: Control signal frequency (1–50 bars)
Band Visualization: Toggle HULL band display for visual support/resistance
Trend Filter: Optional EMA(100) directional bias
Position Management: Reversal-style entries close opposing positions before entering new trades. Position sizing defaults to 10% of equity per trade (adjustable).
Ideal For: Intraday traders, scalpers, and swing traders seeking a clean, signal-based system with minimal false entries on volatile instruments.
Note: This strategy performs best on high-volatility assets and intraday timeframes (5m–60m). Backtest and paper trade before live deployment.
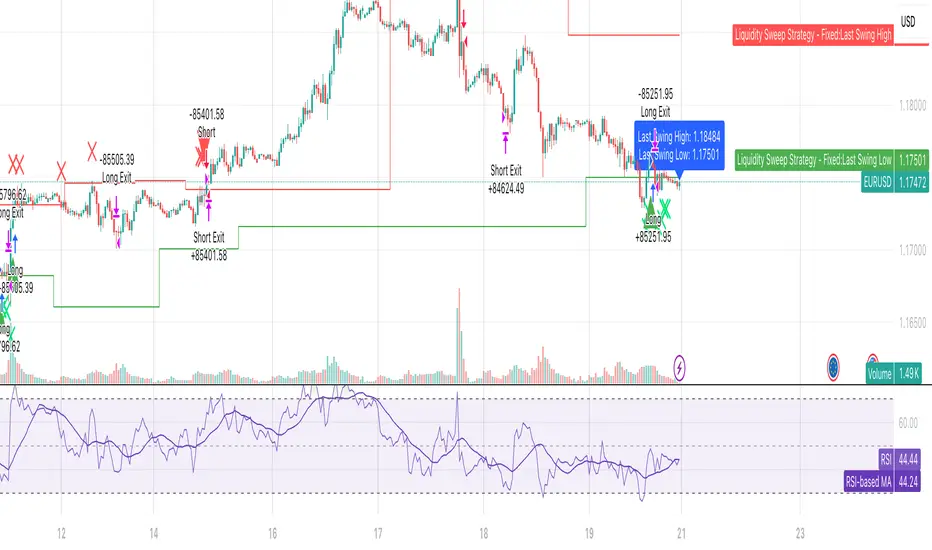
Liquidity Sweep & FVG StrategyThis strategy combines higher-timeframe liquidity levels, stop-hunt (sweep) logic, Fair Value Gaps (FVGs) and structure-based take-profits into a single execution engine.
It is not a simple mash-up of indicators: every module (HTF levels, sweeps, FVGs, ZigZag, sessions) feeds the same entry/exit logic.
1. Core Idea
The script looks for situations where price:
Sweeps a higher-timeframe high/low (takes liquidity around obvious levels),
Then forms a displacement candle with a gap (FVG) in the opposite direction,
Then uses the edge of that FVG as a limit entry,
And manages exits using unswept structural levels (ZigZag swings or HTF levels) as targets.
The intent is to systematically trade failed breakouts / stop hunts with a defined structure and risk model.
It is a backtesting / study tool, not a signal service.
2. How the Logic Works (Conceptual)
a) Higher-Timeframe Liquidity Engine
Daily, Weekly and Monthly highs/lows are pulled via request.security() and stored as HTF liquidity levels.
Each level is drawn as a line with optional label (1D/1W/1M High/Low).
A level is marked as “swept” once price trades through it; swept levels may be removed or shortened depending on settings.
b) Sweep & Manipulation Filter
A low sweep occurs when the current low trades through a stored HTF low.
A high sweep occurs when the current high trades through a stored HTF high.
If both a high and a low are swept in the same bar, the script flags this as “manipulation” and blocks new entries around that noise.
The script also tracks the sweep wick, bar index and HTF timeframe for later use in SL placement and labels.
c) FVG Detection & Management
FVGs are defined using a 3-candle displacement model:
Bullish FVG: high < low
Bearish FVG: low > high
Only gaps larger than a minimum size (ATR-based if no manual value is set) are kept.
FVGs are stored in arrays as boxes with: top, bottom, mid (CE), direction, and state (filled / reclaimed).
Boxes are auto-extended and visually faded when price is far away, or deleted when filled.
d) Entry Conditions (Sweep + FVG)
For each recent sweep window:
After a low sweep, the script searches for the nearest bullish FVG below price and uses its top edge as a long limit entry.
After a high sweep, it searches for the nearest bearish FVG above price and uses its bottom edge as a short limit entry.
A “knife protection” check blocks trades where price is already trading through the proposed stop.
Only one entry per sweep is allowed; entries are only placed inside the configured NY trading sessions and only if no manipulation flag is active and EOD protection allows it.
e) Stop-Loss Placement (“Tick-Free” SL)
The stop is not placed directly on the HTF level; instead, the script scans a window around the sweep bar to find a local extreme:
Longs: lowest low in a configurable bar window around the sweep.
Shorts: highest high in that window.
This produces a structure-based SL that is generally outside the main sweep wick.
f) Take-Profit Logic (ZigZag + HTF Levels)
A lightweight ZigZag engine tracks swing highs/lows and removes levels that have already been broken.
For intraday timeframes (< 1h), TP candidates come from unswept ZigZag swings above/below the entry.
For higher timeframes (≥ 1h), TP candidates fall back to unswept HTF liquidity levels.
The script picks up to two targets:
TP1: nearest valid target in the trade direction (or a 2R fallback if none exists),
TP2: second target (or a 4R fallback if none exists).
A multi-TP model is used: typically 50% at TP1, remainder managed towards TP2 with breakeven plus offset once TP1 is hit.
g) Session & End-of-Day Filters
Three predefined NY sessions (Early, Open, Afternoon) are available; entries are only allowed inside active sessions.
An End-of-Day filter checks a user-defined NY close time and:
Blocks new entries close to the end of the day,
Optionally forces flat before the close.
3. Inputs Overview (Conceptual)
Liquidity settings: which HTF levels to track (1D/1W/1M), how many to show, and sweep priority (highest TF vs nearest vs any).
FVG settings: visibility radius, search window after a sweep, minimum FVG size.
ZigZag settings: swing length used for TP discovery.
Execution & protection: limit order timeout, breakeven offset, EOD protection.
Visuals: labels, sweep markers, manipulation warning, session highlighting, TP lines, etc.
For exact meaning of each input, please refer to the inline comments in the open-source code.
4. Strategy Properties & Backtesting Notes
Default strategy properties in this script:
Initial capital: 100,000
Order size: 10% of equity (strategy.percent_of_equity)
Commission: 0.01% per trade (adjust as needed for your broker/asset)
Slippage: must be set manually in the Strategy Tester (recommended: at least a few ticks on fast markets).
Even though the order size is 10% of equity, actual risk per trade depends on the SL distance and is typically much lower than 10% of the account. You should still adjust these values to keep risk within what you personally consider sustainable (e.g. somewhere in the 1–2% range per trade).
For more meaningful results:
Test on liquid instruments (e.g. major indices, FX, or liquid futures).
Use enough history to reach 100+ closed trades on your market/timeframe.
Always include realistic commission and slippage.
Do not assume that past performance will continue.
5. How to Use
Apply the strategy to your preferred symbol and timeframe.
Set broker-like commission and slippage in the Strategy Tester.
Adjust:
HTF levels (1D/1W/1M),
Sessions (NY windows),
FVG search window and minimum size,
ZigZag length and EOD filter.
Observe how entries only appear:
After a HTF sweep,
In the configured session,
At a FVG edge,
With TP lines anchored at unswept structure / liquidity.
Use this primarily as a research and backtesting tool to study how your own ICT / SMC ideas behave over a large sample of trades.
6. Disclaimer
This script is for educational and research purposes only.
It does not constitute financial advice, and it does not guarantee profitability. Always validate results with realistic assumptions and use your own judgment before trading live.

Safe Supertrend Strategy (No Repaint)Overview
The Safe Supertrend is a repaint-free version of the popular Supertrend trend-following indicator.
Most Supertrend indicators appear perfect on historical charts because they flip intrabar and then repaint after the candle closes.
This version fixes that by using close-of-bar confirmation only, making every trend flip 100% stable, safe, and non-repainting.
Why This Supertrend Doesn’t Repaint
Most Supertrend indicators calculate their trend direction using the current bar’s data.
But during a live candle:
ATR expands and contracts
The upper/lower bands move
Price moves above/below the band temporarily
A false flip appears → then disappears when the candle closes
That is classic repainting.
This indicator avoids all of that by using:
close > upper
close < lower
This means:
Trend direction flips only based on the previous candle,
No intrabar calculations,
No flickering signals,
No “perfect but fake” historical performance.
Every signal you see on the chart is exactly what was available in real-time.
How It Works
Calculates ATR (Average True Range) and SMA centerline
Builds upper and lower volatility bands
Confirms trend flips only after the previous bar closes
Plots clear bull and bear reversal signals
Works on all markets (crypto, stocks, forex, indices)
No repainting, no recalc, no misleading flips.
Bullish Signal (Trend Up)
A bullish trend begins only when:
The previous candle closes above the upper ATR band,
And this flip is fully confirmed.
A green triangle marks the start of a new uptrend.
Bearish Signal (Trend Down)
A bearish trend begins only when:
The previous candle closes below the lower ATR band,
And the downtrend is confirmed.
A red triangle signals the start of a new downtrend.
Inputs
ATR Length - default 10
ATR Multiplier - default 3.0
Works on all timeframes and market
Simple, but powerful.
Why Use This Version Instead of a Regular Supertrend?
Most Supertrends:
Look great historically
But repaint continuously on live charts
Give false trend flips intrabar
Cannot be reliably used in strategies
This version:
Uses strict previous-bar logic
Never repaints trend direction
Works perfectly in live trading
Backtests accurately
Is ideal for algorithmic strategies
Ideal For:
Trend-following strategies
Breakout trading
Algo trading systems
Reversal detection
Filtering market noise
Swing trading & scalping
Final Note
This is a safer, more reliable Supertrend designed for real-world use — not perfect-looking repaint illusions.
If you use Supertrend in your trading system, this no-repaint version ensures your signals are trustworthy and consistent.

ETH Short-Term VWAP+EMA/RSI (ATR Risk, <1h) (James Logan)ETH Short-Term VWAP + EMA / RSI Strategy (ATR-based Risk Control)
A short-term (< 1 hour) ETH trading system designed for intraday scalps and momentum swings on 5- to 15-minute charts.
It blends trend confirmation (EMA 50 / 200) with intrabar structure (EMA 21 pullback & VWAP filter) and RSI momentum triggers, managing exits dynamically through ATR-based stop, take-profit, and trailing stop targets.
Core logic
• Long when RSI crosses above the threshold within an up-trend (EMA 50 > EMA 200) and price is above VWAP.
• Short when RSI crosses below threshold within a down-trend (EMA 50 < EMA 200) and price is below VWAP.
• Optional pullback confirmation to the 21-EMA for cleaner entries.
• Risk defined by ATR-multiples for stop-loss, take-profit, and an adaptive trailing stop.
• Automatic flat-out exit after a set number of bars (time-based close).
Best use
• 5 min – 15 min ETH/USDT charts (Binance, Bybit, Coinbase, etc.)
• Works with both spot and perpetual data.
• Tune ATR and RSI thresholds per venue; defaults are balanced for 0.05 % per-side fees.
Key parameters
• ATR SL × 1.6 ATR TP × 2.2 ATR Trail × 2.0
• RSI 50 cross | EMA 50/200 trend filter | VWAP confirmation
• Default position sizing = USD-based (e.g. $1 000 per trade).
Notes
• All orders and exits are simulated at bar close; use 1-minute bar magnifier for finer fill modeling.
• No repainting—uses only confirmed bar data.
• Best validated with ≥ 200 trades and profit factor > 1.25 over multi-month backtests.

Turtles StrategyBorn from the 1980s "Turtle" experiment, this method of trading captures breakouts and places or closes trades with intrabar entries or exits and realized-equity risk controls.
How It Works
The strategy buys/sells on breakouts from recent highs/lows, using ATR for volatility-adjusted stops and sizing. It risks a fixed % (default 1%) of realized equity per trade—initial capital plus closed P&L, ignoring open positions for conservatism. Drawdown protection auto-reduces risk by 20% at 10% drops (up to three times), resetting only on full peak recovery. Single positions only, with 1-tick slippage simulated for realistic fills. Best for trending assets like forex,commodities, crypto, stocks. Backtest for optimal parameters.
Main Operations
The strategy works on any timeframe but it's meant to be used on daily charts.
Entry Signals:
Long: Buy-stop 1 tick above 20-bar high (default "Entry Period") when no position—enters intrabar on breakout.
Short: Sell-stop 1 tick below 20-bar low. OCA cancels opposites.
Size: (Realized equity × adjusted risk %) ÷ (2× ATR stop distance), scaled by point value.
Exit Signals:
Longs: Stop at tighter of (entry - 2× ATR) or (10-bar low - 1 tick trailing, default "Exit Period").
Shorts: Stop at tighter of (entry + 2× ATR) or (10-bar high + 1 tick trailing).
Locks profits in trends, exits fast on fades.
Risk Controls:
Tracks realized equity peak.
10% drawdown: Risk ×0.8; 20%/30%: Further ×0.8 (max 3x).
Full reset above peak—preserves capital in slumps.

HermesHERMES STRATEGY - TRADINGVIEW DESCRIPTION
OVERVIEW
Hermes is an adaptive trend-following strategy that uses dual ALMA (Arnaud Legoux Moving Average) filters to identify high-quality entry and exit points. It's designed for swing and position traders who want smooth, low-lag signals with minimal whipsaws.
Unlike traditional moving averages that operate on price, Hermes analyzes price returns (percentage changes) to create signals that work consistently across any asset class and price range.
HOW IT WORKS
DUAL ALMA SYSTEM
The strategy uses two ALMA lines applied to price returns:
• Fast ALMA (Blue Line): Short-term trend signal (default: 80 periods)
• Slow ALMA (Black Line): Long-term baseline trend (default: 250 periods)
ALMA is superior to simple or exponential moving averages because it provides:
• Smoother curves with less noise
• Significantly reduced lag
• Natural resistance to outliers and flash crashes
TRADING LOGIC
BUY SIGNAL:
• Fast ALMA crosses above Slow ALMA (bullish regime)
• Price makes new N-bar high (momentum confirmation)
• Optional: Price above 200 EMA (macro trend filter)
• Optional: ALMA lines sufficiently separated (strength filter)
SELL SIGNAL:
• Fast ALMA crosses below Slow ALMA (bearish regime)
• Optional: Price makes new N-bar low (momentum confirmation)
The strategy stays in position during the entire bullish regime, allowing you to ride trends for weeks or months.
VISUAL INDICATORS
LINES:
• Blue Line: Fast ALMA (short-term signal)
• Black Line: Slow ALMA (long-term baseline)
TRADE MARKERS:
• Green Triangle Up: Buy executed
• Red Triangle Down: Sell executed
• Orange "M": Buy blocked by momentum filter
• Purple "W": Buy blocked by weak crossover strength
KEY PARAMETERS
ALMA SETTINGS:
• Short Period (default: 30) - Fast signal responsiveness
• Long Period (default: 250) - Baseline stability
• ALMA Offset (default: 0.90) - Balance between lag and smoothness
• ALMA Sigma (default: 7.5) - Gaussian curve width
ENTRY/EXIT FILTERS:
• Buy Lookback (default: 7) - Bars for momentum confirmation (required)
• Sell Lookback (default: 0) - Exit momentum bars (0 = disabled for faster exits)
• Min Crossover Strength (default: 0.0) - Required ALMA separation (0 = disabled)
• Use Macro Filter (default: true) - Only enter above 200 EMA
BEST PRACTICES
RECOMMENDED ASSETS - Works well on:
• Cryptocurrencies (Bitcoin, Ethereum, etc.)
• Major indices (S&P 500, Nasdaq)
• Large-cap stocks
• Commodities (Gold, Oil)
RECOMMENDED TIMEFRAMES:
• Daily: Primary timeframe for swing trading
• 4-Hour: More active trading (increase trade frequency)
• Weekly: Long-term position trading
PARAMETER TUNING:
• More trades: Lower Short Period (60-80)
• Fewer trades: Raise Short Period (100-120)
• Faster exits: Set Sell Lookback = 0
• Safer entries: Enable Macro Filter (Use Macro Filter = true)
STRATEGY ADVANTAGES
1. Low Lag - ALMA provides faster signals than traditional moving averages
2. Smooth Signals - Minimal whipsaws compared to crossover strategies
3. Asset Agnostic - Same parameters work across different markets
4. Trend Capture - Stays positioned during entire bullish regimes
5. Risk Management - Multiple filters prevent poor entries
6. Visual Clarity - Easy to interpret regime and filter states
WHEN TO USE HERMES
BEST FOR:
• Trending markets (crypto bull runs, equity uptrends)
• Swing trading (hold days to weeks)
• Position trading (hold weeks to months)
• Clear trend identification
• Risk-managed exposure
NOT SUITABLE FOR:
• Ranging/sideways markets
• Scalping or day trading
• High-frequency trading
• Mean reversion strategies
RISK DISCLAIMER
This indicator is for educational purposes only. Past performance does not guarantee future results. Always use proper position sizing and risk management. Test thoroughly on historical data before live trading.
CREDITS
Inspired by Giovanni Santostasi's Power Law Volatility Indicator, generalized for universal application across all assets using adaptive ALMA filtering.
Strategy by Hermes Trading Systems
QUICK START
1. Add indicator to chart
2. Use on daily timeframe for best results
3. Look for green buy signals when blue line crosses above black line
4. Exit on red sell signals when blue line crosses below black line
5. Adjust parameters based on your trading style:
• Conservative: Enable Macro Filter, increase Buy Lookback to 10
• Aggressive: Disable Macro Filter, lower Short Period to 60
• Default settings work well for most assets

AlgoIndex - All Stages (AM & Mid-Day Long/Short)Scope (read first)
ES1! on 5-minute only. The strategy backtests ES fills; alerts can post JSON messages to a Webhook URL you configure. Exits are target-based with ITTC - if ES touches target intra-bar, an exit alert is sent immediately. No fixed ES stop-loss. Positions can also exit at scheduled time-based safety closes (session end, holiday/half-day, or expiration end). You can always close manually.
What this is
One intraday engine with four session presets (“Stages”). Stages only change session windows, trade side, and a few risk/confirmation governors—the core logic is the same. Single invite-only listing; not a multi-post suite.
How it trades
Opening Range (OR): Each Stage begins with a short OR at its session start; that Stage won’t take entries until its OR closes.
VWAP alignment: Trade with flow. Price must align with VWAP (simple pass/fail; optional gap offset).
Real breakouts only: A composite “impulse” check looks for volume expansion, recent momentum, ATR-scaled range, body/range quality, and a clean OR break (or a gap-aware extension).
Entry & target: Entries occur on the signal bar’s close; targets are set in underlying (ES) units.
ITTC (close on touch): If ES touches target intra-bar, ITTC sends a one-shot exit.
Adds (preset by Stage): S1/S2/S3 allow up to two adds on defined ES retraces; S4 disables adds. Adds use a fixed scale-out policy handled internally—no user input required.
Time-based safety closes: At the configured session end (and on holiday/half-day or expiration when applicable), any open position is closed. These are time exits, not price stops.
Why traders use it
A progressive filter for intraday continuity: OR context → VWAP alignment → authentic breakout (impulse) → ITTC to sync ES triggers with options execution. Stage-governed adds keep scaled positions coherent from open to close.
Stages (session templates; one engine)
S1 — 09:30–11:20 NY, Long-only. Standard impulse; adds ON.
S2 — 09:30–11:30 NY, Short-only. Tighter breakout standard; adds ON.
S3 — 11:15–15:15 NY, Long-only. Trade-protection ON; slightly lower underlying target; adds ON.
S4 — 11:30–14:30 NY, Short-only. Alternative trigger governor; slightly lower underlying target; adds OFF.
You can replicate any Stage via session times, side, and thresholds; presets exist for convenience and auditability.
Public inputs (what you can adjust)
Contracts (order size)
TP (Underlying) and TP (Options)
Trade Limiter (toggle) + Max profitable trades per session
Session settings: Exchange Day Session times, optional Custom Time Zone, Session 1 times, optional Session 2, and day-of-week checkboxes
Visual overlays (display-only): VWAP, Prior-Day High/Low, Session High/Low, Round Numbers, Bias Banner, Trade Markers
Display: Inputs in status line
Alerts (how to use)
Create an alert on this strategy and select “Any alert() function call.” (Optional) add a Webhook URL you control to receive the JSON the script sends. Leave Message empty.
Backtest vs options (read carefully)
Backtests show ES fills on 5-minute bars; options pricing (IV, DTE, spreads, partial fills) isn’t simulated. Because live execution uses options, ES PnL is a directional proxy only.
Evaluate quality via: trade count (target ≥100), win rate, average time-in-trade, MAE/MFE, and holding-time distribution. Do not read ES $ PnL as expected options returns—actual options outcomes depend on strike/DTE, IV regime, spreads, and execution.
Defaults used in this publication (match these before interpreting results)
Dataset: last 12–24 months of ES1! 5-minute RTH (to ensure ≥100 trades)
Initial capital: $25,000
Commission: $1.00 per order per contract (≈ $2 round-trip)
Slippage: 1 tick
Order size: 1 contract; pyramiding only for Stage-governed adds
No fixed ES stop-loss; exits are target-based with ITTC and scheduled safety closes
Operating notes
ES1! symbol only; 5-minute resolution only
You can run multiple Stages in parallel via separate tabs/alerts; if you want a single net position across Stages, enforce it in your own tooling (e.g., ignore new orders while a position is open)
Use a clean chart when publishing (only this strategy active)
Keep results separate by using four TradingView tabs (one per Stage)
Disclosures
Educational research tool, not financial advice. Past or hypothetical performance does not guarantee future results. Trading involves risk, including the risk of loss. Test thoroughly and use at your own discretion.

SHALOM TRADING HUB – Bollinger Band SystemSHALOM TRADING HUB – Bollinger Band System (Strategy)
All-in-one BB system with both Breakout and Mean-Reversion modes.
Automatic ENTRY / EXIT / STOP-LOSS, optional Mid-Band Exit, ATR or % risk, and built-in alerts. Backtest-ready.
What it does
Bollinger Bands: Basis = SMA(length); Upper/Lower = ±(mult × StDev).
Signals
Breakout mode
LONG → price crosses above Upper
SHORT → price crosses below Lower
Mean-Reversion mode
LONG → price re-enters above Lower
SHORT → price re-enters below Upper
Risk / Exits
ATR mode: SL = ATR × Mult, TP = SL × Risk:Reward
% mode: SL = %Stop, TP = %Take Profit
Optional Mid-Band (Basis) cross exit.
Visuals: BB lines + active Entry / SL / TP overlays + last-bar price labels.
Alerts: Breakout / Mean-Reversion signals and TP/SL hits.
Inputs (Settings)
Source, Length, Multiplier – BB calculation.
Signal Mode – Breakout or Mean Reversion.
Use ATR Stop/Target? – On = ATR; Off = %.
ATR Length, ATR Mult (SL), Risk:Reward (TP)
% Stop, % Take Profit (when ATR is Off)
Also exit on Mid-Band cross? – On/Off.
Alerts only on bar close? – Filters to confirmed bars.
Entry / Exit / Stop
Entry: Auto when the chosen signal condition triggers.
Stop-Loss: Placed from ATR or % settings.
Take-Profit: Set by R:R or % settings.
Mid-Band Exit (optional):
LONG → exit if close < Basis
SHORT → exit if close > Basis
Alerts (How-to)
Add the strategy to the chart → click Alerts (⚠️).
Condition: “SHALOM BB System” → choose:
BB Breakout LONG / SHORT
BB Mean-Reversion LONG / SHORT
Long TP Hit / Long SL Hit / Short TP Hit / Short SL Hit
Choose Once per bar or Once per bar close.
Backtest Tips
Match timeframe to your instrument.
Tune ATR/Mult, R:R, % to volatility.
Session filter (e.g., 09:20–15:20 IST) can be added easily in code.
Default pyramiding = 0; raise if you want multiple entries.

Liquidity SweeperStrategy Overview
This Pine Script implements a Liquidity Sweep Trading Strategy, a sophisticated approach that capitalizes on market manipulation tactics commonly used by institutional traders. The strategy identifies when price "sweeps" above recent swing highs or below swing lows to trigger stop losses and grab liquidity, then quickly reverses direction - creating high-probability trading opportunities.
Core Concept: What is a Liquidity Sweep?
A liquidity sweep occurs when:
Price breaks above a swing high (or below a swing low) to trigger retail stop losses
Institutional players absorb this liquidity at favorable prices
Price quickly reverses back into the previous range
This creates a "fake breakout" or "stop hunt" pattern
The strategy exploits these manipulative moves by entering trades in the direction of the reversal.
How the Strategy Works
1. Swing Point Detection
Uses a lookback period (default: 20 bars) to identify significant swing highs and lows
Employs proper pivot point detection using ta.highestbars() and ta.lowestbars()
Only considers confirmed swing points (not just recent highs/lows)
2. Liquidity Sweep Identification
High Sweep (Short Setup):
Price moves above the last swing high (triggering buy stops)
Same bar closes back below the swing high (showing rejection)
Low Sweep (Long Setup):
Price moves below the last swing low (triggering sell stops)
Same bar closes back above the swing low (showing support)
3. Confirmation Process
Requires price to stay within the swept range for a specified number of bars (default: 3)
This confirms the sweep was genuine and not just normal volatility
Prevents false signals and improves trade quality
4. Entry Logic
Long Entries: Triggered after confirmed low sweeps
Short Entries: Triggered after confirmed high sweeps
5. Risk Management
Stop Loss: Placed at a multiple of ATR (default: 1.5x) from entry price
Take Profit: Risk/Reward ratio based (default: 2:1)
Position Sizing: 10% of equity per trade (configurable)
Red X-crosses: High sweeps detected
Green X-crosses: Low sweeps detected
Red triangles (down): Short entry signals
Green triangles (up): Long entry signals
Horizontal lines: Current swing high/low levels
Info label: Shows last detected swing levels
Optimal Conditions:
Timeframes: 1H, 4H, and Daily work best
Market Conditions: Ranging and trending markets both suitable
Volatility: Moderate to high volatility preferred
Session Times: Most effective during active trading sessions
Strengths:
✅ Exploits institutional manipulation tactics
✅ Clear entry/exit rules with defined risk
✅ Works across multiple asset classes
✅ Includes proper confirmation to reduce false signals
✅ Visual clarity for manual verification
✅ Reasonable risk/reward parameters
Limitations:
⚠️ Requires patience - not a high-frequency strategy
⚠️ Market dependent - fewer signals in low volatility periods
⚠️ Needs sufficient lookback data for swing identification
⚠️ May have drawdown periods during strong trending moves
⚠️ Requires understanding of market structure concepts
Best Practices for Users
Optimization Tips:
Adjust lookback period based on timeframe (shorter for lower TFs)
Test different confirmation periods for your market
Consider market session times when backtesting
Use alongside volume analysis for additional confirmation
Risk Management:
Never risk more than 2-3% per trade of total capital
Consider reducing position size during high-impact news
Monitor correlation if trading multiple pairs simultaneously
Use additional filters (trend, support/resistance) for confluence
Backtesting Recommendations:
Test on at least 6 months of historical data
Include different market conditions (trending, ranging, volatile)
Consider transaction costs and slippage in results
Forward test on demo before live implementation
Expected Results
Based on typical liquidity sweep strategy performance:
Disclaimer
This strategy is based on market structure analysis and institutional trading behavior patterns. Past performance doesn't guarantee future results. Users should:
Thoroughly backtest before live trading
Start with small position sizes
Understand the underlying concepts before implementation
Consider combining with other analysis methods
Always use proper risk management
The strategy works best when traders understand the psychological and structural elements of liquidity sweeps rather than just following signals blindly.
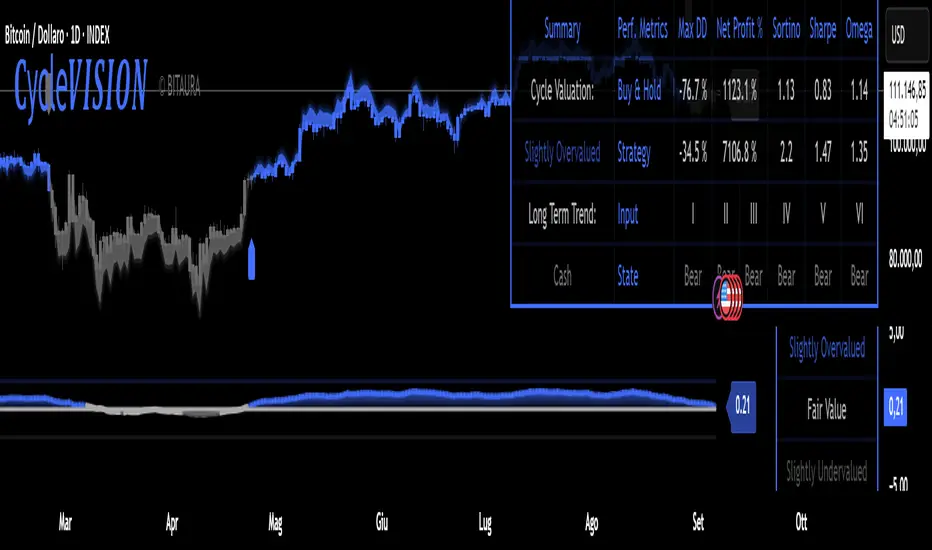
CycleVISION [BitAura]𝐂ycle𝑽𝑰𝑺𝑰𝑶𝑵
This Pine Script® indicator combines a long-term trend-following strategy with a cycle valuation Z-score analysis to generate a Trend Probability Indicator (TPI). The TPI aggregates signals from multiple trend and on-chain metrics to identify optimal entry and exit points for a single asset, with USD as a cash position. The system also calculates a comprehensive Z-score based on performance and valuation metrics to assess market cycles, aiming to enhance risk-adjusted returns for long-term investors.
Logic and Core Concepts
The 𝐂ycle𝑽𝑰𝑺𝑰𝑶𝑵 System uses two primary components to guide investing decisions:
1. Trend Probability Indicator (TPI)
Mechanism : Aggregates five proprietary, universal, trend signals and three on-chain metrics into a composite TPI score, normalized between -1 and 1.
Thresholds : Enters a long position when the TPI score exceeds a user-defined long threshold (default: 0.0) and exits to cash when it falls below a short threshold (default: -0.5).
Execution : Trades are executed only on confirmed bars within a user-specified backtest date range, ensuring robust signal reliability.
2. Cycle Valuation Z-Score
Mechanism : Computes an average Z-score from six metrics: Sharpe Ratio, Sortino Ratio, Omega Ratio, Weekly RSI, Crosby Ratio, and Price Z-Score, using a 1200-bar lookback period.
Purpose : Identifies overvalued or undervalued market conditions to complement TPI signals, with thresholds at ±1.8 for extreme valuations.
Visualization : Displays the average Z-score and individual components, with gradient-based bar coloring to reflect valuation strength.
Features
Dynamic Trend Signals : Combines trend and on-chain data into a single TPI score for clear long/cash decisions.
Comprehensive Valuation : Calculates Z-scores for multiple performance and price metrics to assess market cycles.
Customizable Inputs : Allows users to adjust TPI thresholds, backtest date ranges, and valuation metrics visibility.
Visual Outputs :
Valuation Table : Displays TPI score, Z-scores, and performance metrics (Sharpe, Sortino, Omega, Max Drawdown, Net Profit) in a configurable table (Lite, Medium, Full).
Equity Curve : Plots the system’s equity curve compared to buy-and-hold performance.
Price and TPI Plot : Overlays TPI-adjusted price bands with glow effects and filled gaps for trend visualization on the price chart.
Valuation Coloring : Applies backgrounds based on Z-score ranges (e.g., strong buy above 1.8, strong sell below -1.8).
Configurable Alerts : Notifies users of TPI signal changes (Long to Cash or Cash to Long) with detailed messages.
Color Presets : Offers five color themes (e.g., Arctic Blast, Fire vs. Ice) or custom color options for long/short signals.
Pine Script v6 : Leverages matrices, tables, and gradient coloring for enhanced usability.
How to Use
Add to Chart : Apply the indicator to any chart (the chart’s ticker is used for calculations, e.g., INDEX:BTCUSD ).
Configure Settings : Adjust TPI thresholds, backtest start date (default: 01 Feb 2018), and valuation metrics visibility in the Inputs menu.
Select Color Theme : Choose a preset color mode (e.g., Arctic Blast) or enable custom colors in the Colors group.
Monitor Outputs : Check the Valuation Table for TPI and Z-score data, and view the Price and TPI Plot for trend signals.
Analyze Performance : Enable the equity curve and performance metrics in the Backtesting Options group to compare results.
Set Alerts : Right-click a plot, select "Add alert," and choose "Trend Change: Long to Cash" or "Trend Change: Cash to Long" for notifications.
The system is optimized for daily timeframe and tested across various assets to ensure robustness.
Notes
The script is closed-source.
Use a standard price series (not Heikin Ashi or other non-standard types) for accurate results.
The script avoids lookahead bias by using barmerge.lookahead_off in request.security() calls.
A minimum 1200-bar lookback is mandatory for Z-score calculations to avoid errors, with warnings displayed if insufficient price history is available.
The BitAura watermark can be toggled in the Table Settings group.
Disclaimer : This script is for educational and analytical purposes only and does not constitute financial advice. Trading involves significant risk, and past performance is not indicative of future results. Always conduct your own research and apply proper risk management.
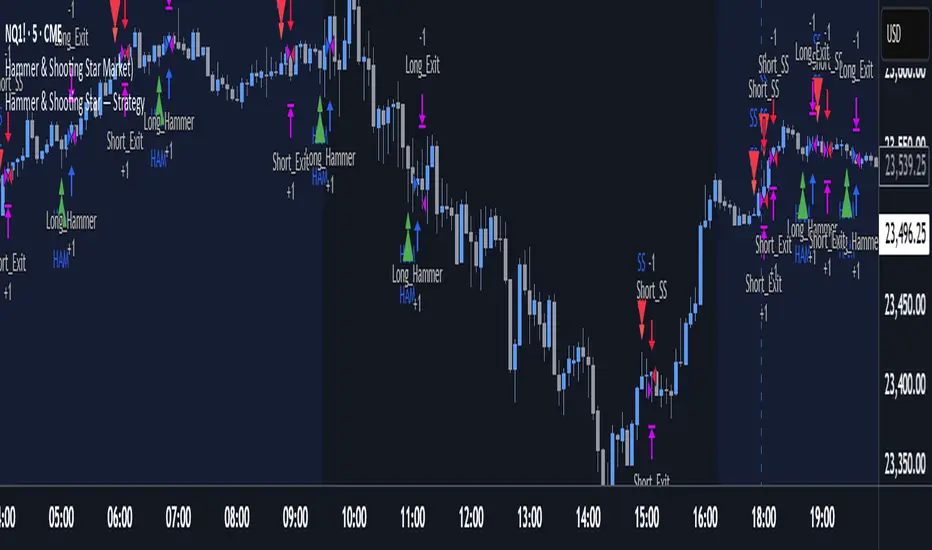
Hammer & Shooting Star — StrategyHammer & Shooting Star Strategy for Intraday Trading
This strategy identifies two candlestick patterns commonly used in technical analysis:
Hammer Candles (a bullish reversal signal):
A hammer candle has a small body at the top with a long lower wick. The strategy goes long on the next bar open when a hammer is detected, with a stop loss at the low of the hammer bar and a target at the high.
Shooting Star Candles (a bearish reversal signal):
A shooting star candle has a small body at the bottom with a long upper wick. The strategy goes short on the next bar open when a shooting star is detected, with a stop loss at the high of the shooting star bar and a target at the low.
RSI + MACD Long-Only StrategyRSI + MACD Long-Only Strategy
Overview: Momentum-based, long-only strategy combining RSI and MACD. Entries favor upside momentum; exits trigger on momentum fades or risk targets. Signals are state-gated so you get one exit per entry (no multiple exits without a prior entry).
Entry conditions:
RSI crosses above the midline (default 50) while MACD is bullish (MACD > Signal, optionally MACD > 0), OR
MACD crosses above its Signal while RSI is at/above the midline.
Optional filters:
EMA trend filter: only enter if price > EMA(n).
Oversold context: only enter within N bars after RSI dipped below the oversold threshold.
Exit conditions:
RSI crosses below the midline, OR
MACD crosses below its Signal with MACD histogram ≤ 0.
Optional risk exit: Take Profit / Stop Loss based on percentage from average entry price.
Risk management:
Inputs: Use TP/SL (on/off), TP% (default 3.0), SL% (default 1.5).
Implements protective strategy.exit (limit/stop) while in position.
Signal-based exit uses strategy.close to flatten.
Position management:
Long-only, no pyramiding (single position at a time).
Internal state ensures entries occur only when flat and exits only when in a position.
Inputs you can tune:
RSI: length, overbought, oversold, midline.
MACD: fast length, slow length, signal length; toggle “Require MACD > 0”.
Signals: oversold lookback window; EMA trend on/off and EMA length.
Risk: TP% and SL%.
Visuals: show entry/exit markers, bar coloring; optional debug background on raw triggers.
Visuals and alerts:
Plots EMA (optional), draws entry/exit markers, optional bar coloring, and a faint background on raw long triggers to aid tuning.
Alert conditions provided for entries and exits.
Notes:
Designed for bar-close evaluation; performance varies by symbol/timeframe—tune inputs accordingly.
Long-only; intended for trend-following momentum with basic risk control.
Not financial advice.

MNQ Gap-Fade (ETH) — RTH 08:30–15:00 CT, +/-3m refsStrategy overview
This strategy tests a gap-fade idea on MNQ when trading an ETH chart but referencing RTH timing. It measures the overnight move from 3 minutes before the prior RTH close (14:57 CT) to 3 minutes after today’s RTH open (08:33 CT). If that gap is big enough, it bets on mean reversion at the open:
Short after a large gap up
Long after a large gap down
How it works
Sampling windows (RTH, Chicago time):
Prev close sample: the 14:57 bar (3 min before 15:00 close)
Open sample: the 08:33 bar (3 min after 08:30 open)
These offsets help avoid opening/closing bar noise and ensure the bars have formed.
Overnight % move:
(OpenSample−PrevCloseSample)/PrevCloseSample × 100
Signals (at 08:33 pulse):
If gap % ≥ Gap-Up threshold → enter SHORT
If gap % ≤ −Gap-Down threshold → enter LONG
Risk management:
Per-trade TP and SL as percentages from entry (both adjustable)
If still in a position at 14:57, the strategy forces flat (closes all) before the RTH close
Plots & visibility:
Plots the computed Overnight Gap % line
Horizontal lines at your Gap-Up and Gap-Down thresholds for quick visual checks
Alerts:
alertcondition() events fire on:
the open-sample ready pulse,
gap-up short, and gap-down long conditions
(Pine requires static alert messages; the % gap itself is visible on the chart.)
Inputs you can adjust
Times (CT): RTH open/close and the ±3 min offsets (use different values if desired)
Gap thresholds (%): separate values for gap-up (short) and gap-down (long)
Take-profit / Stop-loss (%): per-side percentage targets from average entry price
Instrument & session notes
Designed for MNQ; works on an ETH chart while internally referencing CME/Chicago (CT) RTH times via 1-minute sampling.
If you prefer different markets or exact ET timestamps, change the time inputs accordingly.
Assumptions & limitations
This is a research/backtest tool for a simple gap-fade rule, not a complete trading system.
Slippage, fills, and overnight liquidity may differ from backtest assumptions.
Mean reversion can fail on trend days and during news events; use filters or wider thresholds if needed.
That should be everything reviewers and users need to understand what it does and how to tune it. Want me to add a short “Suggested defaults” block (e.g., 0.75–1.25% gaps, 1% TP/SL) or a “Known gotchas” section for ETH vs. RTH charts?
Ask ChatGPT

Multi-Confluence Swing Hunter V1# Multi-Confluence Swing Hunter V1 - Complete Description
Overview
The Multi-Confluence Swing Hunter V1 is a sophisticated low timeframe scalping strategy specifically optimized for MSTR (MicroStrategy) trading. This strategy employs a comprehensive point-based scoring system that combines optimized technical indicators, price action analysis, and reversal pattern recognition to generate precise trading signals on lower timeframes.
Performance Highlight:
In backtesting on MSTR 5-minute charts, this strategy has demonstrated over 200% profit performance, showcasing its effectiveness in capturing rapid price movements and volatility patterns unique to MicroStrategy's trading behavior.
The strategy's parameters have been fine-tuned for MSTR's unique volatility characteristics, though they can be optimized for other high-volatility instruments as well.
## Key Innovation & Originality
This strategy introduces a unique **dual scoring system** approach:
- **Entry Scoring**: Identifies swing bottoms using 13+ different technical criteria
- **Exit Scoring**: Identifies swing tops using inverse criteria for optimal exit timing
Unlike traditional strategies that rely on simple indicator crossovers, this system quantifies market conditions through a weighted scoring mechanism, providing objective, data-driven entry and exit decisions.
## Technical Foundation
### Optimized Indicator Parameters
The strategy utilizes extensively backtested parameters specifically optimized for MSTR's volatility patterns:
**MACD Configuration (3,10,3)**:
- Fast EMA: 3 periods (vs standard 12)
- Slow EMA: 10 periods (vs standard 26)
- Signal Line: 3 periods (vs standard 9)
- **Rationale**: These faster parameters provide earlier signal detection while maintaining reliability, particularly effective for MSTR's rapid price movements and high-frequency volatility
**RSI Configuration (21-period)**:
- Length: 21 periods (vs standard 14)
- Oversold: 30 level
- Extreme Oversold: 25 level
- **Rationale**: The 21-period RSI reduces false signals while still capturing oversold conditions effectively in MSTR's volatile environment
**Parameter Adaptability**: While optimized for MSTR, these parameters can be adjusted for other high-volatility instruments. Faster-moving stocks may benefit from even shorter MACD periods, while less volatile assets might require longer periods for optimal performance.
### Scoring System Methodology
**Entry Score Components (Minimum 13 points required)**:
1. **RSI Signals** (max 5 points):
- RSI < 30: +2 points
- RSI < 25: +2 points
- RSI turning up: +1 point
2. **MACD Signals** (max 8 points):
- MACD below zero: +1 point
- MACD turning up: +2 points
- MACD histogram improving: +2 points
- MACD bullish divergence: +3 points
3. **Price Action** (max 4 points):
- Long lower wick (>50%): +2 points
- Small body (<30%): +1 point
- Bullish close: +1 point
4. **Pattern Recognition** (max 8 points):
- RSI bullish divergence: +4 points
- Quick recovery pattern: +2 points
- Reversal confirmation: +4 points
**Exit Score Components (Minimum 13 points required)**:
Uses inverse criteria to identify swing tops with similar weighting system.
## Risk Management Features
### Position Sizing & Risk Control
- **Single Position Strategy**: 100% equity allocation per trade
- **No Overlapping Positions**: Ensures focused risk management
- **Configurable Risk/Reward**: Default 5:1 ratio optimized for volatile assets
### Stop Loss & Take Profit Logic
- **Dynamic Stop Loss**: Based on recent swing lows with configurable buffer
- **Risk-Based Take Profit**: Calculated using risk/reward ratio
- **Clean Exit Logic**: Prevents conflicting signals
## Default Settings Optimization
### Key Parameters (Optimized for MSTR/Bitcoin-style volatility):
- **Minimum Entry Score**: 13 (ensures high-conviction entries)
- **Minimum Exit Score**: 13 (prevents premature exits)
- **Risk/Reward Ratio**: 5.0 (accounts for volatility)
- **Lower Wick Threshold**: 50% (identifies true hammer patterns)
- **Divergence Lookback**: 8 bars (optimal for swing timeframes)
### Why These Defaults Work for MSTR:
1. **Higher Score Thresholds**: MSTR's volatility requires more confirmation
2. **5:1 Risk/Reward**: Compensates for wider stops needed in volatile markets
3. **Faster MACD**: Captures momentum shifts quickly in fast-moving stocks
4. **21-period RSI**: Reduces noise while maintaining sensitivity
## Visual Features
### Score Display System
- **Green Labels**: Entry scores ≥10 points (below bars)
- **Red Labels**: Exit scores ≥10 points (above bars)
- **Large Triangles**: Actual trade entries/exits
- **Small Triangles**: Reversal pattern confirmations
### Chart Cleanliness
- Indicators plotted in separate panes (MACD, RSI)
- TP/SL levels shown only during active positions
- Clear trade markers distinguish signals from actual trades
## Backtesting Specifications
### Realistic Trading Conditions
- **Commission**: 0.1% per trade
- **Slippage**: 3 points
- **Initial Capital**: $1,000
- **Account Type**: Cash (no margin)
### Sample Size Considerations
- Strategy designed for 100+ trade sample sizes
- Recommended timeframes: 4H, 1D for swing trading
- Optimal for trending/volatile markets
## Strategy Limitations & Considerations
### Market Conditions
- **Best Performance**: Trending markets with clear swings
- **Reduced Effectiveness**: Highly choppy, sideways markets
- **Volatility Dependency**: Optimized for moderate to high volatility assets
### Risk Warnings
- **High Allocation**: 100% position sizing increases risk
- **No Diversification**: Single position strategy
- **Backtesting Limitation**: Past performance doesn't guarantee future results
## Usage Guidelines
### Recommended Assets & Timeframes
- **Primary Target**: MSTR (MicroStrategy) - 5min to 15min timeframes
- **Secondary Targets**: High-volatility stocks (TSLA, NVDA, COIN, etc.)
- **Crypto Markets**: Bitcoin, Ethereum (with parameter adjustments)
- **Timeframe Optimization**: 1min-15min for scalping, 30min-1H for swing scalping
### Timeframe Recommendations
- **Primary Scalping**: 5-minute and 15-minute charts
- **Active Monitoring**: 1-minute for precise entries
- **Swing Scalping**: 30-minute to 1-hour timeframes
- **Avoid**: Sub-1-minute (excessive noise) and above 4-hour (reduces scalping opportunities)
## Technical Requirements
- **Pine Script Version**: v6
- **Overlay**: Yes (plots on price chart)
- **Additional Panes**: MACD and RSI indicators
- **Real-time Compatibility**: Confirmed bar signals only
## Customization Options
All parameters are fully customizable through inputs:
- Indicator lengths and levels
- Scoring thresholds
- Risk management settings
- Visual display preferences
- Date range filtering
## Conclusion
This scalping strategy represents a comprehensive approach to low timeframe trading that combines multiple technical analysis methods into a cohesive, quantified system specifically optimized for MSTR's unique volatility characteristics. The optimized parameters and scoring methodology provide a systematic way to identify high-probability scalping setups while managing risk effectively in fast-moving markets.
The strategy's strength lies in its objective, multi-criteria approach that removes emotional decision-making from scalping while maintaining the flexibility to adapt to different instruments through parameter optimization. While designed for MSTR, the underlying methodology can be fine-tuned for other high-volatility assets across various markets.
**Important Disclaimer**: This strategy is designed for experienced scalpers and is optimized for MSTR trading. The high-frequency nature of scalping involves significant risk. Past performance does not guarantee future results. Always conduct your own analysis, consider your risk tolerance, and be aware of commission/slippage costs that can significantly impact scalping profitability.

GStrategy 1000Pepe 15mTrend Following Candlestick Strategy with EMA Filter and Exit Delay
Strategy Concept
This strategy combines candlestick patterns with EMA trend filtering to identify high-probability trade entries, featuring:
Entry Signals: Hammer and Engulfing patterns confirmed by EMA trend
Trend Filter: Fast EMA (20) vs Slow EMA (50) crossover system
Risk Management: 5% stop-loss + 1% trailing stop
Smart Exit: 2-bar delay after exit signals to avoid whipsaws
Key Components
Trend Identification:
Uptrend: Fast EMA > Slow EMA AND rising
Downtrend: Fast EMA < Slow EMA AND falling
Entry Conditions:
pinescript
// Bullish Entry (Long)
longCondition = (Hammer OR Bullish Engulfing)
AND Uptrend
AND no existing position
// Bearish Entry (Short)
shortCondition = Bearish Engulfing
AND Downtrend
AND no existing position
Exit Mechanics:
Primary Exit: EMA crossover (Fast crosses Slow)
Delayed Execution: Waits 2 full candles after signal
Emergency Exits:
5% fixed stop-loss
1% trailing stop
Visual Dashboard:
Colored EMA lines (Blue=Fast, Red=Slow)
Annotated candlestick patterns
Background highlighting for signals
Distinct markers for entries/exits
Unique Features
Pattern Recognition:
Enhanced Hammer detection (strict body/wick ratios)
Multi-candle engulfing confirmation
Trend-Confirmation:
Requires price and EMA alignment
Filters counter-trend patterns
Exit Optimization:
pinescript
// Delay implementation
if exit_signal_triggered
counter := 2 // Start countdown
else if counter > 0
counter -= 1 // Decrement each bar
exit_trade = (counter == 1) // Execute on final bar
Risk Parameters
Parameter Value Description
Stop Loss 5% Fixed risk per trade
Trailing Stop 1% Locks in profits
Exit Delay 2 bars Reduces false exits
Position Size 100% No pyramiding
Visualization Examples
🟢 Green Triangle: Bullish entry
🔴 Red Triangle: Bearish entry
⬇️ Blue X: Long exit (after delay)
⬆️ Green X: Short exit (after delay)
🎯 Pattern Labels: Identifies hammer/engulfing
Recommended Use
Timeframes: 1H-4H (reduces noise)
Markets: Trend-prone assets (FX, indices)
Best Conditions: Strong trending markets
Avoid: Choppy/Ranging markets
