Adaptive Trend Flow [QuantAlgo]Adaptive Trend Flow 📈🌊
The Adaptive Trend Flow by QuantAlgo is a sophisticated technical indicator that harnesses the power of volatility-adjusted EMAs to navigate market trends with precision. By seamlessly integrating a dynamic dual-EMA system with adaptive volatility bands, this premium tool enables traders and investors to identify and capitalize on sustained market moves while effectively filtering out noise. The indicator's unique approach to trend detection combines classical technical analysis with modern adaptive techniques, providing traders and investors with clear, actionable signals across various market conditions and asset class.
💫 Indicator Architecture
The Adaptive Trend Flow provides a sophisticated framework for assessing market trends through a harmonious blend of EMA dynamics and volatility-based boundary calculations. Unlike traditional moving average systems that use fixed parameters, this indicator incorporates smart volatility measurements to automatically adjust its sensitivity to market conditions. The core algorithm employs a dual EMA system combined with standard deviation-based volatility bands, creating a self-adjusting mechanism that expands and contracts based on market volatility. This adaptive approach allows the indicator to maintain its effectiveness across different market phases - from ranging to trending conditions. The volatility-adjusted bands act as dynamic support and resistance levels, while the gradient visualization system provides instant visual feedback on trend strength and duration.
📊 Technical Composition and Calculation
The Adaptive Trend Flow is composed of several technical components that create a dynamic trending system:
Dual EMA System: Utilizes fast and slow EMAs for primary trend detection
Volatility Integration: Computes and smooths volatility for adaptive band calculation
Dynamic Band Generation: Creates volatility-adjusted boundaries for trend validation
Gradient Visualization: Provides progressive visual feedback on trend strength
📈 Key Indicators and Features
The Adaptive Trend Flow utilizes customizable length parameters for both EMAs and volatility calculations to adapt to different trading styles. The trend detection component evaluates price action relative to the dynamic bands to validate signals and identify potential reversals.
The indicator incorporates multi-layered visualization with:
Color-coded basis and trend lines (bullish/bearish)
Adaptive volatility-based bands
Progressive gradient background for trend duration
Clear trend reversal signals (𝑳/𝑺)
Smooth fills between key levels
Programmable alerts for trend changes
⚡️ Practical Applications and Examples
✅ Add the Indicator: Add the indicator to your TradingView chart by clicking on the star icon to add it to your favorites ⭐️
👀 Monitor Trends: Watch the basis line and trend band interactions to identify trend direction and strength. The gradient background intensity indicates trend duration and conviction.
🎯 Track Signals: Pay attention to the trend reversal markers that appear on the chart:
→ Long signals (𝑳) appear when price action confirms a bullish trend reversal
→ Short signals (𝑺) indicate validated bearish trend reversals
🔔 Set Alerts: Configure alerts for trend changes in both bullish and bearish directions, ensuring you never miss significant technical developments.
🌟 Summary and Tips
The Adaptive Trend Flow by QuantAlgo is a sophisticated technical tool designed to support trend-following strategies across different market environments and asset class. By combining dual EMA analysis with volatility-adjusted bands, it helps traders and investors identify significant trend changes while filtering out market noise, providing validated signals. The tool's adaptability through customizable EMA lengths, volatility smoothing, and sensitivity settings makes it suitable for various trading timeframes and styles, allowing users to capture trending opportunities while maintaining protection against false signals.
Key parameters to optimize for your trading and/or investing style:
Main Length: Adjust for more or less sensitivity to trend changes (default: 10)
Smoothing Length: Fine-tune volatility calculations for signal stability (default: 14)
Sensitivity: Balance band width for trend validation (default: 2.0)
Visual Settings: Customize appearance with color and display options
The Adaptive Trend Flow is particularly effective for:
Identifying sustained market trends
Detecting trend reversals with confirmation
Measuring trend strength and duration
Filtering out market noise and false signals
Remember to:
Allow the indicator to validate trend changes before taking action
Use the gradient background to gauge trend strength
Combine with volume analysis for additional confirmation
Consider multiple timeframes for a complete market view
Adjust sensitivity based on market volatility conditions
스크립트에서 "bands"에 대해 찾기

EMA Volatility Channel [QuantAlgo]EMA Volatility Channel 🌊📈
The EMA Volatility Channel by QuantAlgo is an advanced technical indicator designed to capture price volatility and trend dynamics through adaptive channels based on exponential moving averages. This sophisticated system combines EMA-based trend analysis with dynamic volatility-adjusted bands to help traders and investors identify trend direction, potential reversals, and market volatility conditions. By evaluating both price momentum and volatility together, this tool enables users to make informed trading decisions while adapting to changing market conditions.
💫 Dynamic Channel Architecture
The EMA Volatility Channel provides a unique framework for assessing market trends through a blend of exponential moving averages and volatility-based channel calculations. Unlike traditional channel indicators that use fixed-width bands, this system incorporates dynamic volatility measurements to adjust channel width automatically, helping users determine whether price movements are significant relative to current market conditions. By combining smooth EMA trends with adaptive volatility bands, it evaluates both directional movement and market volatility, while the smoothing parameters ensure stable yet responsive channel adjustments. This adaptive approach allows users to identify trending conditions while remaining aware of volatility expansions and contractions, enhancing both trend-following and reversal strategies.
📊 Indicator Components & Mechanics
The EMA Volatility Channel is composed of several technical components that create a dynamic channel system:
EMA Midline: Calculates a smoothed exponential moving average that serves as the channel's centerline, providing a clear reference for trend direction.
Volatility Measurement: Computes average price movement to determine dynamic channel width, adapting to changing market conditions automatically.
Smooth Band Calculation: Applies additional smoothing to the channel bands, reducing noise while maintaining responsiveness to significant price movements.
📈 Key Indicators and Features
The EMA Volatility Channel combines various technical tools to deliver a comprehensive analysis of market conditions.
The indicator utilizes exponential moving averages with customizable length and smoothing parameters to adapt to different trading styles. Volatility calculations are applied to determine channel width, providing context-aware boundaries for price movement. The trend detection component evaluates price action relative to the channel bands, helping validate trends and identify potential reversals.
The indicator incorporates multi-layered visualization with color-coded channels and bars to signal both trend direction and market position. These adaptive visual cues, combined with programmable alerts for channel breakouts, help traders and investors track both trend changes and volatility conditions, supporting both trend-following and mean-reversion strategies.
⚡️ Practical Applications and Examples
✅ Add the Indicator: Add the indicator to your TradingView chart by clicking on the star icon to add it to your favorites ⭐️
👀 Monitor Channel Position: Watch the price position relative to the channel bands to identify trend direction and potential reversals. When price moves outside the channel, consider potential trend changes or extreme conditions.
🔔 Set Alerts: Configure alerts for channel breakouts and trend changes, ensuring you can act on significant technical developments promptly.
🌟 Summary and Tips
The EMA Volatility Channel by QuantAlgo is a versatile technical tool, designed to support both trend following and volatility analysis across different market environments. By combining smooth EMA trends with dynamic volatility-based channels, it helps traders and investors identify significant price movements while measuring market volatility, providing reliable technical signals. The tool's adaptability across timeframes makes it suitable for both trend-following and reversal strategies, allowing users to capture opportunities while maintaining awareness of changing market conditions.

Enhanced Kaufman Adaptive Moving Average (KAMA) with Bollinger B# Enhanced Kaufman Adaptive Moving Average (KAMA) with Bollinger Bands
## Overview
This indicator combines the Kaufman Adaptive Moving Average (KAMA) with Bollinger Bands to create a comprehensive trading system. It provides adaptive trend following capabilities while measuring market volatility and potential reversal points.
## Key Features
- Adaptive moving average that adjusts to market conditions
- Dynamic Bollinger Bands for volatility measurement
- Color-coded KAMA line indicating trend direction
- Integrated buy/sell signals based on multiple confirmations
- Customizable parameters for both KAMA and Bollinger Bands
- Optional bar confirmation wait feature
- Built-in alert conditions for trade signals
## Main Components
### 1. Kaufman Adaptive Moving Average (KAMA)
- Adapts to market volatility using an efficiency ratio
- Changes color based on trend direction (green for uptrend, red for downtrend)
- Adjustable parameters for fine-tuning:
- Base Length: Controls the main calculation period (default: 10)
- Fast EMA Length: For rapid market response (default: 2)
- Slow EMA Length: For stable market conditions (default: 30)
### 2. Bollinger Bands
- Standard deviation-based volatility bands
- Customizable length and standard deviation multiplier
- Includes expansion threshold for volatility measurement
- Components:
- Upper Band: Upper volatility threshold
- Middle Band: Simple moving average
- Lower Band: Lower volatility threshold
## Signal Generation
### Buy Signals
Generated when:
1. KAMA color changes from red to green
2. Price closes above KAMA
3. Price closes above the middle Bollinger Band
4. Signals are marked with:
- Green triangles below the candles
- "B" labels for easy identification
### Sell Signals
Generated when:
1. KAMA color changes from green to red
2. Price closes below KAMA
3. Price closes below the middle Bollinger Band
4. Signals are marked with:
- Red triangles above the candles
- "S" labels for easy identification
## Customizable Parameters
### KAMA Settings
- Base Length (1-50)
- Fast EMA Length (1-10)
- Slow EMA Length (10-50)
- Source Price Selection
- Direction Highlight Toggle
- Bar Confirmation Option
### Bollinger Bands Settings
- Length (default: 20)
- Standard Deviation Multiplier (default: 2.0)
- Expansion Threshold (0.1-3.0)
## Alert Functionality
Built-in alerts for:
- Buy signals with customizable messages
- Sell signals with customizable messages
## Best Practices
### Timeframe Selection
- Works well on multiple timeframes
- Recommended for 15m to 4h charts for optimal signal generation
- Higher timeframes provide more reliable trend signals
### Parameter Optimization
- Adjust KAMA lengths based on trading style:
- Shorter lengths for day trading
- Longer lengths for swing trading
- Fine-tune BB multiplier based on market volatility
- Consider waiting for bar confirmation in volatile markets
### Risk Management
- Use in conjunction with other indicators for confirmation
- Consider market conditions and volatility when trading signals
- Implement proper position sizing and stop-loss levels
## Technical Notes
- Written in Pine Script™ v6
- Overlay indicator (displays on price chart)
- Compatible with all TradingView-supported markets
- Resource-efficient implementation for smooth performance
## Disclaimer
This indicator is provided under the Mozilla Public License 2.0. While it can be a valuable tool for technical analysis, it should not be used as the sole basis for trading decisions. Always combine with proper risk management and additional analysis methods.
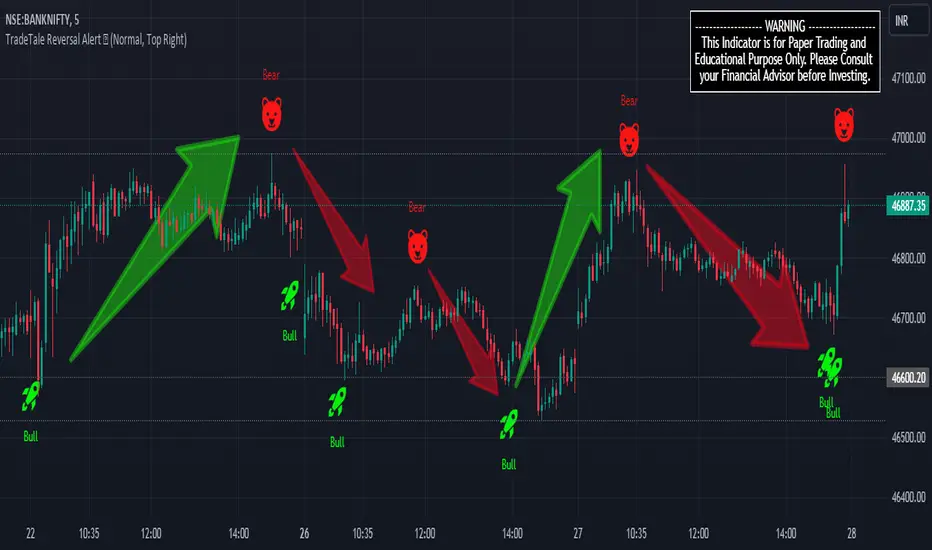
TradeTale Reversal Alert 🚀This script explains how RSI Oscillator along with Bollinger Bands & Moving Average can be used to catch "Reversal Points".
What is an Oscillator:-
An oscillator is a technical analysis tool that constructs high and low bands between two extreme values and then builds a trend indicator that fluctuates within these bounds. Traders use the trend indicator to discover short-term overbought or oversold conditions. RSI with MA is used along with minor calculations (maths) in this Oscillator for generating Long and Short signals.
RSI:-
RSI is a momentum oscillator which measures the speed and change of price movements. RSI moves up and down (oscillates) between ZERO and 100. Generally RSI above 70 is considered overbought and below 30 is considered oversold. Some traders may use a setting of 20 and 80 for oversold and overbought conditions respectively. Some traders may use a setting of 10 and 90 for oversold and overbought conditions respectively. However this may reduce the number of signals. 10 to 30 is shown as bullish zone and 70 to 90 is shown as bearish zone in this Oscillator.
Calculation:-
There are three basic components in the RSI - Avg Gain, Avg Loss & RS.
Avg Gain = Average of Upward Price Change
Avg Loss = Average of Downward Price Change
RS = (Avg Gain)/(Avg Loss)
RSI = 100 – (100 / (1 +RS ))
First Calculation:-
RSI calculation is based on default 14 periods.
Average gain and Average loss are simple 14 period averages.
Average Loss equals the sum of the losses divided by 14 for the first calculation.
Average Gain equals the sum of the Gains divided by 14 for the first calculation.
First Average Gain = Sum of Gains over the past 14 periods / 14.
First Average Loss = Sum of Losses over the past 14 periods / 14.
The formula uses a positive value for the average loss.
RS values are smoothed after the first calculation.
Second Calculation:-
Subsequent calculations multiply the prior value by 13, add the most recent value, and divide the total by 14.
Average Gain = / 14.
Average Loss = / 14.
if
Average Loss = 0, RSI = 100 (means there were no losses to measure).
Average Gain = 0, RSI = 0 (means there were no gains to measure).
Moving Average (MA):-
A moving average (MA) is used in technical analysis, used to help smooth out price data by creating a constantly updated average price. A rising moving average indicates that the security is in an uptrend, while a declining moving average indicates a downtrend.
Bollinger Bands (BB):–
It is consists of a Moving Average line and two standard deviation lines that are plotted above and below the moving average line. The moving average periods & standard deviation can be adjust according to the preference. Bollinger Bands help traders to identify the volatility and potential price range of security.
Logic of this indicator:-
RSI is an oscillator that fluctuates between zero and 100 which makes it easy to use for many traders. Its easy to identify extremes because RSI is range-bound.
Bollinger Band Upper and Lower Bands are used to identify Overbought & Oversold points Respectively. Price crossover of these Upper & Lower Bands used to calculate Reversal Points.
BB, RSI and MA calculations along with maths is used to generate signals.
Rocket signal in is Long Signal and also exit Short signal. (Bullish Entry/Exit)
Bear signal is Short Signal and also exit Long signal. (Bearish Entry/Exit)
But remember that RSI works best in range bound market and is less trustworthy in trending markets. (caution)
A new trader need to be cautious because during strong trends in the market/security, RSI may remain in overbought (70 to 90) or oversold (10 to 30) for extended periods.
Also Bollinger Bands here are used to calculate range reversal, So is less trustworthy in trending markets. (caution)
Chart Timeframe:-
This Indicator works on all timeframes.
Traders should set stop loss and take profit levels as per risk reward ratio.
Note:
Don't confuse RSI and relative strength. RSI is changes in the price momentum of a security.
whereas relative strength compares the price performance of two or more securities.
Like other technical indicators, This indicator also is not a holy grail. It can only assist you in building a good strategy. You can only succeed with proper position sizing, risk management and following correct trading Psychology (No overtrade, No greed, No revenge trade etc).
THIS INDICATOR IS FOR EDUCATIONAL PURPOSE AND PAPER TRADING ONLY. YOU MAY PAPER TRADE TO GAIN CONFIDENCE AND BUILD FURTHER ON THESE. PLEASE CONSULT YOUR FINANCIAL ADVISOR BEFORE INVESTING. WE ARE NOT SEBI REGISTERED.
Hope you all like it
happy learning.
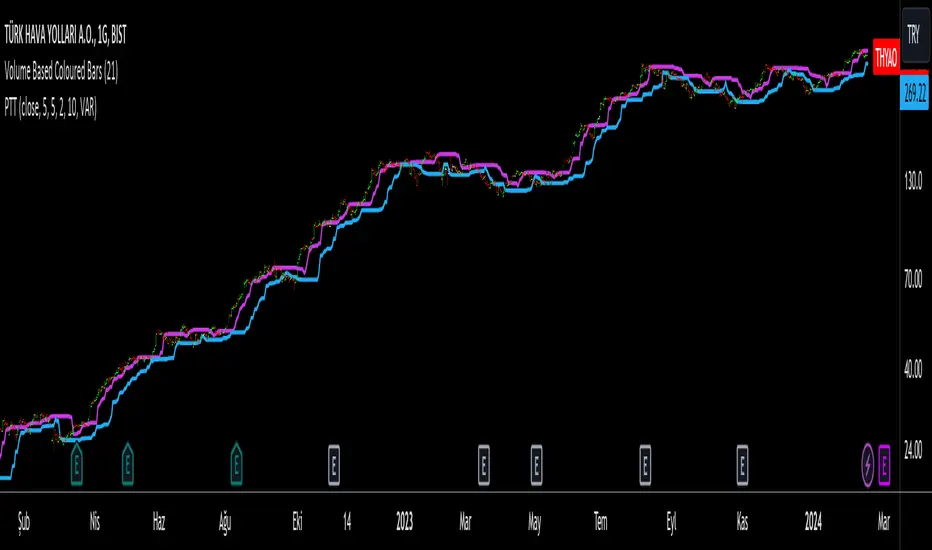
Progressive Trend TrackerProgressive Trend Tracker (PTT) is a development combining Bollinger Bands with Highest Highs and Lowest Lows by K.Hasan Alpay & Anıl Özekşi.
Bollinger Bands have originally 3 lines: Simple Moving Average (Middle Line), Upper Band and Lower Band.
PTT concentrates on the upper and lower Bollinger band lines.
First, it calculates the bands using the Highest & Lowest prices in a period of time (Faster period and period) instead of closing prices.
Then, PTT takes the lowest values of the calculated upper band and, conversely, the highest values of the calculated lower band in a Slower period.
Default values:
Faster Period: 5
Period: 5
Bollinger Band Moving Average Period: 2
Slower Period: 10
These values are designed for daily time frame, so they have to be optimized in other timeframes by the user. (Ex: Higher values can be considered in lower time frames)
One more significant difference considering original Bollinger Bands is that PTT uses VIDYA (Variable Dynamic Moving Average = VAR) in the calculation instead of a Simple Moving Average.
Bollinger Bands cannot create significant BUY & SELL signals considering their original logic, but the primary purpose of PTT is to have substantial trading signals:
BUY when the price crosses above the PTT Lower line (cyan line)
STOP when the price crosses back below the PTT Lower line (cyan line)
SELL when the price crosses below the PTT Upper line (cyan line)
STOP when the price crosses back above the PTT Upper line (cyan line)
Developer Anıl Özekşi advises that traders may have more accurate signals when using a short-period moving average instead of closing prices, so I added the VIDYA moving average with the same default length ( 2 ), which is used in Bollinger Bands calculation. You can check the "SHOW MOVING AVERAGE?" box on the settings tab of the indicator.
Price SextantThe provided Pine Script™ code is for a technical analysis indicator called "Price Sextant." This indicator helps visualize the price position relative to its linear regression and standard deviation levels. Here's a brief description:
Price Sextant Indicator:
Purpose:
The Price Sextant indicator aims to show the current price's deviation from the linear regression line by dividing the price chart into different zones or sextants.
Components:
Linear Regression: The script calculates a linear regression line based on the closing prices over a specified length (default is 50 bars).
Standard Deviation Sections: It then computes standard deviation levels from the linear regression, creating upper and lower sections around the regression line.
Scoring: Each section is assigned a numerical score, and labels with corresponding scores are displayed on the chart.
Arrow and Midline: An arrow is drawn to indicate the current price's position in relation to the regression line and standard deviation bands. It changes color based in what section it is:
orange section shows a ranging price, below orange section -1 arrow turns red and show down trend and if arrow above +1 section it turns green and show strong up trend of price.
A midline is plotted to mark the position of the linear regression line.
Sextant Description:
In navigation, a sextant is an instrument used to measure the angle between two visible objects.
In the context of this indicator, the term "Sextant" is likely used metaphorically to describe the division of the price chart into six sections or zones based on the linear regression and standard deviation bands.
This indicator can help traders identify potential overbought or oversold conditions, as well as assess the strength and direction of the trend.
Please note that the effectiveness of the indicator depends on various factors, and it's advisable to use it in conjunction with other analysis tools for a comprehensive trading strategy.

Logical Trading Indicator V.1Features of the Logical Trading Indicator V.1
ATR-Based Trailing Stop Loss
The Logical Trading Indicator V.1 utilizes the Average True Range (ATR) to implement a dynamic trailing stop loss. You can customize the sensitivity of your alerts by adjusting the ATR Multiple and ATR Period settings.
Higher ATR Multiple values create wider stops, while lower values result in tighter stops. This feature ensures that your trades are protected against adverse price movements. For best practice, use higher values on higher timeframes and lower values on lower term timeframes.
Bollinger Bands
The Logical Trading Indicator V.1 includes Bollinger Bands, which can be customized to use either a Simple Moving Average (SMA) or an Exponential Moving Average (EMA) as the basis.
You can adjust the length and standard deviation multiplier of the Bollinger Bands to fine-tune your strategy. The color of the basis line changes to green when price is above and red when price is below the line to represent the trend.
The bands show a range vs a single band that also represents when the price is in overbought and oversold ranges similar to an RSI. These bands also control the take profit signals.
You also have the ability to change the band colors as well as toggle them off, which only affects the view, they are still active which will still fire the take profit signals.
Momentum Indicator
Our indicator offers a momentum filter option that highlights market momentum directly on the candlesticks, identifying periods of bullish, bearish, or consolidation phases. You can enable or disable this filter as needed, providing valuable insights into market conditions.
By default, you will see the candlestick colors represent the momentum direction as green or red, and consolidation periods as white, but the filter on the BUY and SELL signals is not active. The view options and filter can be toggled on and off in the settings.
Buy and Sell Signals
The Logical Trading Indicator V.1 generates buy and sell signals based on a combination of ATR-based filtering, Bollinger Band basis crossover, and optional momentum conditions if selected in the settings. These signals help you make informed decisions about when to enter or exit a trade. You can also enable a consolidation filter to stay out of trades during tight ranges.
Basically a BUY signal fires when the price closes above the basis line, and the price meets or exceeds the ATR multiple from the previous candle length, which is also editable in the settings.
If the momentum filter is engaged, it will not fire BUY signals when in consolidation periods. It works just the opposite for SELL signals.
Take Profit Signals
We've integrated a Take Profit feature that helps you identify points to exit your trades with profits. The indicator marks Long Take Profit when prices close below the upper zone line of the Bollinger Bands after the previous candle closes inside the band, suggesting an optimal point to exit a long trade or consider a short position.
Conversely, Short Take Profit signals appear when prices close above the lower zone after the previous candle closes inside of it, indicating the right time to exit a short trade or contemplate a long position.
Alerts for Informed Trading
The Logical Trading Indicator V.1 comes equipped with alert conditions for buy signals, sell signals, take profit points, and more. Receive real-time notifications to your preferred devices or platforms to stay updated on market movements and trading opportunities.

Volatility Trend (Zeiierman)█ Overview
The Volatility Trend (Zeiierman) is an indicator designed to help traders identify and analyze market trends based on price volatility. By calculating a dynamic trend line and volatility-adjusted bands, the indicator provides visual cues to understand the current market direction, potential reversal points and volatility.
█ How It Works
The indicator uses a weighted moving average of historical prices to create a responsive trend line that is adjusted for volatility using standard deviation. The indicator sets upper and lower bands at intervals of two standard deviations, acting as markers for potential overbought or oversold conditions. Additionally, by comparing current and previous trend line values, the indicator identifies the trend direction, providing crucial insights for traders.
█ How to Use
Trend Identification
Use the trend line to identify the overall market direction. An upward-sloping line indicates an uptrend, while a downward-sloping line indicates a downtrend.
Volatility Assessment
Use the distance between the upper and lower bands to gauge market volatility. Wider bands indicate higher volatility, while narrower bands indicate lower volatility.
Overbought/Oversold
If the price reaches or exceeds the upper or lower bands, it may be in an overbought or oversold condition, respectively.
█ Settings
Trend Control: Adjusts the sensitivity and smoothness of the trend line. Lower values make the trend more responsive, while higher values make it smoother.
Trend Dynamic: Controls how quickly the trend adjusts to price changes. Higher values result in a slower adjustment.
Volatility: Consists of two parts - the scaling factor for volatility and the sensitivity for volatility adjustment. Adjusting these settings alters the distance between the trend lines and the price, as well as how sensitive the bands are to changes in volatility.
Squeeze Control: Influences the degree to which market squeeze is considered in the calculation, with higher values increasing sensitivity.
Enable Scalping Trend: A toggle that, when activated, makes the indicator focus on short-term trends, which is particularly useful for scalping strategies.
█ Related scripts with the same calculation philosophy
TrendCylinder
TrendSphere
Predictive Trend and Structure
-----------------
Disclaimer
The information contained in my Scripts/Indicators/Ideas/Algos/Systems does not constitute financial advice or a solicitation to buy or sell any securities of any type. I will not accept liability for any loss or damage, including without limitation any loss of profit, which may arise directly or indirectly from the use of or reliance on such information.
All investments involve risk, and the past performance of a security, industry, sector, market, financial product, trading strategy, backtest, or individual's trading does not guarantee future results or returns. Investors are fully responsible for any investment decisions they make. Such decisions should be based solely on an evaluation of their financial circumstances, investment objectives, risk tolerance, and liquidity needs.
My Scripts/Indicators/Ideas/Algos/Systems are only for educational purposes!

Edri Extreme Points Buy & SellEDRI EXTREME POINTS BUY & SELL INDICATOR
This Buy and Sell (non-repainting) indicator uses signals based on the combined CCI/Momentum and RSI indicators and optional regular divergence.
The idea of the indicator is to look for a potential reversal after the price reached extreme points (overbought or oversold) and signals an entry when the price shows signs of momentum for reversal.
Optionally, it considers finding a divergence while RSI is at the extreme levels to improve the predictability of a possible reversal.
Additionally, the indicator includes a simple Mean Reversion visual on the chart to assist users in identifying extreme price levels and potential reversal opportunities. It features upper and lower bands that can be optionally plotted, showing calculated values where price bounces at those extreme levels.
The purpose of these bands is to help traders avoid getting trapped in the middle of a trend and to guide them to buy low and sell high. (It's important to note that this is purely a visual aid and does not impact the generation of trade signals.)
By utilizing the Mean Reversion bands alongside the entry conditions, traders can gain insights into potential price reversals and make more informed decisions about when to enter or exit trades.
Buy and Sell Entry conditions:
• The indicator looks at the CCI/Momentum indicator to turn positive (if buy) or negative (if sell) after the RSI was overbought or oversold in the recent past.
• It also checks if there is a 3-period regular bullish divergence in the RSI (if buy), or regular bearish divergence (if sell) and consider these in the entry condition.
• If these conditions are met, this indicator suggests that it may be a good time to enter a trade.
In summary this is how this indicator works:
• The indicator takes input settings such as the choice between using CCI or Momentum as the entry signal source, length parameters for CCI/Momentum, RSI levels for overbought and oversold conditions, RSI length, and options to plot mean reversion bands on the chart.
• It calculates the CCI and Momentum and RSI values based on user-defined length..
• It checks for regular bullish and bearish divergences (3 periods) in the RSI if the option is enabled.
• The script plots shapes on the chart to indicate the buy and sell signals based on the entry conditions.
• If the mean reversion bands option is enabled, it calculates the mean reversion, standard deviation, upper band, and lower band values.
• It also plots the upper band, mean reversion line, and lower band on the chart if the mean reversion bands option is enabled.
• This indicator includes alert conditions to generate alerts for the buy and sell signals.
• On top of that, users can opt to use only one alert for both buy and sell signals. (This can save Trading view subscribers with limited alerts.)
Important! Please do not consider everything you read here as financial advice. Additionally, do not rely solely on indicators for making your trading decisions. It is important to note that no indicator or strategy is perfect. Therefore, it is always recommended to backtest everything and practice proper risk management.
I appreciate your feedback on this indicator. As I am new to script development, I am open to comments and suggestions to improve it. If you encounter any issues while using this indicator, please let me know in the comments section. If you find it helpful, I kindly ask for your support in boosting it. Thank you for your cooperation.

Flying Dragon Trend IndicatorFlying Dragon Trend Indicator can be used to indicate the trend on all timeframes by finetuning the input settings.
The Flying Dragon Trend family includes both the strategy and the indicator, where the strategy supports of selecting the optimal set of inputs for the indicator in each scenario. Highly recommended to get familiar with the strategy first to get the best out of the indicator.
Flying Dragon Trend plots the trend bands into the ribbon, where the colours indicate the trend of each band. The plotting of the bands can be turned off in the input settings. Based on the user selectable Risk Level the trend pivot indicator is shown for the possible trend pivot when the price crosses the certain moving average line, or at the Lowest risk level all the bands have the same colour. The trend pivot indicator is not shown on the Lowest risk level, but the colour of the trend bands is the indicator instead .
The main idea is to combine two different moving averages to cross each other at the possible trend pivot point, but trying to avoid any short term bounces to affect the trend indication. The ingenuity resides in the combination of selected moving average types, lengths and especially the offsets. The trend bands give visual hint for the user while observing the price interaction with the bands, one could say that when "the Dragon swallows the candles the jaws wide open", then there is high possibility for the pivot. The leading moving average should be fast while the lagging moving average should be, well, lagging behind the leading one. There is Offset selections for each moving average, three for leading one and one for the lagging one, those are where the magic happens. After user has selected preferred moving average types and lengths, by tuning each offset the optimal sweet spot for each timeframe and equity will be found. The default values are good enough starting points for longer (4h and up) timeframes, but shorter timeframes (minutes to hours) require different combination of settings, some hints are provided in tooltips. Basically the slower the "leading" moving average (like HMA75 or HMA115) and quicker the "lagging" moving average (like SMA12 or SMA5) become, the better performance at the Lowest risk level on minute scales. This "reversed" approach at the minute scales is shown also as reversed colour for the "lagging" moving average trend band, which seems to make it work surprisingly well.
The Flying Dragon Trend does not necessarily work well on zig zag and range bounce scenarios without additional finetuning of the input settings to fit the current condition.

Physics of PricePhysics of Price is a non-repainting kinematic reversal and volatility overlay. It models price as a physical object with position, velocity, and acceleration, then builds adaptive bands and a short-term predictive “ghost cone” to highlight where reversals are statistically more likely.
CONCEPT
Instead of using only moving averages, the core engine tracks a smoothed price (position), trend speed (velocity), and change in trend speed (acceleration). Standard deviation of the model error defines probabilistic bands around this kinematic centerline. When price stretches too far away and snaps back, the move is treated as a potential exhaustion event.
CORE COMPONENTS
– Kinematic centerline (Alpha–Beta–Gamma style filter) that bends with trend instead of lagging like a simple MA.
– Inner and outer bands based on the standard deviation of residuals between price and the kinematic model.
– Regime filter using R² and band width to avoid signals in chaotic or ultra-wide regimes.
– Optional RSI “hook” filter that waits for momentum to actually turn instead of buying into a falling RSI.
– Optional divergence add-on using kinematic velocity, so a marginal new price extreme with weaker velocity is recognized as a possible exhaustion pattern.
REVERSAL EVENTS AND SCORING
Raw events are detected when price wicks through the outer band and closes back inside (band hit with snap). These are plotted as diamonds and treated as candidates, not automatic trades.
Each event is then scored from 0 to 100 using several factors:
– How far price overshot the outer band.
– How strongly it snapped back inside.
– Whether an RSI hook is present (if enabled).
– Regime quality from the kinematic model.
– Basic kinematic safety to avoid the most aggressive “knife-catch” situations.
– Optional divergence bonus when price makes a new extreme but velocity does not.
Only events with a score above the chosen threshold become confirmed signals (triangles labeled PHYSICS REV).
GHOST CONE (PREDICTIVE BAND)
On the latest bar, the script projects a short-horizon “ghost cone” into the future using position, velocity, and a damped acceleration term. This creates a curved predictive band that visualizes a plausible short-term path and range, rather than a simple straight line. The cone is meant as context for trade management and risk, not as a hard target.
FILTERS AND OPTIONS
– Regime filter (R² and band width) can be tightened or relaxed depending on how selective you want the engine to be.
– RSI and volume filters can be toggled on for extra confirmation or off to see the raw kinematic behavior.
– An optional trend baseline (EMA) can be enabled to bias or restrict reversals relative to a higher-timeframe trend.
– Dynamic cooldown scales with volatility so the script does not spam signals in fast environments.
HOW TO USE
Physics of Price is primarily a mean-reversion and exhaustion tool. It works best in markets that respect ranges, swings, and two-sided order flow. Confirmed PHYSICS REV signals near the outer bands, with decent model health and a clean RSI hook, are the core use case. The bands and ghost cone can also be used as a context overlay alongside your own entries, exits, and risk framework.
This is an indicator, not a complete trading system. It does not use lookahead or higher-timeframe security calls and is designed for “once per bar close” alerts. Always combine it with your own risk management and confluence.

smartAitrade Complete FocusTrendPajinko-SmartAiTrade Complete is an all-in-one price-action technical system designed for high-precision entries, intelligent trade management, and fully automated exit logic.
The system combines RSI swings, advanced divergence detection, ATR-based PJK Bands, smart retest logic, swing-break POI zones, trend filters (ADX), and automated breakeven/TP management into a single integrated indicator.
It is built to support traders who want structured, rule-based entries with minimal discretion, while still maintaining the flexibility of price-action behavior.
🔍 Core Components
1. RSI System
Standard RSI for overbought/oversold levels.
RSI Swing High/Low detection (using pivots).
Used for:
momentum confirmation
swing structure alignment
divergence detection filters
2. Advanced Divergence Engine
The indicator features a high-accuracy divergence module that detects:
• Bullish Divergence
Price makes a lower low
RSI makes a higher low
Pivot distances must fall within a valid bar-range
Optional filter: RSI must be in oversold zone
• Bearish Divergence
Price makes a higher high
RSI makes a lower high
Optional filter: RSI must be in overbought zone
You can choose to draw divergence lines on either:
RSI only
Price chart
Both
This system is optimized for low repaint and filters weak divergence signals.
3. ATR-Based PJK Bands System
A volatility-adaptive band system similar to Keltner/Bollinger hybrids:
Middle line uses SMA/EMA/VWMA
Upper/lower bands = middle ± ATR × multiplier
Bands detect:
momentum breakouts
band touch signals
high-probability reversal zones
Buy signal:
Price touches lower band and shifts upward
Sell signal:
Price touches upper band and shifts downward
4. Smart Retest System
After a momentum breakout or band touch signal:
A “smart retest zone” is created
The system waits for price to come back to the zone
If retest occurs within a user-defined timeout window, the signal is validated
Used to avoid chasing entries and reduce false breakouts
5. Swing Break & POI Zones
The indicator automatically detects price-swing structure:
Swing High Break → Sell POI box created
Swing Low Break → Buy POI box created
POI zones:
Represent potential liquidity pockets
Drawn with customizable height and width
Work as target areas or confirmation zones
6. ADX Trend Filter
ADX trend strength filter ensures signals are valid only when:
Trend strength > threshold (default 20)
Avoids signals in flat, low-volatility markets
7. Auto Trade Management (Breakeven System)
Fully automated exit logic:
TP1 distance set in pips
Once TP1 is reached → move Stop Loss to breakeven + offset
Additional option:
Close all open positions automatically when trend bias changes
Everything works even with multiple open trades.
8. Dashboard & Visual Interface
The indicator includes a clean dashboard showing:
Trend condition
RSI status
Advanced divergence status
Band and swing conditions
Active signals
Breakeven status
Total signals statistics
All visual components can be enabled/disabled individually.
🎯 Trading Philosophy
The system is built on three core principles:
1. Confirm Trend
ADX + ATR Bands define direction and strength.
2. Identify High-Probability Reversal or Continuation Zones
Smart Retest + Swing Structure + POI + Divergence.
3. Automate the Exit
Breakeven, TP1, and automatic closing keep emotions out of the decision.

BBWW 2.0 Revised EN# Expert Review: BBWW 2.0 (Bollinger Bands Wing Waves)
**Verdict:** This is not just an indicator, but a full-fledged **system for visualizing market regimes**. Unlike standard Bollinger Bands, which only show volatility and deviation, BBWW 2.0 decodes **crowd psychology**, separating price movements into momentum phases (Fear/Greed) and decay phases (Correction).
This is a tool for **trend** and **swing** traders operating on volatility breakouts.
---
## How It Works: Under the Hood
At its core lies the classic mathematics of standard deviation, enhanced by advanced digital filters (Gaussian, Butterworth, SWMA).
The main "feature" of the indicator is the **Wing Waves** algorithm, which analyzes three vectors simultaneously:
1. Direction of the Basis (central line).
2. Dynamics of the Upper Band (expansion/contraction).
3. Dynamics of the Lower Band (expansion/contraction).
The combination of these vectors creates 4 market states:
### 1. Greed Impulse (Color: Olive)
* **Logic:** Basis rising + Channel expanding upwards.
* **Meaning:** Aggressive buying. Volatility is increasing in the direction of the trend. This is the most profitable phase for holding long positions. Shorting here is suicide.
### 2. Greed Correction (Color: Maroon)
* **Logic:** Basis is still rising, but the lower band has started to pull up (volatility contraction).
* **Meaning:** Buyers are exhausting, taking profits. Momentum has faded, the market is drifting or preparing for a reversal.
### 3. Fear Impulse (Color: Fuchsia)
* **Logic:** Basis falling + Channel expanding downwards.
* **Meaning:** Panic selling. Strong downward impulsive movement. The best time to hold shorts or stay out of the market (for spot).
### 4. Fear Correction (Color: Teal)
* **Logic:** Basis falling, but the upper band has started to decline (contraction).
* **Meaning:** "Dead cat bounce" or bottom stabilization. Sellers are closing positions, volatility is dropping. Dangerous to open new shorts.
---
## Trading Strategies and Recommendations
As a professional trader, I recommend using BBWW 2.0 as follows:
### Strategy 1: "Surfing the Waves" (Trend Following)
Works perfectly on 1H, 4H, and 1D timeframes.
* **ENTRY:** Enter a trade when a "Correction" phase changes to an "Impulse" phase.
* *Long:* Change from Maroon (Correction) → to Olive (Greed). This is a signal that consolidation is over and the trend has resumed.
* *Short:* Change from Teal (Correction) → to Fuchsia (Fear).
* **EXIT:** As soon as the color changes to a correction phase, tighten your stop-loss or take partial profits.
### Strategy 2: "The Squeeze"
BBWW excels at showing moments when the spring is coiling.
* If you see a prolonged period of "Correction" (bands narrowing), and price is squeezed between the Basis and one of the bands — get ready for a breakout.
* Use **Basis Line touches** during a trend as an entry point to add to a position. In a strong trend, price often tests the middle (Basis) and bounces off it.
### Strategy 3: Noise Filtering
* Enable **Gaussian** or **Butterworth** filter in settings instead of the standard SMA. This removes market noise and provides a smoother Basis Line, reducing false signals in sideways markets (flat).
---
## Nuances and Risks
1. **Sideways Market (Flat):** Like any trend tool, BBWW will give false signals in a narrow range. Colors will change frequently, and bands will be horizontal.
* *Solution:* Do not trade if the Basis Line is flat (horizontal). Wait for a slope.
2. **Lag:** Any MA (Moving Average) has lag. The signal for a phase change (e.g., start of Fear) comes when the move has already started. Do not try to catch the absolute tops and bottoms. Capture the "body" of the move.
3. **Period Settings:**
* For scalping (5m-15m): Reduce period to 14-16.
* For medium-term (4H-1D): Leave at 20 or increase to 50 to filter for the global trend.
### Summary
BBWW 2.0 is a powerful visual assistant. It removes the emotional component of trading by answering the main questions: *"Is it greed or fear right now?"* and *"Is volatility rising or falling?"*.
**Best Application:** Cryptocurrencies and volatile stocks, where pump and dump phases (volatility expansions) are most pronounced.

Advanced Linear Regression Pro [PointAlgo]Advanced Linear Regression Pro is an open-source tool designed to visualize market structure using linear regression, volatility bands, and optional volume-weighted calculations.
The indicator expands the concept of regression channels by adding higher-timeframe confluence, slope analysis, imbalance detection, and breakout highlighting.
Key Features
• Volume-Weighted Regression
Weights the regression curve based on volume to highlight periods of strong participation.
• Dynamic Standard-Deviation Bands
Upper and lower bands are derived from volatility to help visualize potential expansion or contraction zones.
• Multi-Timeframe (MTF) Regression
Plots higher-timeframe regression lines and bands for additional trend context.
• Slope Strength Analysis
Helps identify whether the current regression slope is trending upward, downward, or in a neutral range.
• Order Flow Imbalance Detection
Highlights bars where price and volume move unusually fast, which may indicate liquidity voids or imbalance zones.
• Breakout Markers
Shows simple visual markers when the price closes beyond volatility bands with volume confirmation.
These are visual signals only, not trading signals.
How to Use
This indicator is meant for visual market analysis, such as:
Observing trend direction through regression slope
Spotting volatility expansions
Comparing price against higher-timeframe regression structure
Identifying areas where price moves rapidly with volume
It can be used on any market or timeframe.
No part of this script is intended as financial advice or a complete trading system.

BB_4_in_1Bollinger Bands (4 in 1)
BB_4_in_1 is a multi-timeframe Bollinger Bands indicator that displays four different sets of Bollinger Bands on the price chart with customizable periods, line styles, and transparency levels. And just to simplify the process of applying indicators, + space saving.
Features:
- Four Bollinger Bands sets: bb_1 (20), bb_2 (80), bb_3 (160), bb_4 (320)
- Customizable period and multiplier for each set
- Unique line styles: standard, stepline, and stepline_diamond
- Adjustable line transparency for better visibility
- No fill between bands for cleaner chart layout
Ideal for multi-timeframe analysis, volatility assessment, and support/resistance level identification.

Crypto Breakout Buy/Sell Sequence
⚙️ Components & Sequence Multiple Timeframe (What It Does)
1. Bollinger Bands – Form the foundation by measuring volatility and creating the dynamic range where squeezes and breakouts occur.
2. Squeeze Dots – Show when price compresses inside the bands, signaling reduced volatility before expansion.
3. Breakout Event (Brk Dot) – Fires when price expands beyond the squeeze zone, confirming volatility expansion. (This paints Intra, before candle close)
4. Buy Signal – Confirms entry after a breakout is validated. (This paints at candle close)
5. Pump Signal – Flags sudden surges that extend sharply from the bands, often linked to strong inflows.
6. Momentum Stream – Tracks the strength of movement following the breakout, from continuation (🟢) to slowing (🟡) to exhaustion (🔴). (Resets at Pump Signal)
7. Overbought Indicator – Confirms when momentum has reached overheated conditions, often aligning with band extremes.
8. Sell Signal – Prints when exhaustion/reversal conditions are met, closing the trade cycle.
The Crypto Breakout Buy/Sell Sequence is a no-repaint event indicator that maps a full trade cycle using Bollinger-band-based volatility states: Bollinger Bands → Squeeze → Breakout → Buy → Pump → Momentum → Top Test → Overbought → Sell. Each stage is rule-based and designed to be read on standard candlesticks.
How It Works (System Logic)
Volatility framework: Bollinger Bands define dynamic range and compression/expansion.
Initiation: Squeeze → Breakout confirms expansion; Buy validates participation after expansion begins.
Management: Pump highlights unusual acceleration; Momentum stream tracks continuation → slowing → exhaustion.
Exhaustion/Exit: Top Testing + Overbought build the exhaustion case; Sell marks the sequence end.
How To Use (Quick Guide)
Wait for Squeeze → Breakout → Buy to establish a structured start.
Manage with Momentum:
🟢 continuation, 🟡 slowing, 🔴 exhaustion pressure.
Monitor extremes: Top Testing and/or Overbought = tighten risk.
Exit on Sell or on your risk rules when exhaustion builds.
Limitations & Good Practice
Signals reflect price/volatility behavior, not certainty.
Strong trends can remain extended; Overbought/Top Test ≠ instant reversal.
Always confirm with your own risk rules, position sizing, and market context.
Initial public release: integrated Squeeze/Breakout/Buy → Momentum → Exhaustion → Sell cycle; improved label clarity; cleaned defaults.
Disclaimer
For educational purposes only. Not financial advice. Past performance does not guarantee future results. Test before live use.
Thank You

Scalping, Swing Pro: Urban Towers + Bollinger(0.5)+ WMA by KidevThis indicator combines narrow Bollinger Bands (σ = 0.5) with a Weighted Moving Average (WMA-96) to provide traders with a reliable framework for identifying both short-term scalps and medium-term swing setups.
Bollinger Bands (0.5σ):
Traditional Bollinger Bands at 2σ cover ~95% of price movement, while 0.5σ bands narrow the focus to ~50% of price activity. This tighter structure makes them ideal for detecting volatility contractions, consolidations, and early breakout signals.
WMA-96 as Trend Reference:
The 96-period WMA acts as a slower, more stable directional guide. Unlike shorter WMAs, this longer setting filters noise and serves as a reference line for the dominant trend. Traders can use it as an anchor for intraday or swing positions.
Scalping & Swing Benefits:
Price holding above the WMA-96 while staying near the upper 0.5σ band often signals strength.
Contractions (squeezes) in the 0.5σ band followed by expansion frequently mark breakout zones.
Pullbacks toward the WMA-96 combined with band signals can act as re-entry or risk-defined trade areas.
This script provides a balanced view of momentum and stability — the 0.5σ bands reveal short-term volatility shifts, while the WMA-96 grounds the trader in the prevailing trend.

AXR-VolSD-Loc📈 AXR-VolSD-Loc — Volatility & Range Mapping Tool for Smart Traders
The AXR-VolSD-Loc indicator is a professional-grade tool designed for traders who rely on precise volatility analysis and structured range-based levels. It combines dynamic volatility bands with configurable price ranges such as ADR, AWR, AMR, and AQR — offering strategic clarity across all timeframes.
🔍 Key Features
Multi-Timeframe Range Calculation
Supports Daily (ADR), Weekly (AWR), Monthly (AMR), and Quarterly (AQR) ranges — each with independent period controls.
Standard Deviation Volatility Bands
Automatically or manually calculate standard deviation (%) to plot multiple upper/lower levels from a base price reference.
Fully Customizable Lines & Labels
Choose the number of bands, enable half-volatility levels, apply color gradients, customize line styles, widths, label positions, font sizes and offsets.
Flexible Anchor Logic
Set the base line for volatility from Hi/Lo/50%/0% of AXR, or input your own manual price — ideal for ICT model alignment.
Smart Visuals & Optimized Drawing
Clean line and label management using line.new() and label.new() with efficient updates only when required.
Data Table & Summary Panel
Floating table displays key metrics like high/low range, midpoint, volatility settings, and source references.
Built-In Alerts
Receive alerts when price approaches key volatility levels or AXR range extremes — ideal for anticipating institutional behavior.
🛠️ How to Use & Configure
1. Choose the Range Mode
In "AXR Mode & Period Settings", select your preferred range type:
Daily (ADR) – Short-term or intraday.
Weekly (AWR) – Medium swing positions.
Monthly (AMR) – Optimal for higher-timeframe structure.
Quarterly (AQR) – Best for macro-level zones.
Then define the number of days/weeks/months/quarters used to calculate each.
2. Define the Volatility Base Line
Under "Volatility Base Line Settings", configure the anchor:
Use 0% AXR for midpoint, or Hi/Lo/50% for edges.
Manual mode allows custom price input.
Adjust the line color, style, and thickness.
3. Configure Standard Deviation
In "Standard Deviation - Calculation & Levels", select the source:
Automatic AXR — calculates % based on AXR range.
Manual — allows custom % input.
Define how many levels above/below the base line.
Use the scale factor to adjust relative strength (e.g., 0.5 = 50% of AXR).
4. Adjust Visual Display
In "Display & Labels":
Enable or disable volatility lines.
Use color progression for intensity from blue to red.
Show or hide intermediate lines (half deviation).
Choose label alignment: right, center, or left.
Fine-tune label position with candle offset and text size.
5. Extend Lines and Define Visibility
You can choose to extend the lines left, right or both directions — or use a fixed number of bars when not extended.
This applies to both volatility lines and AXR levels.
6. Show AXR Hi/Lo/50%/0% Lines
In "AXR Levels":
Enable display of Hi, Lo, midpoint, and 50% levels.
Toggle display of AXR open levels (MO-based).
Customize style, color and width of each line.
7. Enable the Table (Optional)
Turn on the floating data table to see a quick summary:
Range high/low/midpoint.
Volatility multiplier.
Source (manual vs automatic).
Period length.
Useful for fast review during market sessions.
8. Alerts
Receive automated alerts when price approaches:
AXR Hi/Lo
0% midpoint level
Custom-defined deviation bands
✅ Use Cases
Define and monitor volatility zones around structured ranges.
Combine AMR or AQR with deviation bands for swing setups.
React to price imbalances at 50% or 0% AXR zones.
Integrate with order blocks, liquidity zones or ICT-based confluences.
Questions or suggestions? Contact us via TradingView message or in the comments.
Happy trading!
TCT - Envelope MatrixTCT - Envelope Matrix
A powerful multi-envelope indicator that creates a comprehensive price channel system with 4 customizable envelopes and multiple intermediate levels for precise price action analysis.
Key Features:
• 4 customizable envelopes with adjustable percentages (0.2%, 0.4%, 0.6%, 0.8% by default)
• Optional EMA or SMA basis calculation
• Color-coded bands for easy visual identification
• Automatic horizontal lines showing current band values
• Midpoint lines between adjacent bands
• Additional 25%, 50%, and 75% levels between each band pair
The indicator provides:
- Clear visual representation of price channels
- Multiple support and resistance levels
- Dynamic price boundaries that adapt to market conditions
- Enhanced precision with intermediate levels between bands
Perfect for:
• Identifying potential support and resistance zones
• Spotting overbought/oversold conditions
• Finding potential reversal points
• Analyzing price volatility and channel width
• Making informed trading decisions based on price position relative to multiple bands
Customization Options:
• Adjustable length for the basis calculation
• Choice between EMA and SMA
• Customizable colors for each envelope
• Flexible percentage settings for each band
• Optional basis line color adjustment
This indicator is particularly useful for traders who want to analyze price action within multiple dynamic channels and identify potential trading opportunities based on price interactions with various support and resistance levels.
AMR-AQR-VolSD-Loc**Dynamic Volatility Bands**
The **Dynamic Volatility Bands** indicator is a powerful tool designed to visualize price volatility and key support/resistance levels based on Average Monthly/Quarterly Range (AMR/AQR) and standard deviation calculations. It plots a base volatility line with customizable upper and lower bands (Vol +1 to +5 and Vol -1 to -5), using a vibrant color progression from blue (#2563EB) to red (#EF4444) for clear visual distinction on dark chart backgrounds like #131722.
**Key Features:**
- **Flexible Volatility Calculation**: Choose between manual standard deviation input or automatic calculation using AMR/AQR ranges, with a scaling factor for fine-tuning.
- **Customizable Levels**: Plot up to 5 upper and 5 lower volatility bands, with options for intermediate (half-step) lines.
- **AMR/AQR Integration**: Displays High, Low, 50% High, 50% Low, and Zero Point levels based on monthly or quarterly ranges, with optional monthly/quarterly open reference.
- **Visual Customization**: Configure line styles, widths, colors, and label positions (right, left, or center). Labels show price levels and can be offset for clarity.
- **Informative Table**: A dynamic table summarizes AMR/AQR levels, volatility settings, and key metrics, with customizable position and appearance.
- **Alerts**: Built-in alerts notify when the price approaches AMR/AQR levels, aiding in timely trading decisions.
**How to Use:**
1. Apply the indicator to your chart and adjust the settings under "Standard Deviation Calculation" to set the volatility source (Manual or AMR/AQR).
2. Customize the number of upper/lower bands and their appearance in the "Volatility Settings" group.
3. Enable the table and alerts to monitor key levels and price movements.
4. Use the vibrant color progression to identify volatility zones: blue for low volatility (Vol ±1) and red for high volatility (Vol ±5).
This indicator is ideal for traders seeking to identify potential support/resistance zones and gauge market volatility dynamically. It’s fully customizable to suit various trading strategies and timeframes.
**Note**: Best viewed on dark chart backgrounds (#131722) for optimal color contrast. Ensure sufficient historical data for accurate AMR/AQR calculations.
TradersFriendCandles v2
TradersFriendCandles
A fully customizable candle‑color and banding indicator built on percentile + ATR, with optional EMA vs. ALMA trend filtering and higher‑timeframe support.
Key Features
Dynamic Percentile Center Line
Compute any Nth percentile over M bars (default 20th over 15) to serve as a reference “mid‑price” level.
ATR‑Based Bands
Envelope that percentile line with upper/lower bands at X × ATR (default 1×), plus an extended upper band at 3.5× ATR.
Higher‑Timeframe Mode
Plot bands based on a higher timeframe (e.g. daily bands on a 15m chart) so you can gauge macro support/resistance in micro timeframes.
Custom‑Color Candles
5 user‑editable colors for:
Strong bullish
Light bullish
Neutral
Light bearish
Strong bearish
Optional EMA vs. ALMA Trend Filter
When enabled, candles simply turn “bull” or “bear” based on fast EMA crossing above/below slow ALMA.
Border‑Only Coloring
Keep candle bodies transparent and color only the border & wick.
Live Plot Labels & Track Price
All lines carry titles and can display current values directly on the price scale.
Alerts
Strong Bull Breakout (price stays above upper band)
Strong Bear Breakdown (price closes below lower band)
EMA/ALMA crossovers
Inputs & Customization
Percentile level & lookback length
ATR length, multiplier, opacity
Fast EMA length, ALMA parameters (offset, length, sigma)
Toggle bands, lines, custom candles, higher‑timeframe mode
Pick your own colors via color‑picker inputs
Use TradersFriendCandles to visualize momentum shifts, dynamic support/resistance, and trend strength all in one overlay. Perfect for pinpointing breakouts, breakdowns, and filtering noise with adjustable sensitivity.
Channels by SmanovIndicator Description
“Channels by Smanov” is a multi-channel indicator that plots dynamic support and resistance zones around a moving average line. It is composed of two main parts:
FL 1 (Flexible Channels):
A Simple Moving Average (SMA) serves as the Basis.
Upper and lower bands are calculated by adding and subtracting an ATR-based buffer from the Basis.
User-defined inputs (such as Half Length, ATR Period, and ATR Multiplier) allow for flexibility in adapting the channel width to different market conditions.
FL 2 (Fixed Channels):
Eight additional bands expand on the same SMA + ATR logic but use fixed ATR multipliers (ranging from 2.2 up to 5.0).
These extra lines can help you gauge more distant levels of potential support or resistance.
By combining an SMA (to smooth price data) with ATR (to gauge volatility), this indicator highlights areas where price may be “stretched” relative to recent volatility. Traders often use channel-based indicators to identify potential “overbought” or “oversold” conditions, as well as to spot trend continuations or reversals.
How to Use / Trading Strategy
Trend Identification (Basis Line):
The middle line (the SMA) can be used as a trend filter:
If price consistently stays above the basis, it suggests an uptrend.
If price consistently stays below the basis, it suggests a downtrend.
Reversal Opportunities (Outer Bands):
When price moves into or beyond the upper bands, it may signal overbought conditions, creating potential short (or profit-taking) opportunities.
Conversely, when price dips into or beyond the lower bands, it may signal oversold conditions, which some traders use for initiating or adding to long positions.
Breakout or Continuation Signals:
In a strong trend, price may “ride” along the outer channels.
A clear break above/below a channel that previously acted as resistance/support could hint at trend continuation.
Failure to break these levels could suggest a potential reversal or consolidation phase.
Stop-Loss Placement:
Traders often place stops just outside a relevant band. For example, if you go long on a dip near a lower band, you might place your stop slightly below that band, relying on the ATR-based buffer to reflect normal volatility.
Multiple Timeframe Analysis:
Consider confirming signals on a higher timeframe (e.g., 4-hour or daily) while taking entries on a lower timeframe.
Channels on higher timeframes can act as stronger support or resistance, offering additional confluence.
Disclaimer
This indicator is provided for educational purposes and does not guarantee specific results. Trading involves risk, and individual traders are responsible for managing their own risk and capital. Always conduct thorough analysis and use appropriate risk management (e.g., stop-losses) when entering any market positions.
Enjoy using Channels by Smanov! Your feedback and personal insights can further refine the indicator’s settings for your preferred trading style. Good luck and trade responsibly!
This Pine Script™ code is subject to the terms of the Mozilla Public License 2.0.
© Smanov_I

Conditional Volatility Explosion/ContractionThis indicator identifies zones of potential volatility expansion by analyzing the contraction and expansion of volatility bands, which are conditioned by the relationship of the price to moving averages
Volatility Squeeze: When the bands contract, it indicates a potential buildup in market tension, often preceding a significant price movement.
Volatility Expansion: When the bands expand, it signals the release of built-up tension, often resulting in increased volatility.
Trend Confirmation: The bands are active only when the price aligns with the moving average condition, helping to filter out less relevant signals during non-trending markets.
Upper Band: Displays as a red band when the volatility condition is met.
Represents the upper boundary of potential price action during high volatility.
Lower Band: Displays as a green band when the volatility condition is met.
Represents the lower boundary of potential price action during high volatility.
Fill Areas: The areas between the EMA and the bands are filled with transparent colors:
Red for the upper fill.
Green for the lower fill.
These highlights help visualize zones of potential volatility explosion.
