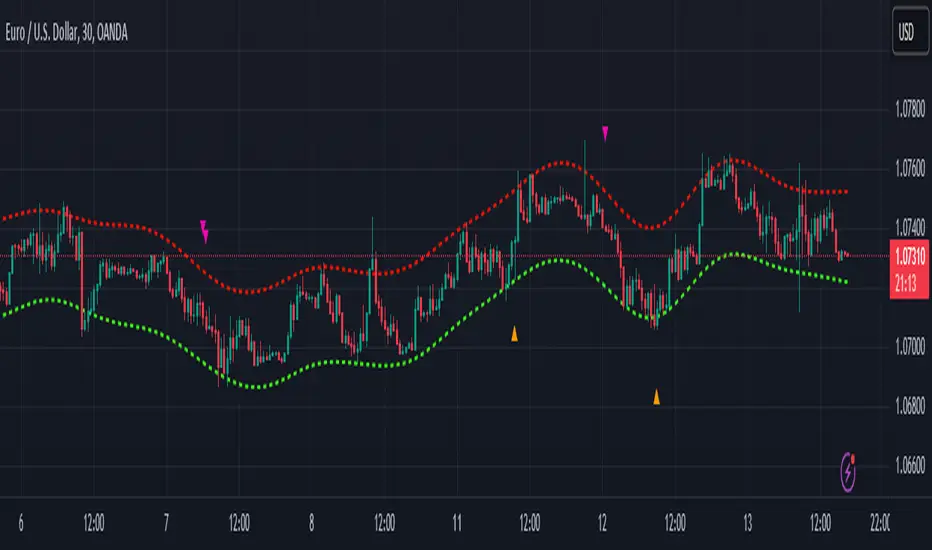
Nadaraya-Watson Envelope: Modified by YosietRange Filter indicator based on the LuxAlgo Nadaraya-Watson Envelope () indicator adding the SMA 30 high and SMA 7 low to predict the changes of the trends lines price.
WARNING: This indicator, as the same as the original, repaints the chart and could affect the exact values of the prices.
SMA Low 7 was identified using tensorflowJS years ago as accurate and abstract rsi indicator
SMA High 30 was identified using tensorflowJS years ago as accurate and strong trend line
This two SMAs were added to the original indicator Nadaraya-Watson to predict the exact points where the price will change direction or will re-test the trend to continue on.
The signals will act as the Williams Fractals, replacing the original signals of the indicator.
For those ICT/SMC traders, the bands and SMAs can toggle off in the settings of this indicator.
SETTINGS
Can set the source of the UPPER band indivuadilly
Can set the source of the LOWER band indivuadilly
Can toggle the visibility of the bands, this will not affect the calculations
Can toggle the visibility of SMAs
ALERTS AND SIGNALS
When the SMA LOW 7 cross under or over the bands, will trigger a signal orange
When the SMA 30 High cross over the upper band, will trigger a short signal purpple
HOW TO USE IT
If the both signals appears (sma 7 low and sma 30 high) crossing the upper band at the same point, this means that the price will drop strongly.
If the sma 7 low cross signal (orange triangle) appears under the price and lower band, means that the price will go up.
The separation of the signals from the chart will suggest the force of the movement. While more distance be, strongest reaction of the price.
DISCLAIMER : This indicator or script does not imply or constitute financial advice, investment advice, trading advice or any other type of advice or recommendation by and for TradingView. Use it at your own risk and your own decision.
스크립트에서 "band"에 대해 찾기
TrendCylinder (Expo)█ Overview
The TrendCylinder is a dynamic trading indicator designed to capture trends and volatility in an asset's price. It provides a visualization of the current trend direction and upper and lower bands that adapt to volatility changes. By using this indicator, traders can identify potential breakouts or support and resistance levels. While also gauging the volatility to generate trading ranges. The indicator is a comprehensive tool for traders navigating various market conditions by providing a sophisticated blend of trend-following and volatility-based metrics.
█ How It Works
Trend Line: The trend line is constructed using the closing prices with the influence of volatility metrics. The trend line reacts to sudden price changes based on the trend factor and step settings.
Upper & Lower Bands: These bands are not static; they are dynamically adjusted with the calculated standard deviation and Average True Range (ATR) metrics to offer a more flexible, real-world representation of potential price movements, offering an idea of the market's likely trading range.
█ How to Use
Identifying Trends
The trend line can be used to identify the current market trend. If the price is above the trend line, it indicates a bullish trend. Conversely, if the price is below the trend line, it indicates a bearish trend.
Dynamic Support and Resistance
The upper and lower bands (including the trend line) dynamically change with market volatility, acting as moving targets of support and resistance. This helps set up stop-loss or take-profit levels with a higher degree of accuracy.
Breakout vs. Reversion Strategies
Price movements beyond the bands could signify strong trends, making it ideal for breakout strategies.
Fakeouts
If the price touches one of the bands and reverses direction, it could be a fakeout. Traders may choose to trade against the breakout in such scenarios.
█ Settings
Volatility Period: Defines the look-back period for calculating volatility. Higher values adapt the bands more slowly, whereas lower values adapt them more quickly.
Trend Factor: Adjusts the sensitivity of the trend line. Higher values produce a smoother line, while lower values make it more reactive to price changes.
Trend Step: Controls the pace at which the trend line adjusts to sudden price movements. Higher values lead to a slower adjustment and a smoother line, while lower values result in quicker adjustments.
-----------------
Disclaimer
The information contained in my Scripts/Indicators/Ideas/Algos/Systems does not constitute financial advice or a solicitation to buy or sell any securities of any type. I will not accept liability for any loss or damage, including without limitation any loss of profit, which may arise directly or indirectly from the use of or reliance on such information.
All investments involve risk, and the past performance of a security, industry, sector, market, financial product, trading strategy, backtest, or individual's trading does not guarantee future results or returns. Investors are fully responsible for any investment decisions they make. Such decisions should be based solely on an evaluation of their financial circumstances, investment objectives, risk tolerance, and liquidity needs.
My Scripts/Indicators/Ideas/Algos/Systems are only for educational purposes!

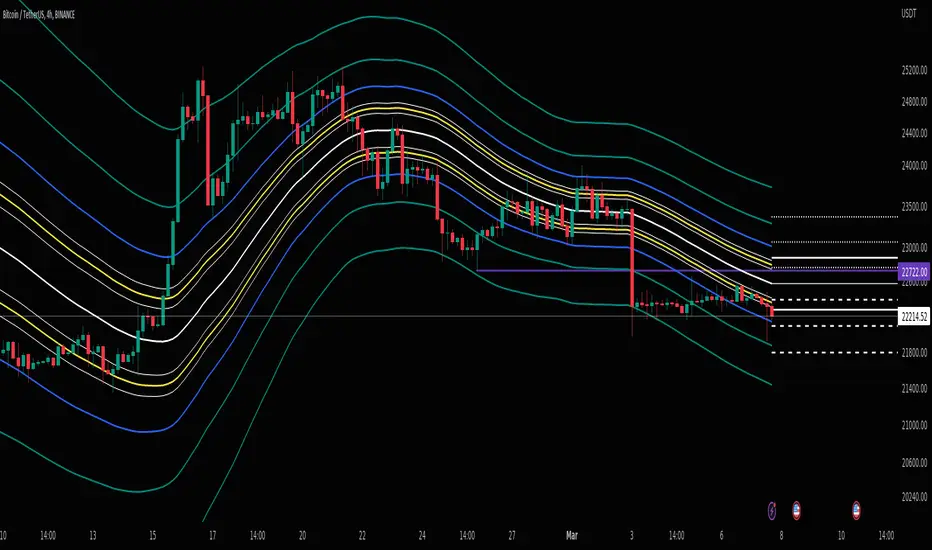
Bitcoin to GOLD [presentTrading]**Introduction and How it is Different**
Unlike traditional indicators, the BTGR offers a unique perspective on market sentiment and asset valuation by juxtaposing two seemingly disparate assets: Bitcoin, the digital gold, and Gold, the traditional store of value. This article introduces an advanced version of this ratio, complete with upper and lower bands calculated using standard deviations. These bands add an extra layer of analytical depth, allowing for more nuanced trading strategies.
BTCUSD 12h bigger picture
**Economic Principles**
The BTGR is rooted in the economic principles of asset valuation and market sentiment. Gold has long been considered a safe haven asset, a place where investors park their money during times of economic uncertainty. Bitcoin, on the other hand, is often viewed as a high-risk, high-reward investment. By comparing the two, the BTGR provides insights into the broader market sentiment.
- Risk Appetite: A high BTGR indicates a bullish sentiment towards riskier assets like Bitcoin.
- Market Uncertainty: A low BTGR suggests a bearish sentiment and a flight to the safety of Gold.
- Asset Diversification: The BTGR can be used as a tool for portfolio diversification, helping investors balance risk and reward.
**How to Use It**
Setting Up the Indicator
- Platform: The indicator is designed for use on TradingView.
- Time Frame: A 480-minute time frame is recommended for more accurate signals.
- Parameters: The moving average is set at 200 periods, and the standard deviation is calculated over the same period.
**Trading Signal**
Long Entry: Consider going long when the BTGR crosses above the upper band.
Short Entry: Consider going short when the BTGR crosses below the lower band.
Note: Due to the issue that the number of trading is less than about 100 times, the corresponding strategy is not allowed to publish.

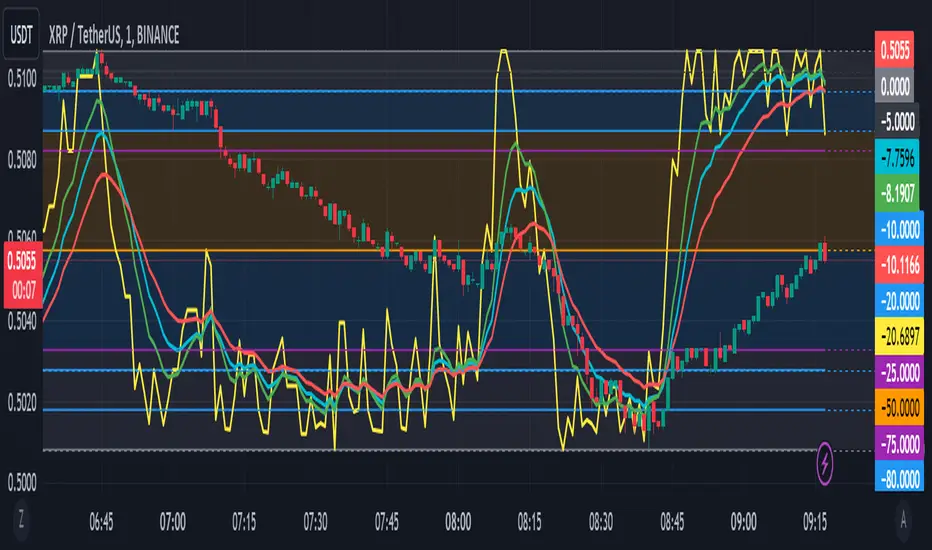
Williams %R with EMA'sThe provided Pine Script code presents a comprehensive technical trading strategy on the TradingView platform, incorporating the Williams %R indicator, exponential moving averages (EMAs), and upper bands for enhanced decision-making. This strategy aims to help traders identify potential buy and sell signals based on various technical indicators, thereby facilitating more informed trading decisions.
The key components of this strategy are as follows:
**Williams %R Indicator:** The Williams %R, also known as the "Willy," is a momentum oscillator that measures overbought and oversold conditions. In this code, the Williams %R is calculated with a user-defined period (default 21) and smoothed using an exponential moving average (EMA).
**Exponential Moving Averages (EMAs):** Two EMAs are computed on the Williams %R values. The "Fast" EMA (default 8) responds quickly to price changes, while the "Slow" EMA (default 21) provides a smoother trend-following signal. Crossovers and divergences between these EMAs can indicate potential buy or sell opportunities.
**Candle Color Detection:** The code also tracks the color of candlesticks, distinguishing between green (bullish) and red (bearish) candles. This information is used in conjunction with other indicators to identify specific trading conditions.
**Additional Upper Bands:** The script introduces upper bands at various levels (-5, -10, -20, -25) to create zones for potential buy and sell signals. These bands are visually represented on the chart and can help traders gauge the strength of a trend.
**Alert Conditions:** The code includes several alert conditions that trigger notifications when specific events occur, such as %R crossing certain levels, candle color changes within predefined upper bands, and EMA crossovers.
**Background Highlighting:** The upper bands and the zero line are visually highlighted with different colors, making it easier for traders to identify critical price levels.
This code is valuable for traders seeking a versatile technical strategy that combines multiple indicators to improve trading decisions. By incorporating the Williams %R, EMAs, candlestick analysis, and upper bands, it offers a holistic approach to technical analysis. Traders can customize the parameters to align with their trading preferences and risk tolerance. The use of alerts ensures that traders are promptly notified of potential trade setups, allowing for timely execution and risk management. Overall, this code serves as a valuable tool for traders looking to make more informed decisions in the dynamic world of financial markets.
ATR + Momentum Shifts w/Take ProfitThis script is a technical analysis indicator designed to assist in identifying potential entry points and setting take profit levels in trading. It combines the Average True Range (ATR) indicator, momentum shifts, and customizable take profit levels to provide insights into potential market movements.
Differences from Currently Published Ones:
This script is unique due to its use of a combination of elements:
ATR and Momentum: The script combines the ATR indicator to provide dynamic support and resistance levels with the momentum indicator to identify shifts in the underlying momentum.
Customizable Take Profit Levels: It offers the ability to set take profit levels based on customizable multipliers of the ATR, helping traders manage potential profits.
How to Use:
ATR Bands: The script plots upper and lower ATR bands as potential dynamic support and resistance levels.
Shift Arrows: Arrows are plotted below bars for potential long entry opportunities (green triangle) and above bars for potential short entry opportunities (yellow triangle).
Take Profit Levels: The script also plots take profit levels both above and below the source price based on the ATR multipliers set in the inputs.
Markets and Conditions:
This script can be used across various financial markets, including stocks, forex, commodities, and cryptocurrencies. It's most effective in trending markets where momentum shifts can signal potential reversals or continuation of trends. Traders should consider the following conditions:
Trend Confirmation: Look for momentum shifts in the direction of the prevailing trend for higher probability setups.
Volatility: Higher volatility can amplify ATR movements and subsequently affect the placement of ATR bands and take profit levels.
Risk Management: Always implement proper risk management strategies to protect your capital.
Additional Considerations:
Customization: Traders can adjust input parameters like ATR length, momentum length, and take profit multipliers to match their trading style and market conditions.
Combining with Other Indicators: Consider using this indicator in conjunction with other technical indicators or chart patterns for confirmation.

Edri Extreme Points Buy & SellEDRI EXTREME POINTS BUY & SELL INDICATOR
This Buy and Sell (non-repainting) indicator uses signals based on the combined CCI/Momentum and RSI indicators and optional regular divergence.
The idea of the indicator is to look for a potential reversal after the price reached extreme points (overbought or oversold) and signals an entry when the price shows signs of momentum for reversal.
Optionally, it considers finding a divergence while RSI is at the extreme levels to improve the predictability of a possible reversal.
Additionally, the indicator includes a simple Mean Reversion visual on the chart to assist users in identifying extreme price levels and potential reversal opportunities. It features upper and lower bands that can be optionally plotted, showing calculated values where price bounces at those extreme levels.
The purpose of these bands is to help traders avoid getting trapped in the middle of a trend and to guide them to buy low and sell high. (It's important to note that this is purely a visual aid and does not impact the generation of trade signals.)
By utilizing the Mean Reversion bands alongside the entry conditions, traders can gain insights into potential price reversals and make more informed decisions about when to enter or exit trades.
Buy and Sell Entry conditions:
• The indicator looks at the CCI/Momentum indicator to turn positive (if buy) or negative (if sell) after the RSI was overbought or oversold in the recent past.
• It also checks if there is a 3-period regular bullish divergence in the RSI (if buy), or regular bearish divergence (if sell) and consider these in the entry condition.
• If these conditions are met, this indicator suggests that it may be a good time to enter a trade.
In summary this is how this indicator works:
• The indicator takes input settings such as the choice between using CCI or Momentum as the entry signal source, length parameters for CCI/Momentum, RSI levels for overbought and oversold conditions, RSI length, and options to plot mean reversion bands on the chart.
• It calculates the CCI and Momentum and RSI values based on user-defined length..
• It checks for regular bullish and bearish divergences (3 periods) in the RSI if the option is enabled.
• The script plots shapes on the chart to indicate the buy and sell signals based on the entry conditions.
• If the mean reversion bands option is enabled, it calculates the mean reversion, standard deviation, upper band, and lower band values.
• It also plots the upper band, mean reversion line, and lower band on the chart if the mean reversion bands option is enabled.
• This indicator includes alert conditions to generate alerts for the buy and sell signals.
• On top of that, users can opt to use only one alert for both buy and sell signals. (This can save Trading view subscribers with limited alerts.)
Important! Please do not consider everything you read here as financial advice. Additionally, do not rely solely on indicators for making your trading decisions. It is important to note that no indicator or strategy is perfect. Therefore, it is always recommended to backtest everything and practice proper risk management.
I appreciate your feedback on this indicator. As I am new to script development, I am open to comments and suggestions to improve it. If you encounter any issues while using this indicator, please let me know in the comments section. If you find it helpful, I kindly ask for your support in boosting it. Thank you for your cooperation.

VOLD Ratio (Volume Difference Ratio) by TenozenAnother helpful indicator is here! VOLD Ratio is calculated by the net volume of a buying candle, divided by the net volume of a sell candle.
Formula:
buying net volume/selling net volume
It's a simple indicator, but don't underestimate this simplicity. It's a powerful indicator that would help you to decide whether the volume is getting interested in the direction that the market would take. So assume when the market is above the Bollinger Bands, it means that the volume is at a buying extreme, by that, we could expect the market to get back towards the mean, as there is a lot of buying demand that entered the market. How about below the Bollinger Bands? it means that the volume is at a selling extreme, we could expect that there is a lot of volume getting in toward the sellers, so we could take advantage of the opportunity to go for a long. Lastly, the Bollinger Bands would help you guys to determine the liquidity of the market, if the Bollinger Bands get smaller over time, it means there is no interest for the market to enter yet, and if the Bollinger Bands get bigger over time, it means there is interest for the market to enter in the session.
Tips & Reminder:
- We shouldn't use this indicator by itself, make sure to use an Indicator that would help you guys to determine the momentum and the liquidity of the market.
- The higher the timeframe, the slower this indicator would signal an entry, by that use a smaller timeframe... I suggest using a 15M chart for the execution.
- Always trade in the medium-longterm direction if you want to have a high probability trade.
- Be patient in your execution, it's more likely the market would go higher or lower after going in the extreme of the Bollinger Bands.
Well, that's it! Hope you guys enjoy using this indicator, let me know if there is any question or suggestion. Ciao...

Scalping Strategy (5min)This indicator is designed for scalping strategies on a 5-minute timeframe. It generates signals based on two RSI crossovers and incorporates moving averages to identify trends. Additionally, a Bollinger Band is included to eliminate the need for an additional Bollinger Band on the chart.
Please note that this indicator does not guarantee 100% accurate signals and may produce false signals. It is recommended to use this indicator in conjunction with other indicators such as Stochastic, MACD, SuperTrend, or any other suitable indicators to enhance the accuracy of trading decisions.
1) Signal Generation: The indicator generates buy and sell signals based on two RSI crossovers. A buy signal is generated when the fast RSI crosses above the slow RSI, indicating potential bullish momentum. Conversely, a sell signal is generated when the fast RSI crosses below the slow RSI, suggesting potential bearish momentum.
2) To adjust the indicator to your specific chart and trading preferences, you have the flexibility to modify the RSI and moving average (MA) values. By changing the RSI values (slow RSI length and fast RSI length), you can fine-tune the sensitivity of the RSI crossovers to suit different timeframes and market conditions. Similarly, adjusting the MA values (slow MA period and fast MA period) allows you to adapt the indicator to the desired trend identification and short-term trend confirmation.
3) Pay attention to trades that are confirmed by the short-term moving average (MA) aligning with the desired direction. For buy signals, ensure that the short MA is tending upward, indicating a potential uptrend. For sell signals, confirm that the short MA is trending downward, suggesting a potential downtrend.
4) Moving Averages: The indicator uses a 200-period moving average (MA) to identify the overall trend and a short-term MA for additional confirmation.
5) Bollinger Band: The included Bollinger Band is not directly used in the indicator's calculations. However, it is provided for convenience so that users don't need to add another Bollinger Band to their chart separately.
6) Exercise caution when the short MA is below the 200-period MA but showing signs of attempting an upward move. These situations may indicate a potential reversal or consolidation, and it is advisable to avoid taking trades solely based on the 200-period MA crossover in such cases.
Remember that these guidelines are intended to provide additional insights and should be used in combination with your trading judgment and analysis.

BB Mod + ForecastThis is a combination of two previous indicators; ALMA stdev band with fibs and Vector MACD.
Bollinger Band Mod fits the standard deviation on both sides of the center moving average ( ALMA +/- stdev / 2 ) and calculates Fibonacci ratios from stdev on both sides.
It is more averaging and more responsive at the same time compared to Bollinger Band.
Forecast is calculated from difference between origin ma ( ALMA from hl2 ) and six different period Hull moving averages averaged together and added to the center ma on both sides.
Fibonacci levels for 0.618 1.618 and 2.618 are added.
The dashed lines point towards the trend. Gives you a better idea of the current trend and momentum in the band.
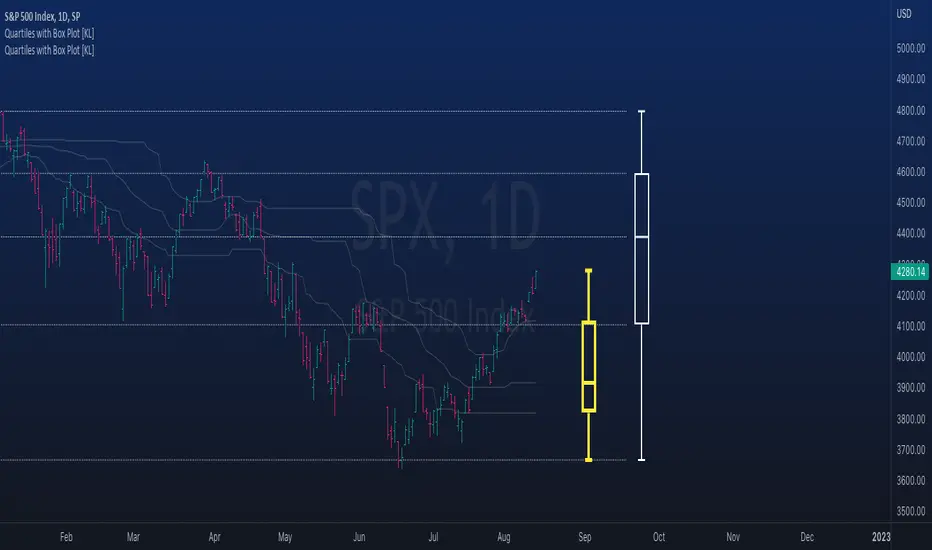
Rolling QuartilesThis script will continuously draw a boxplot to represent quartiles associated with data points in the current rolling window.
Description :
A quartile is a statistical term that refers to the division of a dataset based on percentiles.
Q1 : Quartile 1 - 25th percentile
Q2 : Quartile 2 - 50th percentile, as known as the median
Q3 : Quartile 3 - 75th percentile
Other points to note:
Q0: the minimum
Q4: the maximum
Other properties :
- Q1 to Q3: a range is known as the interquartile range ( IQR ). It describes where 50% of data approximately lie.
- Line segments connecting IQR to min and max (Q0→Q1, and Q3→Q4) are known as whiskers . Data lying outside the whiskers are considered as outliers. However, such extreme values will not be found in a rolling window because whenever new datapoints are introduced to the dataset, the oldest values will get dropped out, leaving Q0 and Q4 to always point to the observable min and max values.
Applications :
This script has a feature that allows moving percentiles (moving values of Q1, Q2, and Q3) to be shown. This can be applied for trading in ways such as:
- Q2: as alternative to a SMA that uses the same lookback period. We know that the Mean (SMA) is highly sensitive to extreme values. On the other hand, Median (Q2) is less affected by skewness. Putting it together, if the SMA is significantly lower than Q2, then price is regarded as negatively skewed; prices of a few candles are likely exceptionally lower. Vice versa when price is positively skewed.
- Q1 and Q3: as lower and upper bands. As mentioned above, the IQR covers approximately 50% of data within the rolling window. If price is normally distributed, then Q1 and Q3 bands will overlap a bollinger band configured with +/- 0.67x standard deviations (modifying default: 2) above and below the mean.
- The boxplot, combined with TradingView's builtin bar replay feature, makes a great tool for studies purposes. This helps visualization of price at a chosen instance of time. Speaking of which, it can also be used in conjunction with a fixed volume profile to compare and contrast the effects (in terms of price range) with and without consideration of weights by volume.
Parameters :
- Lookback: The size of the rolling window.
- Offset: Location of boxplot, right hand side relative to recent bar.
- Source data: Data points for observation, default is closing price
- Other options such as color, and whether to show/hide various lines.
Ultimate IndicatorThis is a combination of all the price chart indicators I frequently switch between. It contains my day time highlighter (for day trading), multi-timeframe long-term trend indicator for current commodity in the bottom right, customizable trend EMA which also has multi-timeframe drawing capabilities, VWAP, customizable indicators with separate settings from the trend indicator including: EMA, HL2 over time, Donchian Channels, Keltner Channels, Bollinger Bands, and Super Trend. The settings for these are right below the trend settings and can have their length and multiplier adjusted. All of those also have multi-timeframe capabilities separate from the trend multi-time settings.
The Day Trade Highlight option will draw faint yellow between 9:15-9:25, red between 9:25-9:45, yellow between 9:45-10:05. There will be one white background at 9:30am to show the opening of the market. while the market is open there will be a very faint blue background. For the end of the day there will be yellow between 15:45-15:50, red between 15:50-16:00, and yellow between 16:00-16:05. During the night hours, there is no coloring. The purpose of this highlight is to show the opening / closing times of the market and the hot times for large moves.
The indicators can also be colored in the following ways:
1. Simple = Makes all colors for the indicator Gray
2. Trend = Will use the Donchian Channels to get the short-trend direction and by default will color the short-term direction as Blue or Red. Unless using Super Trend, the Donchian Channel is used to find short-term trend direction.
3. Trend Adv = Will use the Donchian Channels to get the short-trend direction and by default will color the short-term direction as Blue or Red. Unless using Super Trend, the Donchian Channel is used to find short-term trend direction. If there is a short-term up-trend during a long-term down-trend, the Blue will become Navy. If short-term down-trend during long-term up-trend, the Red will be Brown.
4. Squeeze = Compares the Bollinger Bands width to the Keltner Channels width and will color based on relative squeeze of the market: Teal = no squeeze. Yellow = little squeeze. Red = decent squeeze. White = huge squeeze. if you do not understand this one, try drawing the Bollinger Bands while using the Squeeze color option and it should become more apparent how this works. I also recommend leaving the length and multiplier to the default 20 and 2 if using this setting and only changing the timeframe to get longer/shorter lengths as I've seen that changing the length or multiplier can more or less make it not work at all.
Along with the indicator settings are options to draw lines/labels/fills for the indicator. I enjoy having only fills for a cleaner look.
The Labels option will show Buy/Sell signals when the short-term trend flips to agree with the long-term trend.
The Trend Bars option will do the same as the Labels option but instead will color the bars white when a Buy/Sell option is given.
The Range Bars option shows will color a bar white when the Close of a candle is outside of a respective ranging indicator option (Bollinger or Keltner).
The Trend Bars will draw white candles no matter which indicator selection you make (even "Off"). However, Range Bars will only draw white when either Bollinger or Keltner are selected.
The Donchian Channels and Super Trend are trending indicators and should be used during trending markets. I like to use the MACD in conjunction with these indicators for possibly earlier entries.
The Bollinger Bands and Keltner Channel are ranging indicators and should be used during ranging markets. I like to use the RSI in conjunction with these indicators and will use 60/40 for overbought and oversold areas rather than 70/30. During a range, I wait for an overbought or oversold indication and will buy/sell when it crosses back into the middle area and close my position when it touches the opposite band.
I have a MACD/RSI combination indicator if you'd like that as well :D
As always, trade at your own risk. This is not some secret indicator that will 100% win. As always, the trades you see in the picture use a 1:1.5 or 1:2 risk to reward ratio, for today (August 8, 2022) it won 5/6 times with one trade still open at the end of the day. Manage your account correctly and you'll win in the long term. Hit me up with any questions or suggestions. Happy Trading!

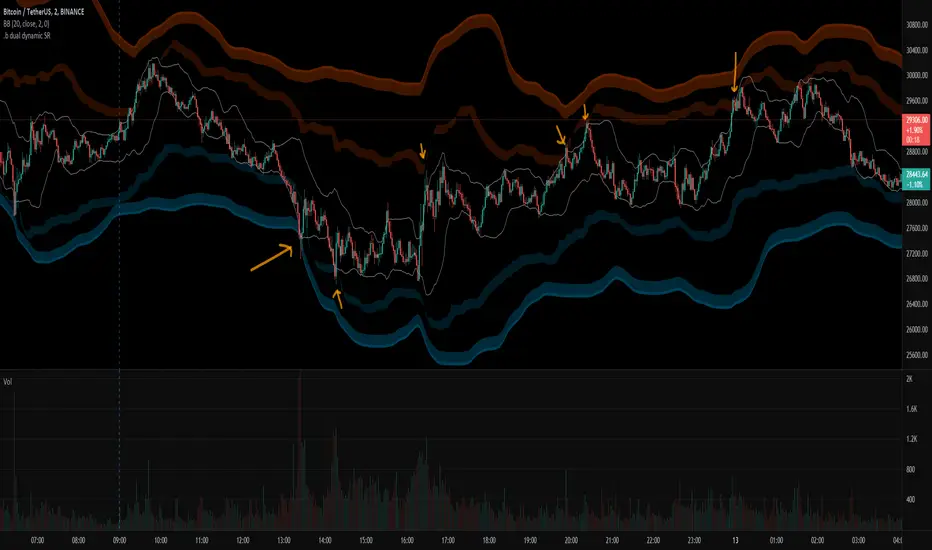
.b dual dynamic SRThis is dual band dynamic S/R indicator
It works on longger swing than BB 20,2 band rage, and I think It works well.
even on the rapid price change, it quite woks well.
If price goes out of 1st S/R band range, 2nd S/R band shows up on the chart.
Because of large bandwidth, An area in which an actual candle is drawn may be displayed as small.
So, with some codework, I made the S/R band occupy only the area near the actual candle drawing area.
The S/R band value is calculated as a combination of donchian band, high/low, atr, etc.
and regular default setting value is fixed on the code level. you can change the color set.
For more information, please refer to the source code.
if you have any questions freely contact to me by message on tradingview, or telegram @sr_bt
but please understand that responses may be quite late.
-------------------------------------------------------------------------------------------------------------------------------------------
Special thanks to all of contributors of community.
The script (originaly .b) may be freely distributed under the MIT license.
without a clear understanding of the house rules,
Several indicators on the charts, it should be clean chart on publishing.
So I am re-publishing as a new one, sorry about that.
Bandpass Filters v.02
This is an alternative way to do bandpass filtering. I Still need to update it to support moveable frequency bands. The lowBandpass() is just a 'trick,' as it simply subtracts the highBandpass() from the close data, so it is not really accurate in that it removes the low frequencies, just in a rather less-than-ideal manner.
The "spectrum" of the dataset to filter will always be from 0 to 100, so think of filter boundary as %. So, a boundary of 40% means: 40% of the low-frequencies have been removed from the original data to make the red graph, and 40% of the high-frequencies have been removed from the original data to make the green graph.
This came about after reading the excellent tutorial on signal processing in Pine Script (www.pinecoders.com), as the techniques listed there did not do exactly what I was looking for.
Here is a low-pass graph
Here is a hi-pass graph

Regression Channel (ShareScope-style, parallel)What it does
Replicates ShareScope’s Trend of displayed data look: a single straight linear-regression line (dashed) across a chosen window with parallel, constant-width bands above and below, plus optional shading.
Use it to see the overall trend gradient for a period and a statistically sized channel based on the fit’s residual error.
How it works (math, short)
Computes an OLS regression once over the analysis window.
Residual standard error s is derived from SSE and degrees of freedom (n−2).
Band half-width is constant across the window:
Mean CI (narrower): half = z * s / √n
Prediction (wider): half = z * s * √(1 + 1/n)
Three straight, parallel lines are drawn from the regression endpoints; midline is dashed.
This is intentionally not a tapered CI (which widens at the ends). It matches the visual behaviour of ShareScope’s shaded trend line channel.
Inputs
Source – Price series (Close, High, Low, HL2, etc.).
Use last N bars / N (bars) – Rolling window length.
From / To (date mode) – Alternative fixed date window.
Confidence (%) – 90 / 95 / 99 / Custom (uses z≈t).
Custom Z (t) – Override the quantile if desired.
Prediction bands – Use wider prediction envelope instead of mean CI.
Shade region + colors / opacity / line width.
Usage
To mimic ShareScope exactly, pick the same date span (use date mode) and set Confidence 99%.
Choose Prediction OFF for a tighter “confidence” look; ON for a wider, more permissive channel.
If ShareScope used High as source, set Source = High here as well.
Notes & limitations
TradingView does not expose the visible viewport to Pine. The script cannot auto-read “displayed data.” Use last N bars or date range.
Bands are parallel by design. Prices may close outside; the channel does not bend.
Window capped at 5,000 bars for performance. No alerts are emitted.
Differences vs TV’s native tools
Linear Regression (drawing) – manual object; no statistical sizing or shading.
Linear Regression Channel (indicator) – uses price standard deviations around the regression; width is a user stdev multiple.
This script – uses residual error of the OLS fit and a z/t quantile to size a statistically meaningful parallel channel.
Changelog
r3.1 – Guard fix (no return at top level), minor refactor, stable line updates.
r3 – Switched to single-fit OLS with parallel constant-width bands (ShareScope look).
(Earlier experimental builds r1–r2.2 implemented rolling/tapered CI; superseded.)
Disclaimer: Educational use only. Not investment advice.

EMA ± ATR Channel (True Range)EMA ± ATR Channel (True Range)
Tagline: Adaptive EMA channel with ATR-based volatility bands — perfect for swing trading, intraday setups, and managing risk on high-volatility stocks.
This script plots a dynamic price channel around a configurable EMA using the Average True Range (ATR, Wilder’s True Range) as a volatility buffer.
Upper band = EMA + (ATR × multiplier)
Lower band = EMA – (ATR × multiplier)
📊 Features:
Adjustable EMA length, ATR length, and ATR multiplier
Visual channel fill between upper and lower bands
Optional on-chart help panel with practical combos
⚡ Practical Combos for Volatile Stocks:
EMA 20 + ATR 14 × 2.0 → most common swing trading setup
EMA 10 + ATR 14 × 1.5 → very responsive, good for intraday/high-beta names
EMA 20 + ATR 20 × 2.5 → smoother, wider channel, avoids whipsaws in chaotic stocks
✅ Use cases:
Identify dynamic support/resistance zones
Volatility-based stop-loss & take-profit placement
Spot overextensions from the trend midline
🔖 Tags:
ema, atr, channel, volatility, trend, support resistance, stop loss, swing trading, intraday, risk management, indicator

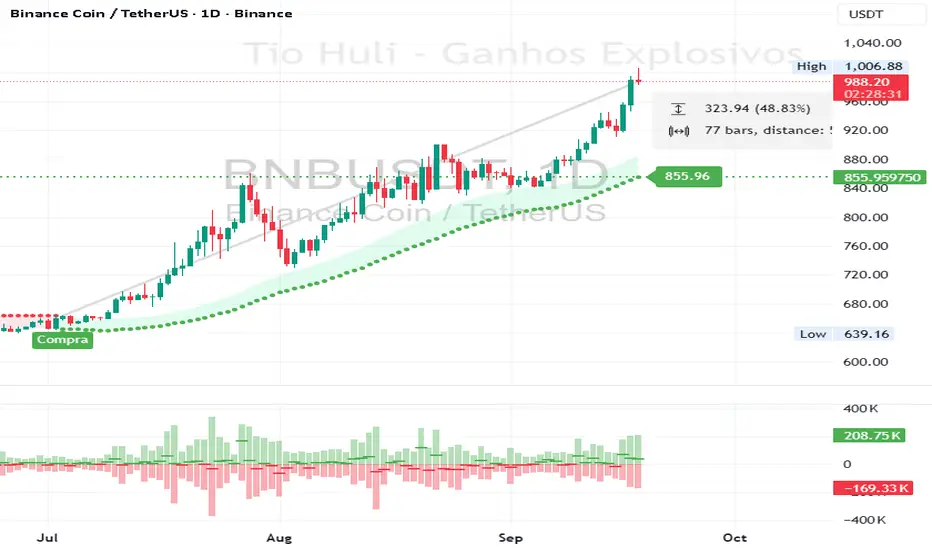
CHiLo — Custom HiLo (SMA/EMA, Activator, Shading, Auto-Decimals)CHiLo is a clean Hi/Lo trend read with SMA/EMA options, a HiLo vs. HiLo Activator mode, optional band shading , and a right-side HiLo marker with automatic decimals based on the symbol. Optional Buy/Sell labels mark state flips. Inspired by the broader trend-following literature and practitioners; in Brazil, educator Hulisses “Tio Huli” Dias is a notable voice popularizing trend following.
What it does
CHiLo plots a Hi/Lo state with two modes:
HiLo (classic high/low bands)
HiLo Activator (activator-style behavior)
It includes:
SMA/EMA selection
Optional shading between Hi/Lo bands
Optional Buy/Sell labels on state flips
HiLo marker (auto-decimals from the symbol’s tick size)
Goal: deliver a fast, visual trend context that you can pair with your own risk rules and confirmations.
How to use
Add the indicator and choose Mode (HiLo / Activator) and MA type (SMA/EMA).
Tune Period (and Offset if needed). Higher = smoother (fewer flips); lower = more responsive.
Toggle Shading to emphasize the envelope.
Toggle Buy/Sell labels if you want flip markers.
Use the HiLo marker on the right to read the current level (auto-formatted).
Inputs (quick reference)
Period / Offset — sensitivity vs. delay.
Type — HiLo or HiLo Activator.
MA Type — SMA (steadier) or EMA (snappier).
HiLo Style — Points or Line.
Shading & Transparency — highlight the band area.
Buy/Sell Labels — on/off.
HiLo Marker — size and horizontal offset (decimals automatic).
Notes & credits
Educational use only; not financial advice.
For best results, combine with position sizing, stops, and regime filters.
PCV (Darren.L-V2)Description:
This indicator combines Bollinger Bands, CCI, and RVI to help identify high-probability zones on M15 charts.
Features:
Bollinger Bands (BB) – displayed on the main chart in light gray. Helps visualize overbought and oversold price levels.
CCI ±100 levels + RVI – displayed in a separate sub-window:
CCI only shows the ±100 reference lines.
RVI displays a cyan main line and a red signal line.
Valid Zone Detection:
Candle closes outside the Bollinger Bands.
RVI crosses above +100 or below -100 (CCI level reference).
Candle closes back inside the BB, confirming a price rebound.
Requires two touches in the same direction to confirm the zone.
Only zones within 20–30 pips range are considered valid.
Usage:
Helps traders spot reversal or bounce zones with clear visual signals.
Suitable for all indices, Forex, and crypto on M15 timeframe.

ATR-limited Donchian ChannelThe ATR-limited Donchian Channel is a modified version of the classic Donchian Channel that adapts more quickly to changing market conditions.
While a traditional Donchian Channel is based only on the highest high and lowest low over a given lookback period, this version introduces an ATR-based constraint that prevents the channel lines from extending too far away from price. This makes the channel more responsive and reduces lag compared to the standard Donchian Channel.
How it works
The upper band is based on the highest high of the last N candles, but it cannot exceed a maximum distance of ATR × Factor above the current median price (midpoint of high and low).
The lower band is based on the lowest low of the last N candles, but it cannot drop more than ATR × Factor below the median price.
If the Donchian Channel would normally extend further than this ATR-limited boundary, the line is capped and marked in blue .
Otherwise, the upper band is drawn in red and the lower band in green .
A middle line is also plotted as the average of the modified upper and lower bands.
An optional offset allows you to shift the channel backward or forward in time for easier visual alignment.
Why use this version?
Faster reaction: By constraining the channel with ATR, the indicator adapts quicker to volatility changes and avoids long periods of overextended levels.
Noise control: ATR filtering prevents extreme spikes or outlier highs/lows from stretching the channel unnecessarily.
Visual clarity: Color-coding highlights when ATR filtering is active, making it easy to distinguish capped vs. natural Donchian levels.
Typical use cases
Trend-following breakout systems, but with volatility-aware limits.
Identifying dynamic support and resistance zones that adjust to market conditions.
Filtering false breakouts by monitoring when the Donchian channel is capped by ATR.
✅ This indicator is designed for traders who want the structure of a Donchian Channel but with an adaptive, volatility-sensitive adjustment that makes it react faster and more reliably than the classic version.

Squeeze Momentum Regression Clouds [SciQua]╭──────────────────────────────────────────────╮
☁️ Squeeze Momentum Regression Clouds
╰──────────────────────────────────────────────╯
🔍 Overview
The Squeeze Momentum Regression Clouds (SMRC) indicator is a powerful visual tool for identifying price compression , trend strength , and slope momentum using multiple layers of linear regression Clouds. Designed to extend the classic squeeze framework, this indicator captures the behavior of price through dynamic slope detection, percentile-based spread analytics, and an optional UI for trend inspection — across up to four customizable regression Clouds .
────────────────────────────────────────────────────────────
╭────────────────╮
⚙️ Core Features
╰────────────────╯
Up to 4 Regression Clouds – Each Cloud is created from a top and bottom linear regression line over a configurable lookback window.
Slope Detection Engine – Identifies whether each band is rising, falling, or flat based on slope-to-ATR thresholds.
Spread Compression Heatmap – Highlights compressed zones using yellow intensity, derived from historical spread analysis.
Composite Trend Scoring – Aggregates directional signals from each Cloud using your chosen weighting model.
Color-Coded Candles – Optional candle coloring reflects the real-time composite score.
UI Table – A toggleable info table shows slopes, compression levels, percentile ranks, and direction scores for each Cloud.
Gradient Cloud Styling – Apply gradient coloring from Cloud 1 to Cloud 4 for visual slope intensity.
Weight Aggregation Options – Use equal weighting, inverse-length weighting, or max pooling across Clouds to determine composite trend strength.
────────────────────────────────────────────────────────────
╭──────────────────────────────────────────╮
🧪 How to Use the Indicator
1. Understand Trend Bias with Cloud Colors
╰──────────────────────────────────────────╯
Each Cloud changes color based on its current slope:
Green indicates a rising trend.
Red indicates a falling trend.
Gray indicates a flat slope — often seen during chop or transitions.
Cloud 1 typically reflects short-term structure, while Cloud 4 represents long-term directional bias. Watch for multi-Cloud alignment — when all Clouds are green or red, the trend is strong. Divergence among Clouds often signals a potential shift.
────────────────────────────────────────────────────────────
╭───────────────────────────────────────────────╮
2. Use Compression Heat to Anticipate Breakouts
╰───────────────────────────────────────────────╯
The space between each Cloud’s top and bottom regression lines is measured, normalized, and analyzed over time. When this spread tightens relative to its history, the script highlights the band with a yellow compression glow .
This visual cue helps identify squeeze zones before volatility expands. If you see compression paired with a changing slope color (e.g., gray to green), this may indicate an impending breakout.
────────────────────────────────────────────────────────────
╭─────────────────────────────────╮
3. Leverage the Optional Table UI
╰─────────────────────────────────╯
The indicator includes a dynamic, floating table that displays real-time metrics per Cloud. These include:
Slope direction and value , with historical Min/Max reference.
Top and Bottom percentile ranks , showing how price sits within the Cloud range.
Current spread width , compared to its historical norms.
Composite score , which blends trend, slope, and compression for that Cloud.
You can customize the table’s position, theme, transparency, and whether to show a combined summary score in the header.
────────────────────────────────────────────────────────────
╭─────────────────────────────────────────────╮
4. Analyze Candle Color for Composite Signals
╰─────────────────────────────────────────────╯
When enabled, the indicator colors candles based on a weighted composite score. This score factors in:
The signed slope of each Cloud (up, down, or flat)
The percentile pressure from the top and bottom bands
The degree of spread compression
Expect green candles in bullish trend phases, red candles during bearish regimes, and gray candles in mixed or low-conviction zones.
Candle coloring provides a visual shorthand for market conditions , useful for intraday scanning or historical backtesting.
────────────────────────────────────────────────────────────
╭────────────────────────╮
🧰 Configuration Guidance
╰────────────────────────╯
To tailor the indicator to your strategy:
Use Cloud lengths like 21, 34, 55, and 89 for a balanced multi-timeframe view.
Adjust the slope threshold (default 0.05) to control how sensitive the trend coloring is.
Set the spread floor (e.g., 0.15) to tune when compression is detected and visualized.
Choose your weighting style : Inverse Length (favor faster bands), Equal, or Max Pooling (most aggressive).
Set composite weights to emphasize trend slope, percentile bias, or compression—depending on your market edge.
────────────────────────────────────────────────────────────
╭────────────────╮
✅ Best Practices
╰────────────────╯
Use aligned Cloud colors across all bands to confirm trend conviction.
Combine slope direction with compression glow for early breakout entry setups.
In choppy markets, watch for Clouds 1 and 2 turning flat while Clouds 3 and 4 remain directional — a sign of potential trend exhaustion or consolidation.
Keep the table enabled during backtesting to manually evaluate how each Cloud behaved during price turns and consolidations.
────────────────────────────────────────────────────────────
╭───────────────────────╮
📌 License & Usage Terms
╰───────────────────────╯
This script is provided under the Creative Commons Attribution-NonCommercial 4.0 International License .
✅ You are allowed to:
Use this script for personal or educational purposes
Study, learn, and adapt it for your own non-commercial strategies
❌ You are not allowed to:
Resell or redistribute the script without permission
Use it inside any paid product or service
Republish without giving clear attribution to the original author
For commercial licensing , private customization, or collaborations, please contact Joshua Danford directly.

BTC 1m Chop Top/Bottom Reversal (Stable Entries)Strategy Description: BTC 5m Chop Top/Bottom Reversal (Stable Entries)
This strategy is engineered to capture precise reversal points during Bitcoin’s choppy or sideways price action on the 5-minute timeframe. It identifies short-term tops and bottoms using a confluence of volatility bands, momentum indicators, and price structure, optimized for high-probability scalping and intraday reversals.
Core Logic:
Volatility Filter: Uses an EMA with ATR bands to define overextended price zones.
Momentum Divergence: Confirms reversals using RSI and MACD histogram shifts.
Price Action Filter: Requires candle confirmation in the direction of the trade.
Locked Signal Logic: Prevents repaints and disappearing trades by confirming signals only once per bar.
Trade Parameters:
Short Entry: Above upper band + overbought RSI + weakening MACD + bearish candle
Long Entry: Below lower band + oversold RSI + strengthening MACD + bullish candle
Take Profit: ±0.75%
Stop Loss: ±0.4%
This setup is tuned for traders using tight risk control and leverage, where execution precision and minimal drawdown tolerance are critical.

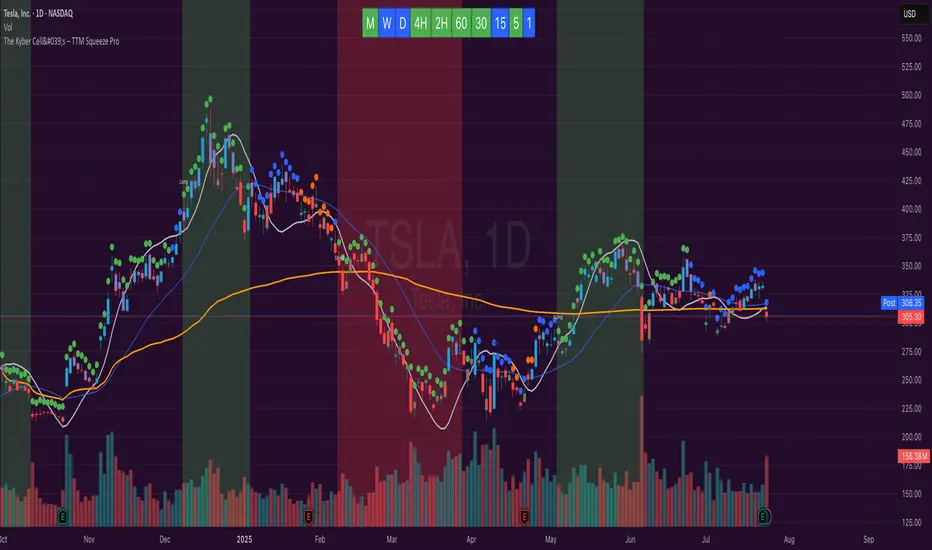
The Kyber Cell's – TTM Squeeze ProThe Kyber Cell’s TTM Squeeze Pro
TTM Squeeze + ALMA + VWAP for Precision Trade Timing
⸻
1. Introduction
Kyber Cell’s Squeeze Pro is a comprehensive, all-in-one overlay indicator built on top of John Carter’s famous TTM Squeeze concept. It integrates advanced momentum and trend analysis using Arnaud Legoux Moving Averages (ALMA), a scroll-aware VWAP with optional deviation bands, and a clean, user-friendly visual system. The goal is simple: give traders a clear and configurable chart that identifies price compression, detects release moments, confirms direction, and helps manage risk and reward visually and effectively.
This tool is intended for traders of all styles — scalpers, swing traders, or intraday strategists — looking for cleaner signals, better visual cues, and more confidence in entry/exit timing.
⸻
2. Core Concepts
At its heart, the Squeeze Pro builds an in-chart visualization of the TTM Squeeze, a strategy that identifies when price volatility compresses inside a Bollinger Band that is narrower than a Keltner Channel. These moments often precede explosive breakouts. This version categorizes squeezes into three levels of compression:
• Blue Dot – Low Compression
• Orange Dot – Medium Compression
• Red Dot – High Compression
When the squeeze “fires” (i.e., the Bollinger Bands expand beyond all Keltner thresholds), the indicator flips to a Green Dot, signaling potential entry if confirmed by trend direction.
The indicator also includes a momentum model using linear regression on smoothed price deviation to determine directional bias. Momentum is further reinforced by a customizable trend engine, allowing you to switch between EMA-21 or HMA 34/144 logic.
An ALMA ribbon is plotted across the chart to represent smoothed trend strength with minimal lag, and a scroll-aware VWAP (Volume-Weighted Average Price) line, optionally with ±σ bands, helps confirm mean-reversion or momentum continuation setups.
⸻
3. Visual Components
Squeeze Pro replaces the traditional histogram with bar coloring logic based on your selected overlay mode:
• Momentum Mode colors bars based on whether momentum is rising or falling and in which direction (aqua/blue for bullish, red/yellow for bearish).
• Trend Mode colors bars using EMA or HMA logic to identify whether price is in a bullish, bearish, or neutral trend state.
A colored backdrop is triggered when a squeeze fires and momentum direction is confirmed. It remains green for bullish runs and red for bearish runs. The background disappears when the trend exhausts or reverses.
Each squeeze level (low, medium, high) is plotted as tiny dots above or below candles, with configurable colors. On the exact bar where the squeeze fires, the indicator optionally plots entry markers — either arrows or triangles — which can be placed with adjustable padding using ATR. These provide an at-a-glance signal of possible long or short entries.
EXPERIMENTAL : For risk and reward management, protective stop lines and limit targets can be toggled on. Stops are calculated using either recent swing highs/lows or a fixed ATR multiple, depending on user preference. Limit targets are calculated from entry price using ATR-based projections.
All colors are customizable.
⸻
4. Multi-Timeframe Squeeze Panel
An optional MTF Squeeze Panel appears in the top-right corner of the chart, displaying the squeeze status across multiple timeframes — from 1-minute to Monthly. Each timeframe is color-coded:
• Red for High Compression
• Orange for Medium Compression
• Blue for Low Compression
• Yellow for Open/No Compression
This provides rapid context for whether multiple timeframes are simultaneously compressing (a common precursor to explosive moves), helping traders align higher- and lower-timeframe signals. Colors are customizable.
The MTF panel dynamically adjusts to chart space and only renders the selected intervals for clarity and performance.
⸻
5. Inputs and Configuration Options
Squeeze Pro offers a rich configuration suite:
• Squeeze Settings: Control the Bollinger Band standard deviation, and three separate Keltner Channel multipliers (for low, medium, and high compression zones).
• ALMA Controls: Adjust the smoothing length, offset, and σ factor to control ribbon sensitivity.
• VWAP Options: Toggle VWAP on/off and optionally show ±σ bands for mean reversion signals.
• Entry Markers: Customize marker shape (arrow or triangle), size (tiny to huge), color, and padding using ATR multipliers.
• Stops and Targets:
• Choose between Swing High/Low or ATR-based stop logic.
• Define separate ATR lengths and multipliers for stops and targets.
• Independently toggle their visibility and color.
• Bar Coloring Mode: Select either Momentum or Trend logic for bar overlays.
• Trend Engine: Choose between EMA-21 or HMA 34/144 for identifying trend direction.
• Squeeze Dot Colors: Customize the colors for each compression level and release state.
• MTF Panel: Toggle visibility per timeframe — from 1m to Monthly.
This high degree of customization ensures that the indicator can adapt to nearly any trading style or preference.
⸻
6. Trade Workflow Suggestions
To get the most out of this tool, traders can follow a consistent workflow:
1. Watch Dot Progression: Blue → Orange → Red indicates increasing compression and likelihood of breakout.
2. Enter on Green Dot: When the squeeze fires (green dot), confirm entry direction with bar color and backdrop.
3. Use Confirmation Tools:
• ALMA should slope in the trade direction.
• VWAP should support the price move or confirm expansion away from mean.
4. Manage Risk and Reward (experimental):
• Respect stop-loss placements (Swing/ATR).
• Use ATR-based limit targets if enabled.
5. Exit:
• Consider exiting when momentum crosses zero.
• Or exit when the background color disappears, signaling potential trend exhaustion.
⸻
7. Alerts
Includes built-in alert conditions to notify you when a squeeze fires in either direction:
• “Squeeze Long”: Triggers when a green dot appears and momentum is bullish.
• “Squeeze Short”: Triggers when a green dot appears and momentum is bearish.
You can use these alerts for automation or to stay notified of new setups even when away from the screen.
⸻
8. Disclaimer
This indicator is designed for educational purposes only and should not be interpreted as financial advice. Trading is inherently risky, and any decisions based on this tool should be made with full awareness of personal risk tolerance and capital exposure.
WRAMA Channel (Weighted RSI ATR MA)OVERVIEW
The WRAMA Channel (Weighted RSI ATR MA) is an advanced technical analysis tool designed to react more quickly to price movements compared to indicators using conventional moving averages. It combines the Relative Strength Index (RSI), Average True Range (ATR), and a weighted moving average, resulting in the WRAMA. This indicator forms a dynamic price channel based on a weighted average that incorporates both trend strength (via RSI) and market volatility (via ATR). It helps traders identify trends, potential reversals, and breakout signals, while offering broad customization options.
Key Features
WRAMA Price Channel:
Generates a dynamic channel around the weighted moving average (WRAMA), adapting to market volatility and momentum, similar to Bollinger Bands. Users are encouraged to adjust channel width and length according to their strategy.
The upper and lower channel bands are calculated based on a percentage deviation from the baseline line.
The channel fill color changes depending on the price's position relative to the baseline (green above, red below), with an optional gradient for better visualization.
Weighted Moving Average (WRAMA):
WRAMA is a custom weighted moving average (MA1), where closing prices are weighted based on RSI and ATR, allowing it to dynamically adapt to market conditions.
Baseline: The WRAMA line calculated over a user-defined period.
WRAMA Calculation:
RSI Weight: Based on RSI value. When RSI is in extreme zones (below the lower threshold or above the upper threshold), an extreme weight is applied. Otherwise, the weight is based on the squared RSI value divided by 100, raised to a power defined by the rsi_weight_factor.
ATR Weight: Based on the ATR-to-average-ATR ratio. If ATR exceeds a threshold (atr_threshold × avg_atr), an extreme weight is applied. Otherwise, the weight is based on the squared ratio of ATR to average ATR, raised to the power of the atr_weight_factor.
Combined Weight: RSI and ATR weights are combined using a rsi_atr_balance parameter. Final weight = RSI weight × balance + ATR weight × (1 - balance).
WRAMA Calculation: The closing price is multiplied by the combined weight. The result is averaged over the ma_length period and divided by the average of the weights, forming the WRAMA line. For current WRAMA (ma_length = 1), the calculation simplifies to a single weighted price.
Additional Moving Averages:
For additional confirmations, the indicator supports up to five moving averages (MA1–MA5) with various types (SMA, EMA, WMA, HMA, ALMA) and customizable periods.
All additional MAs are calculated based on WRAMA or its baseline, ensuring consistency and enabling deeper analysis within a unified methodology. MA trend directions can be tracked in a built-in signal table.
Trading Signals:
Breakout Signals: Breakouts above/below the channel are optionally marked with triangle shapes (green for bullish, red for bearish).
MA Signals: Price position relative to MAs or their slope generates bullish/bearish signals. These are optionally visualized with default triangles (green up, red down).
A signal table in the top-right corner summarizes the status of each moving average – bullish, bearish, or neutral.
Customization Options
Channel Settings:
MA Period: Length of the WRAMA baseline (default: 100).
Channel Deviation : Percentage offset from the baseline for upper/lower bands (default: 1.5%).
RSI Settings:
RSI Period: Length of the RSI calculation (default: 14).
RSI Upper/Lower Threshold: Overbought/oversold levels (default: 70/30).
RSI Weight Factor: Influence of RSI on weighting (default: 2.0).
ATR Settings:
ATR Period: ATR calculation length (default: 14).
ATR Threshold: Volatility threshold as a multiple of average ATR (default: 1.5).
ATR Weight Factor: Influence of ATR on weighting (default: 2.0).
RSI & ATR Combined:
Extreme Weight: Weight applied in extreme RSI/ATR conditions (default: 3.0).
RSI/ATR Balance: Balance between RSI and ATR influence (default: 0.5).
Signal Settings:
Show Breakout Signals: Enable/disable breakout triangles.
Show MA Signals: Enable/disable MA-based signals.
MA Signal Source: Choose between current WRAMA or baseline.
MA Signal Analysis: Based on price position or slope.
Neutral Threshold : Minimum distance from MA for signal neutrality (default: 0.5%).
Minimum MA Slope : Minimum slope for trend direction signals (default: 0.01%).
Moving Averages (MA1–MA5):
Options to enable/disable, select type (SMA, EMA, WMA, HMA, ALMA), set period length, and choose color.
Style Settings:
Gradient Fill: Enable/disable gradient coloring within the channel.
Show Baseline: Enable/disable WRAMA baseline visibility.
Colors: Customize line, fill, and signal colors.
Use Cases
Trend Identification: The WRAMA channel highlights trend direction and potential reversal zones when price contacts the channel edges.
Breakout Signals: Channel breakouts may indicate trend shifts or momentum surges.
MA Analysis: The signal table provides a clear summary of market direction (bullish, bearish, or neutral) based on selected moving averages.
Trading Strategies: Suitable for trend-following, mean-reversion, and scalping strategies, depending on user preferences and settings.
Notes
The indicator offers a high degree of flexibility, making it adaptable to various trading styles, instruments, and timeframes.
It is recommended to adjust channel length and width to fit your trading strategy.
Backtesting settings on historical data is advised to optimize parameters for a specific strategy and market.

Quantum Reversal# 🧠 Quantum Reversal
## **Quantitative Mean Reversion Framework**
This algorithmic trading system employs **statistical mean reversion theory** combined with **adaptive volatility modeling** to capitalize on Bitcoin's inherent price oscillations around its statistical mean. The strategy integrates multiple technical indicators through a **multi-layered signal processing architecture**.
---
## ⚡ **Core Technical Architecture**
### 📊 **Statistical Foundation**
- **Bollinger Band Mean Reversion Model**: Utilizes 20-period moving average with 2.2 standard deviation bands for volatility-adjusted entry signals
- **Adaptive Volatility Threshold**: Dynamic standard deviation multiplier accounts for Bitcoin's heteroscedastic volatility patterns
- **Price Action Confluence**: Entry triggered when price breaches lower volatility band, indicating statistical oversold conditions
### 🔬 **Momentum Analysis Layer**
- **RSI Oscillator Integration**: 14-period Relative Strength Index with modified oversold threshold at 45
- **Signal Smoothing Algorithm**: 5-period simple moving average applied to RSI reduces noise and false signals
- **Momentum Divergence Detection**: Captures mean reversion opportunities when momentum indicators show oversold readings
### ⚙️ **Entry Logic Architecture**
```
Entry Condition = (Price ≤ Lower_BB) OR (Smoothed_RSI < 45)
```
- **Dual-Condition Framework**: Either statistical price deviation OR momentum oversold condition triggers entry
- **Boolean Logic Gate**: OR-based entry system increases signal frequency while maintaining statistical validity
- **Position Sizing**: Fixed 10% equity allocation per trade for consistent risk exposure
### 🎯 **Exit Strategy Optimization**
- **Profit-Lock Mechanism**: Positions only closed when showing positive unrealized P&L
- **Trend Continuation Logic**: Allows winning trades to run until momentum exhaustion
- **Dynamic Exit Timing**: No fixed profit targets - exits based on profitability state rather than arbitrary levels
---
## 📈 **Statistical Properties**
### **Risk Management Framework**
- **Long-Only Exposure**: Eliminates short-squeeze risk inherent in cryptocurrency markets
- **Mean Reversion Bias**: Exploits Bitcoin's tendency to revert to statistical mean after extreme moves
- **Position Management**: Single position limit prevents over-leveraging
### **Signal Processing Characteristics**
- **Noise Reduction**: SMA smoothing on RSI eliminates high-frequency oscillations
- **Volatility Adaptation**: Bollinger Bands automatically adjust to changing market volatility
- **Multi-Timeframe Coherence**: Indicators operate on consistent timeframe for signal alignment
---
## 🔧 **Parameter Configuration**
| Technical Parameter | Value | Statistical Significance |
|-------------------|-------|-------------------------|
| Bollinger Period | 20 | Standard statistical lookback for volatility calculation |
| Std Dev Multiplier | 2.2 | Optimized for Bitcoin's volatility distribution (95.4% confidence interval) |
| RSI Period | 14 | Traditional momentum oscillator period |
| RSI Threshold | 45 | Modified oversold level accounting for Bitcoin's momentum characteristics |
| Smoothing Period | 5 | Noise reduction filter for momentum signals |
---
## 📊 **Algorithmic Advantages**
✅ **Statistical Edge**: Exploits documented mean reversion tendency in Bitcoin markets
✅ **Volatility Adaptation**: Dynamic bands adjust to changing market conditions
✅ **Signal Confluence**: Multiple indicator confirmation reduces false positives
✅ **Momentum Integration**: RSI smoothing improves signal quality and timing
✅ **Risk-Controlled Exposure**: Systematic position sizing and long-only bias
---
## 🔬 **Mathematical Foundation**
The strategy leverages **Bollinger Band theory** (developed by John Bollinger) which assumes that prices tend to revert to the mean after extreme deviations. The RSI component adds **momentum confirmation** to the statistical price deviation signal.
**Statistical Basis:**
- Mean reversion follows the principle that extreme price deviations from the moving average are temporary
- The 2.2 standard deviation multiplier captures approximately 97.2% of price movements under normal distribution
- RSI momentum smoothing reduces noise inherent in oscillator calculations
---
## ⚠️ **Risk Considerations**
This algorithm is designed for traders with understanding of **quantitative finance principles** and **cryptocurrency market dynamics**. The strategy assumes mean-reverting behavior which may not persist during trending market phases. Proper risk management and position sizing are essential.
---
## 🎯 **Implementation Notes**
- **Market Regime Awareness**: Most effective in ranging/consolidating markets
- **Volatility Sensitivity**: Performance may vary during extreme volatility events
- **Backtesting Recommended**: Historical performance analysis advised before live implementation
- **Capital Allocation**: 10% per trade sizing assumes diversified portfolio approach
---
**Engineered for quantitative traders seeking systematic mean reversion exposure in Bitcoin markets through statistically-grounded technical analysis.**
