Double Bollinger Bands - SF2000twin BB's. One bb can be set for , eg 20 period. The other set for - eg - 50 period. compare the channels.
스크립트에서 "band"에 대해 찾기
Intraday Combo Strategy HHStochastic RSI Momentum/Reversal quickly identifies overbought/oversold zones
MACD Momentum/Trend confirms a trend reversal, a late but powerful signal
Supertrend Trend Tracking provides clear and concise buy/sell signals
Bollinger Bands Volatility shows price deviation during breakouts/squeezes
ADX Trend Strength measures trend strength to filter out false signals

AWR_8DLRC1. Overview and Objective
The AWR_8DLRC indicator is designed to display multiple dynamic channels directly on your chart (with the overlay enabled). It creates dynamic envelopes based on a regression-like approach combined with a volatility measure derived from the root mean square error (RMSE). These channels can help identify support and resistance areas, overbought/oversold conditions, or even potential trend reversals by providing several layers of analysis using different multipliers and timeframes.
2. Input Parameters
Source and Multiplier
The indicator uses the closing price (close) as its default data source.
A floating-point parameter mult (default value: 3.0) is available. This multiplier is primarily used for channel 5, while other channels employ fixed multipliers (1, 2, or 3) to generate different sensitivity levels.
Channel Lengths
Several channels are calculated with distinct lookback lengths:
Channel 5: Uses a length of 1000 periods (its plot is commented out in the code, so it is not displayed by default).
Channel 6: Uses a length of 2000 periods.
Channel 7: Uses a length of 3000 periods.
Channel 8: Uses a length of 4000 periods.
Custom Colors and Transparencies
Each channel (or group of channels) can be customized with specific colors and transparency settings. For example, channel 6 uses a light yellow tone, channel 7 is red, and channel 8 is white.
Additionally, specific fill colors are defined for the shaded areas between the upper and lower lines of some channels, enhancing visual clarity.
3. Channel Calculation Mechanism
At the heart of the indicator is the function f_calcChannel(), which takes as input:
A data source (_src),
A period (_length), and
A multiplier (_mult).
The calculation process comprises several key steps:
Moving Averages Calculation
The function computes both a weighted moving average (WMA) and a simple moving average (SMA) over the defined length.
Baseline Determination
It then combines these averages into two values (A and B) using linear formulas (e.g., A = 4*b - 3*a and B = 3*a - 2*b). These values help to establish a baseline that represents the central trend during the lookback period.
Slope and Deviation Calculation
A slope (m) is calculated based on the difference between A and B.
The function iterates over the period, measuring the squared deviation between the actual data point and a corresponding value on the regression line. The sum of these squared deviations is used to compute the RMSE.
Defining Upper and Lower Bounds
The RMSE is multiplied by the provided multiplier (_mult) and then added to or subtracted from the baseline B to create the upper and lower channel boundaries.
This method produces an envelope that widens or narrows based on the volatility reflected by the RMSE.
This process is repeated using different multipliers (1, 2, and 3) for channels 6, 7, and 8, providing multiple levels that offer deeper insights into market conditions.
4. Chart Visualization
The indicator plots several lines and shaded regions:
Channels 6, 7, and 8: For each of these channels, three levels are calculated:
Levels with a multiplier of 1 (thin lines with a line width of 1),
Levels with a multiplier of 2 (medium lines with a line width of 2),
Levels with a multiplier of 3 (thick lines with a line width of 4).
To further enhance visual interpretation, shaded areas (fills) are added between the upper and lower lines — notably for the level with multiplier 3.
Channel 5: Although the calculations for channel 5 are included, its plot commands are commented out. This means it won’t display on the chart unless you uncomment the relevant lines by modifying the script.
5. Conditions and Alerts
Beyond the visual channels, the indicator integrates several alert conditions and visual markers:
Graphical Conditions:
The script defines conditions checking whether the price (i.e., the source) is above or below specific channel levels, particularly the levels calculated with multipliers 2 and 3.
“Mixed” conditions are also established to detect when the price is simultaneously above one set of levels and below another, aiming to highlight potential reversal areas.
Automated Alerts:
Alert conditions are programmed to notify you when the price crosses specific channel boundaries:
Alerts for conditions such as “Upper Channels 2” or “Lower Channels 2” indicate when prices exceed or fall below the second level of the channels.
Similarly, alerts for “Upper Channels 3” and “Lower Channels 3” correspond to the more extreme boundaries defined by the multiplier of 3.
Visual Symbols:
The indicator employs the plotchar() function to place symbols (like 🌙, ⚠️, 🪐, and ☢️) directly on the chart. These symbols make it easy to spot when the price meets these crucial levels.
These alert features are especially valuable for traders who rely on real-time notifications to adjust positions or watch for potential trend shifts.
6. How to Use the Indicator
Installation and Setup:
Copy the provided code into your Pine Script editor on your charting platform (e.g., TradingView) and add the indicator to your chart.
Customize the parameters according to your trading strategy:
Channel Lengths: Modify the lookback periods to see how the envelope adapts.
Colors and Transparencies: Adjust these to fit your display preferences.
Multipliers: Experiment with the multipliers to observe how different settings affect the channel widths.
Interpreting the Channels:
The upper and lower bands represent dynamic thresholds that change with market volatility.
A price that nears an upper boundary might indicate an overextended move upward, whereas a break beyond these dynamic boundaries could signal a potential trend reversal.
Utilizing Alerts:
Configure notifications based on the alert conditions so you can be alerted when the price moves beyond the defined channel levels. This can help trigger entry or exit signals, or simply keep you informed of significant price movements.
Multi-Level Analysis:
The strength of this indicator lies in its multi-level approach. With three defined levels for channels 6, 7, and 8, you gain a more nuanced view of market volatility and trend strength.
For instance, a price crossing the level with a multiplier of 2 might indicate the start of a trend change, while a break of the level with multiplier 3 might confirm a strong trend movement.
7. In Summary
The AWR_8DLRC indicator is a comprehensive tool for drawing dynamic channels based on a regression and RMSE-driven volatility measure. It offers:
Multiple channel levels, each with different lookback periods and multipliers.
Shaded regions between channel boundaries for rapid visual interpretation.
Alert conditions to notify you immediately when the price hits critical levels.
Visual markers directly on the chart to highlight key moments of price action.
This indicator is particularly suited for technical traders seeking to dynamically identify support and resistance zones with a responsive alert system. Its customizable settings and rich array of signals provide an excellent framework to refine your trading decisions.

VWAP Z-Score Oscillator + Scaled TableVWAP Z-Score Oscillator + Scaled Table
This indicator calculates the Z-Score of the VWAP (Volume Weighted Average Price) based on your chosen source price and reset period (Session, Week, Month, Quarter, or Year).
The Z-Score represents how many standard deviations the current price is from the VWAP, visualized as an oscillator oscillating between ±3 sigma levels. The indicator also features three standard deviation bands for easy reference.
To enhance readability, a scaled Z-Score is displayed in a clean, minimalistic table on the top right of the indicator panel. This score is linearly capped between -2 and +2, mapping the raw Z-Score values with limits at ±3 sigma for clarity and quick assessment.
Use this tool to identify extreme deviations from the VWAP, which may signal potential reversals or continuation of price trends.

Turtle ZoneTurtle Zone indicator helps to visually determine support and resistance zones of the price movement.
Displays a channel with zones located symmetrically around the moving average of the price.
Width of the channel is determined by the current volatility computed as average true range which makes the channel width adaptable to the volatility.
Touching of the zones from inside of the channel can be interpreted as a signal of potential reversal.
Breaking outside of the outer boundary of the zones can be interpreted as a signal of a potential continuation of price movement.
Parameters
• Price Source - Component of the bar for computation. Default is ‘hlc3’. Other reasonable values, such as ‘ohlc4’, ‘open’ or’ close’ can be used by advanced users.
• Lookback period - Amount of bars used in moving average computation. Default is 200.
• Inner Amplitude - Relative width of the inner channel. Default is 5.6.
• Outer Amplitude - Relative width of the outer channel. Default is 9.6.
Available plots for notifications
There are five plots on the graph comprising the channel: four boundaries of the channel bands and one hidden mean line of the channel:
Upper Zone Upper Line
Upper Zone Lower Line
Mean
Lower Zone Upper Line
Lower Zone Lower Line
All of the plots can be used to set up notifications.
Notes
All computations are performed in logarithmic price scale which makes this indicator useful on large timeframes.
Credits
This script uses Ehlers_Super_Smoother library by KevanoTrades

Upper and Lower bound for pairs/BTCUpper and Lower Bound for Pairs/BTC
This indicator provides dynamic upper and lower boundary levels for cryptocurrency pairs traded against BTC. It uses statistical or technical analysis methods, such as Z-Score, Bollinger Bands, or moving averages, to identify key resistance (upper bound) and support (lower bound) levels.
Key Features:
Dynamic Boundaries: Tracks real-time price fluctuations of selected pairs against BTC, adapting to market conditions.
Market Insights: Helps traders visualize potential overbought (upper bound) and oversold (lower bound) zones for pairs like ETH/BTC, DOGE/BTC, and others.
Customizable Settings: Allows users to configure lookback periods, standard deviations, or other parameters for boundary calculations.
Decision Support: Assists in identifying reversal or breakout points to refine entry and exit strategies.
This tool is ideal for traders seeking to optimize risk management and spot opportunities in BTC pair markets.

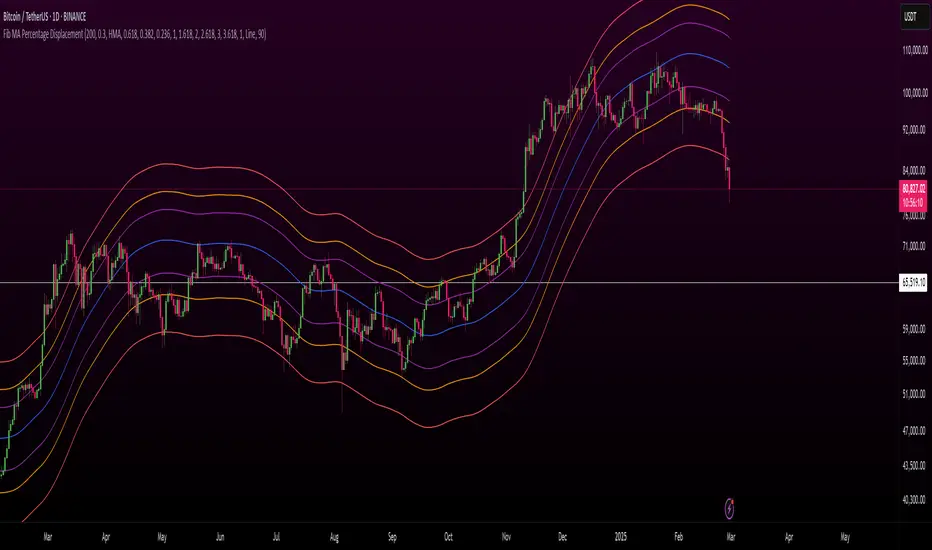
Fibonacci Displaced Moving Averages with Percentage DisplacementThis indicator combines Fibonacci levels with percentage-based displacement, creating a versatile tool for analyzing moving averages in relation to market trends and potential reversal points. It's designed to adapt to different market conditions and asset types, making it a valuable addition to a trader's toolkit.
Key Features:
Fibonacci-Infused Averages: Leverages Fibonacci ratios (0.618, 0.382, 0.236) to construct displaced moving averages. This method offers a layered perspective of market support and resistance levels.
Adaptive Percentage-Based Displacement: The displacement of the moving average is calculated as a percentage of the average, allowing for flexible and market-responsive band positioning. This feature is particularly crucial for adapting to the unique volatility and price behavior of different trading pairs.
Customizable SMA Core: The core of the indicator is a simple moving average (SMA), which can be tailored in length to suit various trading strategies and timeframes.
Logarithmic Scale Compatibility: Includes an option for logarithmic scaling, making it applicable to a broad range of assets, including those with exponential price trends.
Advanced Alert System: Equipped with a comprehensive alert system, it notifies traders of price crossings over any of the Fibonacci displaced moving averages, aiding timely market responses.
Optimizing for Different Pairs:
To maximize the indicator's effectiveness, it is crucial to fine-tune the Percentage Displacement setting according to the specific volatility and price movement characteristics of each trading pair. This customization ensures that the displaced moving averages accurately reflect the market dynamics of each asset, providing more reliable support and resistance levels for traders.
Ideal Use Cases:
This indicator is ideal for traders who seek a deeper understanding of moving averages, especially in markets where Fibonacci levels play a significant role. It is versatile enough for various trading approaches, including swing and day trading, and adaptable across multiple timeframes.
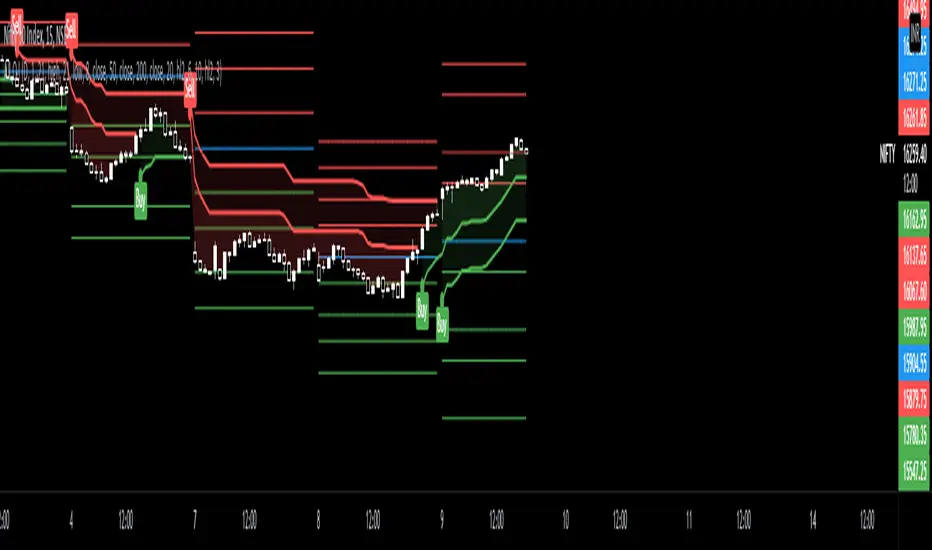
Thursday Close BandsThis script is useful for Indian Markets where weekly expiry is on Thursday.
As per last 10 years historical stats Nifty stays with in 3% range from Thursday close 80% times.

BB Strategy toobabollinger bands strategy with added upper basis and lower line on the chart.
when we use BB strategy in trading view unfortunately the upper, lower and basis line did not display.
so we solve the problem with just a little script codes and bring back the lines to the chart

MCL-YG Pair Trading StrategyThis strategy uses Bollinger Band breakouts to detect buy and sell signals on a correlated pair of assets.


Joker Linear Regression ChannelLinear regression analysis is used to predict the value of a variable based on the value of another variable. The variable you want to predict is called the dependent variable. The variable you are using to predict the other variable's value is called the independent variable. This indicator plot channel bands of Linear Regression.

Rma Stdev BandsStandard Deviation support resistances with percent boxes.
The Relative Moving Average isn’t a well-known moving average. But TradingView uses this average with two popular indicators: the Relative Strength Index (RSI) and Average True Range (ATR)
The weighting factors that the Relative Moving Average uses decrease exponentially. That way recent bars have the highest weight, while earlier bars get smaller weights the older they are.

CPR PIVOT, 2ST, 5MA, VWAPSUPERTREND
2 supertrend with diffrent patameters.
MOVING AVERAGE RIBBON
5 differenT EMA
VWAP
Simple vwap with bands nothing special
every parameters and looks can be change
AND CPR
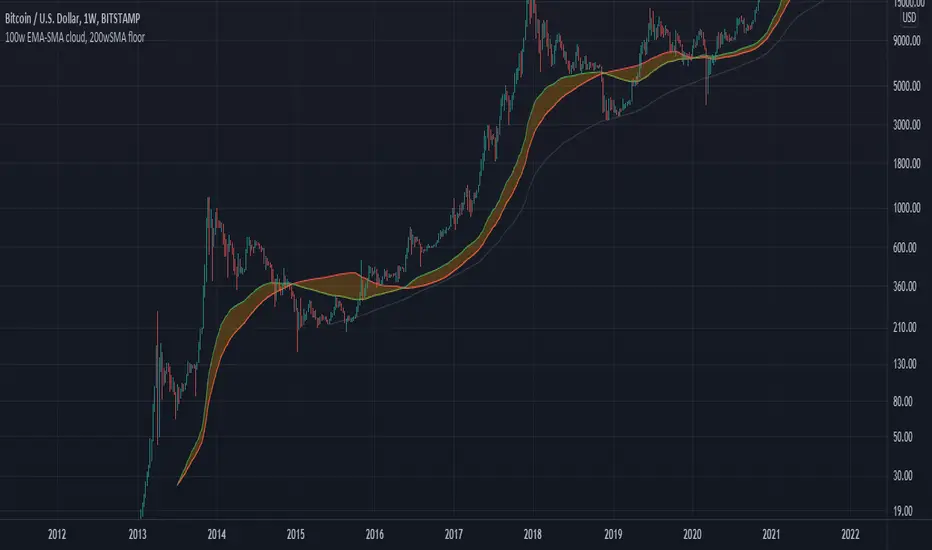
100w EMA-SMA cloud, 200wSMA floorRepresents a support band for the full bull/bear market cycles. Bull markets tend to hold the 100w EMA over the 100w SMA. When the flippening is produced, historically for BTCUSD there is a long bear market which leads to a 200w SMA support. Then, when the 100w EMA gets above the 100w SMA again, the bear market is motly over and the bullrun starts again.
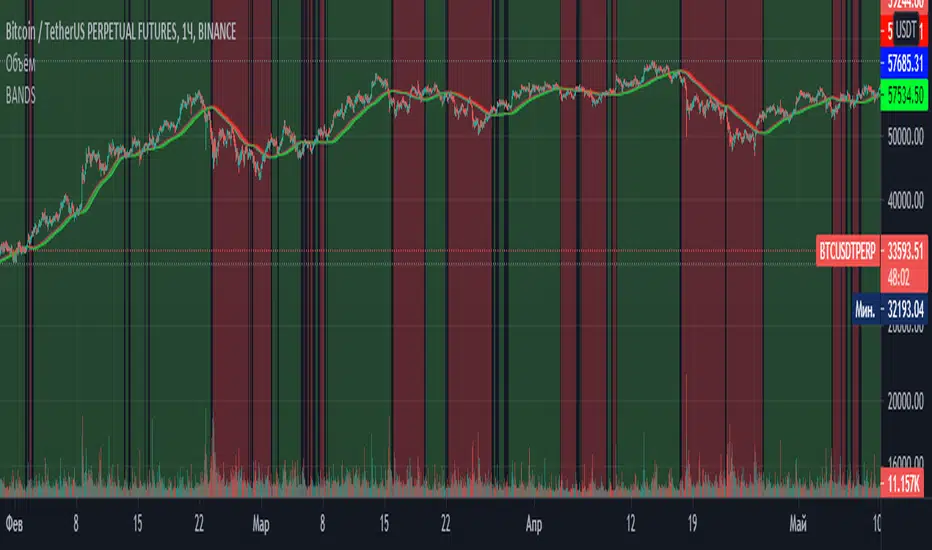
BANDSTrend indicator. It is based on a simple moving average, the maximum and minimum of this moving average for the period. When the moving average coincides with its maximum for the period , the trend is rising, when the moving average coincides with its minimum for the period, the trend is falling. The optimal periods should be selected for each timeframe and trading instrument.
Impulse Reactor RSI-SMA Trend Indicator [ApexLegion]Impulse Reactor RSI-SMA Trend Indicator
Introduction and Theoretical Background
Design Rationale
Standard indicators frequently generate binary 'BUY' or 'SELL' signals without accounting for the broader market context. This often results in erratic "Flip-Flop" behavior, where signals are triggered indiscriminately regardless of the prevailing volatility regime.
Impulse Reactor was engineered to address this limitation by unifying two critical requirements: Quantitative Rigor and Execution Flexibility.
The Solution
Composite Analytical Framework This script is not a simple visual overlay of existing indicators. It is an algorithmic synthesis designed to function as a unified decision-making engine. The primary objective was to implement rigorous quantitative analysis (Volatility Normalization, Structural Filtering) directly within an alert-enabled framework. This architecture is designed to process signals through strict, multi-factor validation protocols before generating real-time notifications, allowing users to focus on structurally validated setups without manual monitoring.
How It Works
This is not a simple visual mashup. It utilizes a cross-validation algorithm where the Trend Structure acts as a gatekeeper for Momentum signals:
Logic over Lag: Unlike simple moving average crossovers, this script uses a 15-layer Gradient Ribbon to detect "Laminar Flow." If the ribbon is knotted (Compression), the system mathematically suppresses all signals.
Volatility Normalization: The core calculation adapts to ATR (Average True Range). This means the indicator automatically expands in volatile markets and contracts in quiet ones, maintaining accuracy without constant manual tweaking.
Adaptive Signal Thresholding: It incorporates an 'Anti-Greed' algorithm (Dynamic Thresholding) that automatically adjusts entry criteria based on trend duration. This logic aims to mitigate the risk of entering positions during periods of statistical trend exhaustion.
Why Use It?
Market State Decoding: The gradient Ribbon visualizes the underlying trend phase in real-time.
◦ Cyan/Blue Flow: Strong Bullish Trend (Laminar Flow).
◦ Magenta/Pink Flow: Strong Bearish Trend.
◦ Compressed/Knotted: When the ribbon lines are tightly squeezed or overlapping, it signals Consolidation. The system filters signals here to avoid chop.
Noise Reduction: The goal is not to catch every pivot, but to isolate high-confidence setups. The logic explicitly filters out minor fluctuations to help maintain position alignment with the broader trend.
⚖️ Chapter 1: System Architecture
Introduction: Composite Analytical Framework
System Overview
Impulse Reactor serves as a comprehensive technical analysis engine designed to synthesize three distinct market dimensions—Momentum, Volatility, and Trend Structure—into a unified decision-making framework. Unlike traditional methods that analyze these metrics in isolation, this system functions as a central processing unit that integrates disparate data streams to construct a coherent model of market behavior.
Operational Objective
The primary objective is to transition from single-dimensional signal generation to a multi-factor assessment model. By fusing data from the Impulse Core (Volatility), Gradient Oscillator (Momentum), and Structural Baseline (Trend), the system aims to filter out stochastic noise and identify high-probability trade setups grounded in quantitative confluence.
Market Microstructure Analysis: Limitations of Conventional Models
Extensive backtesting and quantitative analysis have identified three critical inefficiencies in standard oscillator-based strategies:
• Bounded Oscillator Limitations (The "Oscillation Trap"): Traditional indicators such as RSI or Stochastics are mathematically constrained between fixed values (0 to 100). In strong trending environments, these metrics often saturate in "overbought" or "oversold" zones. Consequently, traders relying on static thresholds frequently exit structurally valid positions prematurely or initiate counter-trend trades against prevailing momentum, resulting in suboptimal performance.
• Quantitative Blindness to Quality: Standard moving averages and trend indicators often fail to distinguish the qualitative nature of price movement. They treat low-volume drift and high-velocity expansion identically. This inability to account for "Volatility Quality" leads to delayed responsiveness during critical market events.
• Fractal Dissonance (Timeframe Disconnect): Financial markets exhibit fractal characteristics where trends on lower timeframes may contradict higher timeframe structures. Manual integration of multi-timeframe analysis increases cognitive load and susceptibility to human error, often resulting in conflicting biases at the point of execution.
Core Design Principles
To mitigate the aforementioned systemic inefficiencies, Impulse Reactor employs a modular architecture governed by three foundational principles:
Principle A:
Volatility Precursor Analysis Market mechanics demonstrate that volatility expansion often functions as a leading indicator for directional price movement. The system is engineered to detect "Volatility Deviation" — specifically, the divergence between short-term and long-term volatility baselines—prior to its manifestation in price action. This allows for entry timing aligned with the expansion phase of market volatility.
Principle B:
Momentum Density Visualization The system replaces singular momentum lines with a "Momentum Density" model utilizing a 15-layer Simple Moving Average (SMA) Ribbon.
• Concept: This visualization represents the aggregate strength and consistency of the trend.
• Application: A fully aligned and expanded ribbon indicates a robust trend structure ("Laminar Flow") capable of withstanding minor counter-trend noise, whereas a compressed ribbon signals consolidation or structural weakness.
Principle C:
Adaptive Confluence Protocols Signal validity is strictly governed by a multi-dimensional confluence logic. The system suppresses signal generation unless there is synchronized confirmation across all three analytical vectors:
1. Volatility: Confirmed expansion via the Impulse Core.
2. Momentum: Directional alignment via the Hybrid Oscillator.
3. Structure: Trend validation via the Baseline. This strict filtering mechanism significantly reduces false positives in non-trending (choppy) environments while maintaining sensitivity to genuine breakouts.
🔍 Chapter 2: Core Modules & Algorithmic Logic
Module A: Impulse Core (Normalized Volatility Deviation)
Operational Logic The Impulse Core functions as a volatility-normalized momentum gauge rather than a standard oscillator. It is designed to identify "Volatility Contraction" (Squeeze) and "Volatility Expansion" phases by quantifying the divergence between short-term and long-term volatility states.
Volatility Z-Score Normalization
The formula implements a custom normalization algorithm. Unlike standard oscillators that rely on absolute price changes, this logic calculates the Z-Score of the Volatility Spread.
◦ Numerator: (atr_f - atr_s) captures the raw momentum of volatility expansion.
◦ Denominator: (std_f + 1e-6) standardizes this value against historical variance.
◦ Result: This allows the indicator scales consistently across assets (e.g., Bitcoin vs. Euro) without manual recalibration.
f_impulse() =>
atr_f = ta.atr(fastLen) // Fast Volatility Baseline
atr_s = ta.atr(slowLen) // Slow Volatility Baseline
std_f = ta.stdev(atr_f, devLen) // Volatility Standard Deviation
(atr_f - atr_s) / (std_f + 1e-6) // Normalized Differential Calculation
Algorithmic Framework
• Differential Calculation: The system computes the spread between a Fast Volatility Baseline (ATR-10) and a Slow Volatility Baseline (ATR-30).
• Normalization Protocol: To standardize consistency across diverse asset classes (e.g., Forex vs. Crypto), the raw differential is divided by the standard deviation of the volatility itself over a 30-period lookback.
• Signal Generation:
◦ Contraction (Squeeze): When the Fast ATR compresses below the Slow ATR, it registers a potential volatility buildup phase.
◦ Expansion (Release): A rapid divergence of the Fast ATR above the Slow ATR signals a confirmed volatility expansion, validating the strength of the move.
Module B: Gradient Oscillator (RSI-SMA Hybrid)
Design Rationale To mitigate the "noise" and "false reversal" signals common in single-line oscillators (like standard RSI), this module utilizes a 15-Layer Gradient Ribbon to visualize momentum density and persistence.
Technical Architecture
• Ribbon Array: The system generates 15 sequential Simple Moving Averages (SMA) applied to a volatility-adjusted RSI source. The length of each layer increases incrementally.
• State Analysis:
Momentum Alignment (Laminar Flow): When all 15 layers are expanded and parallel, it indicates a robust trend where buying/selling pressure is distributed evenly across multiple timeframes. This state helps filter out premature "overbought/oversold" signals.
• Consolidation (Compression): When the distance between the fastest layer (Layer 1) and the slowest layer (Layer 15) approaches zero or the layers intersect, the system identifies a "Non-Tradable Zone," preventing entries during choppy market conditions.
// Laminar Flow Validation
f_validate_trend() =>
// Calculate spread between Ribbon layers
ribbon_spread = ta.stdev(ribbon_array, 15)
// Only allow signals if Ribbon is expanded (Laminar Flow)
is_flowing = ribbon_spread > min_expansion_threshold
// If compressed (Knotted), force signal to false
is_flowing ? signal : na
Module C: Adaptive Signal Filtering (Behavioral Bias Mitigation)
This subsystem, operating as an algorithmic "Anti-Greed" Mechanism, addresses the statistical tendency for signal degradation following prolonged trends.
Dynamic Threshold Adjustment
• Win Streak Detection: The algorithm internally tracks the outcome of closed trade cycles.
• Sensitivity Multiplier: Upon detecting consecutive successful signals in the same direction, a Penalty_Factor is applied to the entry logic.
• Operational Impact: This effectively raises the Required_Slope threshold for subsequent signals. For example, after three consecutive bullish signals, the system requires a 30% steeper trend angle to validate a fourth entry. This enforces stricter discipline during extended trends to reduce the probability of entering at the point of trend exhaustion.
Anti-Greed Logic: Dynamic Threshold Calculation
f_adjust_threshold(base_slope, win_streak) =>
// Adds a 10% penalty to the difficulty for every consecutive win
penalty_factor = 0.10
risk_scaler = 1 + (win_streak * penalty_factor)
// Returns the new, harder-to-reach threshold
base_slope * risk_scaler
Module D: Trend Baseline (Triple-Smoothed Structure)
The Trend Baseline serves as the structural filter for all signals. It employs a Triple-Smoothed Hybrid Algorithm designed to balance lag reduction with noise filtration.
Smoothing Stages
1. Volatility Banding: Utilizes a SuperTrend-based calculation to establish the upper and lower boundaries of price action.
2. Weighted Filter: Applies a Weighted Moving Average (WMA) to prioritize recent price data.
3. Exponential Smoothing: A final Exponential Moving Average (EMA) pass is applied to create a seamless baseline curve.
Functionality
This "Heavy" baseline resists minor intraday volatility spikes while remaining responsive to sustained structural shifts. A signal is only considered valid if the price action maintains structural integrity relative to this baseline
🚦 Chapter 3: Risk Management & Exit Protocols
Quantitative Risk Management (TP/SL & Trailing)
Foundational Architecture: Volatility-Adjusted Geometry Unlike strategies relying on static nominal values, Impulse Reactor establishes dynamic risk boundaries derived from quantitative volatility metrics. This design aligns trade invalidation levels mathematically with the current market regime.
• ATR-Based Dynamic Bracketing:
The protocol calculates Stop-Loss and Take-Profit levels by applying Fibonacci coefficients (Default: 0.786 for SL / 1.618 for TP) to the Average True Range (ATR).
◦ High Volatility Environments: The risk bands automatically expand to accommodate wider variance, preventing premature exits caused by standard market noise.
◦ Low Volatility Environments: The bands contract to tighten risk parameters, thereby dynamically adjusting the Risk-to-Reward (R:R) geometry.
• Close-Validation Protocol ("Soft Stop"):
Institutional algorithms frequently execute liquidity sweeps—driving prices briefly below key support levels to accumulate inventory.
◦ Mechanism: When the "Soft Stop" feature is enabled, the system filters out intraday volatility spikes. The stop-loss is conditional; execution is triggered only if the candle closes beyond the invalidation threshold.
◦ Strategic Advantage: This logic distinguishes between momentary price wicks and genuine structural breakdowns, preserving positions during transient volatility.
• Step-Function Trailing Mechanism:
To protect unrealized PnL while allowing for normal price breathing, a two-phase trailing methodology is employed:
◦ Phase 1 (Activation): The trailing function remains dormant until the price advances by a pre-defined percentage threshold.
◦ Phase 2 (Dynamic Floor): Once armed, the stop level creates a moving floor, adjusting relative to price action while maintaining a volatility-based (ATR) buffer to systematically protect unrealized PnL.
• Algorithmic Exit Protocols (Dynamic Liquidity Analysis)
◦ Rationale: Inefficiencies of Static Targets Static "Take Profit" levels often result in suboptimal exits. They compel traders to close positions based on arbitrary figures rather than evolving market structure, potentially capping upside during significant trends or retaining positions while the underlying trend structure deteriorates.
◦ Solution: Structural Integrity Assessment The system utilizes a Dynamic Liquidity Engine to continuously audit the validity of the position. Instead of targeting a specific price point, the algorithm evaluates whether the trend remains statistically robust.
Multi-Factor Exit Logic (The Tri-Vector System)
The Smart Exit protocol executes only when specific algorithmic invalidation criteria are met:
• 1. Momentum Exhaustion (Confluence Decay): The system monitors a 168-hour rolling average of the Confluence Score. A significant deviation below this historical baseline indicates momentum exhaustion, signaling that the driving force behind the trend has dissipated prior to a price reversal. This enables preemptive exits before a potential drawdown.
• 2. Statistical Over-Extension (Mean Reversion): Utilizing the core volatility logic, the system identifies instances where price deviates beyond 2.0 standard deviations from the mean. While the trend may be technically bullish, this statistical anomaly suggests a high probability of mean reversion (elastic snap-back), triggering a defensive exit to capitalize on peak valuation.
• 3. Oscillator Rejection (Immediate Pivot): To manage sudden V-shaped volatility, the system monitors RSI pivots. If a sharp "Pivot High" or divergence is detected, the protocol triggers an immediate "Peak Exit," bypassing standard trend filters to secure liquidity during high-velocity reversals.
🎨 Chapter 4: Visualization Guide
Gradient Oscillator Ribbon
The 15-layer SMA ribbon visualized via plot(r1...r15) represents the "Momentum Density" of the market.
• Visuals:
◦ Cyan/Blue Ribbon: Indicates Bullish Momentum.
◦ Pink/Magenta Ribbon: Indicates Bearish Momentum.
• Interpretation:
◦ Laminar Flow: When the ribbon expands widely and flows in parallel, it signifies a robust trend where momentum is distributed evenly across timeframes. This is the ideal state for trend-following.
◦ Compression (Consolidation): If the ribbon becomes narrow, twisted, or knotted, it indicates a "Non-Tradable Zone" where the market lacks a unified direction. Traders are advised to wait for clarity.
◦ Over-Extension: If the top layer crosses the Overbought (85) or Oversold (15) lines, it visually warns of potential market overheating.
Trend Baseline
The thick, color-changing line plotted via plot(baseline) represents the Structural Backbone of the market.
• Visuals: Changes color based on the trend direction (Blue for Bullish, Pink for Bearish).
• Interpretation:
Structural Filter: Long positions are statistically favored only when price action sustains above this baseline, while short positions are favored below it.
Dynamic Support/Resistance: The baseline acts as a dynamic support level during uptrends and resistance during downtrends.
Entry Signals & Labels
Text labels ("Long Entry", "Short Entry") appear when the system detects high-probability setups grounded in quantitative confluence.
• Visuals: Labeled signals appear above/below specific candles.
• Interpretation:
These signals represent moments where Volatility (Expansion), Momentum (Alignment), and Structure (Trend) are synchronized.
Smart Exit: Labels such as "Smart Exit" or "Peak Exit" appear when the system detects momentum exhaustion or structural decay, prompting a defensive exit to preserve capital.
Dynamic TP/SL Boxes
The semi-transparent colored zones drawn via fill() represent the risk management geometry.
• Visuals: Colored boxes extending from the entry point to the Take Profit (TP) and Stop Loss (SL) levels.
• Function:
Volatility-Adjusted Geometry: Unlike static price targets, these boxes expand during high volatility (to prevent wicks from stopping you out) and contract during low volatility (to optimize Risk-to-Reward ratios).
SAR + MACD Glow
Small glowing shapes appearing above or below candles.
• Visuals: Triangle or circle glows near the price bars.
• Interpretation:
This visual indicates a secondary confirmation where Parabolic SAR and MACD align with the main trend direction. It serves as an additional confluence factor to increase confidence in the trade setup.
Support/Resistance Table
A small table located at the bottom-right of the chart.
• Function: Automatically identifies and displays recent Pivot Highs (Resistance) and Pivot Lows (Support).
• Interpretation: These levels can be used as potential targets for Take Profit or invalidation points for manual Stop Loss adjustments.
🖥️ Chapter 5: Dashboard & Operational Guide
Integrated Analytics Panel (Dashboard Overview)
To facilitate rapid decision-making without manual calculation, the system aggregates critical market dimensions into a unified "Heads-Up Display" (HUD). This panel monitors real-time metrics across multiple timeframes and analytical vectors.
A. Intermediate Structure (12H Trend)
• Function: Anchors the intraday analysis to the broader market structure using a 12-hour rolling window.
• Interpretation:
◦ Bullish (> +0.5%): Indicates a positive structural bias. Long setups align with the macro flow.
◦ Bearish (< -0.5%): Indicates structural weakness. Short setups are statistically favored.
◦ Neutral: Represents a ranging environment where the Confluence Score becomes the primary weighting factor.
B. Composite Confluence Score (Signal Confidence)
• Definition: A probability metric derived from the synchronization of Volatility (Impulse Core), Momentum (Ribbon), and Trend (Baseline).
• Grading Scale:
Strong Buy/Sell (> 7.0 / < 3.0): Indicates full alignment across all three vectors. Represents a "Prime Setup" eligible for standard position sizing.
Buy/Sell (5.0–7.0 / 3.0–5.0): Indicates a valid trend but with moderate volatility confirmation.
Neutral: Signals conflicting data (e.g., Bullish Momentum vs. Bearish Structure). Trading is not recommended ("No-Trade Zone").
C. Statistical Deviation Status (Mean Reversion)
• Logic: Utilizes Bollinger Band deviation principles to quantify how far price has stretched from the statistical mean (20 SMA).
• Alert States:
Over-Extended (> 2.0 SD): Warning that price is statistically likely to revert to the mean (Elastic Snap-back), even if the trend remains technically valid. New entries are discouraged in this zone.
Normal: Price is within standard distribution limits, suitable for trend-following entries.
D. Volatility Regime Classification
• Metric: Compares current ATR against a 100-period historical baseline to categorize the market state.
• Regimes:
Low Volatility (Lvl < 1.0): Market Compression. Often precedes volatility expansion events.
Mid Volatility (Lvl 1.0 - 1.5): Standard operating environment.
High Volatility (Lvl > 1.5): Elevated market stress. Risk parameters should be adjusted (e.g., reduced position size) to account for increased variance.
E. Performance Telemetry
• Function: Displays the historical reliability of the Trend Baseline for the current asset and timeframe.
• Operational Threshold: If the displayed Win Rate falls below 40%, it suggests the current market behavior is incoherent (choppy) and does not respect trend logic. In such cases, switching assets or timeframes is recommended.
Operational Protocols & Signal Decoding
Visual Interpretation Standards
• Laminar Flow (Trade Confirmation): A valid trend is visually confirmed when the 15-layer SMA Ribbon is fully expanded and parallel. This indicates distributed momentum across timeframes.
• Consolidation (No-Trade): If the ribbon appears twisted, knotted, or compressed, the market lacks a unified directional vector.
• Baseline Interaction: The Triple-Smoothed Baseline acts as a dynamic support/resistance filter. Long positions remain valid only while price sustains above this structure.
System Calibration (Settings)
• Adaptive Signal Filtering (Prev. Anti-Greed): Enabled by default. This logic automatically raises the required trend slope threshold following consecutive wins to mitigate behavioral bias.
• Impulse Sensitivity: Controls the reactivity of the Volatility Core. Higher settings capture faster moves but may introduce more noise.
⚙️ Chapter 6: System Configuration & Alert Guide
This section provides a complete breakdown of every adjustable setting within Impulse Reactor to assist you in tailoring the engine to your specific needs.
🌐 LANGUAGE SETTINGS (Localization)
◦ Select Language (Default: English):
Function: Instantly translates all chart labels, dashboard texts into your preferred language.
Supported: English, Korean, Chinese, Spanish
⚡ IMPULSE CORE SETTINGS (Volatility Engine)
◦ Deviation Lookback (Default: 30): The period used to calculate the standard deviation of volatility.
Role: Sets the baseline for normalizing momentum. Higher values make the core smoother but slower to react.
◦ Fast Pulse Length (Default: 10): The short-term ATR period.
Role: Detects rapid volatility expansion.
◦ Slow Pulse Length (Default: 30): The long-term ATR baseline.
Role: Establishes the background volatility level. The core signal is derived from the divergence between Fast and Slow pulses.
🎯 TP/SL SETTINGS (Risk Management)
◦ SL/TP Fibonacci (Default: 0.786 / 1.618): Selects the Fibonacci ratio used for risk calculation.
◦ SL/TP Multiplier (Default: 1.5 / 2): Applies a multiplier to the ATR-based bands.
Role: Expands or contracts the Take Profit and Stop Loss boxes. Increase these values for higher volatility assets (like Altcoins) to avoid premature stop-outs.
◦ ATR Length (Default: 14): The lookback period for calculating the Average True Range used in risk geometry.
◦ Use Soft Stop (Close Basis):
Role: If enabled, Stop Loss alerts only trigger if a candle closes beyond the invalidation level. This prevents being stopped out by wick manipulations.
🔊 RIBBON SETTINGS (Momentum Visualization)
◦ Show SMA Ribbon: Toggles the visibility of the 15-layer gradient ribbon.
◦ Ribbon Line Count (Default: 15): The number of SMA lines in the ribbon array.
◦ Ribbon Start Length (Default: 2) & Step (Default: 1): Defines the spread of the ribbon.
Role: Controls the "thickness" of the momentum density visualization. A wider step creates a broader ribbon, useful for higher timeframes.
📎 DISPLAY OPTIONS
◦ Show Entry Lines / TP/SL Box / Position Labels / S/R Levels / Dashboard: Toggles individual visual elements on the chart to reduce clutter.
◦ Show SAR+MACD Glow: Enables the secondary confirmation shapes (triangles/circles) above/below candles.
📈 TREND BASELINE (Structural Filter)
◦ Supertrend Factor (Default: 12) & ATR Period (Default: 90): Controls the sensitivity of the underlying Supertrend algorithm used for the baseline calculation.
◦ WMA Length (40) & EMA Length (14): The smoothing periods for the Triple-Smoothed Baseline.
◦ Min Trend Duration (Default: 10): The minimum number of bars the trend must be established before a signal is considered valid.
🧠 SMART EXIT (Dynamic Liquidity)
◦ Use Smart Exit: Enables the momentum exhaustion logic.
◦ Exit Threshold Score (Default: 3): The sensitivity level for triggering a Smart Exit. Lower values trigger earlier exits.
◦ Average Period (168) & Min Hold Bars (5): Defines the rolling window for momentum decay analysis and the minimum duration a trade must be held before Smart Exit logic activates.
🛡️ TRAILING STOP (Step)
◦ Use Trailing Stop: Activates the step-function trailing mechanism.
◦ Step 1 Activation % (0.5) & Offset % (0.5): The price must move 0.5% in your favor to arm the first trail level, which sets a stop 0.5% behind price.
◦ Step 2 Activation % (1) & Offset % (0.2): Once price moves 1%, the trail tightens to 0.2%, securing the position.
🌀 SAR & MACD SETTINGS (Secondary Confirmation)
◦ SAR Start/Increment/Max: Standard Parabolic SAR parameters.
◦ SAR Score Scaling (ATR): Adjusts how much weight the SAR signal has in the overall confluence score.
◦ MACD Fast/Slow/Signal: Standard MACD parameters used for the "Glow" signals.
🔄 ANTI-GREED LOGIC (Behavioral Bias)
◦ Strict Entry after Win: Enables the negative feedback loop.
◦ Strict Multiplier (Default: 1.1): Increases the entry difficulty by 10% after each win.
Role: Prevents overtrading and entering at the top of an extended trend.
🌍 HTF FILTER (Multi-Timeframe)
◦ Use Auto-Adaptive HTF Filter: Automatically selects a higher timeframe (e.g., 1H -> 4H) to filter signals.
◦ Bypass HTF on Steep Trigger: Allows an entry even against the HTF trend if the local momentum slope is exceptionally steep (catch powerful reversals).
📉 RSI PEAK & CHOPPINESS
◦ RSI Peak Exit (Instant): Triggers an immediate exit if a sharp RSI pivot (V-shape) is detected.
◦ Choppiness Filter: Suppresses signals if the Choppiness Index is above the threshold (Default: 60), indicating a flat market.
📐 SLOPE TRIGGER LOGIC
◦ Force Entry on Steep Slope: Overrides other filters if the price angle is extremely vertical (high velocity).
◦ Slope Sensitivity (1.5): The angle required to trigger this override.
⛔ FLAT MARKET FILTER (ADX & ATR)
◦ Use ADX Filter: Blocks signals if ADX is below the threshold (Default: 20), indicating no trend.
◦ Use ATR Flat Filter: Blocks signals if volatility drops below a critical level (dead market).
🔔 Alert Configuration Guide
Impulse Reactor is designed with a comprehensive suite of alert conditions, allowing you to automate your trading or receive real-time notifications for specific market events.
How to Set Up:
Click the "Alert" (Clock) icon in the TradingView toolbar.
Select "Impulse Reactor " from the Condition dropdown.
Choose one of the specific trigger conditions below:
🚀 Entry Signals (Trend Initiation)
Long Entry:
Trigger: Fires when a confirmed Bullish Setup is detected (Momentum + Volatility + Structure align).
Usage: Use this to enter new Long positions.
Short Entry:
Trigger: Fires when a confirmed Bearish Setup is detected.
Usage: Use this to enter new Short positions.
🎯 Profit Taking (Target Levels)
Long TP:
Trigger: Fires when price hits the calculated Take Profit level for a Long trade.
Usage: Automate partial or full profit taking.
Short TP:
Trigger: Fires when price hits the calculated Take Profit level for a Short trade.
Usage: Automate partial or full profit taking.
🛡️ Defensive Exits (Risk Management)
Smart Exit:
Trigger: Fires when the system detects momentum decay or statistical exhaustion (even if the trend hasn't fully reversed).
Usage: Recommended for tightening stops or closing positions early to preserve gains.
Overbought / Oversold:
Trigger: Fires when the ribbon extends into extreme zones.
Usage: Warning signal to prepare for a potential reversal or pullback.
💡 Secondary Confirmation (Confluence)
SAR+MACD Bullish:
Trigger: Fires when Parabolic SAR and MACD align bullishly with the main trend.
Usage: Ideal for Pyramiding (adding to an existing winning position).
SAR+MACD Bearish:
Trigger: Fires when Parabolic SAR and MACD align bearishly.
Usage: Ideal for adding to short positions.
⚠️ Chapter 7: Conclusion & Risk Disclosure
Methodological Synthesis
Impulse Reactor represents a shift from reactive price tracking to proactive energy analysis. By decomposing market activity into its atomic components — Volatility, Momentum, and Structure — and reconstructing them into a coherent decision model, the system aims to provide a quantitative framework for market engagement. It is designed not to predict the future, but to identify high-probability conditions where kinetic energy and trend structure align.
Disclaimer & Risk Warnings
◦ Educational Purpose Only
This indicator, including all associated code, documentation, and visual outputs, is provided strictly for educational and informational purposes. It does not constitute financial advice, investment recommendations, or a solicitation to buy or sell any financial instruments.
◦ No Guarantee of Performance
Past performance is not indicative of future results. All metrics displayed on the dashboard (including "Win Rate" and "P&L") are theoretical calculations based on historical data. These figures do not account for real-world trading factors such as slippage, liquidity gaps, spread costs, or broker commissions.
◦ High-Risk Warning
Trading cryptocurrencies, futures, and leveraged financial products involves a substantial risk of loss. The use of leverage can amplify both gains and losses. Users acknowledge that they are solely responsible for their trading decisions and should conduct independent due diligence before executing any trades.
◦ Software Limitations
The software is provided "as is" without warranty. Users should be aware that market data feeds on analysis platforms may experience latency or outages, which can affect signal generation accuracy.

Smart Donchian Channel Hariss 3691. The Donchian Channel is a trend-following indicator. It’s primarily used to identify volatility, breakouts, and price trends.
The channel is composed of three lines:
Upper Band: The highest high over a specified period (e.g., 20 bars).
Lower Band: The lowest low over the same period.
Middle Line (optional): The average of the upper and lower bands.
2. How the Donchian Channel Detects Price Momentum
The Donchian Channel is based on price extremes, which inherently reflects momentum and market sentiments.
Price Above Midline / Upper Band: Indicates strong bullish momentum. Buyers are dominating, pushing price toward new highs.
Price Below Midline / Lower Band: Indicates strong bearish momentum. Sellers are in control, pushing price toward new lows.
Price Touching the Bands:
Upper band breakout: A potential continuation of an uptrend or trend initiation.
Lower band breakout: A potential continuation of a downtrend or trend initiation.
Bounce from the bands: Signals potential reversals or retracements.
Essentially, the Donchian Channel acts as a dynamic support and resistance level.
3. Interpreting Market Conditions
Trending Markets:
Price moves along or breaks out from the upper/lower band. Donchian Channel expands as volatility increases. Breakouts from the channel often indicate continuation of the trend.
Sideways/Range-Bound Markets:
Price oscillates between upper and lower bands. Channel width narrows. Bounces from upper/lower bands may produce false signals unless filtered by volume or trend indicators.
4. Trading Applications
Breakout Strategy:
Buy when price closes above the upper band.
Sell when price closes below the lower band.
Useful for trend-following systems.
Reversal/Bounce Strategy:
Buy when price bounces from the lower band.
Sell when price rejects the upper band.
How this indicator has been designed to reduce false signals:
Buy signal fires when price bounces from the lower band with high volume (1.5), bullish RSI and DMI/ADX.
Sell signal fires when price reverses from upper band with high volume (1.5) with bearish RSI and DMI/ADX.
One can change the RSI and RVOL setting according to trading style and class assets being traded.
Trading With this Indicator:
Buy when the signal is fired to buy, place Stop Loss just below the low of last candle and take profit @1.5 or 2 times of stop loss.
Sell when the signal is fired to sell, place stop loss just above the high of the last candle and take profit @1.5 or 2 times of stop loss.
It is to note that, this indicator is a trend following indicator, so be with the trend will avoid missing out trend following levels or early exit.

Channels Strategy [JoseMetal]============
ENGLISH
============
- Description:
This strategy is based on Bollinger Bands / Keltner Channel price "rebounds" (the idea of price bouncing from one band to another).
The strategy has several customizable options, which allows you to refine the strategy for your asset and timeframe.
You can customize settings for ALL indicators, Bollinger Bands (period and standard deviation), Keltner Channel (period and ATR multiplier) and ATR (period).
- AVAILABLE INDICATORS:
You can pick Bollinger Bands or Keltner Channels for the strategy, the chosen indicator will be plotted as well.
- CUSTOM CONDITIONS TO ENTER A POSITION:
1. Price breaks the band (low below lower band for LONG or high above higher band for SHORT).
2. Same as 1 but THEN (next candle) price closes INSIDE the bands.
3. Price breaks the band AND CLOSES OUT of the band (lower band for LONG and higher band for SHORT).
4. Same as 3 but THEN (next candle) price closes INSIDE the bands.
- STOP LOSS OPTIONS:
1. Previous wick (low of previous candle if LONG and high or previous candle if SHORT).
2. Extended band, you can customize settings for a second indicator with larger values to use it as STOP LOSS, for example, Bollinger Bands with 2 standard deviations to open positions and 3 for STOP LOSS.
3. ATR: you can pick average true ratio from a source (like closing price) with a multiplier to calculate STOP LOSS.
- TAKE PROFIT OPTIONS:
1. Opposite band (top band for LONGs, bottom band for SHORTs).
2. Moving average: Bollinger Bands simple moving average or Keltner Channel exponential moving average .
3. ATR: you can pick average true ratio from a source (like closing price) with a multiplier to calculate TAKE PROFIT.
- OTHER OPTIONS:
You can pick to trade only LONGs, only SHORTs, both or none (just indicator).
You can enable DYNAMIC TAKE PROFIT, which updates TAKE PROFIT on each candle, for example, if you pick "opposite band" as TAKE PROFIT, it'll update the TAKE PROFIT based on that, on every single new candle.
- Visual:
Bands shown will depend on the chosen indicator and it's settings.
ATR is only printed if used as STOP LOSS and/or TAKE PROFIT.
- Recommendations:
Recommended on DAILY timeframe , it works better with Keltner Channels rather than Bollinger Bands .
- Customization:
As you can see, almost everything is customizable, for colors and plotting styles check the "Style" tab.
Enjoy!
============
ESPAÑOL
============
- Descripción:
Esta estrategia se basa en los "rebotes" de precios en las Bandas de Bollinger / Canal de Keltner (la idea de que el precio rebote de una banda a otra).
La estrategia tiene varias opciones personalizables, lo que le permite refinar la estrategia para su activo y temporalidad favoritas.
Puedes personalizar la configuración de TODOS los indicadores, Bandas de Bollinger (periodo y desviación estándar), Canal de Keltner (periodo y multiplicador ATR) y ATR (periodo).
- INDICADORES DISPONIBLES:
Puedes elegir las Bandas de Bollinger o los Canales de Keltner para la estrategia, el indicador elegido será mostrado en pantalla.
- CONDICIONES PERSONALIZADAS PARA ENTRAR EN UNA POSICIÓN:
1. El precio rompe la banda (mínimo por debajo de la banda inferior para LONG o máximo por encima de la banda superior para SHORT).
2. Lo mismo que en el punto 1 pero ADEMÁS (en la siguiente vela) el precio cierra DENTRO de las bandas.
3. El precio rompe la banda Y CIERRA FUERA de la banda (banda inferior para LONG y banda superior para SHORT).
4. Igual que el 3 pero ADEMÁS (siguiente vela) el precio cierra DENTRO de las bandas.
- OPCIONES DE STOP LOSS:
1. Mecha anterior (mínimo de la vela anterior si es LONGy máximo de la vela anterior si es SHORT).
2. Banda extendida, puedes personalizar la configuración de un segundo indicador con valores más extensos para utilizarlo como STOP LOSS, por ejemplo, Bandas de Bollinger con 2 desviaciones estándar para abrir posiciones y 3 para STOP LOSS.
3. ATR: puedes elegir el average true ratio de una fuente (como el precio de cierre) con un multiplicador para calcular el STOP LOSS.
- OPCIONES DE TAKE PROFIT:
1. Banda opuesta (banda superior para LONGs, banda inferior para SHORTs).
2. Media móvil: media móvil simple de las Bandas de Bollinger o media móvil exponencial del Canal de Keltner .
3. ATR: se puede escoger el average true ratio de una fuente (como el precio de cierre) con un multiplicador para calcular el TAKE PROFIT.
- OTRAS OPCIONES:
Puedes elegir operar sólo con LONGs, sólo con SHORTs, ambos o ninguno (sólo el indicador).
Puedes activar el TAKE PROFIT DINÁMICO, que actualiza el TAKE PROFIT en cada vela, por ejemplo, si eliges "banda opuesta" como TAKE PROFIT, actualizará el TAKE PROFIT basado en eso, en cada nueva vela.
- Visual:
Las bandas mostradas dependerán del indicador elegido y de su configuración.
El ATR sólo se muestra si se utiliza como STOP LOSS y/o TAKE PROFIT.
- Recomendaciones:
Recomendada para temporalidad de DIARIO, funciona mejor con los Canales de Keltner que con las Bandas de Bollinger .
- Personalización:
Como puedes ver, casi todo es personalizable, para los colores y estilos de dibujo comprueba la pestaña "Estilo".
¡Que lo disfrutes!

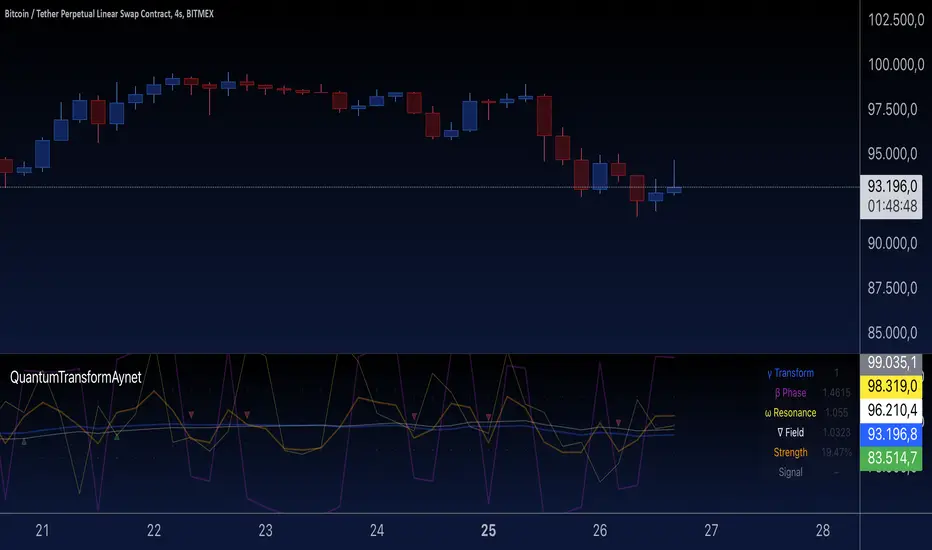
Quantum Transform - AynetQuantum Transform Trading Indicator: Explanation
This script is called a "Quantum Transform Trading Indicator" and aims to enhance market analysis by applying complex mathematical models. Written in Pine Script, the indicator includes the following elements:
1. General Structure
Quantum Parameters: Inspired by physical and mathematical concepts (Planck constant ℏ, wave function Ψ, time τ, etc.), it uses specific parameters.
Transformation Functions: Applies various mathematical operations to transform price data in different ways.
Signal Generation: Produces signals for long and short positions.
Visualization: Displays different price transformations and signals on the chart.
2. Core Parameters
The parameters allow users to control various transformations:
Planck Constant (ℏ): A scaling factor for wave modulation.
Wave (Ψ): Controls oscillation in price data.
Time (τ): The length of the lookback period for calculations.
Relativity (γ): Power factor in the Lorentz transformation.
Phase Shift (β): Manages phase shift in transformations.
Frequency (ω): Represents the frequency of price movements.
Dimensions (∇): Enables multi-dimensional field analysis.
3. Functions
a) Relativistic Transform
Inspired by the theory of relativity.
Calculates the Lorentz factor using the rate of price change.
Transforms price data to amplify the relativity effect.
b) Phase Transform
Calculates the phase of price data and applies wave modulation.
Creates phase and amplitude modulation based on the bar index.
c) Resonance Transform
Calculates resonance effects using natural frequency and oscillations.
Highlights periodic behaviors of price movements.
d) Field Transform
Applies multi-dimensional field calculations.
Combines strength, wave, and coherence aspects of price data.
e) Chaos Transform
Implements a chaos effect based on sensitivity analysis.
Simulates chaotic behaviors of price movements.
4. Main Calculations
Quantum Price: The average of all transformation functions.
Bands:
Upper Band: The highest level of quantum price.
Lower Band: The lowest level of quantum price.
Mid Band: The average of upper and lower bands.
Momentum: Calculates the rate of change in quantum price.
5. Signal Generation
Long Signal:
Triggered when the phase price crosses above the field price.
Momentum must be positive, and the price above the mid-band.
Short Signal:
Triggered when the phase price crosses below the field price.
Momentum must be negative, and the price below the mid-band.
Signal strength is calculated relative to the momentum moving average.
6. Visualization
Each transformation is displayed in a unique color.
Bands and Momentum: Visualize price behavior.
Signal Icons: Show buy/sell signals using up/down arrows on the chart.
7. Information Panel
A table in the top-right corner of the chart displays:
The current values of each transformation.
Signal strength (as a percentage).
The type of signal (⬆: Long, ⬇: Short).
Applications
Trend Following: Analyze trends with complex transformations.
Resonance and Chaos Analysis: Understand dynamic behaviors of price.
Signal Strategies: Create strong and reliable buy/sell signals.
If you have any additional questions or customization requests regarding this indicator, feel free to ask!
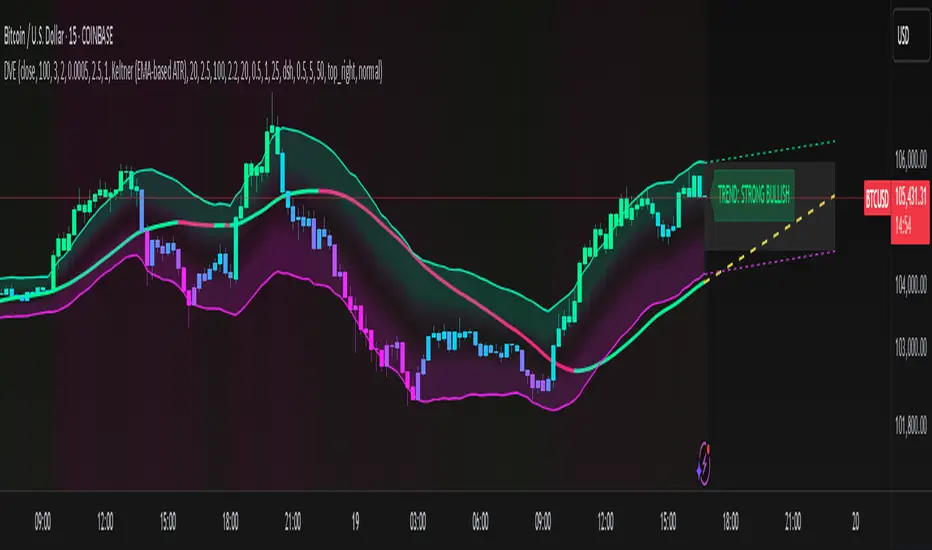
Dynamic Volatility EnvelopeDynamic Volatility Envelope: Indicator Overview
The Dynamic Volatility Envelope is an advanced, multi-faceted technical indicator designed to provide a comprehensive view of market trends, volatility, and potential future price movements. It centers around a customizable linear regression line, enveloped by dynamically adjusting volatility bands. The indicator offers rich visual feedback through gradient coloring, candle heatmaps, a background volatility pulse, and an on-chart trend strength meter.
Core Calculation Mechanism
Linear Regression Core :
-A central linear regression line is calculated based on a user-defined source (e.g., close, hl2) and lookback period.
-The regression line can be optionally smoothed using an Exponential Moving Average (EMA) to reduce noise.
-The slope of this regression line is continuously calculated to determine the current trend direction and strength.
Volatility Channel :
-Dynamic bands are plotted above and below a central basis line. This basis is typically the calculated regression line but shifts to an EMA in Keltner mode.
-The width of these bands is determined by market volatility, using one of three user-selectable modes:
ATR Mode : Bandwidth is a multiple of the Average True Range (ATR).
Standard Deviation Mode : Bandwidth is a multiple of the Standard Deviation of the source data.
Keltner Mode (EMA-based ATR) : ATR-based bands are plotted around a central Keltner EMA line, offering a smoother channel.
The channel helps identify dynamic support and resistance levels and assess market volatility.
Future Projection :
The indicator can project the current regression line and its associated volatility bands into the future for a user-defined number of bars. This provides a visual guide for potential future price pathways based on current trend and volatility characteristics.
Candle Heatmap Coloring :
-Candle bodies and/or wicks/borders can be colored based on the price's position within the upper and lower volatility bands.
-Colors transition in a gradient from bearish (when price is near the lower band) through neutral (mid-channel) to bullish (when price is near the upper band), providing an intuitive visual cue of price action relative to the dynamic envelope.
Background Volatility Pulse :
The chart background color can be set to dynamically shift based on a ratio of short-term to long-term ATR. This creates a "pulse" effect, where the background subtly changes color to indicate rising or falling market volatility.
Trend Strength Meter :
An on-chart text label displays the current trend status (e.g., "Strong Bullish", "Neutral", "Bearish") based on the calculated slope of the regression line relative to user-defined thresholds for normal and strong trends.
Key Features & Components
-Dynamic Linear Regression Line: Core trend indicator with optional smoothing and slope-based gradient coloring.
-Multi-Mode Volatility Channel: Choose between ATR, Standard Deviation, or Keltner (EMA-based ATR) calculations for band width.
-Customizable Vertical Gradient Channel Fills: Visually distinct fills for upper and lower channel segments with user-defined top/bottom colors and gradient spread.
-Future Projection: Extrapolates regression line and volatility bands to forecast potential price paths.
-Price-Action Based Candle Heatmap: Intuitive candle coloring based on position within the volatility channel, with adjustable gradient midpoint.
-Volatility-Reactive Background Gradient: Subtle background color shifts to reflect changes in market volatility.
-On-Chart Trend Strength Meter: Clear textual display of current trend direction and strength.
-Extensive Visual Customization: Fine-tune colors, line styles, widths, and gradient aggressiveness for most visual elements.
-Comprehensive Tooltips: Detailed explanations for every input setting, ensuring ease of use and understanding.
Visual Elements Explained
Regression Line : The primary trend line. Its color dynamically changes (e.g., green for uptrend, red-pink for downtrend, neutral for flat) based on its slope, with smooth gradient transitions.
Volatility Channel :
Upper & Lower Bands : These lines form the outer boundaries of the envelope, acting as dynamic support and resistance levels.
Channel Fill : The area between the band center and the outer bands is filled with a vertical gradient. For example, the upper band fill might transition from a darker green near the center to a lighter green at the upper band.
Band Borders : The lines outlining the upper and lower bands, with customizable color and width.
Future Projection Lines & Fill :
Projected Regression Line : An extension of the current regression line into the future, typically styled differently (e.g., dashed).
Projected Channel Bands : Extensions of the upper and lower volatility bands.
Projected Area Fill : A semi-transparent fill between the projected upper and lower bands.
Candle Heatmap Coloring : When enabled, candles are colored based on their closing price's relative position within the channel. Bullish colors appear when price is in the upper part of the channel, bearish in the lower, and neutral in the middle. Users can choose to color the entire candle body or just the wicks and borders.
Background Volatility Pulse : The chart's background color subtly shifts (e.g., between a calm green and an agitated red-pink) to reflect the current volatility regime.
Trend Strength Meter : A text label (e.g., "TREND: STRONG BULLISH") positioned on the chart, providing an at-a-glance summary of the trend.
Configuration Options
Users can tailor the indicator extensively via the settings panel, with options logically grouped:
Core Analysis Engine : Adjust regression source data, lookback period, and EMA smoothing for the regression line.
Regression Line Visuals : Control visibility, line width, trend-based colors (uptrend, downtrend, flat), slope thresholds for trend definition, strong slope multiplier (for Trend Meter), and color gradient sharpness.
Volatility Channel Configuration : Select band calculation mode (ATR, StdDev, Keltner), set relevant periods and multipliers. Customize colors for vertical gradient fills (upper/lower, top/bottom), border line colors, widths, and the gradient spread factor for fills.
Future Projection Configuration : Toggle visibility, set projection length (number of bars), line style, and colors for projected regression and band areas.
Appearance & Candle Theme : Set default bull/bear candle colors, enable/disable candle heatmap, choose if body color matches heatmap, and configure heatmap gradient target colors (bull, neutral, bear) and the gradient's midpoint.
Background Volatility Pulse : Enable/disable the background effect and configure short/long ATR periods for the volatility calculation.
Trend Strength Meter : Enable/disable the meter, and choose its on-chart position and text size.
Interpretation Notes
-The Regression Line is the primary indicator of trend direction. Its slope and color provide immediate insight.
-The Volatility Bands serve as dynamic support and resistance zones. Price approaching or touching these bands may indicate potential turning points or breakouts. The width of the channel itself reflects market volatility – widening suggests increasing volatility, while narrowing suggests consolidation.
Future Projections are not predictions but rather an extension of current conditions. They can help visualize potential areas where price might interact with projected support/resistance if the current trend and volatility persist.
Candle Heatmap Coloring offers a quick visual assessment of where price is trading within the dynamic envelope, highlighting strength or weakness relative to the channel.
The Background Volatility Pulse gives a contextual feel for overall market agitation or calmness.
This indicator is designed to be a comprehensive analytical tool. Its signals and visualizations are best used in conjunction with other technical analysis techniques, price action study, and robust risk management practices. It is not intended as a standalone trading system.
Risk Disclaimer
Trading and investing in financial markets involve substantial risk of loss and is not suitable for every investor. The Dynamic Volatility Envelope indicator is provided for analytical and educational purposes only and does not constitute financial advice or a recommendation to buy or sell any security. Past performance is not indicative of future results. Always use sound risk management practices and never trade with capital you cannot afford to lose. The developers assume no liability for any financial losses incurred based on the use of this indicator.
WaveTrend Dynamic (Lazy Bear Style)█ OVERVIEW
The WaveTrend Dynamic indicator (in the style of Lazy Bear) is an advanced tool based on the Exponential Smoothing Average (ESA), which adapts to the volatility and price of a financial instrument. It is more flexible than the classic WaveTrend but shares a similar concept of bands around a main oscillator line.
The indicator uses dynamic bands calculated as distances from the ESA, with their width adjustable via the "level" parameter. This allows it to be tailored to various markets, timeframes, and volatility conditions, making it easier to identify trends, reversal points, and buy/sell signals.
█ CONCEPTS
The WaveTrend Dynamic combines oscillator functions with trend analysis. Below, we explain the key components in a simple way, understandable even for beginner users.
Core Calculations
The indicator relies on the adaptive ESA and a few straightforward steps:
1 — ESA (Adaptive Average): Calculated as a smoothed average of the price (from high, low, and close, or HLC3) using the ESA Length parameter (default: 10). This number determines how many past candles are considered in the calculation. The ESA quickly responds to price changes, helping to track trends.
2 — Deviation (D): Measures how much the price deviates from the ESA, factoring in market volatility. This allows the indicator to adapt to different instruments.
3 — Price Distance Indicator (CI): Shows how far the price is from the ESA relative to market volatility. This forms the basis for the main indicator line, reacting to price movements.
4 — WT1 (WaveTrend 1): The main line, smoothing the Price Distance Indicator (CI) with the Average Length parameter (default: 21). It reflects the direction of price movement and momentum.
5 — WT2 (WaveTrend 2): A signal line that further smooths WT1 (with a period of 4). It helps confirm signals through crossovers with WT1.
6 — Bands (UpperBand and LowerBand): These form a dynamic channel around the ESA. Their width depends on the level parameter (default: 100). Wider bands result in fewer but more reliable signals. In the original WaveTrend, the oscillator bands use lower values, such as 50 or 60. To achieve classic oscillator signals (more frequent WT1/WT2 crossovers outside the bands), set the level to 50–60.
Trend Identification
The indicator identifies two types of trends:
• Major Trend: Determined by the position of WT1 relative to the ESA. When WT1 is above the ESA, it indicates a bullish trend. When below, it signals a bearish trend. Line and fill colors reflect this trend.
• Mini-Trend: Based on WT1 and WT2 crossovers. When the lines cross, they change to the same color, signaling short-term changes or reversal points. This is ideal for quick trading decisions.
Visuals and Effects
• WT1 and WT2 Lines: Scaled to price and displayed on the price chart for easier analysis.
• Fills: Between the bands (UpperBand/LowerBand) and between WT1/WT2, with a "wave" effect that adjusts transparency based on the trend (green for bullish, red for bearish).
• Signals: Three types—return-to-band, WT1/WT2 crossovers outside the bands, and crossovers inside the bands. Signals are displayed as triangles with different colors for buy and sell.
█ FEATURES
Detailed features of the indicator, aligned with the order of settings in the script:
• Basic Parameters: ESA Length — controls ESA smoothing; Average Length — affects WT1 responsiveness; level (WT Level) — adjusts band width for signal filtering.
• Display Elements: Options to show/hide ESA, bands, WT1/WT2; customizable colors for lines, fills, and the wave effect.
• Signals: Three signal groups (return-to-band, crossovers outside bands, crossovers inside bands) with display and color customization options.
█ HOW TO USE
1 — Add the indicator to your TradingView chart and adjust parameters: — Increase ESA Length and Average Length for low-volatility markets (e.g., stocks), or decrease for cryptocurrencies or forex. — Set level to 50–60 for classic WaveTrend signals with WT1/WT2 crossovers outside bands. The default value of 100 creates wider bands and fewer signals.
2 — Analyze trends: — Major trend (WT1 vs. ESA) shows the overall market direction. — Mini-trends (WT1/WT2 crossovers) help time short-term entries.
3 — Use signals: — Return-to-band: Buy at the lower band, sell at the upper band (mean-reversion). — Crossovers outside bands: Indicate strong momentum (with a lower level, e.g., 50). — Crossovers inside bands: Signal weaker trend changes.
4 — Combine with other tools: Use with volume, RSI, or support/resistance for better decisions. Test on historical data to optimize settings.

Nadaraya-Watson Probability [Yosiet]The script calculates and displays probability bands around price movements, offering insights into potential market trends.
Setting Up the Script
Window Size: Determines the length of the window for the Nadaraya-Watson estimation. A larger window smooths the data more but might lag current market conditions.
Bandwidth: Controls the bandwidth for the kernel regression, affecting the smoothness of the probability bands.
Reading the Data Table
The script dynamically updates a table positioned at the bottom right of your chart, providing real-time insights into market probabilities. Here's how to interpret the table:
Table Columns: The table is organized into three columns:
Up: Indicates the probability or relative change percentage for the upper band.
Down: Indicates the probability or relative change percentage for the lower band.
Table Rows: There are two main rows of interest:
P%: Shows the price change percentage difference between the bands and the closing price. A positive value in the "Up" column suggests the upper band is above the current close, indicating potential upward momentum. Conversely, a negative value in the "Down" column suggests downward momentum.
R%: Displays the relative inner change percentage difference between the bands, offering a measure of the market's volatility or stability within the bands.
Utilizing the Insights
Market Trends: A widening gap between the "Up" and "Down" percentages in the "P%" row might indicate increasing market volatility. Traders can use this information to adjust their risk management strategies accordingly.
Entry and Exit Points: The "R%" row provides insights into the relative position of the current price within the probability bands. Traders might consider positions closer to the lower band as potential entry points and positions near the upper band as exit points or take-profit levels.
Conclusion
The Nadaraya-Watson Probability script offers a sophisticated tool for traders looking to incorporate statistical analysis into their trading strategy. By understanding and utilizing the data presented in the script's table, traders can gain insights into market trends and volatility, aiding in decision-making processes. Remember, no indicator is foolproof; always consider multiple data sources and analyses when making trading decisions.
